

Abstract
Most presynaptic terminals in the brain contain G-protein-coupled receptors that function to reduce action potential-evoked neurotransmitter release. These neuromodulatory receptors, including those for glutamate, GABA, endocannabinoids, and adenosine, exert a substantial portion of their effect by reducing evoked presynaptic Ca2+ transients. Many axons form synapses with multiple postsynaptic neurons, but it is unclear whether presynaptic attenuation in these synapses is homogeneous, as suggested by population-level Ca2+ imaging. We loaded Ca2+-sensitive dyes into cerebellar parallel fiber axons and imaged action potential-evoked Ca2+ transients in individual presynaptic boutons with application of three different neuromodulators and found that adjacent boutons on the same axon showed striking heterogeneity in their strength of attenuation. Moreover, attenuation was predicted by bouton size or basal Ca2+ response: smaller boutons were more sensitive to adenosine A1 agonist but less sensitive to CB1 agonist, while boutons with high basal action potential-evoked Ca2+ transient amplitude were more sensitive to mGluR4 agonist. These results suggest that boutons within brief segment of a single parallel fiber axon can have different sensitivities toward neuromodulators and may have different capacities for both short-term and long-term plasticities.
Introduction
Presynaptic neuromodulatory receptors are important regulators of the release of fast neurotransmitters such as glutamate and GABA from axon terminals and en passant synapses. These G-protein-coupled receptors inhibit the release of glutamate primarily through attenuation of presynaptic Ca2+ influx (Brown and Sihra, 2008), thereby fine tuning synaptic transmission. While Ca2+ imaging studies have shown that neuromodulators decrease Ca2+ influx into glutamatergic presynaptic terminals at the population level (Wu and Saggau, 1994, 1995; Dittman and Regehr, 1996; Daniel and Crepel, 2001; Brown et al., 2003), the effect of neuromodulators at the individual bouton level has not been extensively studied, raising the possibility that substantial heterogeneity in neuromodulator response may exist at the level of the single synapse.
Boutons on the same axon can form synapses with different postsynaptic cell types, and previous studies have indicated that much of the heterogeneity in the properties of individual presynaptic boutons is due to these different postsynaptic partners (Llano et al., 1997; Cox et al., 2000; Koester and Sakmann, 2000; Koester and Johnston, 2005; Pelkey et al., 2006; Scott and Rusakov, 2006; Brenowitz and Regehr, 2007). Neighboring boutons on an axon may exhibit different release probabilities (Koester and Sakmann, 2000; Koester and Johnston, 2005) or forms of use-dependent plasticity (Pelkey et al., 2006) if they contact different cell types, presumably because different cell targets cause different types of Ca2+ channel or exocytosis machinery to be localized to their presynaptic boutons (Craig and Boudin, 2001). However, it is not known whether presynaptic boutons on the same axon contacting the same postsynaptic cell type can show heterogeneity in their signaling properties or modulation.
The unique anatomy and physiology of the cerebellum provides an ideal preparation to address these questions. Granule cells send axons into the molecular layer, where they bifurcate to form parallel fibers (PFs), which extend for several millimeters in the transverse plane. On the PFs, presynaptic boutons are easily identifiable as bead-like swellings, 90% of which form synapses on Purkinje cells (Palay and Chan-Palay, 1974; Napper and Harvey, 1988; Pichitpornchai et al., 1994). On average, each parallel fiber contacts a given Purkinje cell one or two times and makes several hundred synapses along its length (Palay and Chan-Palay, 1974; Napper and Harvey, 1988). Previous Ca2+ imaging studies have established that action potentials are reliably propagated along PFs and cause reproducible Ca2+ transients at PF boutons (Brenowitz and Regehr, 2007). It has been shown that activation of a variety of neuromodulator receptors reduces Ca2+ influx at PF boutons, including the adenosine A1 receptor (Dittman and Regehr, 1996), mGluR4 (Daniel and Crepel, 2001; Abitbol et al., 2008), and the endocannabinoid CB1 receptor (Daniel and Crepel, 2001; Brown et al., 2003). This divergent signaling, combined with modulation by a variety of neurotransmitters, make the cerebellar PF a compelling system in which to study presynaptic neuromodulator responses at the single-bouton level.
Materials and Methods
Slice preparation.
All experiments were performed in accordance with the guidelines approved by the Animal Care and Use Committee of The Johns Hopkins University School of Medicine. Sprague Dawley rats (postnatal days 17–20) were anesthetized with isoflurane and decapitated. Transverse slices of the cerebellum (250–300 μm thick) were cut by using a vibrating tissue slicer (Leica VT1000S) in ice-cold modified artificial CSF (ACSF) containing the following (in mm): 120 choline-Cl, 2.5 KCl, 1.2 NaH2PO4, 25 NaHCO3, 1.0 CaCl2, 7.0 MgCl2, 2.4 Na pyruvate, 1.3 Na ascorbate, and 20 d-glucose. For patch-clamp experiments shown in Figure 4, slices were cut in a solution containing the following (in mm): 135 N-methyl-d-glucamine (NMDG)-Cl, 1 KCl, 1.2 KH2PO4, 0.5 CaCl2, 1.5 MgCl2, 23.2 choline-HCO3, and 20 d-glucose. Slices were recovered in a submerged chamber containing oxygenated normal ACSF at 32°C for 30 min and kept at room temperature for the rest of the day until use. Normal ACSF contained the following (in mm):124 NaCl, 2.5 KCl, 2.5 CaCl2, 1.3 MgCl2, 26.2 NaHCO3, 1 NaH2PO4, and 11 d-glucose (for patch-clamp experiments, 20 d-glucose was used). All solutions were equilibrated with 95% O2/5% CO2.
Figure 4.

PF–Purkinje cell synapses and PF–interneuron synapses show similar attenuation by presynaptic neuromodulators. A, Evoked glutamatergic EPSCs at both PF–Purkinje cell (left column) and PF–interneuron (right column) synapses are attenuated by agonists of the following receptors: adenosine A1 receptor by 5 μm 2-CA, mGluR4 by 100 μm l-AP4, and CB1 by 5 μm WIN55212-2. Cells were clamped at −65 mV and EPSCs were evoked in the presence of 10 μm SR95531, a GABAA receptor antagonist by paired-pulse stimulation with an 80 ms interpulse interval. In the control condition (red), the evoked EPSCs show paired-pulse facilitation. After application of neuromodulator receptor agonists or their corresponding carrier solutions (blue), EPSCs were attenuated by 2-CA, l-AP4, and WIN55212-2, but not by control or DMSO-containing carrier solutions. The attenuation of EPSCs was also accompanied by an increase in the paired-pulse ratio. Traces shown are the average of 15 consecutive episodes. B, C, Summary graphs showing similar attenuation of PF–Purkinje cell and PF–interneuron EPSCs in response to application of 2-CA, l-AP4, and WIN55212-2 (n = 5 cells/group). D, Summary graph showing that at the PF–Purkinje cell synapse, 2-CA, l-AP4, and WIN55212-2 significantly increase PPR, suggesting that the attenuation of synaptic strength by the agonists is achieved, at least in part, through modification of presynaptic release probability. PPRs were not calculated for PF–interneuron synapses because the agonists produced intermittent failures of synaptic transmission.
Dye loading.
Following a minimum of 30 min of recovery at room temperature, slices were transferred to a submerged recording chamber. In this chamber they were continuously perfused with normal ACSF at a flow rate of 3–4 ml · min−1, maintained at 32°C using an in-line heater (Warner Instruments). Noninvasive local perfusion with hypotonic solution was performed to load cerebellar granule cells with dextran-conjugated dyes [modified from Beierlein et al. (2004)]. The dye-loading solution contained the following: 1% dextran-conjugated Alexa Fluor 594 (10,000 MW; Invitrogen), 10% dextran-conjugated Fluo-4 (10,000 MW; Invitrogen), and 15 mm HEPES. To prepare the dye-loading solution, 50 mm HEPES stock solution (pH 6.6, adjusted with KOH) was used. No detergents were added. Similar hypotonic loading protocols have also been used in other studies (Kreitzer et al., 2000; Beierlein et al., 2004). The detailed mechanism of the hypotonic loading method is unknown, but may involve hypotonic shock-induced pinocytotic uptake of dye. The dye-loading solution was delivered by positive pressure through a glass pipette with tip diameter of 6–10 μm, placed in the cerebellar granule cell layer. To minimize nonspecific loading, a suction pipette with tip size 20–30 μm was placed close to the dye-loading region, 200–300 μm above the slice surface, to remove excess dye. After loading, slices were incubated at 32°C in flowing normal ACSF for at least 2 h, which allows the dye to diffuse and equilibrate to steady-state level (Beierlein et al., 2004). Imaging experiments were performed 2–4 h after dye loading.
Single-photon confocal imaging and data analysis.
Ca2+ imaging experiments were performed at 32°C with fast synaptic transmission blocked, to reduce network effects of neuromodulators. Normal ACSF was supplemented with synaptic blockers including 10 μm SR95531 (Ascent Scientific), a GABAA receptor antagonist, 50 μm d-APV (Ascent Scientific), an NMDA receptor antagonist, and 10 μm NBQX-Na2 (Ascent Scientific), an AMPA receptor antagonist. Imaging was performed using a Zeiss LSM 510 single-photon confocal microscope equipped with a 60×, 0.9 numerical aperture (NA) water-immersion objective (LUMPlanFI, Olympus Optical). To identify dye-loaded axons, Alexa Fluor 594 was excited using the 543 nm line of a HeNe laser, and the emitted red fluorescence was detected through a 560 nm long-pass filter. Individual boutons were identified as bead-like swellings along the parallel fibers (Palay and Chan-Palay, 1974; Pichitpornchai et al., 1994). To monitor the action potential-evoked Ca2+ transient, Fluo-4 was excited using the 488 nm line of an argon laser, and the emitted green fluorescence was detected through a 505 nm long-pass filter. Action potentials were evoked using extracellular stimulation. A glass pipette containing normal ACSF and 0.01% Texas Red dextran (Invitrogen), which allowed us to visualize the pipette position under HeNe laser scanning, was placed within 20 μm of the dye-loaded target axon and at least 50 μm away from the boutons examined for Ca2+ influx. For single stimulation, a test pulse (8–20 μA, 200 μs) was delivered every 30 s; for burst stimulation, a train of four test pulses (10–30 μA, 200 μs) at 100 Hz was delivered every 60 s, and line scans for Ca2+ imaging were performed correspondingly. Confocal images were collected with Zeiss LSM software. Ca2+ influx at individual boutons was measured using 1–2% argon laser power under line-scan mode at 526 Hz with 1.99 Airy units pinhole size (optical slice thickness <3 μm). The scan line was oriented perpendicular to the axon. When multiple boutons on the same axon were compared, line scans were performed on the same bouton repetitively and responses of different boutons were measured sequentially. For pharmacology experiments, an individual bouton's Ca2+ influx was first measured in normal ACSF supplemented with synaptic blockers to generate a baseline, and then the neuromodulator receptor agonist was washed in and the Ca2+ influx at individual boutons was measured as described above. The neuromodulator receptor agonists used include 5 μm 2-chloroadenosine (2-CA) (Ascent Scientific), an adenosine A1 receptor agonist, 100 μm l-AP4 (Ascent Scientific), a group III mGluR agonist, and 5 μm WIN55212-2 (Sigma), a CB1 receptor agonist. Control experiments were performed using the drugs' carrier solution. At the end of each experiment, axon morphology was acquired as a z-stack with 0.5 μm z-axis interval and 512 × 512 x–y frame scans at digital zoom 2 (yielding a pixel size of 0.15 μm) using 60% HeNe laser power with a 0.99 Airy unit pinhole size (optical slice thickness <1.8 μm). Ca2+ imaging line-scan data were analyzed with Zeiss LSM software. Background correction was performed by subtracting the background fluorescence of a representative neighboring region next to the bouton. Ca2+ signal amplitudes were expressed as ΔF/F = (Ft − F0)/F0. The average fluorescence intensity in the baseline period was taken as F0. The amplitude of peak Ca2+ influx and the time constant of Ca2+ decay were calculated by fitting the data to a single-exponential decay curve using Igor Pro software. The z-stack data for axon morphology were analyzed using ImageJ (NIH). The images in the z-stack were first processed using a median filter with 2 pixel radius to minimize noise and then projected on the z-axis. The bouton morphology was manually outlined on the projected image, and bouton volume was calculated from the integrated density of the z-stack projection, summing pixel densities for each optical slice. Integrated density is directly proportional to volume for a given concentration of fluorescent dye. All imaging group data are reported as mean ± SEM unless otherwise specified, and compared statistically using paired Student's t test. A significance of p < 0.05 was indicated by an asterisk, and a significance of p < 0.01 was indicated by two asterisks.
Monte Carlo simulation.
Briefly, the dataset for each agonist treatment was randomly shuffled and the t test statistic was recalculated from the randomized data using a program written in Perl (for review, see Manly, 1991). This process was replicated 10,000 times, generating a distribution of the test statistic. The number of times the randomized test statistic exceeded the actual test statistic calculated from the original dataset constitutes the p value as determined by Monte Carlo simulation. These Monte Carlo simulations compensate for deviations of the data from normality and any characteristics that are specific to each dataset, as the simulations were performed by randomly shuffling the actual dataset, and constitute an additional statistical test on the underlying data.
Whole-cell patch-clamp recording and data analysis.
Whole-cell recordings with pipettes of 2–3 MΩ (Purkinje cells) or 3–4 MΩ (interneurons) resistance were performed at 32°C. Cells were visualized with differential interference contrast optics and a 40× water-immersion lens. To monitor evoked EPSCs, we added 10 μm SR95531 to normal ACSF to block GABAA receptors. The internal saline contained the following (in mm): 138 Cs methanesulfonate, 0.2 EGTA, 5 CsCl, 10 HEPES, 2 MgCl2, 1 QX314-Br, 4 Na2-ATP, 0.4 Na3-GTP (pH 7.3, osmolarity 315). Whole-cell voltage-clamp recording was performed with an Axopatch 200B amplifier (Molecular Devices). Holding potential was −65 mV. Currents were filtered at 2 kHz, digitized at 10 kHz, and acquired using pClamp9 software (Molecular Devices). Series resistance and input resistance were monitored using a 2.5 mV hyperpolarizing voltage step of 100 ms duration in every trace and recordings were discontinued if changes in series resistance or input resistance were larger than 20%. For extracellular stimulation, a monopolar glass electrode filled with ACSF was used. For Purkinje cell experiments, the stimulating electrodes were placed in the outer molecular layer and ∼100 μm away from the dendrite of the patched Purkinje cell. For interneuron experiments, the stimulating electrodes were placed ∼80 μm away from the recorded cell in the granule cell body layer. To monitor changes in synaptic efficacy, EPSCs were evoked using paired-pulses (8–30 μA, 100 μs) with an 80 ms interval, delivered at a frequency of 0.05 Hz. The stimulation intensity was adjusted so that the EPSC amplitudes were in the range of 100–500 pA. The paired-pulse facilitation ratio was calculated as the second EPSC amplitude divided by the first EPSC amplitude. Data were analyzed off-line using pClamp9 (Molecular Devices) and Igor Pro software (WaveMetrics). All group data are reported as mean ± SEM, unless otherwise specified and compared statistically by using unpaired Student's t test. Differences were considered to be significant at p < 0.05.
Results
We imaged action potential (AP)-evoked Ca2+ transients at individual PF boutons in acute transverse cerebellar slices prepared from postnatal day 17–20 Sprague Dawley rats. The cerebellar cortex contains 3 layers: the granule cell layer, the Purkinje cell layer, and the molecular layer (Fig. 1A). Granule cells send ascending axons into the molecular layer, which bifurcate to form PFs (Fig. 1A,B). In the molecular layer, both ascending axons and PFs form synapses with Purkinje cells and interneurons, including stellate cells and basket cells. In this study, only boutons located on the PF were measured. Previous studies indicate that in the cerebellum of the rat, ∼90% of PF boutons synapse onto Purkinje cells and only ∼10% synapse onto non-Purkinje structures, mainly interneurons (Palay and Chan-Palay, 1974; Napper and Harvey, 1988; Pichitpornchai et al., 1994).
Figure 1.

Action potential-evoked Ca2+ transients measured at individual PF boutons using the sparse loading method. A, Schematic diagram of the experimental protocol. PFs were sparsely loaded with the dye solution, containing dextran-conjugated Alexa Fluor 594 and dextran-conjugated Fluo-4, by local perfusion at the granule cell layer (GCL). Action potentials were evoked using extracellular stimulation near the loaded axon, and Ca2+ transients were recorded at individual boutons. The box demarcated by the dashed line indicates the relative position of the fiber shown in B. PCL, Purkinje cell layer; ML, molecular layer. B, Maximal intensity projection confocal stack image showing a dye-loaded PF. C, Higher-magnification confocal image of the PF indicated in B (box). Individual boutons appear as bead-like varicosities along axons. D, High-magnification view of the single bouton from C (box). Ca2+ imaging was performed in line-scan mode as indicated. E, A representative Fluo-4 line-scan image of the Ca2+ transient evoked by a single stimulus (arrowhead) at the bouton in D. The corresponding Ca2+ transient trace is shown in G (top, left). F, A representative Fluo-4 line-scan image of the Ca2+ transient evoked by a burst stimulus (arrowheads) at the bouton in D. The corresponding Ca2+ transient trace is shown in G (top, right). The burst stimulus consisted of four pulses delivered at 100 Hz. G, Representative single- (left) or burst- (right) stimulation-evoked Ca2+ transients measured from the bouton in D were plotted as ΔF/F over time. Ca2+ transients from a representative single trial (top) and an average of five trials (middle) are shown in red and black, respectively, and their overlay is shown in the bottom panel.
To load fluorescent dyes into the cerebellar granule cells with minimal perturbation to their cytoplasm, we used a novel sparse-loading method. Pressure injection was used to locally perfuse a dye mixture containing 1% dextran-conjugated Alexa Fluor 594 (a morphological dye) and 10% dextran-conjugated Fluo-4 (a Ca2+ indicator) into a small region in the granule cell layer in the vermis region of transverse cerebellar slices. With this loading protocol, several granule cells in the dye-loaded region take up enough dye for their T-shaped axons to be visualized (Fig. 1A,B). Under higher magnification, presynaptic boutons can be clearly resolved as bead-like varicosities on PFs (Fig. 1C). Morphological analysis of the z-projected image of the axon fibers (summing pixel intensities) showed that these varicosities had a peak intensity at least twice that of the adjacent axonal shaft, indicating that they are significantly larger in volume (data not shown). We measured the AP-evoked Ca2+ transient at individual PF boutons by imaging the Ca2+-sensitive dye Fluo-4 in line-scan mode, with the imaging line positioned perpendicular to the orientation of the axon (Fig. 1D). APs were evoked through an extracellular stimulating electrode placed near the dye-loaded target axon and at least 50 μm away from the boutons examined. When a single suprathreshold stimulus was delivered, an AP was initiated, and this evoked a Ca2+ transient at the target bouton, which we measured as a Fluo-4 fluorescence change (Fig. 1E) and plotted as ΔF/F (Fig. 1G). When burst stimulation, consisting of four pulses at 100 Hz, was delivered [a physiologically relevant frequency and duration of stimulation (Chadderton et al., 2004; Arenz et al., 2008)], four facilitating Ca2+ spikes with correct timing were clearly resolved in the line-scan image (Fig. 1F) without signal saturation (Fig. 1G). We found that Ca2+ transients could be measured repeatedly without failures or obvious rundown, in agreement with a previous report that used a somatic patch electrode to deliver the Ca2+ indicator dye (Brenowitz and Regehr, 2007).
In the cerebellum, PFs mainly run perpendicular to the Purkinje cell dendritic plane and a single PF synapses onto the same Purkinje cell only once or twice (Palay and Chan-Palay, 1974; Ito, 1984; Napper and Harvey, 1988). Anatomical studies report that in the cerebellum of the rat, a single PF runs as long as 2–5 mm and contains hundreds of boutons (Ito, 1984). To determine whether PF boutons exhibit heterogeneity in AP-evoked Ca2+ responses, we compared Ca2+ transients in 3 nearby boutons on the same PF (Fig. 2A). These boutons should have the same degree of indicator loading and experience the same changes in membrane voltage as the AP propagates. The AP-evoked Ca2+ response was measured repeatedly at a single bouton and the average of five consecutive trials is shown. We found that PF boutons show a large variation in the peak amplitude and the decay time constant of the AP-evoked Ca2+ transient, even when they are located within a short segment of the same axon (Fig. 2B). In our experiments, the peak amplitude (ΔF/F) of a single-AP evoked Ca2+ transient at PF boutons ranged from 32.9% to 266.0% with an average of 126.2 ± 2.9% (n = 198 boutons) (Fig. 2C), and the decay time constant ranged from 18.8 to 106.2 ms with an average of 49.1 ± 1.2 ms (Fig. 2D). On average, for three boutons on the same axon, the maximum percentage difference in the peak amplitude was 59.7 ± 6.7%, and ranged from 5.4% to 353.2% (n = 66 axons) (Fig. 2E), while the maximum percentage difference in the decay time constant was 54.0 ± 4.0%, and ranged from 3.6% to 174.5% (Fig. 2F). Therefore, substantial variation was found in Ca2+ transient peaks and decay time constants under basal conditions, as was previously reported (Brenowitz and Regehr, 2007).
Figure 2.

PF boutons show heterogeneous action potential-evoked Ca2+ transients. A, Ca2+ imaging was performed sequentially on three individual boutons indicated by dotted lines in red, yellow, and blue. This confocal stack image was projected by summing pixel intensities. B, Action potential-evoked Ca2+ transients measured sequentially from 3 neighboring boutons on the same PF shown in A illustrate the variation in amplitude and decay time constant. The average traces from five trials are shown, and the Ca2+ responses were well fit by single-exponential decay curves, shown as superimposed black lines. The arrow indicates the onset of the single action potential. C, Histogram of the single action potential-evoked Ca2+ response amplitudes from 198 PF boutons. D, Histogram of the single action potential-evoked Ca2+ response decay time constant from 198 PF boutons. E, Histogram of the maximum percentage difference in single action potential-evoked Ca2+ response amplitudes comparing three boutons measured on the same axon from 66 axons. F, Histogram of the maximum percentage difference in single action potential-evoked Ca2+ response decay time constant comparing three boutons measured on the same axon from 66 axons. G, Bar graph showing average bouton areas of the biggest and smallest boutons on a single PF axon. Bouton areas were determined from the z-projection of confocal images of the dye-filled bouton obtained after calcium imaging. H, Bar graph showing the single action potential-evoked Ca2+ response amplitudes comparing the biggest bouton with the smallest bouton on the same axon, measured from 51 axons. Axons were only included if the biggest bouton was at least 60% larger in volume compared with the smallest bouton. Error bars indicate the SEM in this and all subsequent figures. I, Bar graph showing the single action potential-evoked Ca2+ response decay time constant comparing the biggest with the smallest boutons from 51 axons.
Next, we investigated whether the Ca2+ transient heterogeneity could be a result of differences in bouton volume, which may reasonably be expected to affect peak Ca2+ concentrations and Ca2+ clearance rates (through change in surface-to-volume ratio or in the function of internal Ca2+ stores). In comparing bouton volumes over a population, there are two important concerns. First, different axons are not equally loaded with morphological dye and boutons containing more dye appear slightly larger. Second, precise measurements of bouton volumes, are prone to error as these structures are near the theoretical resolution limit of visible light microscopy. To reduce these sources of error we chosen to use a conservative, nonparametric measure than relies upon comparisons within axons. We selected every axon in which the biggest bouton among the three boutons was at least 60% larger in volume than the smallest bouton (51 of 66 axons), and then compared the Ca2+ transient peak amplitude and decay time constant between the biggest bouton and the smallest bouton. Bouton volume was determined from the bouton's integrated pixel density (see Materials and Methods for details). To allow for comparison with other studies, we also determined the absolute area of the biggest and smallest boutons from a z-stack obtained at high laser intensity and spatial resolution at the end of the experiment. The biggest boutons have an average area of 1.59 ± 0.06 μm2, while the smallest boutons have an area of 0.99 ± 0.03 μm2 (Fig. 2G). Surprisingly, between the biggest and smallest boutons, there was no significant difference in either peak Ca2+ transient (biggest boutons 129.4 ± 6.5%, smallest boutons 129.7 ± 6.5%) (Fig. 2H) or decay time constant (biggest boutons 48.1 ± 2.2 ms; smallest boutons 45.8 ± 2.3 ms) (Fig. 2I). These results suggest that PF boutons may contain active mechanisms that compensate for differences in bouton volume to achieve the same peak Ca2+ concentration and Ca2+ clearance rate among boutons of different sizes (Brenowitz and Regehr, 2007).
Previous studies have shown that PF–Purkinje cell synaptic transmission is attenuated by the presynaptic actions of many neuromodulators, including adenosine, glutamate, endocannabinoids, and GABA (Kocsis et al., 1984; Batchelor and Garthwaite, 1992; Takahashi et al., 1995; Dittman and Regehr, 1996; Pekhletski et al., 1996; Dittman and Regehr, 1997; Takahashi and Linden, 2000; Neale et al., 2001). These same neuromodulators also play key roles in a variety of short-term and long-term plasticities at PF synapses (Pekhletski et al., 1996; Dittman and Regehr, 1997; Kreitzer and Regehr, 2001; Lorez et al., 2003; Safo and Regehr, 2005; Wall and Dale, 2007). Therefore, we have sought to measure the response of individual boutons to neuromodulators. We measured single-AP evoked Ca2+ transients at three neighboring boutons on the same PF and compared their response to a given neuromodulator (Fig. 3A; for representative axon images and Ca2+ traces, see supplemental Fig. 1, available at www.jneurosci.org as supplemental material). Three neuromodulators, namely adenosine, glutamate, and endocannabinoids, were examined by application of exogenous agonists. In control-vehicle (n = 39) and DMSO-containing vehicle (n = 36)-treated slices, AP-evoked Ca2+ transients showed a slight run-down, giving a bell-shaped frequency histogram with a mean of −4.9 ± 10.2% and −7.7 ± 13.1%, respectively (mean ± SD). Application of 5 μm 2-CA (n = 36), an adenosine A1 receptor agonist, 100 μm l-AP4 (n = 39), an mGluR4 agonist, and 5 μm WIN55212-2 (n = 48), a CB1 receptor agonist, all reduced the AP-induced Ca2+ transient, strongly shifting the population frequency histogram toward the left, indicating a decrease in ΔF/F (Fig. 3A, left). 2-CA, l-AP4, and WIN55212-2 reduced peak ΔF/F by −33.0 ± 14.5%, −25.6 ± 17.6%, and −32.3 ± 16.9%, respectively (mean ± SD). In addition, application of the agonists caused more variability in responses, as reflected in broadening of the frequency histogram. This suggests that, in addition to the baseline variation in evoked Ca2+ transient, there is also variation arising from the differential response of boutons to the neuromodulator agonists. When the neuromodulator-evoked change in peak Ca2+ transient is displayed in an axon-by-axon manner (Fig. 3A, right), it may be seen that the variation in neuromodulator responses across the population of boutons is not just axon-to-axon variation, but also represents considerable bouton-to-bouton variation within the same small segment of a single PF axon. Application of agonists affected only AP-induced Ca2+ transients, and did not affect basal Ca2+ concentrations (supplemental Fig. 2, available at www.jneurosci.org as supplemental material).
Figure 3.
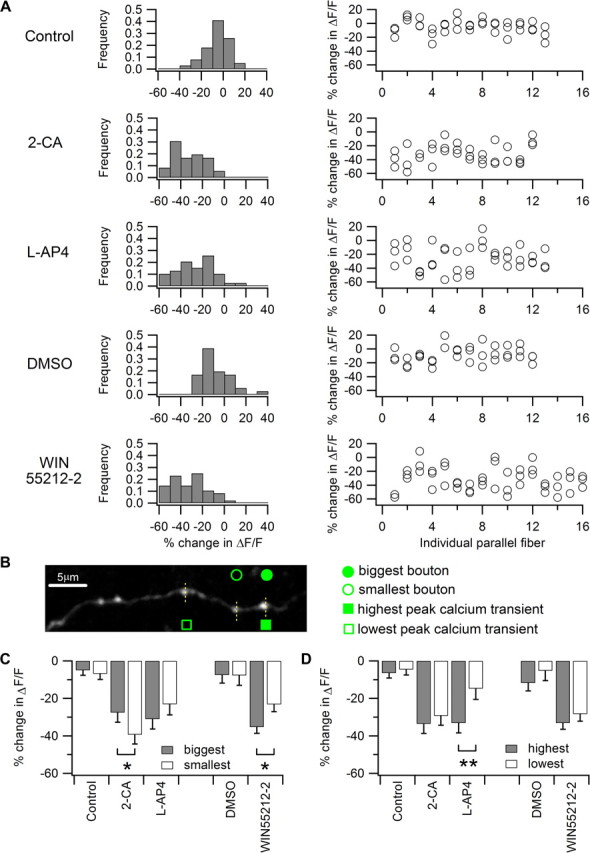
Neuromodulators' effects on AP-evoked Ca2+ transients at individual PF boutons are heterogeneous and correlated with bouton basal functionalstatus and morphology. A, AP-evoked Ca2+ responses at PF boutons were heterogeneously attenuated by neuromodulators. Three neuromodulator receptors were examined by application of exogenous agonists including 5 μm 2-CA, an adenosine A1 receptor agonist, 100 μm l-AP4, a mGluR4 agonist, and 5 μm WIN55212-2, a CB1 receptor agonist. The amplitudes of the AP-evoked Ca2+ transients in individual boutons were determined first in the absence and then in the presence of neuromodulator receptor agonists. The difference in Ca2+ transients was calculated as percentage change in ΔF/F compared to the control condition. Frequency histograms of the percentage change in ΔF/F of PF boutons from different experimental groups (control, n = 39; 2-CA, n = 36; l-AP4, n = 39; vehicle, n = 36; and WIN55212-2, n = 48) were plotted in the left panel. The same data, replotted to show boutons from individual PFs are shown in the right panel. B, A representative z-projection image of a PF used to examine neuromodulators' effects on AP-evoked Ca2+ transients is shown. Ca2+ imaging was performed in line-scan mode on the three boutons indicated by the dotted lines. The bouton with biggest volume among the three on the same fiber is indicated by the filled circle and the smallest is indicated by the open circle. The bouton with highest peak AP-evoked Ca2+ transient in the absence of the agonist is indicated by the filled square and the lowest is indicated by the open square. C, Summary graph showing that big boutons are more sensitive to WIN55212-2 (n = 10) and less sensitive to 2-CA (n = 10) compared to small boutons. However, big and small boutons exhibit no difference in Ca2+ transient attenuation in the l-AP4 (n = 9) and vehicle control groups (control, n = 12; DMSO-containing vehicle, n = 10). *p < 0.05. D, Summary graph showing that boutons with the highest basal Ca2+ transient are significantly more sensitive to l-AP4 (n = 12) than those with the lowest basal Ca2+ transient. This difference was not found in 2-CA (n = 10), WIN55212-2 (n = 16), and vehicle groups (control; n = 13; DMSO-containing vehicle, n = 11). **p < 0.01.
To determine whether bouton-to-bouton variation is correlated with bouton volume or basal evoked Ca2+ transient, we again adopted a nonparametric within-fiber comparison strategy to reduce error from fiber-to-fiber variation in dye loading or intrinsic excitability. We compared the responses of the biggest and smallest boutons as well as boutons with the highest and lowest preagonist baseline Ca2+ transient within the same axon segment. Comparing boutons within a short segment of a single axon minimizes cross-fiber variation due to differences in dye loading or AP waveform, and better reveals intrinsic heterogeneity in bouton properties. Before agonist application, bouton size and peak Ca2+ transient amplitude were not correlated (for an exemplar image, see Fig. 3B), confirming our previous measurements (Fig. 2H). When comparing the effect of bouton size, the biggest and smallest boutons from three imaged boutons on the same axon were analyzed in a subpopulation of axons where the biggest bouton was at least 60% larger in volume than the smallest bouton (51 of 66 axons). Interestingly, we found that the smallest boutons were significantly more sensitive to 2-CA: the adenosine A1 receptor agonist caused an average peak Ca2+ transient reduction of −39.3 ± 5.0% in the smallest boutons versus −27.6 ± 5.1% in the biggest boutons (n = 10; p < 0.05). Conversely, the biggest boutons were more sensitive to WIN55212-2: the CB1 receptor agonist caused an average reduction of −35.3 ± 3.3% in the biggest boutons and −23.2 ± 3.8% in the smallest boutons (n = 10; p < 0.05) (Fig. 3C). Both big and small boutons were equally sensitive to the mGluR4 agonist l-AP4 (biggest boutons, −31.1 ± 5.3%; smallest boutons, −23.1 ± 5.7%; n = 9; p > 0.05). Monte Carlo simulations of the 2-CA and WIN55212-2 data confirmed the respective results (10,000 randomizations of the datasets, p < 0.05 for both 2-CA and WIN55212-2; see Materials and Methods). To ensure that equivalent boutons were being compared, we measured the sizes of the boutons in each experimental group, and found that the biggest and smallest boutons in the various experimental groups comparable (supplemental Fig. 3, available at www.jneurosci.org as supplemental material). To examine the possibility that the biggest and smallest boutons bleach at different rates, we measured the basal Ca2+ indicator fluorescence of the boutons before the onset of the AP-evoked Ca2+ transient at the beginning and at the end of the experimental run, and found that bleaching of basal Ca2+ fluorescence was minimal and comparable in both the biggest and smallest boutons and across the various agonist treatment groups (supplemental Fig. 4, available at www.jneurosci.org as supplemental material).
To compare the neuromodulators' effects based on the boutons' basal AP-evoked Ca2+ responses, we analyzed a subpopulation of axons. The criterion for inclusion was that the bouton with highest Ca2+ transient and the one with lowest Ca2+ transient from the three imaged boutons on the same axon must differ by >10% in the peak of the Ca2+ transient (62 of 66 axons satisfied this criterion). We found that l-AP4 more strongly decreased Ca2+ transients in the highest peak transient boutons (−33.1 ± 4.5%) compared to the lowest peak transient boutons (−14.8 ± 5.0%, n = 12, p < 0.01), while 2-CA (highest transient −33.6 ± 6.3%; lowest transient −29.2 ± 3.4%; n = 10; p > 0.05) and WIN55212-2 (highest transient −33.1 ± 4.8%; lowest transient −28.3 ± 3.3%; n = 16; p > 0.05) affected both high and low transient boutons equally (Fig. 3D). A Monte Carlo simulation with the l-AP4 data showed a similar result (10,000 randomizations of dataset, p < 0.01; see Materials and Methods). Thus, our data indicate that PF boutons exhibit heterogeneity in their responses to neuromodulators depending upon their volume and basal AP-evoked Ca2+ responses.
Previous studies in other brain regions have shown that, in axons that innervate multiple postsynaptic cell types, a bouton's morphology and function may depend upon its postsynaptic target cell (Acsády et al., 1998; Koester and Johnston, 2005; Pelkey et al., 2006). In the cerebellum, PF boutons synapse onto Purkinje cells and interneurons (Palay and Chan-Palay, 1974), and previous studies have showed that neurotransmitter release at these two types of PF synapses are differentially regulated by the activation of presynaptic kainate receptors (Delaney and Jahr, 2002). The highly skewed ratio of PF–Purkinje cell (∼90%) to PF–interneuron (∼10%) synapses makes it highly unlikely that the heterogeneity in neuromodulator response among individual boutons seen in Figure 3 is due to different postsynaptic targets. Nonetheless, to address this formal possibility we tested the hypothesis that PF boutons forming synapses on Purkinje cells and interneurons may differ in their responses to the neuromodulators that we have studied. To this end, we performed whole-cell patch-clamp recordings on Purkinje cells and interneurons in transverse cerebellar slices, holding them at −65 mV and evoking EPSCs using paired pulses with an 80 ms interval. In the same pharmacological group, Purkinje cell and interneuron experiments were interleaved. After a stable baseline was obtained, neuromodulator agonists were washed into the slices. Both Purkinje cells and interneurons showed facilitation in response to paired stimulation, confirming that PFs were indeed being stimulated (Fig. 4A). In response to the neuromodulator agonists, EPSCs at both PF–Purkinje cell and PF–interneuron synapses were strongly and comparably reduced (5 μm 2-CA: Purkinje cells, −81.9 ± 1.5%, interneurons −87.4 ± 5.9%; 100 μm l-AP4: Purkinje cells, −74.3 ± 2.8%, interneurons −70.7 ± 7.6%; 5 μm WIN55212-2: Purkinje cells −89.9 ± 1.0%, interneurons −87.9 ± 2.2%; n = 5 for each group) (Fig. 4B,C). In the presence of vehicle (Purkinje cells −0.5 ± 1.7%, interneurons −0.9 ± 3.1%, n = 5 each), or DMSO-containing vehicle (Purkinje cells −0.3 ± 5.5%, interneurons −5.3 ± 6.9%, n = 5 each), EPSC amplitude was not significantly reduced. The reduction in EPSC size upon wash-in of agonist was accompanied by an increase in the paired-pulse facilitation ratio at PF–Purkinje cell synapses (Fig. 4D), consistent with the release probability of the presynaptic bouton being decreased. At PF–interneuron synapses, the paired-pulse ratio cannot be accurately measured due to the frequent neurotransmitter release failures particularly after the application of neuromodulators (data not shown; see also Soler-Llavina and Sabatini, 2006), so changes in paired-pulse ratio were not reported. We conclude that PF boutons forming synapses upon Purkinje neurons and interneurons do not differ appreciably in their response to neuromodulator agonists. This suggests that the difference in the sensitivity of PF boutons to neuromodulators we observed when measuring Ca2+ transients are unlikely to be due to boutons contacting different types of postsynaptic target cells.
Discussion
We performed Ca2+ imaging on individual PF boutons using a new sparse-loading method, and found that the AP-evoked Ca2+ responses at PF boutons are heterogeneously regulated by the adenosine A1 receptor, mGluR4, and the endocannabinoid CB1 receptor. Specifically, we found that while big and small boutons do not differ in their basal Ca2+ influx properties, small boutons are more sensitive to adenosine A1 receptor agonist while big boutons are more sensitive to endocannabinoid CB1 receptor agonist. Furthermore boutons that show high basal AP-evoked Ca2+ influx are more sensitive to an mGluR4 agonist compared to low influx boutons. This heterogeneity is not due to the boutons forming synapses on different postsynaptic cell types, as electrophysiological experiments indicate that both Purkinje cell and interneuron synapses respond similarly to these neuromodulator agonists. While our study examined presynaptic bouton function at the level of AP-evoked Ca2+ transients, it has previously been shown that glutamate release from presynaptic boutons show a steep dependence on Ca2+ concentration estimated to be a third- to fourth-power relation (Mintz et al., 1995), suggesting that modest differences in neuromodulator responses can produce large differences in the attenuation of synaptic transmission.
In this study, we adopted an experimentally conservative approach in determining the effect of neuromodulators on bouton Ca2+ response. We compared boutons only within a single axon to minimize error caused by dye loading variation as well as AP waveform variation from axon to axon. In addition, we chose a nonparametric approach to classify bouton size. Instead of determining absolute bouton volume, which may incur substantial error due to a portion of the boutons being at or below the spatial resolution of the confocal microscope, we determined relative size within a fiber, which is less subject to measurement error. Last, while PFs exhibit both single and burst firing patterns in vivo, we chose to examine only single AP-evoked Ca2+ transients in this study because endogenous neuromodulators released upon burst firing of PFs would complicate experimental interpretation. When comparing boutons, it would not be possible to distinguish between differential local release and differential sensitivity.
Previous studies have shown that boutons that synapse on different postsynaptic cell types may show varying properties. In the neocortex, presynaptic Ca2+ transients and synaptic efficacy of layer 2/3 pyramidal cell boutons that synapse onto multipolar cells are significantly higher than those that synapse onto bitufted cells (Koester and Johnston, 2005). In the hippocampal CA3 region, mossy fibers form large boutons on pyramidal cells and small en passant boutons on interneurons (Acsády et al., 1998), but only mossy fiber–interneuron synapses can undergo an mGluR7-dependent presynaptic LTD by inhibiting voltage-gated Ca2+ channels (Pelkey et al., 2006). These studies clearly indicate that boutons on the same axon that form synapses with different target cell types may exhibit diverse properties. However, it was unclear whether boutons that synapse onto the same target cell type may also exhibit heterogeneity. The present findings indicate that boutons that synapse on the same postsynaptic cell type may also be divided into subpopulations with different functional properties based on their response to neuromodulators.
What is the mechanistic basis for the heterogeneity in neuromodulator-induced attenuation of AP-evoked Ca2+ influx? Heterogeneity in neuromodulator responses can be due to variation neuromodulator receptor levels at the single synapse level. For example, it has previously been shown that mGluR4 receptors may be unevenly distributed among boutons in PFs (Mateos et al., 1999), suggesting that variation in mGluR4 receptor spatial distribution account for observed heterogeneity. Heterogeneity in neuromodulator responses can also be due to differences in signaling components downstream of the receptor, including variation in G-protein content in boutons or nonuniform distribution of G-protein-sensitive Ca2+ or K+ channel subtypes among boutons. For example, it has been shown that multiple types of voltage-gated calcium channels mediate presynaptic neurotransmitter release at the PF–PC synapse (Mintz et al., 1995), and that different types of voltage-gated Ca2+ channels show different sensitivities to endocannabinoid modulation (Brown et al., 2004). Last, spatial variation in the endogenous tone of the neuromodulator upstream of the receptor may lead to different levels background activation of receptors at individual boutons. For example, the adenosine A1 receptor at the PF–Purkinje cell synapse is significantly activated by ambient adenosine (Dittman and Regehr, 1996), and local variation in the ambient concentration of adenosine could potentially underlie the heterogeneity of bouton response to adenosine receptor agonist. However, previous studies with neuromodulator receptor antagonists have indicated that neither mGluR4 nor CB1 receptor are tonically activated (Kreitzer and Regehr, 2001; Brown et al., 2003; Lorez et al., 2003; Abitbol et al., 2008), suggesting that such a mechanism is unlikely to be responsible for these neuromodulators.
What is the functional significance of the heterogeneity in neuromodulator response among individual boutons contacting the same postsynaptic cell type? First, differences in neuromodulator sensitivity among synapses might be a homeostatic mechanism to compensate for different levels of neuromodulators released in the vicinity of these synapses. Neuromodulators at the PF–PC synapse may be derived from a variety of sources. For example, adenosine at the PF–PC synapse may be derived from the presynaptic bouton, as well as released by the postsynaptic bouton as a by-product of ATP hydrolysis (Latini and Pedata, 2001). Diverse sources of neuromodulators suggest that heterogeneity of neuromodulator tone may exist at the individual synapse level. Second, our observation that neuromodulator sensitivity is correlated with bouton size suggests neuromodulator sensitivity may be dependent on the plasticity state of the particular bouton. Previous studies indicate that presynaptic structural plasticity can accompany synaptic plasticity and learning processes. This has been best studied in the sea slug Aplysia, where long-term sensitization of the gill withdrawal reflex increases the size and number of active zones in the presynaptic boutons (Bailey and Chen, 1983). In the mammalian hippocampus, LTP is accompanied by an increase in multiple synapse boutons (Toni et al., 1999), while LTD is accompanied by a decrease in the size and number of presynaptic boutons (Becker et al., 2008). These previous studies suggest that bouton volume may be a function of activity history and/or involvement in different learning pathways. Furthermore, many types of synaptic plasticity are dependent on neuromodulator receptors. In the cerebellum, the adenosine A1 receptor and mGluR4 are known to mediate short-term synaptic depression (Pekhletski et al., 1996; Lorez et al., 2003; Wall and Dale, 2007), while the endocannabinoid CB1 receptor is necessary for depolarization-induced depression of excitation (DSE), which lasts ∼60 s (Kreitzer and Regehr, 2001; Maejima et al., 2001). The CB1 receptor has also been implicated in two types of cerebellar long-term synaptic depression, a presynaptically expressed form (Qiu and Knopfel, 2009) and a postsynaptically expressed form (Safo and Regehr, 2005). By showing that boutons of different sizes respond differently to neuromodulators, our findings suggest that neuromodulator sensitivity may be a mechanism for metaplasticity, where boutons can have different plasticity potential based on their activity history. Last, textbooks and review articles have long portrayed a single synaptic type has having a particular set of presynaptic receptors. Our findings indicate that this formulation is too simplistic. Individual boutons of the same synaptic type on the same PF may possess dramatically different properties, and therefore may form computationally autonomous elements. The heterogeneous response of individual boutons to neuromodulators can therefore provide a powerful mechanism to substantially increase the brain's computational capacity.
Footnotes
This work was supported by National Institutes of Health Grant MH51106 and the Develbiss Foundation. We thank Hiroshi Nishiyama and members of the Linden and Worley laboratories for helpful comments and discussion and Devorah VanNess for providing technical assistance. We also thank Gek-Ming Sia for his help with Monte Carlo simulations.
References
- Abitbol K, Acher F, Daniel H. Depression of excitatory transmission at PF-PC synapse by group III metabotropic glutamate receptors is provided exclusively by mGluR4 in the rodent cerebellar cortex. J Neurochem. 2008;105:2069–2079. doi: 10.1111/j.1471-4159.2008.05290.x. [DOI] [PubMed] [Google Scholar]
- Acsády L, Kamondi A, Sík A, Freund T, Buzsáki G. GABAergic cells are the major postsynaptic targets of mossy fibers in the rat hippocampus. J Neurosci. 1998;18:3386–3403. doi: 10.1523/JNEUROSCI.18-09-03386.1998. [DOI] [PMC free article] [PubMed] [Google Scholar]
- Arenz A, Silver RA, Schaefer AT, Margrie TW. The contribution of single synapses to sensory representation in vivo. Science. 2008;321:977–980. doi: 10.1126/science.1158391. [DOI] [PMC free article] [PubMed] [Google Scholar]
- Bailey CH, Chen M. Morphological basis of long-term habituation and sensitization in Aplysia. Science. 1983;220:91–93. doi: 10.1126/science.6828885. [DOI] [PubMed] [Google Scholar]
- Batchelor AM, Garthwaite J. GABAB receptors in the parallel fibre pathway of rat cerebellum. Eur J Neurosci. 1992;4:1059–1064. doi: 10.1111/j.1460-9568.1992.tb00132.x. [DOI] [PubMed] [Google Scholar]
- Becker N, Wierenga CJ, Fonseca R, Bonhoeffer T, Nägerl UV. LTD induction causes morphological changes of presynaptic boutons and reduces their contacts with spines. Neuron. 2008;60:590–597. doi: 10.1016/j.neuron.2008.09.018. [DOI] [PubMed] [Google Scholar]
- Beierlein M, Gee KR, Martin VV, Regehr WG. Presynaptic calcium measurements at physiological temperatures using a new class of dextran-conjugated indicators. J Neurophysiol. 2004;92:591–599. doi: 10.1152/jn.00057.2004. [DOI] [PubMed] [Google Scholar]
- Brenowitz SD, Regehr WG. Reliability and heterogeneity of calcium signaling at single presynaptic boutons of cerebellar granule cells. J Neurosci. 2007;27:7888–7898. doi: 10.1523/JNEUROSCI.1064-07.2007. [DOI] [PMC free article] [PubMed] [Google Scholar]
- Brown DA, Sihra TS. Presynaptic signaling by heterotrimeric G-proteins. Handb Exp Pharmacol. 2008;184:207–260. doi: 10.1007/978-3-540-74805-2_8. [DOI] [PubMed] [Google Scholar]
- Brown SP, Brenowitz SD, Regehr WG. Brief presynaptic bursts evoke synapse-specific retrograde inhibition mediated by endogenous cannabinoids. Nat Neurosci. 2003;6:1048–1057. doi: 10.1038/nn1126. [DOI] [PubMed] [Google Scholar]
- Brown SP, Safo PK, Regehr WG. Endocannabinoids inhibit transmission at granule cell to Purkinje cell synapses by modulating three types of presynaptic calcium channels. J Neurosci. 2004;24:5623–5631. doi: 10.1523/JNEUROSCI.0918-04.2004. [DOI] [PMC free article] [PubMed] [Google Scholar]
- Chadderton P, Margrie TW, Häusser M. Integration of quanta in cerebellar granule cells during sensory processing. Nature. 2004;428:856–860. doi: 10.1038/nature02442. [DOI] [PubMed] [Google Scholar]
- Cox CL, Denk W, Tank DW, Svoboda K. Action potentials reliably invade axonal arbors of rat neocortical neurons. Proc Natl Acad Sci U S A. 2000;97:9724–9728. doi: 10.1073/pnas.170278697. [DOI] [PMC free article] [PubMed] [Google Scholar]
- Craig AM, Boudin H. Molecular heterogeneity of central synapses: afferent and target regulation. Nat Neurosci. 2001;4:569–578. doi: 10.1038/88388. [DOI] [PubMed] [Google Scholar]
- Daniel H, Crepel F. Control of Ca2+ influx by cannabinoid and metabotropic glutamate receptors in rat cerebellar cortex requires K+ channels. J Physiol. 2001;537:793–800. doi: 10.1111/j.1469-7793.2001.00793.x. [DOI] [PMC free article] [PubMed] [Google Scholar]
- Delaney AJ, Jahr CE. Kainate receptors differentially regulate release at two parallel fiber synapses. Neuron. 2002;36:475–482. doi: 10.1016/s0896-6273(02)01008-5. [DOI] [PubMed] [Google Scholar]
- Dittman JS, Regehr WG. Contributions of calcium-dependent and calcium-independent mechanisms to presynaptic inhibition at a cerebellar synapse. J Neurosci. 1996;16:1623–1633. doi: 10.1523/JNEUROSCI.16-05-01623.1996. [DOI] [PMC free article] [PubMed] [Google Scholar]
- Dittman JS, Regehr WG. Mechanism and kinetics of heterosynaptic depression at a cerebellar synapse. J Neurosci. 1997;17:9048–9059. doi: 10.1523/JNEUROSCI.17-23-09048.1997. [DOI] [PMC free article] [PubMed] [Google Scholar]
- Ito M. Cerebellum and neural control. New York: Raven; 1984. [Google Scholar]
- Kocsis JD, Eng DL, Bhisitkul RB. Adenosine selectively blocks parallel-fiber-mediated synaptic potentials in rat cerebellar cortex. Proc Natl Acad Sci U S A. 1984;81:6531–6534. doi: 10.1073/pnas.81.20.6531. [DOI] [PMC free article] [PubMed] [Google Scholar]
- Koester HJ, Johnston D. Target cell-dependent normalization of transmitter release at neocortical synapses. Science. 2005;308:863–866. doi: 10.1126/science.1100815. [DOI] [PubMed] [Google Scholar]
- Koester HJ, Sakmann B. Calcium dynamics associated with action potentials in single nerve terminals of pyramidal cells in layer 2/3 of the young rat neocortex. J Physiol. 2000;529:625–646. doi: 10.1111/j.1469-7793.2000.00625.x. [DOI] [PMC free article] [PubMed] [Google Scholar]
- Kreitzer AC, Regehr WG. Retrograde inhibition of presynaptic calcium influx by endogenous cannabinoids at excitatory synapses onto Purkinje cells. Neuron. 2001;29:717–727. doi: 10.1016/s0896-6273(01)00246-x. [DOI] [PubMed] [Google Scholar]
- Kreitzer AC, Gee KR, Archer EA, Regehr WG. Monitoring presynaptic calcium dynamics in projection fibers by in vivo loading of a novel calcium indicator. Neuron. 2000;27:25–32. doi: 10.1016/s0896-6273(00)00006-4. [DOI] [PubMed] [Google Scholar]
- Latini S, Pedata F. Adenosine in the central nervous system: release mechanisms and extracellular concentrations. J Neurochem. 2001;79:463–484. doi: 10.1046/j.1471-4159.2001.00607.x. [DOI] [PubMed] [Google Scholar]
- Llano I, Tan YP, Caputo C. Spatial heterogeneity of intracellular Ca2+ signals in axons of basket cells from rat cerebellar slices. J Physiol. 1997;502:509–519. doi: 10.1111/j.1469-7793.1997.509bj.x. [DOI] [PMC free article] [PubMed] [Google Scholar]
- Lorez M, Humbel U, Pflimlin MC, Kew JN. Group III metabotropic glutamate receptors as autoreceptors in the cerebellar cortex. Br J Pharmacol. 2003;138:614–625. doi: 10.1038/sj.bjp.0705099. [DOI] [PMC free article] [PubMed] [Google Scholar]
- Maejima T, Ohno-Shosaku T, Kano M. Endogenous cannabinoid as a retrograde messenger from depolarized postsynaptic neurons to presynaptic terminals. Neurosci Res. 2001;40:205–210. doi: 10.1016/s0168-0102(01)00241-3. [DOI] [PubMed] [Google Scholar]
- Manly BFJ. Randomization, bootstrap and Monte Carlo methods in biology. London: Chapman and Hall; 1991. [Google Scholar]
- Mateos JM, Elezgarai I, Benítez R, Osorio A, Bilbao A, Azkue JJ, Kuhn R, Knöpfel T, Grandes P. Clustering of the group III metabotropic glutamate receptor 4a at parallel fiber synaptic terminals in the rat cerebellar molecular layer. Neurosci Res. 1999;35:71–74. doi: 10.1016/s0168-0102(99)00066-8. [DOI] [PubMed] [Google Scholar]
- Mintz IM, Sabatini BL, Regehr WG. Calcium control of transmitter release at a cerebellar synapse. Neuron. 1995;15:675–688. doi: 10.1016/0896-6273(95)90155-8. [DOI] [PubMed] [Google Scholar]
- Napper RM, Harvey RJ. Number of parallel fiber synapses on an individual Purkinje cell in the cerebellum of the rat. J Comp Neurol. 1988;274:168–177. doi: 10.1002/cne.902740204. [DOI] [PubMed] [Google Scholar]
- Neale SA, Garthwaite J, Batchelor AM. Metabotropic glutamate receptor subtypes modulating neurotransmission at parallel fibre-Purkinje cell synapses in rat cerebellum. Neuropharmacology. 2001;41:42–49. doi: 10.1016/s0028-3908(01)00046-6. [DOI] [PubMed] [Google Scholar]
- Palay SL, Chan-Palay V. Cerebellar cortex: cytology and organization. Berlin: Springer; 1974. [Google Scholar]
- Pekhletski R, Gerlai R, Overstreet LS, Huang XP, Agopyan N, Slater NT, Abramow-Newerly W, Roder JC, Hampson DR. Impaired cerebellar synaptic plasticity and motor performance in mice lacking the mGluR4 subtype of metabotropic glutamate receptor. J Neurosci. 1996;16:6364–6373. doi: 10.1523/JNEUROSCI.16-20-06364.1996. [DOI] [PMC free article] [PubMed] [Google Scholar]
- Pelkey KA, Topolnik L, Lacaille JC, McBain CJ. Compartmentalized Ca2+ channel regulation at divergent mossy-fiber release sites underlies target cell-dependent plasticity. Neuron. 2006;52:497–510. doi: 10.1016/j.neuron.2006.08.032. [DOI] [PubMed] [Google Scholar]
- Pichitpornchai C, Rawson JA, Rees S. Morphology of parallel fibres in the cerebellar cortex of the rat: an experimental light and electron microscopic study with biocytin. J Comp Neurol. 1994;342:206–220. doi: 10.1002/cne.903420205. [DOI] [PubMed] [Google Scholar]
- Qiu DL, Knöpfel T. Presynaptically expressed long-term depression at cerebellar parallel fiber synapses. Pflugers Arch. 2009;457:865–875. doi: 10.1007/s00424-008-0555-9. [DOI] [PubMed] [Google Scholar]
- Safo PK, Regehr WG. Endocannabinoids control the induction of cerebellar LTD. Neuron. 2005;48:647–659. doi: 10.1016/j.neuron.2005.09.020. [DOI] [PubMed] [Google Scholar]
- Scott R, Rusakov DA. Main determinants of presynaptic Ca2+ dynamics at individual mossy fiber–CA3 pyramidal cell synapses. J Neurosci. 2006;26:7071–7081. doi: 10.1523/JNEUROSCI.0946-06.2006. [DOI] [PMC free article] [PubMed] [Google Scholar]
- Soler-Llavina GJ, Sabatini BL. Synapse-specific plasticity and compartmentalized signaling in cerebellar stellate cells. Nat Neurosci. 2006;9:798–806. doi: 10.1038/nn1698. [DOI] [PubMed] [Google Scholar]
- Takahashi KA, Linden DJ. Cannabinoid receptor modulation of synapses received by cerebellar Purkinje cells. J Neurophysiol. 2000;83:1167–1180. doi: 10.1152/jn.2000.83.3.1167. [DOI] [PubMed] [Google Scholar]
- Takahashi M, Kovalchuk Y, Attwell D. Pre- and postsynaptic determinants of EPSC waveform at cerebellar climbing fiber and parallel fiber to Purkinje cell synapses. J Neurosci. 1995;15:5693–5702. doi: 10.1523/JNEUROSCI.15-08-05693.1995. [DOI] [PMC free article] [PubMed] [Google Scholar]
- Toni N, Buchs PA, Nikonenko I, Bron CR, Muller D. LTP promotes formation of multiple spine synapses between a single axon terminal and a dendrite. Nature. 1999;402:421–425. doi: 10.1038/46574. [DOI] [PubMed] [Google Scholar]
- Wall MJ, Dale N. Auto-inhibition of rat parallel fibre-Purkinje cell synapses by activity-dependent adenosine release. J Physiol. 2007;581:553–565. doi: 10.1113/jphysiol.2006.126417. [DOI] [PMC free article] [PubMed] [Google Scholar]
- Wu LG, Saggau P. Adenosine inhibits evoked synaptic transmission primarily by reducing presynaptic calcium influx in area CA1 of hippocampus. Neuron. 1994;12:1139–1148. doi: 10.1016/0896-6273(94)90321-2. [DOI] [PubMed] [Google Scholar]
- Wu LG, Saggau P. GABAB receptor-mediated presynaptic inhibition in guinea-pig hippocampus is caused by reduction of presynaptic Ca2+ influx. J Physiol. 1995;485:649–657. doi: 10.1113/jphysiol.1995.sp020759. [DOI] [PMC free article] [PubMed] [Google Scholar]