

Abstract
Forward genetics (phenotype driven approaches) remain the primary source for allelic variants in the mouse. Unfortunately, the gap between observable phenotype and causative genotype limits the widespread use of spontaneous and induced mouse mutants. As alternatives to traditional positional cloning and mutation detection approaches, sequence capture and next generation sequencing technologies can be used to rapidly sequence subsets of the genome. Application of these technologies to mutation detection efforts in the mouse has the potential to significantly reduce the time and resources required for mutation identification by abrogating the need for high-resolution genetic mapping, long range PCR, and sequencing of individual PCR amplimers. As proof of principle, we used array based sequence capture and pyrosequencing to sequence an allelic series from the classically defined Kit locus (∼200 kb) from each of 5 non-complementing Kit mutants (one known allele and 4 unknown alleles) and have successfully identified and validated a non-synonymous coding mutation for each allele. These data represent the first documentation and validation that these new technologies can be used to efficiently discover causative mutations. Importantly, these data also provide a specific methodological foundation for the development of large-scale mutation detection efforts in the laboratory mouse.
Introduction
Nearly a century ago, Clarence C. Little and his colleagues at the Roscoe B. Jackson Memorial Laboratory (now The Jackson Laboratory) identified the occurrence of heritable white spotting in the house mouse (Little and Cloudman 1937). This locus is classically referred to as the “W” or dominant spotting locus, because heterozygotes have white belly spotting, white feet and white tail tips. Fifty years later, Edwin Geisler and colleagues demonstrated that the W locus is the Kit oncogene (Geissler et al. 1988). There are 95 Kit alleles and in about half of them, the causative mutations have been identified. Mutations at the Kit locus affect embryonic stem cell migration, resulting in pleiotropic effects on hematopoiesis, primordial germ cell development and melanogenesis. Generally, homozygotes die in utero due to severe macrocytic anemia. Rare surviving homozygotes are leucistic (black eyed, white), severely anemic and sterile.
The Kit series is an archetypal allelic series in the laboratory mouse that has greatly contributed to our current, relatively sophisticated understanding of KIT receptor function and its multifaceted role in stem cell proliferation, migration and development. The Kit allelic series exemplifies the power of allelic diversity and the inherent value of Muller's morphs (hypo-, hyper-, neo- and antimorphs) for in depth genetic analyses of molecular pathways. Furthermore, allelic series often provide better models of human disease, where phenotypes are rarely the result of null or amorphic alleles.
The Knockout Mouse Project (KOMP) and various gene trap consortia are rapidly advancing the goal of creating a null allele of every gene in the mouse genome. These revolutionary projects are the pinnacle of reverse genetics in the mouse. However, forward genetics (phenotype driven approaches) remain a primary source for generating allelic diversity, i.e. non-null alleles. Still, the gap between observable phenotype and causative genotype limits the widespread use of spontaneous and induced mouse mutants. Uncloned mouse mutants are a vast, untapped resource of potential non-null alleles. Ongoing mutagenesis programs and spontaneous mutant programs continue to produce mice with interesting and valuable phenotypes. Currently, there are ∼1500 uncloned mouse mutations from a variety of sources registered and listed in the Mouse Genome Informatics (MGI) database. Prior to the completed sequencing of the mouse genome, with relatively minimal a priori knowledge of the physical position of genes in the genome, mutations were identified by a combination of traditional genetic mapping by recombination, somatic cell hybrid analysis, deletion mapping, and Southern analysis.
After publication of the mouse genome, the process of mutation identification changed dramatically. Generally, a mutation is mapped to a large chromosomal region using strain specific SNPs or SSLP markers that span every chromosome (genome scan) and then high resolution mapping, often involving an intersubspecific cross, is used to narrow the critical interval. Candidate genes are then sequenced with a priori knowledge of their physical location in the genome. Using this approach, a mutation within a candidate region (usually ∼4 Mb) can be found in several months. However, high-resolution mapping often requires efforts of a year or more, especially if a mutation is in non-coding sequence or sequence that is not well annotated. While the current positional cloning process is straightforward, it requires some facility in mouse genetics and ample vivarium space. This process is labor intensive because it relies heavily on PCR amplification of large numbers of individual templates for capillary sequencing.
The current race towards the $1000 genome has spawned a series of technologies that have the potential to close the gap between phenotype and genotype. While the $1000 genome is not currently attainable, array enrichment and next generation sequencing technology can be used to rapidly sequence subsets of the genome (Albert et al. 2007; Okou et al. 2007). Indeed, array capture has been used to sequence the coding portion of the human genome (∼2% or 55 Mb) (Hodges et al. 2007). This technology can significantly reduce the time and resources required for mutation identification by abrogating the need for high-resolution genetic mapping, long range PCR, and sequencing of individual PCR amplimers. Most often for work in the mouse, molecular genetic data like map position are available to guide mutation discovery. As proof of principle that array enrichment and next generation sequencing technology can be used to rapidly identify mutations, we chose to apply these new technologies to identify novel alleles in the archetypal Kit allelic series.
Materials and Methods
Strain information and DNA preparation
The 5 Kit alleles selected for this experiment are spontaneous mutations that all arose at The Jackson Laboratory between 1967 and 1988. The alleles, strain background, generation, date of DNA collection and primary references are listed in Table 1. Four of the alleles arose on the C57BL/6J strain and one arose on the DBA/2J strain. The C57BL/6J strains were maintained by sibling intercrossing and the DBA/2J strain by backcrossing to the C57BL/6J strain. DNA from each strain was prepared by, and obtained from, the Mouse DNA Resource at The Jackson Laboratory. Briefly, large molecular weight DNA was prepared from spleen by nuclear extraction. Spleen DNA was stored at -20°C for at least 16 years prior to use. RNase One (Promega (Madison, WI)) ribonuclease was used to remove RNA from 80 μg of spleen DNA according to the manufacturer's instructions. The RNA was digested for 2 hours at 37°C and enzyme was subsequently removed with an equal volume of phenol:chloroform:isoamyl alcohol (25:24:1, Sigma, St. Louis, MO) mix. DNA was precipitated with 2.5 volumes -20°C 95% ethanol and 0.3 M sodium acetate, pelleted by centrifugation, and washed with 70% ethanol. Pellets were re-suspended in 50 μl of sterile water. A NanoDrop ND1000 (ThermoScientific, Wilmington, DE) spectrophotometer was used for quantification and 2 μl was separated on a 1% agarose gel to check for integrity of high molecular weight DNA. DNA samples were shipped in 40 μg aliquots to Roche Nimblegen (Madison, WI). A positive capture control sample was commercially acquired from Novagen (Madison, WI, Catalog # 69239-3). The strain is reported to be of a BALB/c background but its origin and any substrain information are unknown.
Table 1. The Kit alleles under study.
Shown here are the allele name, phenotype, reference for phenotype data, genetic background of origin, and the year of DNA sample collection.
| Allele | heterozygous / homozygous phenotypes | Reference | Background | DNA sample year |
|---|---|---|---|---|
| W-39J | dilute coat, mild anemia / viable | Geissler et al., 1980 | C57BL/6J | 1985 |
| W-40J | spotting / Iethal | Geissler et al., 1980 | C57BL/6J | 1986 |
| W-73J | spotting / lethal | Sweet and Davisson, 1990 | B6;D2, N8 | 1990 |
| W-20J | spotting / unkown | Geissler et al, 1980 | C57BL/6J | 1986 |
| W-41J | spotting, mild anemia / lethal | Geissler et al., 1980 | C57BL/6J | 1992 |
Sequence Capture Array
A custom tiling 385K Sequence Capture array targeting the c-KIT locus (Chr 5, build mm9 coordinates 75919941-76103747 bp) was designed and manufactured by Roche NimbleGen (Madison, WI). The array was designed using NimbleGen's standard 15mer frequency masking to minimize repeat content within capture probes. The probe spacing, tiling overlap, and probe length were determined using proprietary algorithms. A GFF formatted file allowing visualization of the tiled intervals is available upon request. Identical copies of the array may be obtained from Roche NimbleGen by specifying the design file: 080128_jax_kit_mm9_x1_cap.
Sequence Capture Library Construction
Genomic DNA from the indicated strains was shipped to Roche NimbleGen and each sample was processed into a capture library. From each sample, 20 μg gDNA was fragmented using a Branson probe sonifier using the previously published settings in an 80 μl volume (Albert et al. 2007). An average DNA strand length of ∼400bp was determined by using capillary electrophoresis on DNA7500 chip on the BioAnalyzer 2100 (Agilent, Palo Alto, CA). The genomic DNA was polished and repaired using a combined T4 DNA polymerase and T4 PNK (New England Biolabs (Ipswich, MA)) in a 120 μl volume. The polishing master mix contained: 12 μl 10× NEB Ligase buffer with 10μM rATP, 9 μl water, 1 μl 100× NEB BSA, 5 μl 25mM dNTP mix (dATP, dTTP, dCTP, dGTP) Epicentre (Madison, WI), 1μl 100mM rATP, 6 μl (18U) NEB T4 DNA polymerase, 6 μl (60U) NEB T4 Polynucleotide Kinase. The polishing reaction was incubated in a thermal cycler for 20 minutes at 12°C, 20 minutes at 25°C and then, 20 minutes at 75°C. The samples were allowed to cool to room temperature while the ligation master mix was created. 4 μl of 500μM gSel3/4 adapter was added to each room temperature genomic DNA sample. The conditions for adapter annealing and primer sequences were as published previously (Albert et al. 2007). The ligation master mix consisted of 8 μl 10× NEB Ligase buffer with 10mM rATP, 2 μl 100mM rATP, 57 μl water and 10 μl (200U) NEB T4 DNA ligase. The final ligation reaction volume was 200 μl (119 μl Polished DNA, 4 μl Adapters and 77 μl Ligation Master Mix). The reaction was incubated at room temperature for 90 minutes. Samples were prepared for small fragment removal (e.g. adapter-dimer) by adding 2 μl of 10% (v/v) Tween-20 (Sigma, St. Louis) and mixing. The samples were brought up to 300μl total volume with TE (pH8.0). Small DNA fragments were removed by adding 0.7 volumes of AmpiPure SPRI Beads (60) (Agencourt Biosciences, Beverly, MA) (210 μl), vortexing and incubating at room temperature for 5 minutes. The beads were collected using a rare earth magnetic particle collector (MPC, Invitrogen, Carlsbad, CA). The supernatant containing the small DNA fragments was removed by pipeting, and the bead pellets were washed twice with 500 μl of 70% v/v EtOH. The beads were then air dried at 37°C in the MPC for five minutes. The libraries were then eluted from the SPRI beads by vortexing in 50 μl of water. The SPRI beads were collected using the MPC and the amount of DNA was determined using a NanoDrop ND1000 (ThermoScientific, Wilmington, DE). Library fitness was determined by analyzing 1 μl aliquots from each enzymatic step on a BioAnalyzer 2100 DNA7500 chip (Agilent, Palo Alto, CA). Amplification competency was assessed by LM-PCR with primers (gSel3) complementary to the ligated adapters; sequences and conditions were as previously published (Albert et al. 2007). Amplicons were evaluated by agarose gel electrophoresis.
Capture Array Handling
Array hybridization was executed using an X1 mixer and NimbleGen Hybridization System (NimbleGen, Madison, WI)) for 3 days at 42°C following the manufacturer's recommended conditions. Mouse Cot1 (Invitrogen/Life-Technologies(Carlsbad CA) Catalog # 18440016) was used in the place of Human Cot1 at a mass ratio of 20:1 vs. the library (e.g. 100μg Mouse Cot1 to 5 μg capture Library). Arrays were washed using recommended conditions for array CGH, except that mixer seals were broken under 200 ml of NimbleGen Wash Buffer II (1×) at 42°C, and then moved to NimbleGen Stringent wash (1×) for 2 five minute incubations at 47.5°C. The remaining wash steps in the CGH protocol were performed as described. After Wash III (1×), captured molecules were eluted from the slides using a NimbleGen Elution Station according to manufacturer's recommended conditions. Eluted molecules were dried by centrifugation under vacuum (Vacufuge, Eppendorf, Westbury, NY) and amplification via the gSel adapters was performed as previously described (Albert et al. 2007).
454 Sequencing
Following evaluation by agarose electrophoresis, the amplified capture libraries were processed into sequencing libraries for the 454 GS-FLX using the Shotgun DNA Library Construction Kit and Low Molecular Weight DNA (no nebulization) protocols (454 Life Sciences, Branford, CT) according to manufacturer's recommended conditions in the 454 Life Sciences Sequencing Center. Each captured sample library was sequenced either as a full 2-region PicoTiterplate run on the GS-FLX platform, or in the case of W-39, eight lanes from a 16 region PTP across two runs. All resulting sequence data were transferred to the bioinformatics groups at NimbleGen and 454 for assembly and analysis. The reads have been deposited in GenBank under the following have the following accession information: Study accession #SRP000799.1 and sample #'s SRS003157.1 JAXRNG_W20J; SRS003158.1 JAXRNG_W39J; SRS003159.1 JAXRNG_W40J; SRS003160.1 JAXRNG_W73J; SRS003161.1 JAXRNG_W41J.
Read mapping, sequence assembly and SNP calling
Sequence and data analysis was performed independently by bioinformatics groups at both Roche NimbleGen (RNG) and Roche 454 Life Sciences (454) as part of an overall collaborative analysis effort. Described in detail as a data supplement are the bioinformatics methods employed by both groups. Efforts at Roche NimbleGen incorporated the use of a suite of non-commercial, open source, sequence analysis packages for visualization of the SNP data. Central to both analysis efforts is the implementation of the 454 GS Reference Mapper (GSRM) assembly package (Version 2.0.00.20).
Validation
The validity of all putative variants called between 75953844 bp and 76070262 bp was tested by PCR amplification of the variant position in all five genomic DNA samples and one control genomic DNA sample from an inbred C57BL/6J mouse or an inbred DBA/2J mouse (genomic DNA samples were obtained from the DNA Resource at The Jackson Laboratory). PCR products were purified using Agencourt's AmPure (Beverly, MA). Following purification, capillary sequencing reactions were performed using Applied Biosystems BigDye Version 3 (Carlsbad, CA). Sequencing reactions were purified using Agencourt's CleanSeq (Beverly, MA) and run an Applied Biosystems 3730×l (Carlsbad, CA). Data files were analyzed using Applied Biosystem's Sequencing Analysis Version 5.2.
Results
The five Kit alleles selected for targeted re-sequencing are all spontaneous mutations that arose at The Jackson Laboratory (Schlager and Dickie 1967; Sweet et al. 1990) (Table 1). One of the alleles, KitW-41J (W-41J), is a known Kit mutation and therefore, its V831M mutation served as a positive control. The other 4 Kit strains selected were previously shown to carry Kit mutations by non-complementation testing, but the specific molecular lesion was unknown. The Kit allele, KitW-73J (W-73J) was included because this mutation arose on a non-reference strain background (DBA/2J) (Sweet et al. 1990). The other three alleles, KitW-39J (W-39J), KitW-40J (W-40J) and KitW-20J (W-20J), were selected based on the severity of phenotypes reported where the “mildest” allele, W-39J, is a viable allele and the most “severe” allele, W-40J, causes early lethality and detrimental effects on gametogenesis in heterozygotes (Geissler et al. 1981).
Sequence capture and sequencing
DNA samples from each of these 5 strains were processed and assigned unique, non-identifying sample numbers prior to shipping to Roche NimbleGen. A commercially acquired mouse genomic DNA (msgDNA) was included because the DNA samples from the 5 Kit strains had been in storage for as long as 23 years (Table 1) and the extent of degradation and potential loss of sequence quality was unclear in advance of the experiment.
Sequence capture libraries were constructed for all samples and enriched for the target locus using an array capture mediated approach. The workflow is presented in Figure 1. Briefly, the regions of interest (color coded DNA segments) were nominated and an array tiling across the Kit locus was manufactured. Each capture library was hybridized to arrays, washed stringently, eluted under high temperature, and amplified via the added adapters. Enriched libraries were then subjected to downstream library construction and sequencing steps.
Figure 1. Sequence capture work-flow.
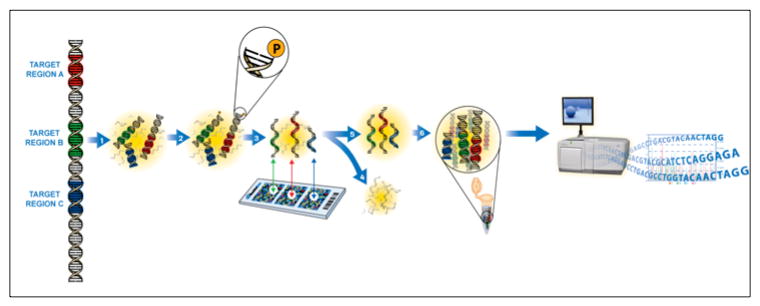
DNA from a sample is sheared, polished and adapted for amplification. The samples are hybridized to an array designed against the region of interest (colored segments). The arrays are washed stringently; captured molecules are eluted and then amplified. The amplified products are put through library construction and then subjected to next generation sequencing, in this case GS-FLX.
The number of reads generated from 454 sequencing of each sample is shown in Table 2. To assess the degree of the enrichment, mapping data for each sample was evaluated by quantifying the number of reads that mapped within the capture target region (i.e. the Kit locus) as a fraction of the total reads mapping to mm9 (i.e. % On-target). The depth of coverage obtained from the mapping results for all samples is also shown in Figure 2. Table 2 includes the number of reads mapped to mm9 (total reads and those that mapped uniquely), the number mapped within the target region (on-target), and the proportion of on-target reads as a function of total mapped reads.
Table 2. Sequencing reads obtained from KIT locus captures mapped against the mouse genome (mm9).
Sequences were also mapped against hg18 as a quality control measure. Total number of reads sequenced and the number and percentage of these reads that mapped uniquely to the mouse genome are shown for each sample (A). Each of the samples contained numerous reads that mapped to hg18, which indicated a small degree of contaminate from human DNA. Despite this contamination from human DNA, a > 70× median coverage of the primary target region was achieved in 5 of 5 samples, with a maximum median coverage of 215× observed in sample W-40J (B). The BALB/c (msgDNA + control) reads were obtained by pooling 3 regions of a 16 channel PTP run.
| A. | mouse (mm9) | |||||
|---|---|---|---|---|---|---|
| Sample | Reads | Unique | (%) | |||
| W-39J | 188.823 | 153.646 | 81% | |||
| W-41J | 485.377 | 300.278 | 62% | |||
| W-73J | 474.377 | 235.795 | 50% | |||
| W-40J | 371.694 | 280.109 | 75% | |||
| W-20J | 540.095 | 244.870 | 45% | |||
| msgDNA | 29.422 | 22.284 | 76% | |||
| B. | Coverage | |||||
| Sample | Target Covered | Reads | (%) | Coverage (median) | #Contigs | Fold Enrichment* |
| W-39J | 98.40% | 105.354 | 68.60% | 146 | 18 | 10077 |
| W-41J | 97.80% | 109.140 | 36.30% | 128 | 22 | 5332 |
| W-73J | 97.80% | 62.829 | 26.60% | 74 | 23 | 3907 |
| W-40J | 97.80% | 168.841 | 45.40% | 215 | 15 | 6669 |
| W-20J | 94.80% | 65.014 | 26.60% | 78 | 22 | 3907 |
| msgDNA | 99.70% | 16.711 | 75.00% | 18 | N/A | 11017 |
Fold enrichment was calculated as (% reads on target) / (Kit interval size in bases / mm9 genome size in bases), where kit interval size = 183,806 bases, and mm9 genome size = 2,700 Mb.
Figure 2. Kit locus capture performance.
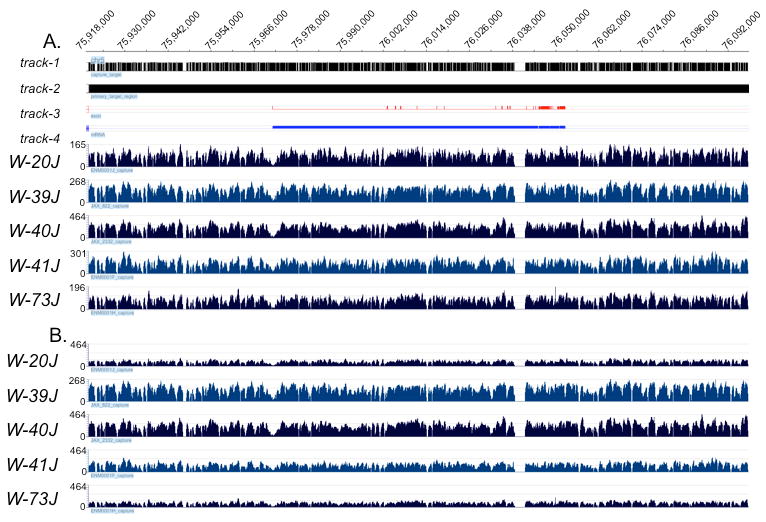
Global view of read coverage achieved over the capture target for each sample. Base pair position along mouse Chromosome 5 is indicated along the top of the X-axis. Each capture sample is indicated by its allele name under each sample data track. The Y-axis within each reflects the depth of coverage at each nucleotide. Displays shown are unscaled (Panel A) and scaled (Panel B). For both panels, track-1 indicates where capture probes were selected and track-2 shows the primary target region. Regions within the primary target region not containing a capture target region are indicative of repetitive or non-unique sequence regions. Track-3 (red) represents the exons comprising the Kit gene, and track-4 (royal blue) represents the bases in the primary Kit transcript.
The percentage of on-target reads for mutant samples ranged from ∼27% to 68%, and was 75% for the positive capture control sample (msgDNA). These on-target rates reflect enrichment for the Kit locus ranging from 3966 to 11017-fold. Sequencing libraries from the control sample were sampled ∼10 fold less deeply (e.g. 29K reads vs. ∼200K), and correspondingly, had a much lower median coverage than experimental samples (Table 2). Lower on-target rates for mutant samples (W-73J, -41J, and -20J) were found to be associated with human DNA contamination (data not shown). Despite the presence of human DNA in some samples, a median depth of coverage between 70 and 215 reads was achieved over the target interval in each of these samples. Uncontaminated mutant samples yielded a percent of on target reads closer to 50% and a median depth of coverage up to 215 reads (Table 2) across the 163 kb target interval. The positive control sample was found to be uncontaminated.
In all cases, >97% of the bases in the capture target region were represented in the dataset from each sample. In addition, large regions of contiguous sequence from the capture interval were observed for each sample. The range of average contig lengths per sample spanned from 7.4 kb (163/22) to 10.8 kb (163/15). As expected, the number of contigs was inversely proportional to the depth of coverage (Table 2). For all samples, the majority of the missing bases correlated with highly repetitive regions within the interval that were excluded from the capture array design. This is shown in Figure 2, where gaps in sequence tracks overlap with capture intervals lacking probes due to the presence of repetitive sequence (Figure 2A and 2B, Track 1 vs. 2; gaps in track 1 represented in white). When only the regions targeted by array probes are analyzed, 100% of the bases in those regions had sequence coverage of at least 1×.
To assess the ability to span repetitive gaps excluded from the capture design, a spanned gap percentage was calculated based on all gap intervals (i.e. regions between probes on the array). There were 276 total regions where no probes were nominated. On average 258 of the 276 were spanned (94%). The spanned-gap percentage ranged between 92% and 96% for all of the mutant samples (data not shown). Lengths of spanned gaps ranged from 89 bp to 959 bp. The largest design gap was 2885 bp; it was not spanned in any of the samples (Figure 2A and B). The average number of contigs present across the five samples was calculated to be 20 (Table 2). There was not a strict relationship between gaps and contigs. The sample with the deepest coverage (W-40J) had only 11 design gaps unspanned, however, it had 15 contigs (Table 2), suggesting some designed regions did not capture well.
Sequence coverage between and within each of the captures was also assessed along the target interval, as shown in Figure 2. The pattern of coverage was highly consistent between samples, regardless of the genetic background. Within-sample coverage was somewhat variable, however. Some target regions were captured with higher than average efficiency (e.g., positions 76,022,200- 76,014,000), while others were under-captured (e.g., near position 75,972,000). The variation in coverage was reproducible across all five samples, suggesting a systematic effect that may be amenable to correction by future optimization. The primary difference appeared to be in the overall efficacy of the capture from a global perspective (i.e. the scale of the Y-axis). This was a direct consequence of the overall amount of sequence obtained and extent of contamination by non-mouse DNA (data not shown). All sequences generated in this study are available from public databases. The accession information for the entire read set is given in methods section.
Age of the genomic DNA sample appeared to have little effect upon capture performance (Table 1 and Figure 2), and was not correlated with on-target percentage or coverage uniformity. DNA from W-39J was more than 20 years old and captured as well as the commercially acquired DNA (Figure 2). The ability to capture from non-C57BL/6J inbred background (the strain background of the mouse reference genome, mm9) was assessed by including an allele that arose in the DBA/2J strain (W-73J), and the commercially acquired mouse genomic DNA (msgDNA), which is reported to be of an inbred BALB/c background. Table 2 and Figure 2 show that the capture characteristics of both the W-73J and msgDNA samples were quite similar to the other alleles. The median coverage was found to be comparable among W-73J (∼70 reads), and the pair of C57BL/6J background samples W-41J and W-20J. Coverage uniformity (Figure 2) also appears comparable to the C57BL/6J samples.
Assembly, putative mutation identification and validation
The read data were assembled by teams at both 454 and Roche NimbleGen (RNG) independently using different methods (See additional file), with the union/agreement between the two approaches providing the starting point for subsequent validation. The RNG approach focused upon an open source solution for assembly and variant detection followed by custom python scripts that generated GFF-formatted data tracks capable of visualization with the array data visualization software SignalMap. The 454 effort was centralized within an updated release of the GS Read Mapper (GSRM). A pictorial representation of the data track output from the RNG effort is shown in Figure 3, and includes allele ratio, quality score, depth of coverage, insertions, deletions and a colorized version of the reference sequence plotted along the chromosome. In addition, UCSC genome browser annotation tracks were imported, allowing simultaneous visual comparison to annotation such as gene models (introns, exons and UTR) and known variants (e.g. dbSNP entries).
Figure 3. Example of a high quality variant.
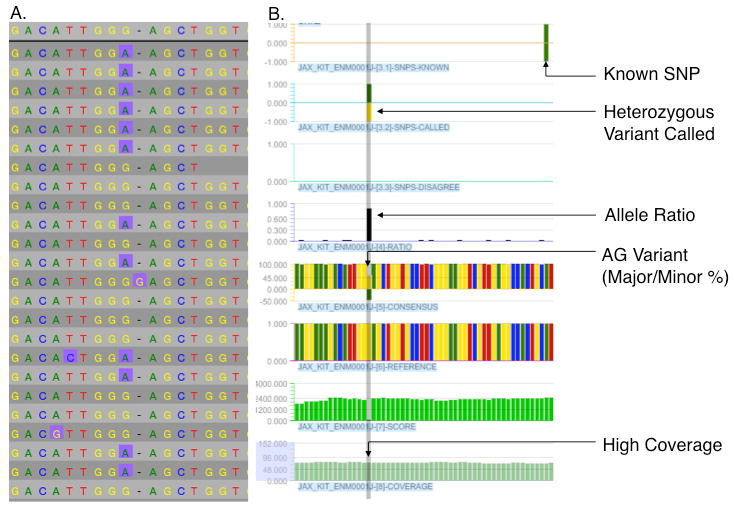
Shown in panel A is the result obtained from an assembly view from the Hawkeye genome assembly browser (Amos Consortium) and in panel B the same interval viewed with Roche NimbleGen SignalMap. The data tracks are (top to bottom) dbSNP entries, heterozygous variants nominated by Hawkeye (green, G over yellow, A), homozygous disagreement from reference, the calculated allele ratio (where allele ratio = minor allele frequency / major allele frequency and y- axis height represents minor allele ratio), a colorized fusion of the het-variant track and allele ratio information, colorized bases from mm9 reference. The dark green data track depicts the quality score of the base predictions at the SNP position with the Y-axis indicating the range, while the light green track indicates the depth of coverage with its Y-axis. Data shown is from W-20J.
Since the DNA samples were from mice heterozygous for mutations in Kit, we could assume for variant analysis that the putative mutations would appear as heterozygous variations from the published C57BL/6J reference sequence. Variants from reference were predicted by looking for heterozygous polymorphisms within the interval. Table 3 reports the consolidated variant identification results from both efforts, as well as variants' locations relative to Kit exons and SNPs previously identified within the DBA/2J background. The depth of coverage supporting the indicated variant calls is also shown (Table 3). The RNG team proceeded genetically with their analysis; variants in common between any two samples were excluded from consideration as likely putative mutations since such variants would be inconsistent with the genetic behavior and origin of the alleles. RNG also excluded variants falling at homopolymeric tracts due to reduced sequencing accuracy in such regions. The variants that were excluded by RNG team based on these parameters are highlighted in white (75974741 and 76018882).
Table 3. Variants identified by two independent variant detection pipelines (454 and NG).
Regions shaded in grey and yellow are variant calls that were successfully validated (or were correct). The grey regions indicate known SNPs that were correctly identified and yellow regions indicate true novel variants. Unshaded regions indicate variant calls that were false positives (failed validation). In some cases, variant calls were made at positions that correspond to dbSNPs (dbSNP column). Asterisks indicate dbSNP data that failed to validate. Variants highlighted in red were found to code for non-synonymous changes at the protein level.
| Position | EXONIC | W-39J | W-41J | W-73J | W-20J | W-40J | dbSNP iD | Coverage (number of reads) | Variation% (454/NG) | Team | Validated |
|---|---|---|---|---|---|---|---|---|---|---|---|
| 75953844 | - | CT | rs33389778 | 52 / 48 | 44% / 29% | 454 / NG | Yes | ||||
| 75974741 | - | GA|del | rs33400508 | 88 | 11% | 454 | No | ||||
| 75976331 | - | AC | 21 / 151 | 44% / 46% | 454 / NG | Yes | |||||
| 75977692 | - | AG | rs29824030 | 72 / 90 | 53% / 41% | 454 / NG | Yes | ||||
| 75986373 | - | AG | rs29511147 | 26 / 15 | 31% / 27% | 454 / NG | Yes | ||||
| 76004142 | - | CT | rs29576905 | 46 / 60 | 57% / 53% | 454 / NG | Yes | ||||
| 76005510 | + | CTCTG|del | 89 / 155 | 37% / 39% | 454 / NG | Yes | |||||
| 76005684 | - | CG | rs33344729 | 54 / 65 | 41% / 40% | 454 / NG | Yes | ||||
| 76008975 | - | AT | rs37495474 | 73 / 74 | 55% / 48% | 454 / NG | Yes | ||||
| 76018882 | - | GT|del | rs52182172 rs52174161 |
53 | 11% | 454 | No | ||||
| 76037147 | + | AG | 60 / 72 | 51% / 45% | 454 / NG | Yes | |||||
| 76037177 | + | AC | 45 / 47 | 56% / 44% | 454 / NG | Yes | |||||
| 76037232 | + | AG | 33 / 138 | 44% / 35% | 454 / NG | Yes | |||||
| 76048587 | + | AG | 68 / 108 | 51% / 44% | 454 / NG | Yes | |||||
| 76070262 | - | AG | rs37691247 | 71 / 96 | 49% / 35% | 454 / NG | Yes |
Within base pair positions 75953844 and 76070262, a total of 15 heterozygous variants were nominated across the five samples. The total number of putative calls was 75 across the five samples, comprising 15 positive variant predictions and 60 negative predictions (i.e., those positions matching the reference assembly). Thirteen of the positive variant predictions by both the 454 and NG analyses overlapped. The remaining 2 variants were unique to 454 analysis. PCR amplification and Sanger sequencing was used to validate each variant across all five samples and in control C57BL/6J and/or DBA/2J.
Seven of the variants discovered by both analyses were found in the W-73J sample and are SNPs previously reported for DBA/2J (see gray regions, Table 3). Both 454 and NG correctly made all seven of these predictions. There were two positions for which small deletions were called by the 454 analysis in two of the samples. The positions of these deletions correspond to two dbSNP entries, however the nature of the variants (2 bp deletion) did not correspond to the dbSNP variants (SNPs) and these variant calls failed validation. The sequence surrounding this position consists of simple sequence. Low complexity sequence is commonly associated with DNA sequencing and hybridization errors in general. All pyrosequencing technology is sensitive to lengthy homopolymeric tracts and simple sequence because it relies upon the enzyme template complexes staying in phase (i.e. at the same base position) within each well for detection. Certainly, the best insurance against these types of mis-calls is deep coverage with a high-on-target read rate. The one factor most affecting coverage appeared to be prevention of capture library contamination since the samples (msgDNA, W-39J and W-40J) with the best coverage statistics had negligible contamination (<1% human). Much care, including both technical and physical control metrics should be exercised when manipulating the eluate libraries. The source of contamination in this study was traced back to the vacuum apparatus used to dry the eluates (data not shown).
Curiously, four of the eleven DBA/2J dbSNP entires mapping in the target interval were missed by both of the variation detection efforts. Of these, attempts to validate three were unsuccessful in both wild type DBA/2J and in W-73J strains, demonstrating they were correctly called by both teams as non-variant (i.e. reference). This suggests that a potentially large fraction of DBA/2J SNPs in dbSNP may be incorrect. The fourth “missed” SNP, rs33113603, was found by PCR and Sanger sequencing of W-73J and DBA/2J and is the only known DBA/2J variant not detected by the NG and 454 teams. The coverage at this position was 35× in the W-73J sample and the sequence surrounding the position is a homopolymeric tract of 11 cytosines.
Five variants were discovered within coding portions of Kit. (Table 1, yellow shading, red text) by both analyses and were successfully validated (Figure 4). Four of the variants cause a non-synonymous change in the KIT amino-acid sequence and one of them is a 5 bp deletion that results in the introduction of a stop codon at amino acid position 190. Both analyses successfully identified the known positive control mutation in W-41J as a G to A transition (position Chr 5:76037232) in the kinase domain's activation loop (V831M). The remaining four coding variants are most likely the causative mutations for W-20J, -40J, -73J and -39J (see below). In addition, there was one non-coding variant, common to both analyses, that successfully validated and is therefore a novel SNP that is unique to W-39J.
Figure 4. Independent non-synonymous SNP validation.
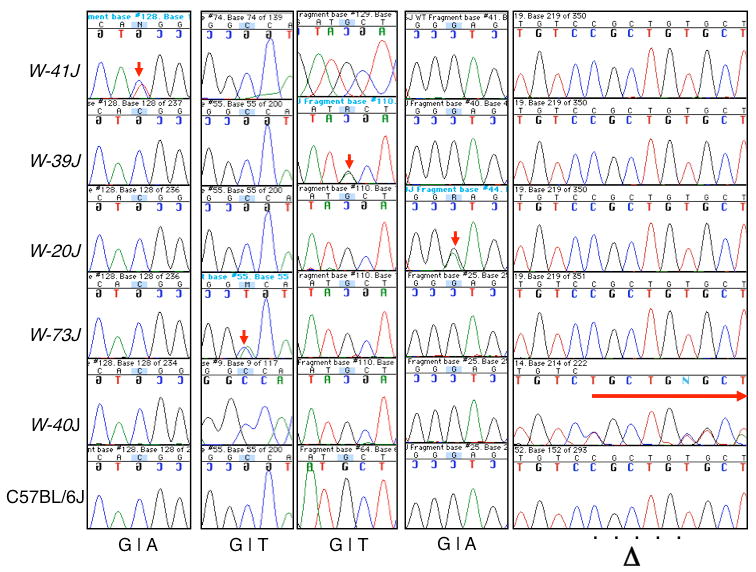
As for all of the variants discovered, validation of each of the non-synonymous coding variants was performed using conventional Sanger sequencing methods. Regions spanning each variant were sequenced in all of the five samples. C57BL/6J DNA was sequenced as a negative control for all of the samples. DBA/2J DNA was used as an additional negative control for the W-73J variants (not shown). Red arrows indicate the positive validation of each variant or mutation. Each row comprises the Sanger results from each allele. Each column represents one of the predicted non-synonymous alterations. Notice in the deletion allele that the unique bases distal to the deletion become offset as expected.
The cumulative validation results show that for the 15 positive heterozygous variation predictions made across the 5 samples, 13 correct positive predictions were made. By extension, the corresponding 60 negative predictions (4 associated with each positive prediction) were also correctly made. Consistent with this observation, Sanger sequencing of each variant position and sequencing of the entire coding sequence of Kit in each sample confirmed that there were no variant (i.e. heterozygous) bases in any of the validation assays, other than the predicted base (13 times). This meant that the positive prediction accuracy rate was at least 13/15 or 86%, and because of the single missed SNP the false negative rate was 0.013% (1/75). The false positive rate at the allele ratio employed by each team collectively was 13% (2/15). All of the correctly predicted variants had variant allele ratios greater than 25%, where the allele ratio is the (minor allele/major allele)*100. Conversely, of the 2 variants that failed to validate, both had allele ratios of less than 25%. Therefore, a reasonable variant allele ratio cutoff for predicting heterozygosity at any position is an allele ratio of >25%.
Validated mutations fall into critical domains for kinase function
The Kit gene encodes a tyrosine kinase cell surface receptor comprised by two domains important for function – an extracellular ligand binding domain (orange, Figure 5), and an intracellular kinase domain (green, Figure 5). Close inspection of the position of the validated non-synonymous SNPs and the deletion within Kit revealed that four of variants (including the positive control, W-41J) are in the kinase domain. Figure 5 depicts the position of each along with the resulting amino acid sequence in each of the alleles. Three of the five are in the activation loop, which is important for activating the kinase's phosphate transfer (Bernstein et al. 1990; Nocka et al. 1989). The known mutation, W-41J, falls into the ATP binding loop, which is important for coordinating the phosphate donor within the active-site (Nocka et al. 1990). The strain bearing the W-20J allele bears a mutation in a universally conserved position (the 5′ anchor G in the GXGXXGK(N20)K in the ATP binding loop-which replaces the glycine with an glutamate residue (G595E). The W-73J allele contains an aspartate for alanine substitution at position 605, and the W-39J allele contains an isoleucine instead of a methionine at position 623. The W-39J allele lies adjacent to and just outside the GXGXXGK(N20)K ATP binding loop. The 5 bp deletion allele identified in W-40J results in a frame-shift yielding two non-synonymous substitutions (R186C and A188S) and an in-frame, premature STOP at position 190. This is predicted to result in nonsense-mediated decay of the resulting transcript, and/or translation to a polypeptide truncated to less than 1/3 of the normal length with no fully formed domains.
Figure 5. Validated locations of the discovered mutations affect important KIT domains.
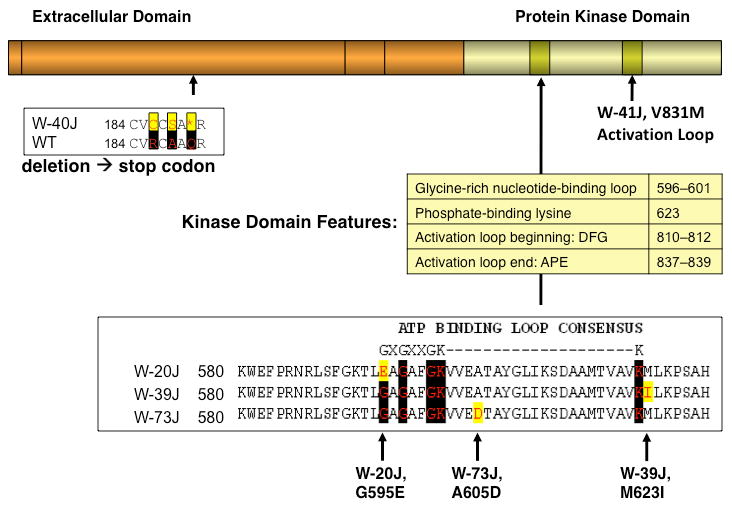
The extracellular ligand binding domain of the KIT receptor is indicated by the orange box, while the intracellular kinase domain is indicated by the green box. The position of each mutation is indicated as is the alteration each makes to the protein sequence (red amino acid shaded in yellow). Highly conserved amino acids are indicated by black shading.
Estimates of the likelihood of a particular non-synonymous (amino-acid changing) coding SNP to cause a functional impact on the protein were calculated using the method of Thomas and Kejariwal (Thomas et al. 2006). Briefly, the method calculates a factor called the substitution position-specific evolutionary conservation (subPSEC) score based upon an alignment of evolutionarily related proteins (i.e. Kit orthologs), and as a part of that calculation, the method estimates whether a particular lesion is deleterious (Pdel). The calculated subPSEC and Pdel along with each validated change for each allele are presented in Table 4. The severity of each allele's homozygous phenotype corresponded to its predicted Pdel value. Like W-41J, W-39J is a homozygous viable allele and it has the lowest Pdel, while W-73J is a homozygous lethal allele and has the highest Pdel. The phenotype of homozygous W-20J mice has not been reported but based on the nature of the mutation and existing data on the molecular nature of alleles that are phenocopies of W-20J (Nocka et al. 1990; Reith et al. 1990), we can predict that W-20J is likely a homozygous lethal allele.
Table 4. Conservation based analysis of non-synonymous coding SNPs.
The alteration, calculated subPSEC (substitution position-specific evolutionary conservation) score and probability of a deleterious consequence (Pdeleterious) are indicated for each allele. The calculations are based upon an alignment of evolutionarily related proteins, as described in Thomas et al., 2003 and Thomas & Kejariwal, 2004 and are available on-line http://www.pantherdb.org/tools/csnpScoreForm.jsp.
| ALLELE | subPSEC | Pdeleterious | substitution |
|---|---|---|---|
| W-20J | -9.18434 | 0.99794 | G599E |
| W-39J | -5.49221 | 0.92359 | M627I |
| W-41J | -7.31019 | 0.98675 | V831M |
| W-73J | -9.84495 | 0.99894 | A609D |
The frameshift in W-40J introduces a premature stop codon at amino acid position 190 in the extracellular binding domain of KIT (Figure 5). This mutation most likely results in loss of function, which may explain the less severe phenotype of heterozygotes (i.e. no anemia) and the lethal phenotype of homozygotes. This is a common feature of mutations in Kit, where some mis-sense mutations can confer a dominant negative effect in heterozygous animals whereas null mutations that reduce the amount of normal protein have mild effects in heterozygous animals (Nocka et al. 1990; Reith et al. 1990). The phenotypes of W-39J and W-41J are examples of this phenomenon where heterozygous animals have more severe coat color (dilution) and hematopoietic (mild anemia) phenotypes as compared to null alleles such as the classic dominant white spotting allele, W (de Aberle 1927), a deletion allele that prevents cell surface expression of KIT.
Discussion
Array capture mediated resequencing leads to the discovery of four novel mutations
We successfully identified four novel mutations in the Kit locus using array capture mediated resequencing. For each sample, one coding SNP or small deletion was detected and independently validated. Importantly, the positive control mutation was also confirmed correctly. Furthermore, the nature of the mutations, their positions within the KIT protein and a wealth of genetic data including non-complementation with previously characterized Kit alleles, support the conclusion that the coding variants found in W-20J, W-39J, W-40J and W-73J are the causative mutations. While formal proof of causation would require the re-creation of these alleles by gene targeting, the overwhelming amount of available data warrant the indictment of these lesions as the molecular basis of the Kit defects in these lines.
W-39J spontaneously arose in C57BL/6J, therefore, it was interesting to find and validate a variant (in addition to the W-39J mutation) from reference (which is also C57BL/6J). Pedigree data show that the W-39J mutation arose prior to 1970 and was then maintained in a reproductively isolated research colony until DNA was archived in 1985. This additional novel variant is not present in the other W alleles that were used in this study, all of which arose spontaneously in the same C57BL/6J breeding colony at The Jackson Laboratory. We validated that neither the alleles that arose before (W-20J) or after (-40J, and -41J) W-39J carry this SNP, nor does the strain upon which the W-39J allele is carried (Schlager and Dickie 1967)). Therefore, it is likely that this variant arose after the W-39J mutation and, given its proximity to the causative W-39J mutation, tight linkage resulted in maintenance of the SNP in subsequent generations (∼62 generations).
Success guides experimental and analysis parameters for future studies
These results show that sequence-capture and next generation sequencing technology can be used to rapidly sequence select regions from the mouse genome and that heterozygous variations within these regions can be predicted with high accuracy. Using this approach, we successfully identified one known (positive control) and 4 previously unknown mutations in the Kit gene, as well as one new SNP and 7 of 8 known DBA/2J SNPs. The positive prediction accuracy was 86% and the negative prediction accuracy was close to perfect. A variant allele frequency cut off of 25% appears sufficient to capture all true variants. Additionally, validation of candidate variants can be further prioritized by coverage and flanking sequence complexity. We conclude that an allele ratio threshold of >25% and read depth of >20 are sufficient to sensitively detect true heterozygous variants while maintaining sufficient specificity to yield a manageably small collection of SNP for validation.
Even with the more liberal allele ratio threshold of 20% used for heterozygote detection, only 15 variants were nominated across the 5 samples, out of over 163 kb in each sample. The observation of fewer than 10 heterozygous variants (on average), and no homozygous variants across the five key samples suggests that amplification mediated artifacts (i.e. polymerase errors) from the eluate are not generating a burdensome number of putative errors that have to be assessed later. Certainly, understanding the rate of SNP discovery per sample-megabase may be useful for estimating the number of variants expected for larger sequencing studies. The average of ∼3 naturally occurring variations per strain (15/5) discovered across the 163 kb of target suggests a rate of variant prediction of 0.018 variant per sample-kbp (3/163). Thus, future efforts should budget for validation of between 9-18 SNPs per sample per megabase, depending on the strains involved. This rate means that the number of candidate variants expected in 4 Mb of capture space (which is the typical size of a candidate region in a mapping project after several hundred meioses) in one sample should be manageable within a single 96-well plate formatted assay with available high-throughput SNP validation technologies.
Additional considerations are needed when dealing with identification of induced mutations as DNA from the G1 offspring of N-Ethyl-N-nitrosourea (ENU) mutagenized mice are predicted to carry a mutation load approaching 1 in every 1.82 Mb (Keays et al. 2006), depending on the ENU dose and strain. Based on this frequency and considering the size of the coding portion of the mouse genome, Keays et al estimated that the first generation offspring from an ENU mutagenized mouse will carry roughly 31 mutations that are in coding sequence (Keays et al. 2006; Quwailid et al. 2004). With each backcross generation, the mutation load decreases so that at the 10th backcross generation, there is a 7% chance that another ENU induced coding mutation will be linked to the causative mutation (Keays et al. 2006). Therefore, the number of ENU mutations that one would expect to find in the genome of mutagenized animals and their offspring is very much dependent on the backcross generation and these factors need to be considered when planning validation efforts.
Most important from a practical perspective is the potential savings in terms of time (and therefore cost) for mutation discovery in the mouse genome. In as little as 2 weeks, a ∼160 kb genomic region from 5 strains was captured and sequenced with a maximum median depth of coverage of 215 reads, comprising a total of over 340 Mb from the genetically identified interval. The nature of the mutation to be discovered will likely impact the analysis. True heterozygous variants were detected with as little as 15× coverage (Table 3). Based upon this we suspect that homozygous variant (recessive mutation) prediction will require as little as 4-5× coverage. Current array technologies will allow for whole exome capture from the mouse genome in a single array (34-75Mbp). However, when budgeting for sequencing, one needs to consider the total sequence needed to obtain the desired coverage. Then assuming that roughly 1/4 of the sequence will not map uniquely or to the region of interest, that amount of sequence needs to be multiplied by 1.25 to determine the total amount of sequencing data required for mutation detection. Given the nature of the coding portion of the genome one can expect a much lower false discovery rate since simple sequences like homopolymeric tracts and dinuclotide repeats (which contribute to the majority of false calls) are less abundant in this portion of the genome. Of course, because there is only one reference mouse genome available, capture is sequence constrained or limited to just the shared sequence portion of the C57BL/6J genome and any other strain of interest.
Current next generation sequencing technologies promise 5-30 fold more sequence per sequencing run and current custom array technologies can provide custom designs to capture approximately 1-2% of the genome (i.e. many or most of the exons depending upon the semantic definition of “exon” used). Such large sequence spaces could easily be sampled with a few runs or lanes on any platform.
What is important to consider from an analytical perspective is that platform associated artefacts were shared between samples at the same chromosomal positions. Such an observation suggests that genetically guiding the discovery process may be used to constrain the false discovery rate. Of serious import however, may be the genetic background the mutation is carried upon. Recent array copy-number variation (CNV) studies suggest that as much as 10% of the mouse genome may be copy number variable between different inbreds (Shaw and Geoghean, personal communication; She et al. 2008)). Clearly any segmental aneuploidy between the strain being sequenced and the reference sequence used for array production and SNP calling may give rise to coverage holes (where mm9 has the sequence but the strain of interest does not) or may result inappropriate homozygous genotypes where the heterozygous mouse contains one reference allele over a deletion (or duplication) allele. Future resequencing studies should carefully consider integrating CNV study with any capture technology.
Genetic guiding of mutation discovery may mitigate these issues when combined with de novo assembly of the captured reads into a strain specific consensus. Subsequent mapping with captures from heterozygous and homozygous mutants, perhaps sibs, and then mapping mutations via the strain specific consensus (without regard to the mm9 consensus) should mitigate errors, particularly where animals with all three genotypic constructions may be analyzed. Combinations of the both the long read and short read technologies would seem advantageous for such efforts.
Importantly, these data provide the framework for constructing the efficient detection of causative mutations in mutant mouse strains moving forward. The standards presented here, coupled with the latest sequence capture methods (e.g., whole-exome arrays or solution based methods) and next generation sequencing technologies promise to significantly close the gap between phenotype and genotype in the mouse.
Supplementary Material
Acknowledgments
H. Halvensleben, C. Erickson, L. Freeberg, T Millard, and L. Lincoln for providing technology and logistical support operations at Roche NimbleGen. C. Turcotte and the 454 Sequencing center for library construction and sequencing support. X. Zheng, and L. Dannenberg for providing project coordination support. C. Birkenmeier and M. Berry for providing pedigree and historical data from the Kit alleles used in this study (The Jackson Laboratory). This work was supported by Roche Applied Sciences and a Cancer Center Core Grant to The Jackson Laboratory (CA34196)
References
- Albert TJ, Molla MN, Muzny DM, Nazareth L, Wheeler D, Song X, Richmond TA, Middle CM, Rodesch MJ, Packard CJ, Weinstock GM, Gibbs RA. Direct selection of human genomic loci by microarray hybridization. Nat Methods. 2007;4:903–905. doi: 10.1038/nmeth1111. [DOI] [PubMed] [Google Scholar]
- Bernstein A, Chabot B, Dubreuil P, Reith A, Nocka K, Majumder S, Ray P, Besmer P. The mouse W/c-kit locus. Ciba Found Symp. 1990;148:158–166. discussion 166-172. [PubMed] [Google Scholar]
- de Aberle SB. A study of hereditary anemia of the mouse. Amer Jour Anat. 1927;40:219–249. [Google Scholar]
- Geissler EN, McFarland EC, Russell ES. Analysis of pleiotropism at the dominant white-spotting (W) locus of the house mouse: a description of ten new W alleles. Genetics. 1981;97:337–361. doi: 10.1093/genetics/97.2.337. [DOI] [PMC free article] [PubMed] [Google Scholar]
- Geissler EN, Ryan MA, Housman DE. The dominant-white spotting (W) locus of the mouse encodes the c-kit proto-oncogene. Cell. 1988;55:185–192. doi: 10.1016/0092-8674(88)90020-7. [DOI] [PubMed] [Google Scholar]
- Hodges E, Xuan Z, Balija V, Kramer M, Molla MN, Smith SW, Middle CM, Rodesch MJ, Albert TJ, Hannon GJ, McCombie WR. Genome-wide in situ exon capture for selective resequencing. Nature genetics. 2007;39:1522–1527. doi: 10.1038/ng.2007.42. [DOI] [PubMed] [Google Scholar]
- Keays DA, Clark TG, Flint J. Estimating the number of coding mutations in genotypic- and phenotypic-driven N-ethyl-N-nitrosourea (ENU) screens. Mamm Genome. 2006;17:230–238. doi: 10.1007/s00335-005-0101-4. [DOI] [PubMed] [Google Scholar]
- Little CC, Cloudman AM. The Occurrence of a Dominant Spotting Mutation in the House Mouse. Proceedings of the National Academy of Sciences of the United States of America. 1937;23:535–537. doi: 10.1073/pnas.23.10.535. [DOI] [PMC free article] [PubMed] [Google Scholar]
- Nocka K, Majumder S, Chabot B, Ray P, Cervone M, Bernstein A, Besmer P. Expression of c-kit gene products in known cellular targets of W mutations in normal and W mutant mice--evidence for an impaired c-kit kinase in mutant mice. Genes Dev. 1989;3:816–826. doi: 10.1101/gad.3.6.816. [DOI] [PubMed] [Google Scholar]
- Nocka K, Tan JC, Chiu E, Chu TY, Ray P, Traktman P, Besmer P. Molecular bases of dominant negative and loss of function mutations at the murine c-kit/white spotting locus: W37, Wv, W41 and W. EMBO. 1990;9:1805–1813. doi: 10.1002/j.1460-2075.1990.tb08305.x. [DOI] [PMC free article] [PubMed] [Google Scholar]
- Okou DT, Steinberg KM, Middle C, Cutler DJ, Albert TJ, Zwick ME. Microarray-based genomic selection for high-throughput resequencing. Nat Methods. 2007;4:907–909. doi: 10.1038/nmeth1109. [DOI] [PubMed] [Google Scholar]
- Quwailid MM, Hugill A, Dear N, Vizor L, Wells S, Horner E, Fuller S, Weedon J, McMath H, Woodman P, Edwards D, Campbell D, Rodger S, Carey J, Roberts A, Glenister P, Lalanne Z, Parkinson N, Coghill EL, McKeone R, Cox S, Willan J, Greenfield A, Keays D, Brady S, Spurr N, Gray I, Hunter J, Brown SD, Cox RD. A gene-driven ENU-based approach to generating an allelic series in any gene. Mamm Genome. 2004;15:585–591. doi: 10.1007/s00335-004-2379-z. [DOI] [PubMed] [Google Scholar]
- Reith AD, Rottapel R, Giddens E, Brady C, Forrester L, Bernstein A. W mutant mice with mild or severe developmental defects contain distinct point mutations in the kinase domain of the c-kit receptor. Genes Dev. 1990;4:390–400. doi: 10.1101/gad.4.3.390. [DOI] [PubMed] [Google Scholar]
- Schlager G, Dickie MM. Spontaneous mutations and mutation rates in the house mouse. Genetics. 1967;57:319–330. doi: 10.1093/genetics/57.2.319. [DOI] [PMC free article] [PubMed] [Google Scholar]
- She X, Cheng Z, Zollner S, Church DM, Eichler EE. Mouse segmental duplication and copy number variation. Nature genetics. 2008;40:909–914. doi: 10.1038/ng.172. [DOI] [PMC free article] [PubMed] [Google Scholar]
- Sweet HO, Cook S, Davisson MT. The W allele W<73J>. Mouse Genome. 1990;86:239. [Google Scholar]
- Thomas PD, Kejariwal A, Guo N, Mi H, Campbell MJ, Muruganujan A, Lazareva-Ulitsky B. Applications for protein sequence-function evolution data: mRNA/protein expression analysis and coding SNP scoring tools. Nucleic Acids Res. 2006;34:W645–650. doi: 10.1093/nar/gkl229. [DOI] [PMC free article] [PubMed] [Google Scholar]
Associated Data
This section collects any data citations, data availability statements, or supplementary materials included in this article.