

Abstract
There is increasing complexity in the organization of seven transmembrane domain (7TM) receptor signalling pathways, and in the ability of their ligands to modulate and direct this signalling. Underlying these events is a network of protein interactions between the 7TM receptors themselves and associated effectors, such as G proteins and β-arrestins. Bimolecular fluorescence complementation, or BiFC, is a technique capable of detecting these protein–protein events essential for 7TM receptor function. Fluorescent proteins, such as those from Aequorea victoria, are split into two non-fluorescent halves, which then tag the proteins under study. On association, these fragments refold and regenerate a mature fluorescent protein, producing a BiFC signal indicative of complex formation. Here, we review the experimental criteria for successful application of BiFC, considered in the context of 7TM receptor signalling events such as receptor dimerization, G protein and β-arrestin signalling. The advantages and limitations of BiFC imaging are compared with alternative resonance energy transfer techniques. We show that the essential simplicity of the fluorescent BiFC measurement allows high-content and advanced imaging applications, and that it can probe more complex multi-protein interactions alone or in combination with resonance energy transfer. These capabilities suggest that BiFC techniques will become ever more useful in the analysis of ligand and 7TM receptor pharmacology at the molecular level of protein–protein interactions.
This article is part of a themed section on Imaging in Pharmacology. To view the editorial for this themed section visit http://dx.doi.org/10.1111/j.1476-5381.2010.00685.x
Keywords: bimolecular fluorescence complementation, seven transmembrane domain receptor, receptor dimers, G protein, arrestin, fluorescence correlation spectroscopy
Introduction
Traditional studies of seven transmembrane domain (7TM) receptors evaluate their signalling and pharmacology at the level of cell populations. Such investigations reveal complexity in the way in which ligand–receptor complexes recruit different intracellular pathways to elicit a specific biological response. For example, individual 7TM receptors must select heterotrimeric G proteins with the right combination of Gα and Gβγ subunits to modulate second messenger enzymes and ion channels appropriately. There are also well-established G protein-independent 7TM pathways, typified by receptor recruitment of β-arrestin adaptors for endocytosis and stimulation of extracellular signal-related kinase (ERK) cascades (Gurevich and Gurevich, 2006). Increasingly, our current questions in 7TM receptor pharmacology require understanding of how such signalling networks are coordinated with high fidelity at the subcellular level. Do 7TM receptors function as monomers or oligomers? Are receptor signalling pathways spatiotemporally organized in microdomains, and if so, how are these defined? How do receptors select between alternative downstream partners, and is this influenced by the choice of ligand? A key element in defining the associated mechanisms is to know how the relevant protein–protein interactions are controlled – for example, between different 7TM receptor monomers, protein partners involved in the regulation and activation process, or scaffolds underlying the architecture of the signalling complex.
Multi-protein complexes can be identified by biochemical approaches, such as co-immunoprecipitation, but these invariably involve cell lysis and normally lack subcellular and temporal resolution. Bioluminescence/fluorescence resonance energy transfer (BRET/FRET) techniques have also proved popular and successful ways to study different aspects of 7TM receptor function, including receptor dimerization, G protein activation or β-arrestin recruitment (Milligan and Bouvier, 2005; Lohse et al., 2008; Maurel et al., 2008). A third interaction strategy, known as complementation, involves the division of a protein reporter into two non-functioning fragments, each fused to the separate partners under investigation. The association of the target proteins then drives recombination of the reporter fragments, and the reconstitution of measurable functional activity. Protein complementation assays were first described for enzymatic reporters, such as β-galactosidase subunits (Rossi et al., 1997) or dihydrofolate reductase (Pelletier et al., 1998; Michnick et al., 2007). However, a recent advance has been to adapt this principle to fluorescent proteins, originally to Aequorea victoria green fluorescent protein (GFP) (Ghosh et al., 2000; Nagai et al., 2001; Robert et al., 2001) and most often to related variants such as yellow fluorescent protein (YFP). In an early application of bimolecular fluorescence complementation (BiFC) to a biological protein–protein interaction, non-fluorescent YFP N and C fragments were fused to the Fos and Jun transcription factor-binding domains (Hu et al., 2002). On their co-expression, the formation of the Fos–Jun heterodimer brought the split YFP halves together, and promoted refolding and regeneration of a functioning fluorescent protein (Figure 1A). Thus, BiFC has the potential to combine the relative simplicity of a complementation assay, with the power to quantify the intensity and subcellular distribution of the responses by imaging living cells.
Figure 1.

Principle of bimolecular fluorescence complementation (BiFC) and design of Aequorea fluorescent protein fragments. (A) Protein partners can associate and dissociate reversibly until the split fluorescent protein tags refold to form a stable β-barrel structure. The subsequent maturation of the chromophore generates a fluorescent BiFC complex. Folding and maturation times are for yellow fluorescent protein (YFP) (1–154) and YFP (155–238) tags at 25°C in vitro (Hu et al., 2002). (B) The structure of Aequorea fluorescent proteins consists of 11 β-strands, with the amino acids that develop into the chromophore shown in a helix between strands 3 and 4. Venus mutations on an enhanced YFP background are highlighted in red (Nagai et al., 2002). Fluorescent fragments known to display complementation (YFP unless otherwise stated) are shown at positions 1: 154–155 (e.g. Hu et al., 2002), 2: 158–159 (Mervine et al., 2006), 3: 172–173 (Hu and Kerppola, 2003), 4: superfolder green fluorescent protein (GFP) 222–223 (Cabantous and Waldo, 2006) and 5: 144–145 (Nagai et al., 2001). Sequence references refer to original native GFP.
From its conception 8 years ago, BiFC has been applied to a variety of protein–protein interactions in many types of cells, and this broad scope has been discussed recently (Kerppola, 2008; Shyu and Hu, 2008; Vidi and Watts, 2009). This review will focus on the current use of BiFC to probe 7TM receptor signalling events, including the experimental criteria for successful application and its unique potential for unravelling the behaviour of complex multi-protein signal transducers.
Experimental advantages and limitations of BiFC assays
Assessed in vitro using purified proteins, the development of BiFC is a two-stage process (Figure 1A). First, the N and C terminal YFP fragments must refold into the native β-barrel tertiary structure when they are brought into close proximity. Untagged competitors which disrupt the protein–protein interaction can only prevent the onset of BiFC at early time points after association begins, suggesting that this step is relatively rapid (half-time seconds – minutes) and largely irreversible (Hu et al., 2002). However, this is not the rate-limiting step for actual detection of the BiFC complex. Once refolded, the endogenous chromophore of complemented YFP must mature before it becomes fluorescent, which is a slower autocatalytic reaction involving oxidation (half-time of several min; Hu et al., 2002). These kinetic profiles influence the design and interpretation of BiFC experiments. First, the protein–protein interactions detected must be sufficient in strength to enable refolding to take place. As a consequence, most signalling interactions assessed by BiFC have thus far been relatively stable ones, such as transcription factor dimerization (Hu et al., 2002; Hu and Kerppola, 2003; Grinberg et al., 2004; Vincenz and Kerppola, 2008), covalent modification by ubiquitin (Ub) (Fang and Kerppola, 2004; Ikeda and Kerppola, 2008), insulin-stimulated association between the kinase Akt and the Smad3 transcription factor (Remy et al., 2004) or 7TM receptor arrestin recruitment (MacDonald et al., 2006 and below). Nevertheless, it is possible for BiFC to detect more transient protein–protein binding, for example, between a tyrosine kinase SH3 domain and its targets (Morell et al., 2007), or cargo proteins and intracellular trafficking machinery (Nyfeler et al., 2005). It might even have potential to identify rapid 7TM receptor signalling events, such as G protein association with a half-time <1 s (Lohse et al., 2008). This ability rests with the consensus viewpoint that refolding of complemented YFP is irreversible, thus trapping even transiently formed complexes and committing them to generate a fluorescent signal on maturation (Hu et al., 2002; Nyfeler et al., 2005; Morell et al., 2007). Occasional reports provide exceptions, suggesting that BiFC might be reversible under some circumstances (Anderie and Schmid, 2007), but the refolding of YFP fragments into a well-ordered tertiary structure will clearly affect subsequent dissociation of the interacting proteins. Although tagged protein–protein interactions proceed unhindered until folding takes place (including rapid dissociation; Hu et al., 2002), BiFC experiments are thus best interpreted as measures of protein–protein association. Correspondingly, the BiFC complex essentially behaves as a fusion between the protein partners once formed. This should be borne in mind when interpreting subcellular localization of such complexes after formation, to ensure that this also reflects the behaviour of the untagged proteins following interaction.
The second slower step in developing BiFC, that of chromophore maturation, plays no role in the types of protein–protein association that can be trapped and detected, other than to set the sensitivity of the assay. It is not necessary for all the refolded trapped complexes to develop into fully fledged fluorescent proteins, provided that a sufficient signal (increased with incubation time) is generated by those that mature. Clearly, there is an appreciable delay between the molecular detection step (refolding) and the generation of the fluorescent signal measured as a response (chromophore maturation). Thus, no BiFC assay is currently a ‘real-time’ kinetic measurement of protein–protein association. There are indications that this technical limitation may be overcome in future. Some GFP N terminal fragments are reported to have a preformed chromophore but remain non-fluorescent when purified in vitro, thus making BiFC a one-step process entirely dependent on fast refolding (Demidov et al., 2006). However, this advance has not yet been demonstrated in living cells.
BiFC can be obtained between fragments of the major Aequorea variants [cyan fluorescent protein (CFP), GFP and YFP] and homologous Anthozoa or Discosoma red-shifted proteins (mCherry, monomeric red fluorescent protein), covering a useful spectrum of fluorescence excitation and emission wavelengths (Hu et al., 2002; Hu and Kerppola, 2003; Jach et al., 2006; Fan et al., 2008). As indicated in Figure 1B, there are relatively few known points at which GFP can be successfully split. These all reside in the linkers between the β-sheets that line the β-barrel, with the most common position being between strands 7 and 8. Even the largest GFP fragments are non-fluorescent by themselves and are thus suitable for BiFC in principle (Cabantous and Waldo, 2006). The paucity of current options may reflect structural importance of other available linker regions, the extent to which the disordered fragments impede expression of the fusion protein and the ability of different fragments to refold efficiently on contact. In particular, YFP fragments and those from the Dictyosoma red protein variants exhibit temperature sensitivity, often requiring incubation at a lower temperature, typically 30°C, to improve complementation (Hu and Kerppola, 2003; Jach et al., 2006; Fan et al., 2008). However, in the case of YFP, additional mutations can improve folding of the full-length protein, for example, those in Venus (Nagai et al., 2002); Figure 1B) or superfolder variants (Ottmann et al., 2009). Such mutations also enhance fragment complementation efficiency and allow experiments in mammalian cells to be performed at 37°C (MacDonald et al., 2006; Vidi et al., 2008a; Ottmann et al., 2009). This often leads to a trade-off in any BiFC experimental design. The preference will invariably be for N and C terminal fragments with the required spectral characteristics, which also offer the greatest complementation efficiency at physiological temperature. However, these same properties, which enhance BiFC speed and sensitivity, may also be responsible for increasing self-association between the fragments, independent of any interaction between the tagged proteins. This is particularly the case for the reported fragments of the superfolder variant of GFP (Figure 1B), which readily combine spontaneously (Cabantous and Waldo, 2006). In common with all protein–protein interaction assays, a key element in the development of successful BiFC approaches is the identification of appropriate controls and paradigms, which identify and limit non-specific interactions and false positives. Ideally, such controls involve precise mutations which eliminate the interactions between the proteins under study, for example, at the binding interface of the Fos–Jun transcription factor heterodimer, and the Ub ligation sites to prevent associated Jun–Ub BiFC (Hu et al., 2002; Fang and Kerppola, 2004). When applied to appropriate signalling cascades, background BiFC is often also limited because the proteins under study are compartmentalized until a specific stimulus is applied, such as a membrane-bound receptor, which recruits a cytoplasmic partner on agonist activation.
Table 1 compares the characteristics of BiFC with that of BRET/FRET, the major imaging methods that currently probe protein–protein interactions in living cells. In BRET/FRET techniques, one protein partner is fused to a donor – typically CFP for FRET, excited by short-wavelength laser excitation, or luciferase for BRET, stimulated by addition of chemical substrate. In each case, an appropriate acceptor (such as YFP) tagged to the interacting protein partner is excited by donor emission (resonance energy transfer), when the donor and acceptor are close enough together (<10 nm). BRET and FRET offer a significant advantage over BiFC in that measurements occur in real time and are fully reversible (Milligan and Bouvier, 2005; Lohse et al., 2008). However, the analysis of BRET/FRET experiments is relatively complex, because both donor and acceptor emission must normally be monitored, using appropriate controls to extract the relatively small energy transfer signal from bleedthrough between the channels. The possibility of homo-FRET between identical fluorophores should also be eliminated. Relatively high expression levels are required, and possible ‘bystander’ energy transfer from non-specific interactions must also be eliminated as a mechanism (James et al., 2006). In contrast, BiFC is simple to measure using the single excitation/emission characteristics of the parent protein, resulting in sensitivity that approaches endogenous levels of protein expression and allowing co-localization with other fluorescent probes with different spectra. Aspects of the slow folding and maturation process actually favour trapping of specific interactions. Moreover, a general feature of complementation assays, unlike FRET, is that they are independent of the relative orientation of the different tags while retaining similar distance constraints (Remy et al., 1999). As discussed below, BiFC responses are highly suitable for analysis by advanced imaging techniques and high-content analysis, and can extend investigation of signalling complexes to more than two protein partners, using multicolour BiFC or BiFC combined with FRET.
Table 1.
Characteristics of BiFC compared with resonance energy transfer
| Characteristic | Resonance energy transfer | BiFC |
|---|---|---|
| Excitation/emission spectra | Analysis of both donor and acceptor spectra preferable | Single excitation/emission wavelengths as for full-length protein (range CFP to mCherry). High-content and advanced imaging techniques used for fluorescent proteins can also, in principle, be applied to BiFC. |
| Dynamic range | Limited – higher construct expression required | Large – sensitive to endogenous levels of expression |
| Kinetics | Real-time, fully reversible response enables measurement of both association and dissociation | Proteins interact reversibly, but fast fragment refolding commits complex to generate BiFC irreversibly. Delayed maturation means assay is not real time. |
| Tag orientation and distance | Strictly defined distance limit for transfer between donor and acceptor fluorophores. Responses also influenced by fluorophore orientation. | Independent of tag orientation. Distance constraints not assessed for BiFC, but other complementation assays suggest similar (<10 nm) to FRET or BRET. |
| Negative controls | Tags must not alter protein function or interaction. ‘Bystander’ effects, channel bleedthrough and homo-FRET should be assessed. | Unfolded fragment tags must not disrupt function or expression. Slower kinetics favour specificity, but negative controls (e.g. non-interacting mutants) must quantify non-specific BiFC. |
| Cell context | Applicable to living or fixed cells | Applicable to living or fixed cells. Complementation can require incubation at lower temperature (30°C). |
| Subcellular localization | Possible with some FRET techniques, for example, fluorescence lifetime imaging. | Straightforward co-localization with other fluorophore labels. BiFC generates a fusion protein which may distribute differently from the parent complex. |
| Multi-protein complexes | Three-way competitive interactions can be assessed by reduction in response after titration of the competitor. Sequential FRET possible for cooperative assemblies, but complex to analyse. | Multicolour BiFC available for competitive association, and BiFC can be combined with BRET or FRET for multicomponent complexes. |
Appropriate references are provided in the text.
BiFC, bimolecular fluorescence complementation; BRET, bioluminescence resonance energy transfer; CFP, cyan fluorescent protein; FRET, fluorescence resonance energy transfer.
Quantitative BiFC imaging by high-content screening
The full potential of BiFC assays is realized if responses can be quantified, for example, in terms of the frequency and intensity of cells expressing complemented YFP. This provides the best indication of specificity in comparison to background controls, and is also essential for the quantitative assessment of drug action desired by pharmacologists. Because BiFC detection is straightforward, it can, in principle, be measured by any sensitive method that quantifies fluorescence. For example, flow cytometry can determine the extent to which ligand treatment alters the BiFC protein–protein association under study (Morell et al., 2007). An additional advantage of image analysis using confocal or widefield microscopy is that it details not only the number and brightness of the cells, but also the subcellular location of the formed complexes. When performed manually, such experiments can be time consuming and inherently low throughput. However, this can be overcome with automated image acquisition, capable of rapid unbiased processing of fields of 500 cells or more with quantitative cell-by-cell analysis. If also applied in a plate-reader format, these methods become suitable for high-content screening and for uncovering detailed ligand pharmacology.
The first illustration of such screening included 49 different BiFC association detectors positioned on a variety of different cellular signalling pathways, using protein partners fused predominantly to Venus YFP fragments (MacDonald et al., 2006; Michnick et al., 2006). They included the first BiFC reporters directly relevant to 7TM receptor signalling pathways (β2-adrenoceptor : β-arrestin2 and ERK signalling intermediates, such as H-Ras : Raf-1 and Raf-1 : mitogen-activated protein kinase kinase 2) together with more general fate indicators for cell cycle checkpoints, mitogenesis and apoptosis. This assay panel defined a biochemical signalling network, which could then assess the coordinated effects of over a hundred individual drugs from six therapeutic classes. Structurally similar molecules, together with those sharing molecular targets, clustered together in the panel analysis because they perturbed overlapping sets of signalling interactions. However, the predictive power of this approach was not restricted to existing structure function relationships. When comparing drugs with the same desired mechanism of action, analysing the breadth of cellular effects observed demonstrated those specific candidates with the narrowest spectrum of action. Conversely, some drugs exhibited clustering profiles suggesting a particular cellular outcome (e.g. inhibition of proliferation), in the absence of other structural or mechanistic similarities. These agents were investigated further, confirming the previously unrecognized anti-proliferative activity. BiFC-based drug screens do have potential drawbacks, for example, when screening fluorescent compounds that may interfere with the readout, and they are still at an early stage compared with microarray profiling of gene transcription. However, they have a crucial advantage in that BiFC sensors can be placed at many points in the signalling space surrounding the anticipated site of action, from the target protein itself, through intermediate cascades to the effectors of the response.
Extracting pharmacology from BiFC – the 7TM receptor: β-arrestin2 assay as an example
We have made a detailed examination of high-content BiFC as a means of quantifying one important 7TM receptor signalling event, the recruitment of β-arrestin2 (Figure 2). The speed and sensitivity for trapping this interaction were maximized by using overlapping fragments of Venus YFP, repeating beta strand 8 in both N and C terminal tags (Yn, Yc; Figure 1B). Dual stable transfected cell lines were then developed, which expressed example 7TM receptors fused at the C terminus to Yc [β2-adrenoceptor, neuropeptide Y (NPY) receptors] in combination with β-arrestin2-Yn. The basal endosomal BiFC signal in these cells is reduced by physical separation of unstimulated 7TM receptors (membrane) and arrestins (cytoplasm), decreasing non-specific complementation. Agonist stimulation then increases BiFC fluorescence in the same perinuclear endosomal compartments. Using images recorded from each well of a 96-well plate, the number and intensity of these compartments can be quantified by unbiased granularity analysis, and this enables full-time and concentration-response data for different ligands to be obtained.
Figure 2.
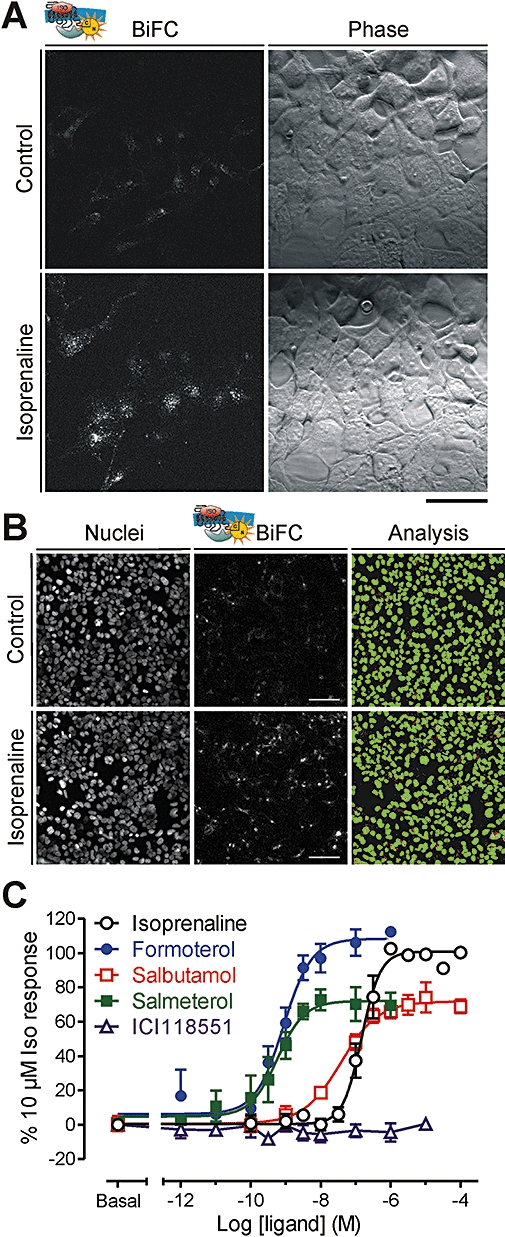
Bimolecular fluorescence complementation (BiFC) imaging assay for seven transmembrane domain receptor–β-arrestin2 interaction. Dual stably transfected HEK293 cells were established, which expressed β-arrestin2-Yn and C terminal Yc-tagged β2-adrenoceptors. In (A), the same field of living cells was imaged before addition of agonist, and then again following 60 min isoprenaline treatment (10 µM). Yellow fluorescent protein (YFP) BiFC acquisition was performed on a Zeiss LSM 510 (Jena, Germany) confocal microscope (63× plan apochromat/1.4 NA oil objective) using 514 nM excitation and a 530 nM LP emission filter, and the same laser power and gain settings. Scale bar: 40 µm. In (B), automated images were acquired from cells seeded into a 96-well plate (IX ultra platereader, Molecular Devices, Sunnyvale, CA, USA) of both the nuclear stain (H33342) and YFP BiFC fluorescence (scale bar: 80 µm). As for the high-resolution confocal images in (A), 10 µM isoprenaline (37°C, 60 min) increased BiFC in perinuclear vesicular compartments. Granularity analysis classified puncta by size (white dots 1–3 µm diameter, red ‘vesicles’ 3 µm + diameter), and normalized to nuclear-based cell count (green). Quantification as vesicle average intensity per cell, expressed as a percentage of the 10 µM isoprenaline response, enabled concentration response curves to different adrenoceptor ligands to be constructed (C, pooled responses, n= 4 or more). Full agonists (isoprenaline and formoterol), partial agonists (salbutamol and salmeterol) and antagonist/inverse agonist ligands (e.g. ICI118551) can be separated in this manner.
In these experiments, the time course of the agonist-stimulated response is artificially slowed by the delayed maturation of complemented YFP. For example, NPY-stimulated Y1 receptor-β-arrestin2 BiFC at 37°C (t1/2∼ 10 min for 100 nM) is less rapid than Y1 receptor internalization measured by similar granularity analysis (t1/2∼ 2 min), despite such trafficking being arrestin dependent. Equally, while Y1 receptor internalization is fully reversible after agonist removal, Y1 receptor-β-arrestin2 BiFC appears to be a largely irreversible process, in effect, forming a receptor-β-arrestin fusion protein (Holliday et al., 2008). Nevertheless, the principle requirement for this assay is an accurate comparison of agonist potency and relative maximum response for driving the initial association between receptor and β-arrestin2. In this respect, the main determinant is the early Yn and Yc refolding event, which commits the formed complex to generate a BiFC signal. This must be sufficiently rapid to trap the transient receptor-β-arrestin complex on formation, without unduly influencing the ability of agonists to promote this interaction in the first place. A number of lines of evidence suggest that these criteria are largely fulfilled. For example, agonist potencies for stimulating Y1 receptor-β-arrestin2 BiFC remain invariant, even when employing different BiFC fragment pairs expected to have altered refolding kinetics. They are also comparable to equivalent measurements for downstream receptor internalization, and studies of competitive antagonism provide realistic pA2 values for antagonist affinity (Holliday et al., 2008). For β2-adrenoceptor recruitment of β-arrestin2, the BiFC assay also separates both full and partial agonists of differing potency (Figure 2C; N.D. Holliday et al., unpubl. obs.), broadly in agreement with other assays that use reversible complementation or energy transfer approaches (Angers et al., 2000; Carter and Hill, 2005; Charest et al., 2005). An expected limitation is the detection of inverse agonism, at least for short-term ligand treatments (e.g. for ICI118551, Figure 2C), because pre-existing receptor arrestin BiFC complexes are stable and likely to dissociate slowly on inactivation, if at all. Irreversibility can also become an important consideration because some ligands and 7TM receptors (such as the β2-adrenoceptor) recruit β-arrestin transiently, while others form stable receptor-β-arrestin complexes which persist in endosomes (Oakley et al., 2001). The extent to which an individual ligand-receptor combination delivers a particular profile of β-arrestin-dependent signalling (e.g. long-term ERK activation on endosomes; Gurevich and Gurevich, 2006) might therefore depend on β-arrestin dissociation kinetics, as well as the initial recruitment measured by BiFC.
The BiFC assay also provides quantitative information on receptor determinants involved in arrestin binding. Figure 3 illustrates the effects of receptor mutations on NPY-stimulated Y1 and Y2 receptor association with β-arrestin2 (Kilpatrick et al., 2008). Y1 receptors require a phosphorylated C tail motif for β-arrestin binding (Holliday et al., 2005; Ouedraogo et al., 2008), and successive point mutations of the relevant amino acids reduce the maximal NPY-induced β-arrestin2 BiFC response, but not the potency of the agonist. Removing the phosphorylation trigger prevents the contribution to arrestin binding via its ‘phosphate sensor’, but not its ability to distinguish inactive and active conformations. In contrast, Y2 receptors recruit β-arrestin2 with lower affinity than Y1, as indicated by this and other approaches (Berglund et al., 2003), but a point mutation in the second intracellular loop is reported to restore Y2 receptor-β-arrestin2 interaction (Marion et al., 2006; Ouedraogo et al., 2008). Because this increases arrestin recognition of the activated agonist-occupied receptor, the effects of the H155P mutation are evident in the BiFC assay as both an increase in NPY potency, and elevated basal and maximal responses (Kilpatrick et al., 2008). Thus, by quantifying the differential effects of Y1 and Y2 receptor mutations in the BiFC assay, it is possible to provide data consistent with the dual sensor model of β-arrestin binding to 7TM receptors (Gurevich and Gurevich, 2006).
Figure 3.

Mutational analysis of Y receptor–β-arrestin2 interaction detected by bimolecular fluorescence complementation (BiFC). Dual stably transfected HEK293 cells established Yc-tagged neuropeptide Y (NPY) receptors at equivalent expression levels on a common β-arrestin2-Yn cell line. NPY-stimulated Y receptor/β-arrestin2 BiFC was measured by automated image acquisition and granularity analysis as described in Figure 2. The left hand panel (A) shows the effect of mutating a C tail-phosphorylated sequence in the Y1 receptor (Ser352–Thr361), previously identified as important for arrestin interaction (Holliday et al., 2005; Ouedraogo et al., 2008). Successive pairs of alanine mutations (2A, 4A and 6A illustrated in inset) reduce the maximal receptor association with β-arrestin2 induced by NPY (pEC50 range 8.55–8.73; n= 4+). On the right (B), the greater affinity of the Y2 receptor for β-arrestin2 after H155P mutation (intracellular loop 2; Marion et al., 2006) is revealed by an increase in NPY potency (Y2 pEC50: 7.18 ± 0.06, Y2H155P pEC50: 8.28 ± 0.18; n= 6) as well as elevated basal and maximum responses. Experiment details are provided in Kilpatrick et al. (2008).
Studying competitive signalling interactions by multicolour BiFC
Standard BiFC assays narrowly focus ligand-receptor pharmacology on the study of a single protein–protein association in a specific signalling pathway. In reality, these two component interactions in receptor signalling occur within a much broader context, in which receptors and their protein partners compete or collaborate in the assembly of multimeric signalling complexes. More advanced BiFC techniques, alone or in conjunction with resonance energy transfer, can provide greater insight into these competitive and cooperative multi-protein dynamics.
The N terminal BiFC fragment contains the amino acids which form the Aequorea fluorescent protein chromophore, and many of the residues which tune its spectral characteristics. Because the overall structure of different Aequorea variants is the same, different N terminal halves (normally YFP and CFP, Yn or Cn) are often able to complement with a common C terminal fragment, typically of CFP (Cc). The resulting BiFC complexes show either CFP (Cn + Cc) or YFP-like (Yn + Cc) fluorescence properties, and these are easily distinguished in fluorescence microscopy. Multicolour BiFC can thus probe competition between two different proteins, Yn or Cn labelled, for a common Cc-tagged partner (Figure 4A). Original investigations using this technique focused on the controlled formation of transcription factor homodimers and heterodimers, a critical process in transcription regulation. For example, studies using isolated dimerization domains demonstrated the preference of Jun–Fos dimerization over the Jun–activating transcription factor 2 combination in the same living cell (Hu and Kerppola, 2003); equally, Mad–Myc heterodimers formed more readily than Mad homodimers (Grinberg et al., 2004). An adapted assay investigated regulation of Jun by Ub or the related small ubquitin-related modifier 1 (SUMO1) protein (Fang and Kerppola, 2004), modifications which are also relevant to 7TM receptor function. In this instance, the Jun–SUMO1 BiFC signal in nuclear foci was clearly spatially separated from the occurrence of Jun–Ub BiFC in lysosomes. This finding spurred identification of Jun–Ub as a selective signal for Jun degradation and illustrated how careful application of multicolour BiFC provides simultaneous information on both the frequency and localization of different protein complexes. As illustrated in these examples, successful multicolour BiFC requires controls which account for the speed of complementation of the different fragments and normalize for the fluorescent intensities of complemented CFP and YFP. Selectivity for one alternative protein–protein complex should be evident in reciprocal experiments, which reverse the tagged fragments. Expression of the common protein partner should be limiting, for example, by using inducible transfected systems, and addition of the tags must not affect distribution or interactions in a way which selectively inhibits one protein complex over another. Competing interactions only proceed until fragment refolding commits to a BiFC complex of a particular colour – multicolour BiFC is not a true equilibrium assay, although the findings are often consistent with other approaches (Hu and Kerppola, 2003). Misleading results can occur particularly if the alternative high-affinity complexes form at different times, with the earlier interaction favoured by the irreversibility of BiFC. Finally, studies on transcription factors and ubiquitination are both aided by a clearly defined interaction interface and, therefore, the availability of negative control mutants, which prevent association (Hu and Kerppola, 2003; Fang and Kerppola, 2004; Ikeda and Kerppola, 2008). While multicolour BiFC has exciting potential for many 7TM receptor signalling studies (e.g. competitive interactions between G protein and arrestins), such controls are less well defined. Nevertheless, multicolour BiFC has already shed light on two areas of 7TM receptor function, namely, the selective formation of Gβγ subunits and 7TM receptor dimers.
Figure 4.
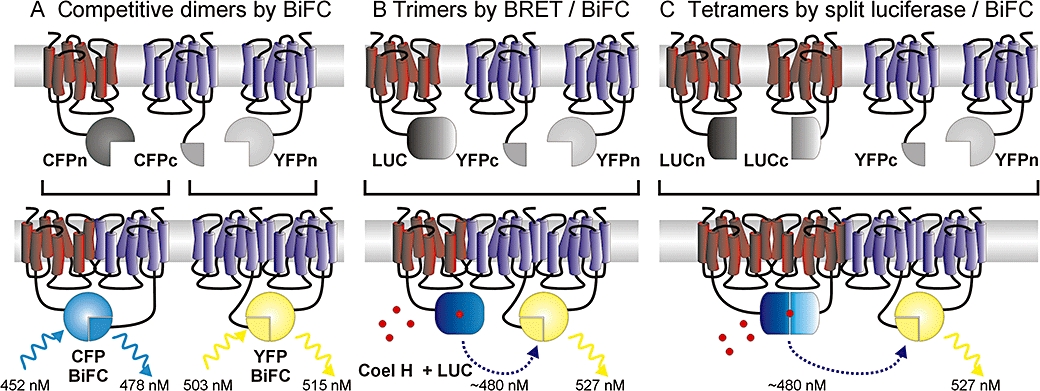
Three ways of examining seven transmembrane domain (7TM) receptor oligomers by bimolecular fluorescence complementation (BiFC). Multicolour BiFC allows competitive formation of alternative 7TM receptor dimers to be assessed by the development of cyan fluorescent protein (CFP) or yellow fluorescent protein (YFP)-like BiFC fluorescence (A). Alternatively, BiFC YFP formed by a 7TM receptor dimer can act as an energy transfer acceptor. Typically, Renilla luciferase (LUC) provides the donor for bioluminescence resonance energy transfer (BRET), carried as a full-length protein by a third 7TM receptor monomer (B) or reconstituted by complementation in a second 7TM receptor dimer (tetrameric interaction, C).
Multicolour identification of different Gβγ complexes
A means of selectively identifying individual G protein βγ complexes, which can be formed by stable pairwise association from 5 β and 12 γ subunits, is essential for increased understanding of the functional relevance of different isoforms. Hynes et al. (2004b) first addressed this problem by using YFP BiFC to examine different βγ combinations. They showed both increased BiFC fluorescence for some βγ partners and also differential localization for Gβγ containing β1 (plasma membrane) and β5 (intracellular). Importantly, the specificity of the assay was confirmed by the absence of BiFC for one subunit combination (β2γ1). Moreover, tagging Gβγ with a single complemented YFP improved plasma membrane targeting compared with co-expression of β and γ subunits each fused to full-length fluorescent protein, indicating an advantage of BiFC in maintaining functional Gβγ expression. Such function was evident in a subsequent study indicating agonist-stimulated internalization and trafficking of Gβ1γ7 BiFC complexes (Hynes et al., 2004a).
Although single-colour BiFC indicated that some Gβγ combinations might be preferred, multicolour BiFC provided convincing evidence for this under competitive conditions in living cells. Mervine et al. (2006) characterized the ability of β1-Cc to associate with different Yn-labelled γ subunits (β1γx YFP BiFC) in the presence of γ 2-Cn (β1γ2 CFP BiFC), in both single cells and populations. Once normalized for γ subunit expression levels, these data demonstrated significant variation (fivefold) in the relative affinities of each γ isoform for β1, although all combinations were similar in their ability to interact with Gsα. Using the same approach, a preference of β5 for γ2 over other γ subunits was identified, correlated to the relative abilities of the Gβ5γ isoforms to couple to phospholipase C (Yost et al., 2007). In contrast to other β subunits, β5 also interacts with regulator of G protein signalling proteins with a G protein gamma-like domain (e.g. RGS7). The separate intracellular distributions of Gβ5γ2 and Gβ5RGS7 complexes could be simultaneously identified (Yost et al., 2007). Moreover, Gβ5γ2 associated more with inactive Goα (indicated by plasma membrane redistribution), whereas Gβ5RGS7 showed greater interaction with a catalytically active Goα mutant. Thus, this use of BiFC uniquely identified how alternative protein complexes containing a common Gβ5 subunit could show different functional interactions with Gα.
Studying 7TM receptor homodimerization and heterodimerization by BiFC
7TM receptors are readily identified as oligomers in living cells, of which the simplest case is a dimer (Milligan and Bouvier, 2005; Maurel et al., 2008). However, for rhodopsin-like 7TM receptors in particular, the functional significance of dimerization remains unclear, given that monomeric 7TM receptors can bind ligands and G proteins in vitro (Whorton et al., 2007). Thus far, single-colour BiFC has been used to identify homodimers of adenosine A1 and A2A receptors (Briddon et al., 2008; Gandia et al., 2008; Vidi et al., 2008a,b;), histamine H1 receptors (Rose et al., 2008), dopamine D2 receptors (Guo et al., 2008; Vidi et al., 2008a) and α1b adrenoceptors (Lopez-Gimenez et al., 2007). Despite some evidence for 7TM receptor dimerization interfaces (e.g. TM I and IV; Lopez-Gimenez et al., 2007; Guo et al., 2008), these are not, in general, well defined or amenable to mutation. Nevertheless, controls for 7TM receptor BiFC dimers can be convincing. For example, some studies have shown that BiFC with unrelated, plasma membrane-localized 7TM receptors is much reduced and often, also, intracellularly retained (Guo et al., 2008; Vidi et al., 2008a,b;). A general disadvantage which BiFC shares with energy transfer approaches is that the proportion of fluorescent BiFC dimers is unknown compared with other receptor arrangements in the membrane, such as monomers. However, BiFC does identify a dimeric ‘unit’ unambiguously, in a way which allows investigation of its specific localization and functional properties (Briddon et al., 2008 and below).
There are also many reports of heterodimerization (Milligan and Bouvier, 2005), for example, suggesting several 7TM receptor partners for the adenosine A2A receptor (Briddon et al., 2008; Navarro et al., 2008; Vidi et al., 2008a). For a normal cell complement of 7TM receptors, this creates a complex network of possible interactions, the relative abundance of which may fine-tune the response to a particular ligand. Separate single-colour BiFC measurements can define heterodimers in principle (Briddon et al., 2008; Navarro et al., 2008). However, multicolour BiFC should enable quantitative comparison of the relative abilities of a 7TM receptor to form homodimers and heterodimers simultaneously within the same cell (Figure 4A; see also Vidi and Watts, 2009). The first study using this technique compared the relative proportions and subcellular location of the adenosine A2A receptor, dopamine D2L receptor homodimers or the A2A/D2L heterodimer (Vidi et al., 2008a). Specificity of both the homodimers and heterodimers as detected by BiFC were confirmed using a dopamine D1 receptor control. Using either A2A-Cc or D2L-Cc constructs as the common recipient for competition by A2A-Cn and D2L-Yn constructs, A2A/A2A, A2A/D2L and D2L/D2L dimers could all be identified and co-localized, principally to the plasma membrane (Vidi et al., 2008a). In addition, treatment with A2A or D2 agonists resulted in co-internalization of homodimers and heterodimers within the same cell. A key additional question in these experiments would be whether ligands rapidly alter the proportions of homodimers and heterodimers, but at present, information on such rapid dynamics is limited by the irreversibility of the multicolour BiFC complexes. However, with the adoption of similar approaches for evaluating Gβγ subunit competition over a range of expression levels (Mervine et al., 2006; Yost et al., 2007), future multicolour BiFC investigations of 7TM dimers may shed light on the relative importance of heterodimerization.
Cooperative assembly of multiprotein complexes – combining BiFC and resonance energy transfer
The majority of techniques that investigate protein–protein interactions only identify dimers. However, most signalling proteins have multiple binding domains and may be found as part of large, dynamic oligomeric complexes. Combining BiFC with resonance energy transfer techniques provides a novel strategy to investigate trimer or even tetramer formation, with similar measurement and analysis to established energy transfer assays (Figure 4B,C). For trimeric interactions, two associated proteins identified by YFP BiFC form the energy transfer acceptor, most commonly for a BRET donor tag (Renilla luciferase) carried by a third interacting protein. A positive BRET signal must be preceded by BiFC, and thus, it is indicative of a trimeric interaction. Because BiFC is irreversible, compared with dynamic real-time BRET, consideration should be given to which two proteins of the trimer are identified by BiFC (e.g. those most likely to form a stable interaction). For example, this strategy has been used to examine Gβγ interactions with other proteins, in which the stably interacting Gβ and Gγ subunits were first identified by YFP BiFC. Trimeric interactions with donor luciferase-fused receptors or Gα (Dupre et al., 2006), or downstream effectors (adenylate cyclase or Kir3.1, an inwardly rectifying potassium channel; Rebois et al., 2006) could then be detected by a specific BRET signal.
Combination of BRET and BiFC has particularly been applied to the question of whether 7TM receptors form higher order oligomers. This includes the association of single transmembrane receptor activity-modifying proteins with class B calcitonin receptor-like receptor dimers to form the functional calcitonin gene-related peptide receptor unit (Heroux et al., 2007). More often, such studies have probed multimeric interactions between 7TM receptor monomers (Figure 4B), whether as homotrimers (adenosine A2A receptors; Gandia et al., 2008) or heterotrimers composed of dopamine D2 and A2A receptors with either cannabinoid CB1 (Navarro et al., 2008) or metabotropic glutamate type 5 receptors (Cabello et al., 2009). Similar types of intermolecular interaction are expected between the 7TM receptor monomers, and so, reciprocity is a key experimental consideration – in other words, the tags should be interchangeable between the three monomers without impeding a specific BRET response. As for heterodimer studies, the evidence for a functionally relevant heterotrimeric species is strengthened by confirmation that such close three-way interactions occur for native receptors, as for the A2A/D2/mGluR5 combination in neurons (Cabello et al., 2009).
BiFC YFP is also a valid FRET acceptor, with CFP providing the donor emission. Vidi et al. (2008b) identified trimeric adenosine A2A receptors in this way, using both intensity measurements in a microplate assay system and fluorescence lifetime imaging for FRET analysis at subcellular resolution. Thus, in contrast to equivalent BRET–BiFC measurements (Gandia et al., 2008), this second method was able to confirm that the A2A receptor trimers were localized to the plasma membrane within single cells (Vidi et al., 2008b).
Complementation akin to BiFC can be obtained with luciferase enzyme fragments, which combine reversibly to reconstitute enzyme activity (Remy and Michnick, 2006; Villalobos et al., 2007). Luciferase complementation alone has been used to study 7TM receptor dimerization (chemokine receptors CXCR4 and CXCR7; Luker et al., 2009) and association with β-arrestin (CXCR4; Luker et al., 2008), measuring dynamic changes in response to ligands. More intriguing is the potential to combine luciferase complementation with BiFC to probe the existence of higher order 7TM receptor oligomers (Figure 4C). Such experiments require co-expression of four constructs at expression levels which minimize false positives. Nevertheless, D2 receptor tetramers have successfully been studied (Guo et al., 2008), demonstrating BRET between dimer pairs identified by the split luciferase and YFP complementation tags. This BRET signal was reduced significantly on mutation of the proposed transmembrane domain interface between the dimer pairs. While FRET experiments involving a dual BiFC approach are also theoretically possible (Vidi and Watts, 2009), the interchangeable nature of current CFP and YFP fragments (as in multicolour BiFC) may make this unfeasible at present.
BiFC in advanced imaging – studying membrane organization of 7TM receptor dimers by fluorescence correlation spectroscopy and fluorescence recovery after photobleaching
Theoretically, BiFC may be used in combination with any imaging technique which is amenable to the use of fluorescent proteins. The main qualification is that the complemented pairs under study only represent a fraction of the total transfected protein population. BiFC signals are, in general, less bright than normal fluorescent proteins, and as such, the sensitivity of both method and instrument needs to be taken into consideration. Here, two techniques are illustrated as examples, namely, fluorescence correlation spectroscopy (FCS) and fluorescence recovery after photobleaching (FRAP), which have been used to study the membrane organization and mobility of 7TM receptor BiFC dimers in the membranes of living cells. There are several reviews describing the use of FCS itself (Kim et al., 2007; Chiantia et al., 2009) and particularly, in its application to the field of 7TM receptors (Briddon and Hill, 2007), so here, only a brief introduction to the key features of FCS will be provided (Figure 5).
Figure 5.
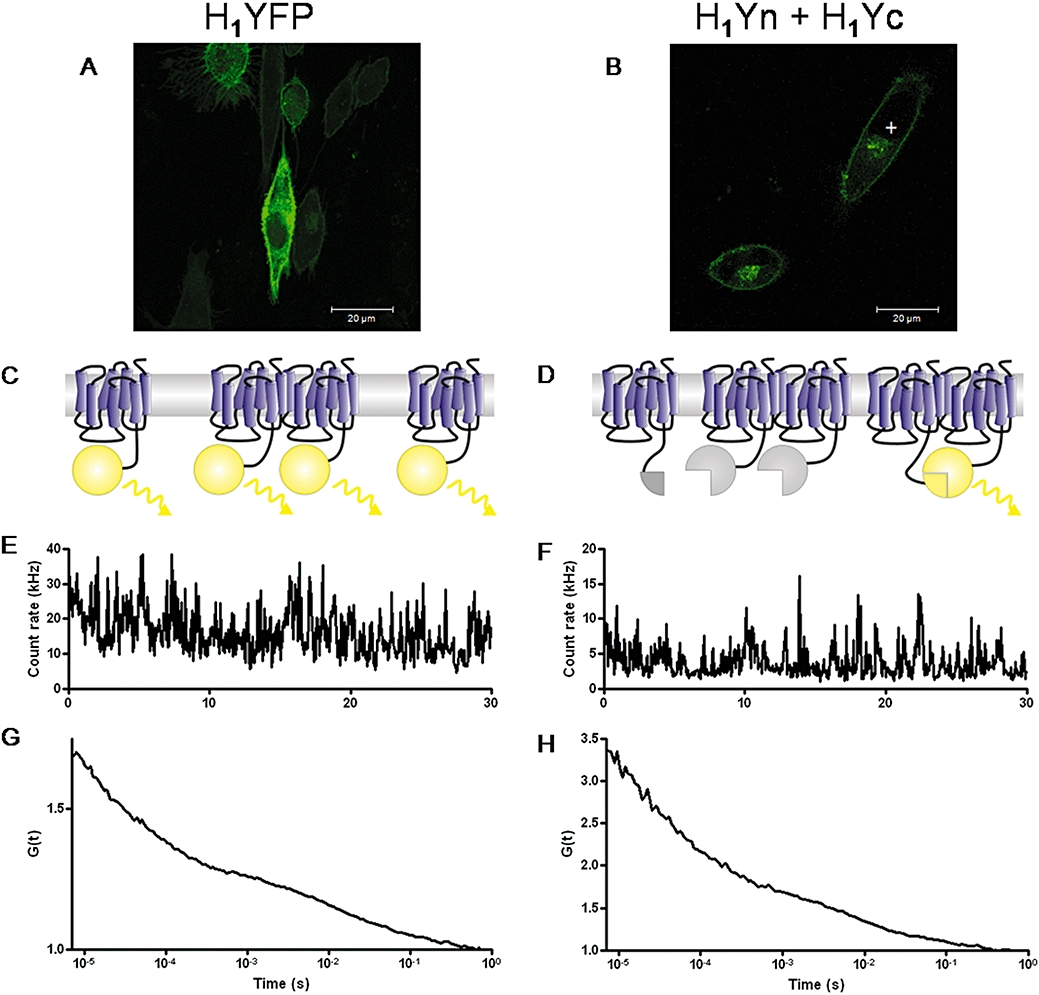
Analysis of histamine H1 receptor membrane diffusion by fluorescence correlation spectroscopy (FCS). Both H1-yellow fluorescent protein (YFP) (A) and H1-Yn + H1-Yc complemented fluorescence (BiFC) (B) are mainly localized on the plasma membrane of transiently transfected CHO-K1 cells. Fusion to YFP allows detection of all receptors, whether monomers or oligomers (C). In contrast, a minimum of a dimer is required for detection of BiFC, and such dimers will only be visible when complementary fragments are present in the complex (D). For FCS, fluctuations in fluorescence intensity are recorded with time (E, F) from the cell membrane above the nucleus (marked ‘+’ in A and B). Subsequent analysis produces autocorrelation curves (G, H) from which the diffusion coefficients of H1Yn + H1Yc BiFC dimers (7.0 ± 0.4 × 10⁻⁹ cm−2·s−1; n= 77 cells) and of H1-YFP (5.3 ± 0.2 × 10⁻⁹ cm−2·s−1; n= 59 cells) can be obtained (see Rose et al., 2008 for more experimental details). The significantly more rapid diffusion of the homo-oligomeric H1 BiFC receptor population suggests a subset of protein interactions or microdomain localization that differ from other receptor pools labelled only by H1-YFP.
FCS uses an inverted confocal microscope with a high numerical aperture lens to focus a laser to a diffraction-limited spot in a defined position on the cell membrane. A detection volume of approximately 1 fL (or ∼0.1 µm2 of membrane) is created by using a confocal pinhole in the image plane. Fluorescent species diffusing through this volume are excited and emit photons, which are detected by a sensitive detector, in a time-correlated manner, resulting in fluctuations in fluorescence. These fluctuations are then statistically analysed using an autocorrelation function, which essentially looks at the self-similarity of the fluctuation at a given time, t, and a small time (t +τ) later. The more rapidly a fluorescent species is moving, the higher will be the frequency of the fluctuations in fluorescence intensity and the more rapidly the self-similarity is lost. By analysing fluctuations for a large range of values of t and τ, the autocorrelation function is produced, which generally presents as a sigmoidal decay curve (Figure 5). Fitting of the autocorrelation curve to an appropriate diffusion model provides quantitative information about the concentration and mobility of the fluorescent species.
The key parameters available from FCS are obtained from this autocorrelation curve (Figure 5). First, G(0), the theoretical intercept with the y-axis is inversely proportional to the number of particles present. The inverse nature of this relationship thus makes FCS a highly sensitive technique at low expression levels where the particle number is low, such as with BiFC. Second, the midpoint of the decay of the autocorrelation curve gives the average dwell time in the confocal volume, providing information about receptor mobility and from which the diffusion coefficient can be determined. In a freely diffusing system, the dwell time is proportional to the cubed root of the mass of the species; relatively large change in mass is required to see a change in diffusion time (e.g. an eightfold increase in mass is required to double the diffusion time). However, receptors are not freely diffusing, but associate with a number of other proteins and may be restricted to membrane microdomains, and it is the mass of this protein complex, not the receptor itself, which will affect diffusion time. Other factors, such as dynamic protein–protein interactions and inclusion in, or exclusion from, membrane microdomains may also affect the diffusion coefficient. If there are two sufficiently distinct diffusing species, for example, more rapidly and slowly diffusing pools of receptors (or a photophysical effect such as fluorescent protein blinking in addition to receptor diffusion), then these autocorrelation curves are additive, so the separate diffusion times and particle numbers are readily distinguishable.
FCS has been used in combination with YFP and BiFC-labelled adenosine A1 and A2A receptor combinations to compare their behaviour. Where cells are transfected with either the A1 or A2A receptor fused to YFP, every receptor has a fluorescent tag. Hence, provided they are mobile, all expressed receptors are detected with FCS and contribute to the diffusion time, whether as monomers, dimers or higher order oligomers. However, where receptors are fused to N-terminal or C-terminal fragments of YFP and co-expressed to give homodimers or heterodimers, complementation is required for the fluorescent protein to be reconstituted. Thus, the minimal unit that can be detected is a dimer, although receptors may also exist as higher order oligomers. Therefore, the diffusion behaviour of the total receptor population can be compared with that of a purely homo-oligomeric or hetero-oligomeric receptor population. Greatest differences in diffusion time were seen between the A1R-YFP and the hetero-oligomeric A1-A2A receptor BiFC populations, which most likely reflect changes in protein–protein interactions, for example, with signalling molecules or scaffold proteins, or differences in membrane microdomain localization (Briddon et al., 2008). We have now also shown that similar differences can be observed when this strategy is applied to compare YFP-labelled H1 receptors and H1 receptor BiFC dimers (Figure 5; Rose et al., 2008).
One limitation of the FCS technique is that in order to generate the required intensity fluctuations, the fluorescent particles must move. Thus, immobile receptor populations are not detected by FCS. However, FRAP provides a means to examine this static population (Reits and Neefjes, 2001). High laser powers bleach a 10–20 µm2 area of the membrane, irreversibly inactivating the fluorophores within it. Subsequent fluorescence recovery in the bleached area therefore indicates diffusion of the mobile receptor from the adjacent unbleached region. In contrast, failure to fully restore fluorescence demonstrates a bleached immobile population of receptors which cannot be replaced. Hence, FRAP provides quantitative information both about the diffusion of mobile receptors (from the recovery time) and the immobile fraction of receptors (from the extent of the recovery). When the total histamine H1 receptor-YFP and H1-Yn/H1-Yc receptor populations were compared using FRAP, the proportion of immobile H1-YFP receptors was significantly lower than for BiFC-identified oligomeric receptors (R.H. Rose et al., unpubl. obs.). Thus, complementary FCS and FRAP approaches using the same receptor constructs build a full picture of how the H1 receptor BiFC oligomer behaves in the membrane, indicating a larger static population combined with mobile dimers, which move faster than the receptor population as a whole. These observations form the basis for future studies that identify why the constraints on diffusion differ for monomeric, dimeric and oligomeric 7TM receptors.
Conclusions
Exploitation of the repertoire of 7TM receptor pathways requires development of ligands, which modulate and direct this signalling with increasing specificity. Underlying such progress will be sensitive methods which detect the formation of the protein complexes at the heart of 7TM receptor function. We have highlighted the potential of BiFC-based imaging in this regard, but it is potential which is only just beginning to be realized. The essential simplicity of BiFC opens up opportunities for new high-content assays in drug discovery, the exploration of competitive and multimeric signalling complexes, and the application of advanced imaging approaches to study receptor behaviour. BiFC will always require recombinant fusion protein partners and cell transfection, but BiFC signalling sensors might, in the future, probe the function of endogenous 7TM receptors in a more physiological environment, for example, if introduced into primary cells. There are improvements to the technique to be pursued, principally to enable more rapid and reversible complementation. These are realistic goals, given the way in which the capabilities of GFP have been expanded over the past 20 years, and their achievement will allow real-time BiFC applications capable of following the fast dynamics of multi-protein complexes.
Acknowledgments
We would like to thank Laura Kilpatrick and David Lake in Nick Holliday's lab for providing some of the experimental data, and Professor Steve Hill for critical reading of the manuscript. Work in Nick Holliday's and Steve Briddon's laboratories is supported by the Medical Research Council (grants G0700049 and G0800006), and Rachel Rose is an AJ Clark postgraduate student supervised by Steve Hill.
Glossary
Abbreviations:
- 7TM
seven transmembrane domain
- BiFC
bimolecular fluorescence complementation
- BRET
bioluminescence resonance energy transfer
- CFP
cyan fluorescent protein
- Cn + Cc
N and C terminal CFP fragments
- ERK
extracellular signal-related kinase
- FCS
fluorescence correlation spectroscopy
- FRAP
fluorescence recovery after photobleaching
- FRET
fluorescence resonance energy transfer
- GFP
green fluorescent protein
- NPY
neuropeptide Y
- YFP
yellow fluorescent protein
- Yn + Yc
N and C terminal YFP fragments
Conflict of interest
The authors state no conflict of interest.
References
- Anderie I, Schmid A. In vivo visualization of actin dynamics and actin interactions by BiFC. Cell Biol Int. 2007;31:1131–1135. doi: 10.1016/j.cellbi.2007.03.025. [DOI] [PubMed] [Google Scholar]
- Angers S, Salahpour A, Joly E, Hilairet S, Chelsky D, Dennis M, et al. Detection of β2-adrenergic receptor dimerization in living cells using bioluminescence resonance energy transfer (BRET) Proc Natl Acad Sci USA. 2000;97:3684–3689. doi: 10.1073/pnas.060590697. [DOI] [PMC free article] [PubMed] [Google Scholar]
- Berglund MM, Schober DA, Statnick MA, McDonald PH, Gehlert DR. The use of bioluminescence resonance energy transfer 2 to study neuropeptide Y receptor agonist-induced β-arrestin 2 interaction. J Pharmacol Exp Ther. 2003;306:147–156. doi: 10.1124/jpet.103.051227. [DOI] [PubMed] [Google Scholar]
- Briddon SJ, Gandia J, Amaral OB, Ferre S, Lluis C, Franco R, et al. Plasma membrane diffusion of G protein-coupled receptor oligomers. Biochim Biophys Acta. 2008;1783:2262–2268. doi: 10.1016/j.bbamcr.2008.07.006. [DOI] [PubMed] [Google Scholar]
- Briddon SJ, Hill SJ. Pharmacology under the microscope: the use of fluorescence correlation spectroscopy to determine the properties of ligand-receptor complexes. Trends Pharmacol Sci. 2007;28:637–645. doi: 10.1016/j.tips.2007.09.008. [DOI] [PMC free article] [PubMed] [Google Scholar]
- Cabantous S, Waldo GS. In vivo and in vitro protein solubility assays using split GFP. Nat Methods. 2006;3:845–854. doi: 10.1038/nmeth932. [DOI] [PubMed] [Google Scholar]
- Cabello N, Gandia J, Bertarelli DC, Watanabe M, Lluis C, Franco R, et al. Metabotropic glutamate type 5, dopamine D2 and adenosine A2a receptors form higher-order oligomers in living cells. J Neurochem. 2009;109:1497–1507. doi: 10.1111/j.1471-4159.2009.06078.x. [DOI] [PMC free article] [PubMed] [Google Scholar]
- Carter AA, Hill SJ. Characterization of isoprenaline- and salmeterol-stimulated interactions between β2-adrenoceptors and β-arrestin 2 using beta-galactosidase complementation in C2C12 cells. J Pharmacol Exp Ther. 2005;315:839–848. doi: 10.1124/jpet.105.088914. [DOI] [PubMed] [Google Scholar]
- Charest PG, Terrillon S, Bouvier M. Monitoring agonist-promoted conformational changes of β-arrestin in living cells by intramolecular BRET. EMBO Rep. 2005;6:334–340. doi: 10.1038/sj.embor.7400373. [DOI] [PMC free article] [PubMed] [Google Scholar]
- Chiantia S, Ries J, Schwille P. Fluorescence correlation spectroscopy in membrane structure elucidation. Biochim Biophys Acta. 2009;1788:225–233. doi: 10.1016/j.bbamem.2008.08.013. [DOI] [PubMed] [Google Scholar]
- Demidov VV, Dokholyan NV, Witte-Hoffmann C, Chalasani P, Yiu HW, Ding F, et al. Fast complementation of split fluorescent protein triggered by DNA hybridization. Proc Natl Acad Sci USA. 2006;103:2052–2056. doi: 10.1073/pnas.0511078103. [DOI] [PMC free article] [PubMed] [Google Scholar]
- Dupre DJ, Robitaille M, Ethier N, Villeneuve LR, Mamarbachi AM, Hebert TE. Seven transmembrane receptor core signaling complexes are assembled prior to plasma membrane trafficking. J Biol Chem. 2006;281:34561–34573. doi: 10.1074/jbc.M605012200. [DOI] [PubMed] [Google Scholar]
- Fan JY, Cui ZQ, Wei HP, Zhang ZP, Zhou YF, Wang YP, et al. Split mCherry as a new red bimolecular fluorescence complementation system for visualizing protein-protein interactions in living cells. Biochem Biophys Res Commun. 2008;367:47–53. doi: 10.1016/j.bbrc.2007.12.101. [DOI] [PubMed] [Google Scholar]
- Fang D, Kerppola TK. Ubiquitin-mediated fluorescence complementation reveals that Jun ubiquitinated by Itch/AIP4 is localized to lysosomes. Proc Natl Acad Sci USA. 2004;101:14782–14787. doi: 10.1073/pnas.0404445101. [DOI] [PMC free article] [PubMed] [Google Scholar]
- Gandia J, Galino J, Amaral OB, Soriano A, Lluis C, Franco R, et al. Detection of higher-order G protein-coupled receptor oligomers by a combined BRET-BiFC technique. FEBS Lett. 2008;582:2979–2984. doi: 10.1016/j.febslet.2008.07.045. [DOI] [PubMed] [Google Scholar]
- Ghosh I, Hamilton AD, Regan L. Antiparallel leucine zipper-directed protein reassembly: application to the green fluorescent protein. J Am Chem Soc. 2000;122:5658–5659. [Google Scholar]
- Grinberg AV, Hu CD, Kerppola TK. Visualization of Myc/Max/Mad family dimers and the competition for dimerization in living cells. Mol Cell Biol. 2004;24:4294–4308. doi: 10.1128/MCB.24.10.4294-4308.2004. [DOI] [PMC free article] [PubMed] [Google Scholar]
- Guo W, Urizar E, Kralikova M, Mobarec JC, Shi L, Filizola M, et al. Dopamine D2 receptors form higher order oligomers at physiological expression levels. EMBO J. 2008;27:2293–2304. doi: 10.1038/emboj.2008.153. [DOI] [PMC free article] [PubMed] [Google Scholar]
- Gurevich VV, Gurevich EV. The structural basis of arrestin-mediated regulation of G-protein-coupled receptors. Pharmacol Ther. 2006;110:465–502. doi: 10.1016/j.pharmthera.2005.09.008. [DOI] [PMC free article] [PubMed] [Google Scholar]
- Heroux M, Hogue M, Lemieux S, Bouvier M. Functional calcitonin gene-related peptide receptors are formed by the asymmetric assembly of a calcitonin receptor-like receptor homo-oligomer and a monomer of receptor activity-modifying protein-1. J Biol Chem. 2007;282:31610–31620. doi: 10.1074/jbc.M701790200. [DOI] [PubMed] [Google Scholar]
- Holliday ND, Kilpatrick L, Briddon SJ, Hill SJ. Quantitative analysis of neuropeptide Y Y1 receptor association with β-arrestin2 measured by bimolecular fluorescence complementation (BiFC) Proc Br Pharmacol Soc. 2008 doi: 10.1111/j.1476-5381.2010.00676.x. Available at http://www.pa2online.org/abstracts/Vol6Issue4abst007P.pdf (accessed 1 September 2009. [DOI] [PMC free article] [PubMed] [Google Scholar]
- Holliday ND, Lam CW, Tough IR, Cox HM. Role of the C terminus in neuropeptide Y Y1 receptor desensitization and internalization. Mol Pharmacol. 2005;67:655–664. doi: 10.1124/mol.104.006114. [DOI] [PubMed] [Google Scholar]
- Hu CD, Chinenov Y, Kerppola TK. Visualization of interactions among bZIP and Rel family proteins in living cells using bimolecular fluorescence complementation. Mol Cell. 2002;9:789–798. doi: 10.1016/s1097-2765(02)00496-3. [DOI] [PubMed] [Google Scholar]
- Hu CD, Kerppola TK. Simultaneous visualization of multiple protein interactions in living cells using multicolor fluorescence complementation analysis. Nat Biotechnol. 2003;21:539–545. doi: 10.1038/nbt816. [DOI] [PMC free article] [PubMed] [Google Scholar]
- Hynes TR, Mervine SM, Yost EA, Sabo JL, Berlot CH. Live cell imaging of Gs and the β2-adrenergic receptor demonstrates that both alphas and β1γ7 internalize upon stimulation and exhibit similar trafficking patterns that differ from that of the β2-adrenergic receptor. J Biol Chem. 2004a;279:44101–44112. doi: 10.1074/jbc.M405151200. [DOI] [PubMed] [Google Scholar]
- Hynes TR, Tang L, Mervine SM, Sabo JL, Yost EA, Devreotes PN, et al. Visualization of G protein βγ dimers using bimolecular fluorescence complementation demonstrates roles for both beta and gamma in subcellular targeting. J Biol Chem. 2004b;279:30279–30286. doi: 10.1074/jbc.M401432200. [DOI] [PubMed] [Google Scholar]
- Ikeda H, Kerppola TK. Lysosomal localization of ubiquitinated Jun requires multiple determinants in a lysine-27-linked polyubiquitin conjugate. Mol Biol Cell. 2008;19:4588–4601. doi: 10.1091/mbc.E08-05-0496. [DOI] [PMC free article] [PubMed] [Google Scholar]
- Jach G, Pesch M, Richter K, Frings S, Uhrig JF. An improved mRFP1 adds red to bimolecular fluorescence complementation. Nat Methods. 2006;3:597–600. doi: 10.1038/nmeth901. [DOI] [PubMed] [Google Scholar]
- James JR, Oliveira MI, Carmo AM, Iaboni A, Davis SJ. A rigorous experimental framework for detecting protein oligomerization using bioluminescence resonance energy transfer. Nat Methods. 2006;3:1001–1006. doi: 10.1038/nmeth978. [DOI] [PubMed] [Google Scholar]
- Kerppola TK. Bimolecular fluorescence complementation (BiFC) analysis as a probe of protein interactions in living cells. Annu Rev Biophys. 2008;37:465–487. doi: 10.1146/annurev.biophys.37.032807.125842. [DOI] [PMC free article] [PubMed] [Google Scholar]
- Kilpatrick L, Briddon SJ, Hill SJ, Holliday ND. Differential association of neuropeptide Y Y1 and Y2 receptors with β-arrestin2 revealed by bimolecular fluorescence complementation (BiFC) Proc Br Pharmacol Soc. 2008 doi: 10.1111/j.1476-5381.2010.00676.x. Available at http://www.pa2online.org/abstracts/Vol6Issue4abst062P.pdf (accessed 1 September 2009. [DOI] [PMC free article] [PubMed] [Google Scholar]
- Kim SA, Heinze KG, Schwille P. Fluorescence correlation spectroscopy in living cells. Nat Methods. 2007;4:963–973. doi: 10.1038/nmeth1104. [DOI] [PubMed] [Google Scholar]
- Lohse MJ, Nikolaev VO, Hein P, Hoffmann C, Vilardaga JP, Bunemann M. Optical techniques to analyze real-time activation and signaling of G-protein-coupled receptors. Trends Pharmacol Sci. 2008;29:159–165. doi: 10.1016/j.tips.2007.12.002. [DOI] [PubMed] [Google Scholar]
- Lopez-Gimenez JF, Canals M, Pediani JD, Milligan G. The α1b-adrenoceptor exists as a higher-order oligomer: effective oligomerization is required for receptor maturation, surface delivery, and function. Mol Pharmacol. 2007;71:1015–1029. doi: 10.1124/mol.106.033035. [DOI] [PubMed] [Google Scholar]
- Luker KE, Gupta M, Luker GD. Imaging CXCR4 signaling with firefly luciferase complementation. Anal Chem. 2008;80:5565–5573. doi: 10.1021/ac8005457. [DOI] [PMC free article] [PubMed] [Google Scholar]
- Luker KE, Gupta M, Luker GD. Imaging chemokine receptor dimerization with firefly luciferase complementation. FASEB J. 2009;23:823–834. doi: 10.1096/fj.08-116749. [DOI] [PMC free article] [PubMed] [Google Scholar]
- MacDonald ML, Lamerdin J, Owens S, Keon BH, Bilter GK, Shang Z, et al. Identifying off-target effects and hidden phenotypes of drugs in human cells. Nat Chem Biol. 2006;2:329–337. doi: 10.1038/nchembio790. [DOI] [PubMed] [Google Scholar]
- Marion S, Oakley RH, Kim KM, Caron MG, Barak LS. A β-arrestin binding determinant common to the second intracellular loops of rhodopsin family G protein-coupled receptors. J Biol Chem. 2006;281:2932–2938. doi: 10.1074/jbc.M508074200. [DOI] [PubMed] [Google Scholar]
- Maurel D, Comps-Agrar L, Brock C, Rives ML, Bourrier E, Ayoub MA, et al. Cell-surface protein-protein interaction analysis with time-resolved FRET and snap-tag technologies: application to GPCR oligomerization. Nat Methods. 2008;5:561–567. doi: 10.1038/nmeth.1213. [DOI] [PMC free article] [PubMed] [Google Scholar]
- Mervine SM, Yost EA, Sabo JL, Hynes TR, Berlot CH. Analysis of G protein βγ dimer formation in live cells using multicolor bimolecular fluorescence complementation demonstrates preferences of beta1 for particular gamma subunits. Mol Pharmacol. 2006;70:194–205. doi: 10.1124/mol.106.022616. [DOI] [PubMed] [Google Scholar]
- Michnick SW, Ear PH, Manderson EN, Remy I, Stefan E. Universal strategies in research and drug discovery based on protein-fragment complementation assays. Nat Rev Drug Discov. 2007;6:569–582. doi: 10.1038/nrd2311. [DOI] [PubMed] [Google Scholar]
- Michnick SW, MacDonald ML, Westwick JK. Chemical genetic strategies to delineate MAP kinase signaling pathways using protein-fragment complementation assays (PCA) Methods. 2006;40:287–293. doi: 10.1016/j.ymeth.2006.07.016. [DOI] [PubMed] [Google Scholar]
- Milligan G, Bouvier M. Methods to monitor the quaternary structure of G protein-coupled receptors. FEBS J. 2005;272:2914–2925. doi: 10.1111/j.1742-4658.2005.04731.x. [DOI] [PubMed] [Google Scholar]
- Morell M, Espargaro A, Aviles FX, Ventura S. Detection of transient protein-protein interactions by bimolecular fluorescence complementation: the Abl-SH3 case. Proteomics. 2007;7:1023–1036. doi: 10.1002/pmic.200600966. [DOI] [PubMed] [Google Scholar]
- Nagai T, Ibata K, Park ES, Kubota M, Mikoshiba K, Miyawaki A. A variant of yellow fluorescent protein with fast and efficient maturation for cell-biological applications. Nat Biotechnol. 2002;20:87–90. doi: 10.1038/nbt0102-87. [DOI] [PubMed] [Google Scholar]
- Nagai T, Sawano A, Park ES, Miyawaki A. Circularly permuted green fluorescent proteins engineered to sense Ca2+ Proc Natl Acad Sci USA. 2001;98:3197–3202. doi: 10.1073/pnas.051636098. [DOI] [PMC free article] [PubMed] [Google Scholar]
- Navarro G, Carriba P, Gandia J, Ciruela F, Casado V, Cortes A, et al. Detection of heteromers formed by cannabinoid CB1, dopamine D2, and adenosine A2A G-protein-coupled receptors by combining bimolecular fluorescence complementation and bioluminescence energy transfer. Sci World J. 2008;8:1088–1097. doi: 10.1100/tsw.2008.136. [DOI] [PMC free article] [PubMed] [Google Scholar]
- Nyfeler B, Michnick SW, Hauri HP. Capturing protein interactions in the secretory pathway of living cells. Proc Natl Acad Sci USA. 2005;102:6350–6355. doi: 10.1073/pnas.0501976102. [DOI] [PMC free article] [PubMed] [Google Scholar]
- Oakley RH, Laporte SA, Holt JA, Barak LS, Caron MG. Molecular determinants underlying the formation of stable intracellular G protein-coupled receptor-β-arrestin complexes after receptor endocytosis. J Biol Chem. 2001;276:19452–19460. doi: 10.1074/jbc.M101450200. [DOI] [PubMed] [Google Scholar]
- Ottmann C, Weyand M, Wolf A, Kuhlmann J. Applicability of superfolder YFP bimolecular fluorescence complementation in vitro. Biol Chem. 2009;390:81–90. doi: 10.1515/BC.2009.008. [DOI] [PubMed] [Google Scholar]
- Ouedraogo M, Lecat S, Rochdi MD, Hachet-Haas M, Matthes H, Gicquiaux H, et al. Distinct motifs of neuropeptide Y receptors differentially regulate trafficking and desensitization. Traffic. 2008;9:305–324. doi: 10.1111/j.1600-0854.2007.00691.x. [DOI] [PubMed] [Google Scholar]
- Pelletier JN, Campbell-Valois FX, Michnick SW. Oligomerization domain-directed reassembly of active dihydrofolate reductase from rationally designed fragments. Proc Natl Acad Sci USA. 1998;95:12141–12146. doi: 10.1073/pnas.95.21.12141. [DOI] [PMC free article] [PubMed] [Google Scholar]
- Rebois RV, Robitaille M, Gales C, Dupre DJ, Baragli A, Trieu P, et al. Heterotrimeric G proteins form stable complexes with adenylyl cyclase and Kir3.1 channels in living cells. J Cell Sci. 2006;119:2807–2818. doi: 10.1242/jcs.03021. [DOI] [PubMed] [Google Scholar]
- Reits EA, Neefjes JJ. From fixed to FRAP: measuring protein mobility and activity in living cells. Nat Cell Biol. 2001;3:E145–E147. doi: 10.1038/35078615. [DOI] [PubMed] [Google Scholar]
- Remy I, Michnick SW. A highly sensitive protein-protein interaction assay based on Gaussia luciferase. Nat Methods. 2006;3:977–979. doi: 10.1038/nmeth979. [DOI] [PubMed] [Google Scholar]
- Remy I, Montmarquette A, Michnick SW. PKB/Akt modulates TGF-beta signalling through a direct interaction with Smad3. Nat Cell Biol. 2004;6:358–365. doi: 10.1038/ncb1113. [DOI] [PubMed] [Google Scholar]
- Remy I, Wilson IA, Michnick SW. Erythropoietin receptor activation by a ligand-induced conformation change. Science. 1999;283:990–993. doi: 10.1126/science.283.5404.990. [DOI] [PubMed] [Google Scholar]
- Robert V, Gurlini P, Tosello V, Nagai T, Miyawaki A, Di Lisa F, et al. Beat-to-beat oscillations of mitochondrial [Ca2+] in cardiac cells. EMBO J. 2001;20:4998–5007. doi: 10.1093/emboj/20.17.4998. [DOI] [PMC free article] [PubMed] [Google Scholar]
- Rose R, Briddon SJ, Hill SJ. The effect of agonist activation and homodimerisation on the membrane diffusion of the human histamine H1 receptor. Proc Br Pharmacol Soc. 2008 Available at http://www.pa2online.org/abstracts/Vol6Issue4abst002P.pdf (accessed 1 September 2009. [Google Scholar]
- Rossi F, Charlton CA, Blau HM. Monitoring protein-protein interactions in intact eukaryotic cells by β-galactosidase complementation. Proc Natl Acad Sci USA. 1997;94:8405–8410. doi: 10.1073/pnas.94.16.8405. [DOI] [PMC free article] [PubMed] [Google Scholar]
- Shyu YJ, Hu CD. Fluorescence complementation: an emerging tool for biological research. Trends Biotechnol. 2008;26:622–630. doi: 10.1016/j.tibtech.2008.07.006. [DOI] [PubMed] [Google Scholar]
- Vidi PA, Chemel BR, Hu CD, Watts VJ. Ligand-dependent oligomerization of dopamine D(2) and adenosine A(2A) receptors in living neuronal cells. Mol Pharmacol. 2008a;74:544–551. doi: 10.1124/mol.108.047472. [DOI] [PubMed] [Google Scholar]
- Vidi PA, Chen J, Irudayaraj JM, Watts VJ. Adenosine A(2A) receptors assemble into higher-order oligomers at the plasma membrane. FEBS Lett. 2008b;582:3985–3990. doi: 10.1016/j.febslet.2008.09.062. [DOI] [PubMed] [Google Scholar]
- Vidi PA, Watts VJ. Fluorescent and bioluminescent protein-fragment complementation assays in the study of G protein-coupled receptor oligomerization and signaling. Mol Pharmacol. 2009;75:733–739. doi: 10.1124/mol.108.053819. [DOI] [PMC free article] [PubMed] [Google Scholar]
- Villalobos V, Naik S, Piwnica-Worms D. Current state of imaging protein-protein interactions in vivo with genetically encoded reporters. Annu Rev Biomed Eng. 2007;9:321–349. doi: 10.1146/annurev.bioeng.9.060906.152044. [DOI] [PubMed] [Google Scholar]
- Vincenz C, Kerppola TK. Different polycomb group CBX family proteins associate with distinct regions of chromatin using nonhomologous protein sequences. Proc Natl Acad Sci USA. 2008;105:16572–16577. doi: 10.1073/pnas.0805317105. [DOI] [PMC free article] [PubMed] [Google Scholar]
- Whorton MR, Bokoch MP, Rasmussen SG, Huang B, Zare RN, Kobilka B, et al. A monomeric G protein-coupled receptor isolated in a high-density lipoprotein particle efficiently activates its G protein. Proc Natl Acad Sci USA. 2007;104:7682–7687. doi: 10.1073/pnas.0611448104. [DOI] [PMC free article] [PubMed] [Google Scholar]
- Yost EA, Mervine SM, Sabo JL, Hynes TR, Berlot CH. Live cell analysis of G protein β5 complex formation, function, and targeting. Mol Pharmacol. 2007;72:812–825. doi: 10.1124/mol.107.038075. [DOI] [PubMed] [Google Scholar]