

Abstract
Background and purpose:
The introduction of fluorescence-based techniques, and in particular the development of fluorescent ligands, has allowed the study of G protein-coupled receptor pharmacology at the single cell and single molecule level. This study evaluated how the physicochemical nature of the linker and the fluorophore affected the pharmacological properties of fluorescent agonists and antagonists.
Experimental approach:
Chinese hamster ovary cells stably expressing the human adenosine A1 receptor and a cyclic 3′,5′ adenosine monophosphate response element-secreted placental alkaline phosphatase (CRE-SPAP) reporter gene, together with whole cell [3H]-8-cyclopentyl-1,3-dipropylxanthine (DPCPX) radioligand binding, were used to evaluate the pharmacological properties of a range of fluorescent ligands based on the antagonist xanthine amine congener (XAC) and the agonist 5′ (N-ethylcarboxamido) adenosine (NECA).
Key results:
Derivatives of NECA and XAC with different fluorophores, but equivalent linker length, showed significant differences in their binding properties to the adenosine A1 receptor. The BODIPY 630/650 derivatives had the highest affinity. Linker length also affected the pharmacological properties, depending on the fluorophore used. Particularly in fluorescent agonists, higher agonist potency could be achieved with large or small linkers for dansyl and BODIPY 630/650 derivatives, respectively.
Conclusions and implications:
The pharmacology of a fluorescent ligand was critically influenced by both the fluorophore and the associated linker. Furthermore, our data strongly suggest that the physicochemical properties of the fluorophore/linker pairing determine where in the environment of the target receptor the fluorophore is placed, and this, together with the environmental sensitivity of the resulting fluorescence, may finally decide its utility as a fluorescent probe.
This article is part of a themed section on Imaging in Pharmacology. To view the editorial for this themed section visit http://dx.doi.org/10.1111/j.1476-5381.2010.00685.x
Keywords: GPCRs, fluorescent ligands, molecular pharmacology, reporter genes, ligand binding, adenosine
Introduction
Adenosine A1 receptors are G protein-coupled receptors (GPCRs) that signal via Gi/o proteins to inhibit adenylyl cyclase activity and reduce the cellular levels of the second messenger, cyclic 3′,5′ adenosine monophosphate (cyclic AMP; Libert et al., 1992; Olah and Styles, 1995; Fredholm et al., 2001). Our current understanding of the molecular pharmacology of the adenosine A1-receptor has been deduced primarily from the use of radioligand binding techniques for studying ligand-receptor interactions and the measurement of intracellular second messenger generation. These experiments require large numbers of cells, and the pharmacological parameters that are deduced from them therefore represent the average for the cell population. However, it is now evident that adenosine A1 receptors are not uniformly distributed in the plasma membrane of individual cells but instead are located within membrane compartments and microdomains (Gines et al., 2001; Zajchowshi and Robbins, 2002; Helmreich, 2003). The introduction of fluorescence-based techniques, and in particular the development of fluorescent ligands, has now advanced the study of GPCR pharmacology to the single-cell and single molecule level (Emmerson et al., 1997; Harikumar et al., 2002; Baker et al., 2003; Briddon et al., 2004; Cordeaux et al., 2008; Daly and McGrath, 2003). For example, the application of techniques such as fluorescence correlation spectroscopy (FCS) has provided the means by which the diffusion of receptor species within defined membrane microdomains can by monitored in real time (Briddon and Hill, 2007), and we have used both fluorescent agonists and antagonists to study the adenosine A1 receptor using this technique (Briddon et al., 2004; Middleton et al., 2007).
The general approach to the design of a fluorescent ligand has been to take a parent molecule with known pharmacological properties and to add a fluorophore to it. Given the size of most fluorophores in relation to the active parent molecule, it would not be surprising to observe that this process may result in alterations to the pharmacology of the parent molecule (Baker et al., 2003; Middleton and Kellam, 2005; Middleton et al., 2007). An ideal fluorescent molecule would retain the properties of the parent ligand. For an antagonist, this would mean retaining high affinity and selectivity for the receptor under study, as well as the neutral antagonist or inverse agonist properties of the parent ligand. For an agonist, the fluorescent molecule must retain the efficacy of the parent ligand, and enough potency still to be pharmacologically useful. However, the addition of a fluorophore to a known ligand clearly alters its structure, and the pharmacology of the subsequent molecule needs to be carefully studied in order to determine its usefulness (Briddon et al., 2004; Middleton and Kellam, 2005; Cordeaux et al., 2008).
We have designed and synthesized a number of fluorescent agonist and antagonist probes of the human adenosine A1 receptor, which vary in both their fluorescent label and also in the composition and length of the linker that attaches the fluorophore to the parent molecule. Our aim was to investigate the effect of these variations on the pharmacology of these probes, and also their usefulness as A1 receptor probes in live cell imaging. Here, we show that the nature of both the linker and the fluorophore can exert major effects on the pharmacological properties of both agonists and antagonists.
Methods
Cell culture
Chinese hamster ovary (CHO) cells stably expressing both the human A1-adenosine receptor and a cyclic AMP response element-secreted placental alkaline phosphatase (CRE-SPAP) reporter gene were used throughout this study (CHO-A1; Baker and Hill, 2007). Cells were grown in Dulbecco's modified Eagle's medium/nutrient mix F12 (DMEM/F12) containing 10% fetal calf serum and 2 mM L-glutamine in a humidified 5% CO2: 95% air atmosphere at 37°C.
Synthesis of the fluorescent ligands
The chemical structures of all the compounds assessed in these experiments are shown in Figures 1 and 2. The synthesis of compounds (1)–(4) has been previously described (Middleton et al., 2007). Compound (5) was synthesized in an identical manner to that of (1)–(4), except the linker was installed using N1-benzyloxycarbonyl-1,8-diamino-3,6-dioxooctane. Compounds (6), (7) and (8) were synthesized in an identical manner to (2) via the key intermediate N6-(4-aminobutyl)-5′-ethylamino-5′-oxo-5′-deoxyadenosine (Middleton et al., 2007), except the fluorophores coupled to this intermediate were 4,4-difluoro-5,7-dimethyl-4-bora-3a,4a-diaza-s-indacene-3-propionic acid, succinimidyl ester (BODIPY FL SE, Invitrogen, Carlsbad, CA, USA) for (6) and dansyl chloride for (7), respectively. Compound (8) was synthesized in an identical manner to (2), except the modified fluorophore, N-dansyl-8-aminooctanoic acid was coupled to N6-(4-aminobutyl)-5′-ethylamino-5′-oxo-5′-deoxyadenosine using 1,1′-carbonyldiimidazole (CDI) in N,N-dimethylformamide (DMF). Compound (9) was synthesized in an identical manner to (2), except the terminal fluorophore was coupled using 6-((4,4-difluoro-5,7-dimethyl-4-bora-3a,4a-diaza-s-indacene-3-propionyl)amino)hexanoic acid, succinimidyl ester (BODIPY FL-X, SE). Compound (10) was synthesized in an identical manner to (7), except the linker was installed using N1-benzyloxycarbonyl-1,11-diaminoundecane. Compounds (11), (12) and (13) were all synthesized via the key intermediate N6-(4-aminobutyl)-5′-ethylamino-5′-oxo-5′-deoxyadenosine (Middleton et al., 2007), except the fluorophores coupled to this intermediate were Texas Red-X, succinimidyl ester (Invitrogen), Cy5 monosuccinimidyl ester (GE Healthcare, Little Chalfont, Buckinghamshire, UK) and EVOBlue 30 succinimidyl ester (Novabiochem, Nottingham, UK), respectively. Compound (14) has been previously described (Briddon et al., 2004). Compounds (15), (16), (18) and (19) were synthesized in an identical manner to (14), except the fluorophores coupled to xanthine amine congener (XAC) were Texas Red-X succinimidyl ester (Invitrogen), Cy5 monosuccinimidyl ester (GE Healthcare), EVOBlue 30 succinimidyl ester (Novabiochem) and dansyl chloride, respectively. Compound (17) was prepared by reacting XAC and suberic acid monomethyl ester in DMF in the presence of CDI. The crude 7-carboxyheptanoyl-XAC methyl ester product was saponified and reacted with 4,4-difluoro-5,7-dimethyl-4-bora-3a,4a-diaza-s-indacene-3-propionyl ethylenediamine, hydrochloride (BODIPY FL EDA, Invitrogen) using CDI as the coupling reagent in DMF. Compound (20) was synthesized by coupling XAC with N-dansyl-8-aminooctanoic acid using 1,1′-carbonyldiimidazole in DMF. Compound (21) was synthesized by reacting N-tbutyloxycarbonylaminocaproic acid with XAC using dicyclohexylcarbodiimide (DCC) as the coupling reagent in DMF. Following acidolytic removal of the tbutyloxycarbonyl protecting group, aminocaproyl-XAC was coupled with N-dansyl-6-aminohexanoic acid using diisopropylcarbodiimide as the coupling reagent in DMF. All compounds were purified using preparative thin-layer chromatography (pTLC), as previously described (Briddon et al., 2004; Middleton et al., 2007). Single peak purity of all compounds was confirmed by analytical reversed-phase high-performance liquid chromatography (recorded on a Waters Millennium 995 LC system, Milford, MA, USA) and the structures confirmed using high-resolution mass spectrometry (recorded on a Waters 2795 Separation Module/Micromass LCT platform).
Figure 1.
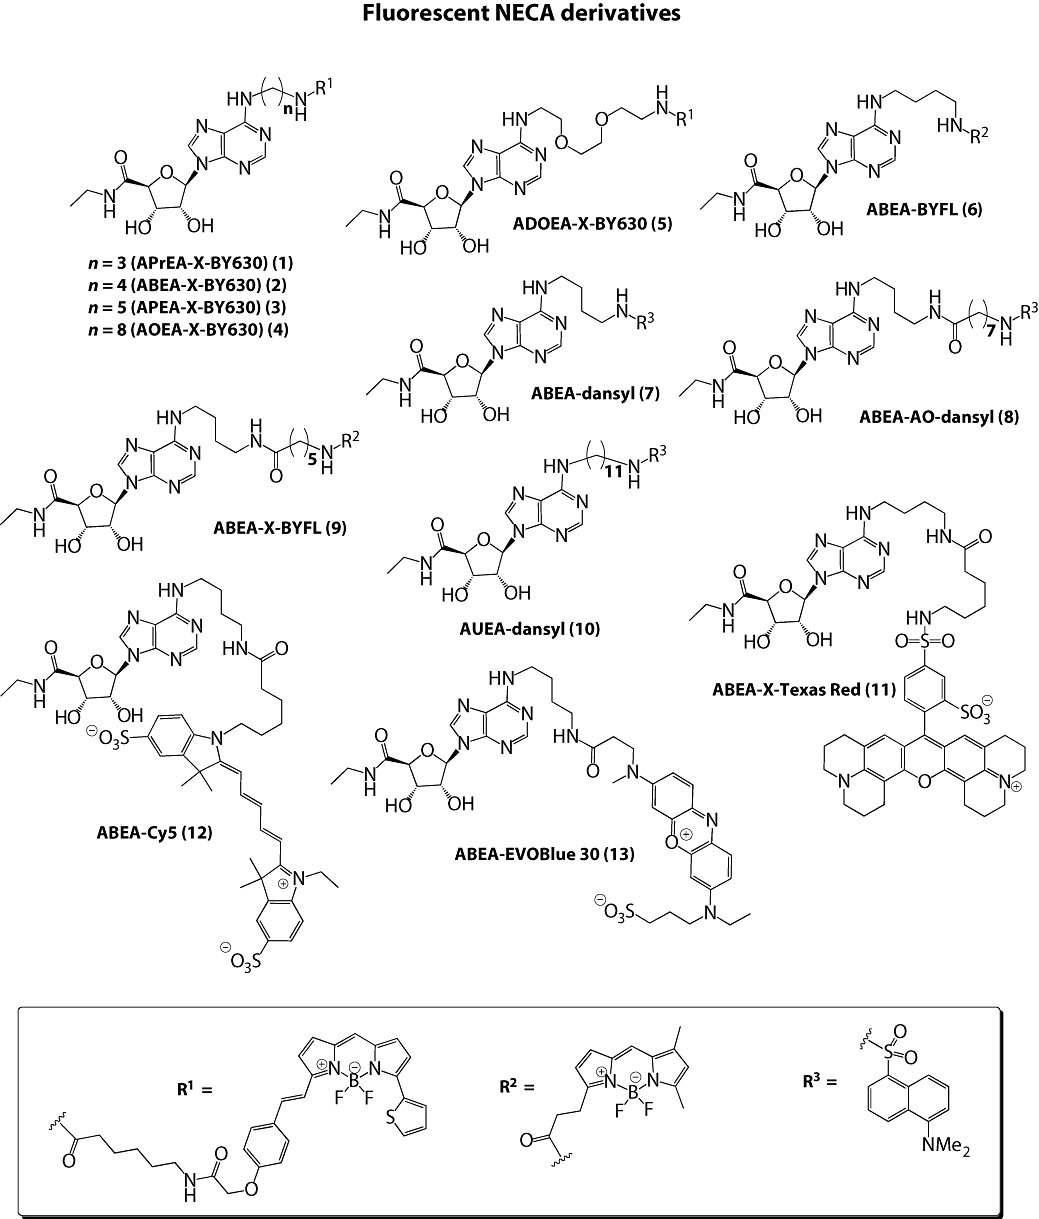
Chemical structures of fluorescent NECA derivatives. ABEA, N6-(4-aminobutyl)-5′-ethylamino-5′-oxo-5′-deoxyadenosine; ADOEA, N6-(8-amino-3,6-dioxaoctyl)-5′-ethylamino-5′-oxo-5′-deoxyadenosine; AO, 8-aminooctanoyl; AOEA, N6-(8-aminooctyl)-5′-ethylamino-5′-oxo-5′-deoxyadenosine; APEA, N6-(5-aminopentyl)- 5′-ethylamino-5′-oxo-5′-deoxyadenosine; APrEA, N6-(3-aminopropyl)-5′-ethylamino-5′-oxo-5′-deoxyadenosine; AUEA, N6-(11-aminoundecyl)-5′-ethylamino-5′-oxo-5′-deoxyadenosine; X, 6-aminohexanoyl.
Figure 2.
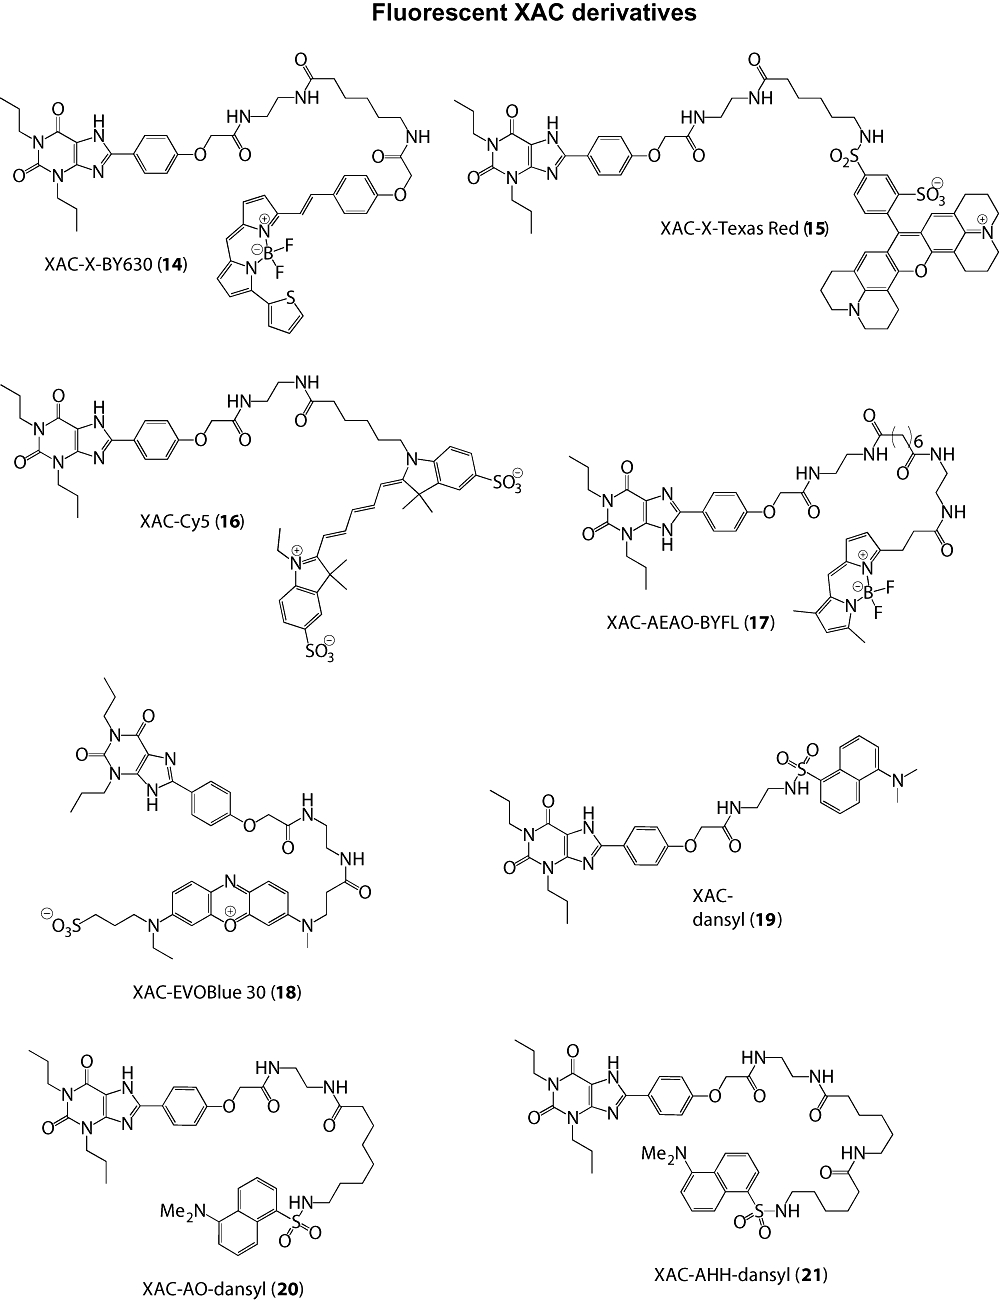
Chemical structures of fluorescent XAC derivatives. AEAO, 8-(2-aminoethylamino)-8-oxooctanoyl; AHH, 6-(6-aminohexanamido)hexanoyl; AO, 8-aminooctanoyl; X, 6-aminohexanoyl; XAC, xanthine amine congener.
[3H]-8-cyclopentyl-1,3-dipropylxanthine (DPCPX) whole cell binding
CHO-A1 cells were grown to confluence over 24 h in white-sided 96 well view plates. The following day, the media was removed and replaced with 100 µL serum-free media (i.e. DMEM/F12 containing 2 mM L-glutamine only) containing the competing ligand. This was immediately followed by the addition of 100 µL serum-free media containing 3H-DPCPX (to give a final concentration of 3H-DPCPX of 0.99–1.77 nM). Total and non-specific binding (as defined by 10 µM XAC) were measured in each experiment. Cells were then incubated for 2 h at 37°C in a humidified 5% CO2: 95% room air atmosphere. After 2 h, the media and drugs were removed, and the cells washed twice by the addition and removal of phosphate-buffered saline at 4°C (2 × 200 µL per well). A white base was then added to the plate, followed by 100 µL Microscint 20 (Perkin Elmer, Shelton, CT, USA) per well and a sealant film placed over the wells. The plates were then counted the following day on a Topcount (Perkin Elmer) for 2 min per well.
CRE-SPAP gene transcription
Cells were grown to confluence in 96-well plates in 100 µL DMEM/F12 containing 10% fetal calf serum and 2 mM L-glutamine. Once confluent, the media was removed and replaced with 100 µL serum-free media (DMEM/F12 containing 2 mM L-glutamine), and the cells incubated for a further 24 h. Where used, Pertussis toxin (PTX, 100 ng·mL–1) was added for this 24 h period. On the day of experimentation, the serum-free media was removed and replaced with 100 µL serum-free media ± antagonist at the final required concentration, and the cells incubated for 1 h at 37°C (5% CO2). Agonists (10 µL, diluted in serum free media) were then added to each well, and the plate incubated at 37°C for 10 min. Forskolin (10 µL) was then added to all but the basal wells, and the cells incubated for a further 5 h at 37°C (5% CO2). After 5 h, the media and drugs were removed, 40 µL serum-free media was added to each well, and the cells incubated for a further 1 h at 37°C. The plates were then incubated at 65°C for 30 min to destroy any endogenous phosphatases before the plates were then cooled to 37°C. 4-nitrophenyl phosphate (pNPP; 100 µL of 5 mM) in diethanolamine buffer was added to each well, and the plates incubated at 37°C until the yellow colour developed. The plates were then read on a Dynex MRX plate reader (Chelmsford, MA, USA) at 405 nm.
Confocal microscopy
Cells were grown to 100% confluency in Labtek 8-well chambered-coverglasses (Nalgene Nunc International, Scientific Laboratory Supplies, Nottingham, UK) in 400 µL DMEM-F12 media containing 10% FCS and 2 mM glutamine. The media was replaced with 400 µL N-2-Hydroxyethylpiperazine-N′-2-ethanesulfonic acid (HEPES)-buffered saline (HBS, Briddon et al., 2004) at room temperature. Confocal microscopy was performed using a Zeiss LSM510 laser-scanning microscope using either a Zeiss 40 × 1.3NA oil-immersion lens (Zeiss, Jena, Germany) or (for experiments using 364 nm excitation) a C-Apochromat 60 × 1.2NA water-immersion lens. Images of ligands were captured using the following optical configurations: BODIPY 630/650, Cy5 and EVOBlue 30 conjugates, 633 nm excitation, with emission captured through a 650LP filter; Texas Red conjugates, 543 nm excitation and 560LP emission filter; BODIPY-FL conjugates, 488 nm excitation and LP505 emission and dansyl conjugates 364 nm excitation and 475-525BP emission. In each case, a pinhole diameter of 1 Airy unit was used.
Initial images were captured in the absence of ligand to determine the level of auto-fluorescence under each excitation wavelength, and settings adjusted to minimize this. Single equatorial images were subsequently captured following a 5 min incubation of the indicated concentration of fluorescent ligands (in HBS). If membrane fluorescence was seen, the media and fluorescent drug were removed from the well and the cells washed by the addition and removal of 400 µL HBS. A further 400 µL HBS was added, and a further image captured. This was to ensure that any apparent membrane-localized fluorescence was indeed bound to the membrane and not just due to fluorescent ligand present in the media between cells. For any given experimental condition, a minimum of three different cell preparations on three different days with different drug dilutions were used. In the text, ‘n’ refers to the number of different complete experiments performed.
Excitation and emission spectra for fluorescent ligands
Ligand solutions were prepared in methanol or HBS (1 µM for XAC-X-BY630 and XAC-X-TR; 50 µM for XAC-dansyl). Excitation and emission spectra (2 nm intervals) were collected using a Flexstation 96-well fluorescence plate reader (Molecular Devices Corporation, Sunnyvale, CA, USA) using 100 µL of ligand dispensed in to UV-transparent flat-bottomed 96-well plates (Costar, Fisher Scientific, Loughborough, UK). Data analysis was performed in Softmax Pro 4.2 (Molecular Devices Corporation) and GraphPad Prism 4.0 (GraphPad, San Diego, CA, USA).
Data analysis
3H-DPCPX whole cell binding
Curves for inhibition of specific binding of 3H-DPCPX by a range of concentrations of 5′ (N-ethylcarboxamido)adenosine (NECA), XAC and the fluorescent adenosine A1 receptor ligands were fitted to the following equation:
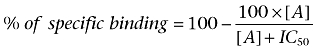 |
where [A] is the concentration of competing ligand, and IC50 is the concentration that inhibits specific binding by 50%. Antagonist dissociation constants (KB) were then determined from the following expression:
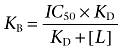 |
where [L] and KD are the concentration and dissociation constant of 3H-DPCPX, respectively. The KD value of 3H-DPCPX was previously determined in this cell line to be 3.61 nM (Baker and Hill, 2007).
Functional experiments
One-site concentration responses curves
Sigmoidal agonist concentration-response curves were fitted to the data using the following equation through computer-assisted non-linear regression using the programme GraphPad Prism 2:
 |
where EMAX is the maximal response, [A] is the agonist concentration and EC50 (or IC50) is the concentration of agonist that produces 50% of the maximal response.
Antagonist KD values were then calculated from the shift of the agonist concentration responses in the presence of a fixed concentration of antagonist using the following equation:
 |
where DR (dose ratio) is the ratio of the agonist concentration required to stimulate an identical response in the presence and absence of a fixed concentration of antagonist [B].
Two-site agonist curves
As many concentration response curves clearly contained two components, two-site analysis was required for most ligands. This was performed using the following equation:
 |
where basal is the response in the absence of agonist, FK is the response to a fixed concentration of forskolin, [A] is the concentration of A1-receptor agonist, IC50 is the concentration of agonist that inhibits 50% of the response to forskolin, SMAX is the maximum stimulation of the Gs-component of the response to the agonist and EC50 is the concentration of agonist that stimulates a half maximal Gs-response.
A maximal forskolin concentration (3 µM) was included in each CRE-gene transcription plate for each separate experiment. All data are presented as mean ± SEM of triplicate determinations, and n in the text refers to the number of separate experiments.
Materials
CGS 15943, DPCPX and NECA were from Tocris Cookson (Avonmouth, Bristol, UK). 3H-DPCPX was obtained from Amersham International (Buckinghamshire, UK). Fetal calf serum was from PAA laboratories (Teddington, Middlesex, UK). XAC was from Sigma Chemicals (Poole, Dorset, UK), who also supplied all other reagents. Pertussis toxin was from Calbiochem, Nottingham, UK. The receptor nomenclature used in this manuscript follows Alexander et al. (2008).
Results
In order to systematically test the effect of fluorophore, linker length and composition on ligand pharmacology, we synthesized a number of fluorescent derivatives of the archetypal adenosine A1-receptor agonist, NECA and the corresponding antagonist, XAC (Figures 1 and 2, Table 1; compounds 1–21). We have previously demonstrated the use of the red-excited fluorophore BODIPY 630/650 to generate functional fluorescent A1-receptor agonists and antagonists (Briddon et al., 2004; Middleton et al., 2007). We have extended the range of red-emitting fluorophores tested to include the cyanine dye, Cy5 and also EVOBlue30. In addition, we have used dyes spread over the full UV-visible excitation wavelength range using dansyl (excitation maximum = 320 nm), BODIPY FL (BYFL, 488 nm) and Texas Red (TXR, 590 nm). Furthermore, we have varied the length of the linker between the active pharmacophore and fluorophore. Initially, these compounds were assessed for A1-receptor affinity using whole-cell radioligand binding (3H-DPCPX) and also for functional potency and efficacy using a CRE-based reporter gene assay.
Table 1.
Fluorescent analogues of NECA and XAC
| Compound no. | Compound name | Parent ligand | Mass spectroscopy |
|---|---|---|---|
| 1 | APrEA-X-BY630 | NECA | C44H49BF2N10O7S (MH)+ requires 911.3647, found 911.3718 |
| 2 | ABEA-X-BY630 | NECA | C45H51BF2N10O7S (MH)+ requires 925.3803, found 925.3842 |
| 3 | APEA-X-BY630 | NECA | C46H53BF2N10O7S (MH)+ requires 939.3960, found 939.4054 |
| 4 | AOEA-X-BY630 | NECA | C49H60BF2N10O7S (MH)+ requires 981.4428, found 981.4470 |
| 5 | ADOEA-X-BY630 | NECA | C47H56BF2N10O9S (MH)+ requires 985.4014, found 985.4111 |
| 6 | ABEA-BYFL | NECA | C30H39BF2N9O5 (MH)+ requires 654.3135, found 654.3098 |
| 7 | ABEA-dansyl | NECA | C28H37N8O6S (MH)+ requires 613.2557, found 613.2532 |
| 8 | ABEA-AO-dansyl | NECA | C36H52N9O7S (MH)+ requires 754.3710, found 754.3744 |
| 9 | ABEA-X-BYFL | NECA | C36H50BF2N10O6 (MH)+ requires 767.3976, found 767.3962 |
| 10 | AUEA-dansyl | NECA | C35H51N8O6S (MH)+ requires 711.3652, found 711.3609 |
| 11 | ABEA-X-Texas Red | NECA | C53H65N10O11S2 (MH)+ requires 1081.4270, found 1081.4360 |
| 12 | ABEA-Cy5 | NECA | C49H63N9O11S2 (MH)+ requires 1018.4161, found 1018.4229 |
| 13 | ABEA-EVOBlue 30 | NECA | C37H49N10O9S (MH)+ requires 809.3399, found 809.3427 |
| 14 | XAC-X-BY630 | XAC | C50H55BF2N9O7S (MH)+ requires 974.4006, found 974.4041 |
| 15 | XAC-X-Texas Red | XAC | C58H68N9O11S2 (MH)+ requires 1130.4480, found 1130.4530 |
| 16 | XAC-Cy5 | XAC | C54H67N8O11S2 (M2H)+ requires 1067.4365, found 1067.4495 |
| 17 | XAC-AEAO-BYFL | XAC | C45H60BF2N10O7 (MH)+ requires 901.4708, found 901.4691 |
| 18 | XAC-EVOBlue 30 | XAC | C42H52N9O9S (MH)+ requires 858.3609, found 858.3646 |
| 19 | XAC-dansyl | XAC | C33H40N7O6S (MH)+ requires 662.2761, found 662.2740 |
| 20 | XAC-AO-dansyl | XAC | C41H55N8O7S (MH)+ requires 803.3914, found 803.3971 |
| 21 | XAC-AHH-dansyl | XAC | C45H65N9O8S (MH)+ requires 888.4442, found 888.4612 |
The confirmed molecular weight from mass spectroscopy is also compared with the predicted molecular weight for the final product.
ABEA, N6-(4-aminobutyl)-5′-ethylamino-5′-oxo-5′-deoxyadenosine; ADOEA, N6-(8-amino-3,6-dioxaoctyl)-5′-ethylamino-5′-oxo-5′-deoxyadenosine; AEAO, 8-(2-aminoethylamino)-8-oxooctanoyl; AHH, 6-(6-aminohexanamido)hexanoyl (see Figures 1 and 2 for complete structures); AO, 8-aminooctanoyl; AOEA, N6-(8-aminooctyl)-5′-ethylamino-5′-oxo-5′-deoxyadenosine; APEA, N6-(5-aminopentyl)-5′-ethylamino-5′-oxo-5′-deoxyadenosine; APrEA, N6-(3-aminopropyl)-5′-ethylamino-5′-oxo-5′-deoxyadenosine; AUEA, N6-(11-aminoundecyl)-5′-ethylamino-5′-oxo-5′-deoxyadenosine; NECA, 5′(N-ethylcarboxamido)adenosine; X, 6-aminohexanoyl; XAC, xanthine amine congener.
Fluorescent XAC derivatives
Whole-cell binding in CHO-A1 cells using 3H-DPCPX confirmed that the affinity of XAC itself was similar to that previously shown (Table 2; Figure 3). In line with our previous studies, XAC-X-BY630 (14) showed a comparable affinity for the adenosine A1 receptor (Table 2), and inhibited over 80% of specific binding (Figure 3). Derivatives in which the fluorophore was changed, but which had an equivalent linker length, showed significant differences in their binding properties (Table 2). XAC-AO-dansyl (20) showed a reduced but reasonable affinity. In contrast, XAC-Cy5 (16), XAC-EVOBlue30 (18) and XAC-X-TXR (15) were at least 10-fold less potent than the BODIPY630/650 derivative. The BODIPY-FL derivative of XAC (XAC-AEAO-BYFL; 17) showed no displacement of specific binding at concentrations up to 10 µM (Figure 3).
Table 2.
Inhibition of specific binding of 3H-DPCPX to the adenosine A1-receptor by fluorescent analogues of NECA and XAC
| Log KD1 | Log IC50 | % Inhibition2 | n | |
|---|---|---|---|---|
| NECA | −5.97 ± 0.03 | 8 | ||
| APrEA-X-BY630 | −6.62 ± 0.09 (apparent) | −6.51 ± 0.10 | 55.4 ± 2.5% | 10 |
| ABEA-X-BY630 | −5.93 ± 0.10 (apparent) | −5.81 ± 0.10 | 46.2 ± 4.9% | 10 |
| APEA-X-BY630 | −6.01 ± 0.25 (apparent) | −5.89 ± 0.25 | 45.3 ± 4.2% | 9 |
| AOEA-X-BY630 | −6.15 ± 0.21 (apparent) | −6.04 ± 0.21 | 19.7 ± 3.6% | 7 |
| ADOEA-X-BY630 | −6.19 ± 0.24 (apparent) | −6.23 ± 0.23 | 24.3 ± 4.8% | 7 |
| ABEA-dansyl | >−4 | 5 | ||
| ABEA-AO-dansyl | NI | 3 | ||
| AUEA-dansyl | −4.97 ± 0.15 (apparent) | −4.83 ± 0.15 | 44.8 ± 2.3% | 6 |
| ABEA-X-Texas Red | >−4 | 6 | ||
| ABEA-EVOBlue 30 | >−5 | 2 | ||
| ABEA-Cy5 | NI | 4 | ||
| ABEA-BYFL | NI | 4 | ||
| ABEA-X-BYFL | >−4 | 5 | ||
| XAC | −7.38 ± 0.05 | 11 | ||
| XAC-X-BY630 | −7.42 ± 0.05 (apparent) | −7.28 ± 0.05 | 82.3 ± 1.4% | 10 |
| XAC-X-Texas Red | −5.72 ± 0.07 | 7 | ||
| XAC-AEAO-BYFL | NI | 5 | ||
| XAC-EVOBlue 30 | −5.27 ± 0.11 | 6 | ||
| XAC-Cy5 | −5.59 ± 0.02 | 6 | ||
| XAC-dansyl | −6.71 ± 0.05 | 7 | ||
| XAC-AO-dansyl | −6.91 ± 0.09 (apparent) | −6.77 ± 0.09 | 91.0 ± 0.5% | 6 |
| XAC-AHH-dansyl | −6.87 ± 0.05 (apparent) | −6.73 ± 0.04 | 81.0 ± 0.9% | 6 |
All values are mean ± SEM.
Unless otherwise stated, KD values were calculated as described under Methods. In those situations where a maximal inhibition of specific binding was obtained that was less than 100% (defined with 10 µM XAC), an apparent KD was calculated from the IC50 of the displaceable component of binding.
Where indicated, maximum inhibition of specific binding was obtained that was less than that defined with 10 µM XAC.
ABEA, N6-(4-aminobutyl)-5′-ethylamino-5′-oxo-5′-deoxyadenosine; ADOEA, N6-(8-amino-3,6-dioxaoctyl)-5′-ethylamino-5′-oxo-5′-deoxyadenosine; AEAO, 8-(2-aminoethylamino)-8-oxooctanoyl; AHH, 6-(6-aminohexanamido)hexanoyl (See Figures 1 and 2 for complete structures); AO, 8-aminooctanoyl; AOEA, N6-(8-aminooctyl)-5′-ethylamino-5′-oxo-5′-deoxyadenosine; APEA, N6-(5-aminopentyl)-5′-ethylamino-5′-oxo-5′-deoxyadenosine; APrEA, N6-(3-aminopropyl)-5′-ethylamino-5′-oxo-5′-deoxyadenosine; AUEA, N6-(11-aminoundecyl)-5′-ethylamino-5′-oxo-5′-deoxyadenosine; NECA, 5′(N-ethylcarboxamido)adenosine; NI, no inhibition of specific binding at concentrations up to 0.1 mM; X, 6-aminohexanoyl; XAC, xanthine amine congener.
Figure 3.
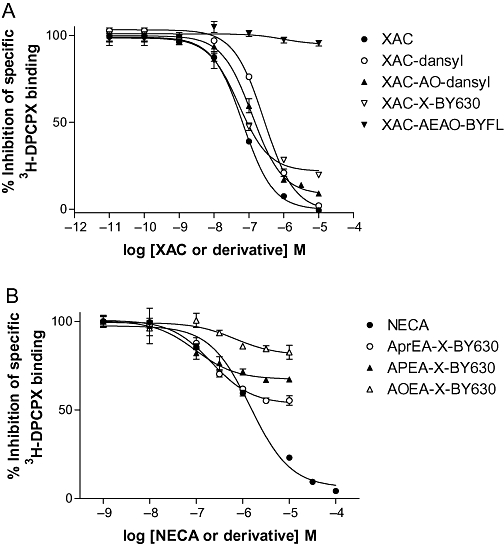
Inhibition of the specific binding of 3H-DPCPX by fluorescent (A) antagonists and (B) agonists in CHO-A1 cells expressing the human adenosine A1 receptor. Non-specific binding was defined with 10 µM XAC. 3H-DPCPX was used at (A) 1.30 nM or (B) 1.11 nM. Values represent mean ± SEM from triplicate determinations in a single experiment. These separate experiments are representative of (A) five and (B) seven separate experiments. AEAO, 8-(2-aminoethylamino)-8-oxooctanoyl; AO, 8-aminooctanoyl; AOEA, N6-(8-aminooctyl)-5′-ethylamino-5′-oxo-5′-deoxyadenosine; APEA, N6-(5-aminopentyl)-5′-ethylamino-5′-oxo-5′-deoxyadenosine; APrEA, N6-(3-aminopropyl)-5′-ethylamino-5′-oxo-5′-deoxyadenosine; X, 6-aminohexanoyl; CHO, Chinese hamster ovary; DPCPX, 8-cyclopentyl-1,3-dipropylxanthine; NECA, 5′ (N-ethylcarboxamido)adenosine; X, 6-aminohexanoyl; XAC, xanthine amine congener.
The effect of linker length was investigated using three dansyl derivatives (XAC-dansyl (19), XAC-AO-dansyl (20) and XAC-AHH-dansyl (21)), with relative chain lengths of 0, 9 and 14 atoms, respectively. Interestingly, increasing the chain length had no significant effect on the binding affinity of the ligand, but did seem to decrease slightly the maximum displacement of 3H-DPCPX (Table 2).
The adenosine A1 receptor is primarily a Gi-coupled receptor, and, as such, agonist responses result in a decrease in cAMP and CRE-mediated gene transcription responses (Baker and Hill, 2007). In order to make these inhibitory responses easier to see, forskolin was added to the experiments in order to raise the basal adenylyl cyclase activity, and thus cAMP and CRE-gene transcription levels. In the presence of forskolin, the agonist response to NECA is comprised of both an inhibitory Gi-mediated inhibition of gene transcription and, at higher agonist concentrations, a Gs-mediated enhancement of the response to forskolin (Figure 4). We have previously shown that both the Gi and Gs responses to NECA in this cell line are mediated via the adenosine A1 receptor (Baker and Hill, 2007). Inverse agonists, however, result in an increase in adenylyl cyclase activity and an increase in CRE-mediated gene transcription (Figure 4; Baker and Hill, 2007). Log KD values obtained from antagonism of the Gs and Gi phases of the NECA response for each fluorescent antagonist were very similar (Table 3). The Gs phase of the NECA response could be isolated by pretreatment with PTX, and the KD values for fluorescent antagonists were again similar (Table 3).
Figure 4.
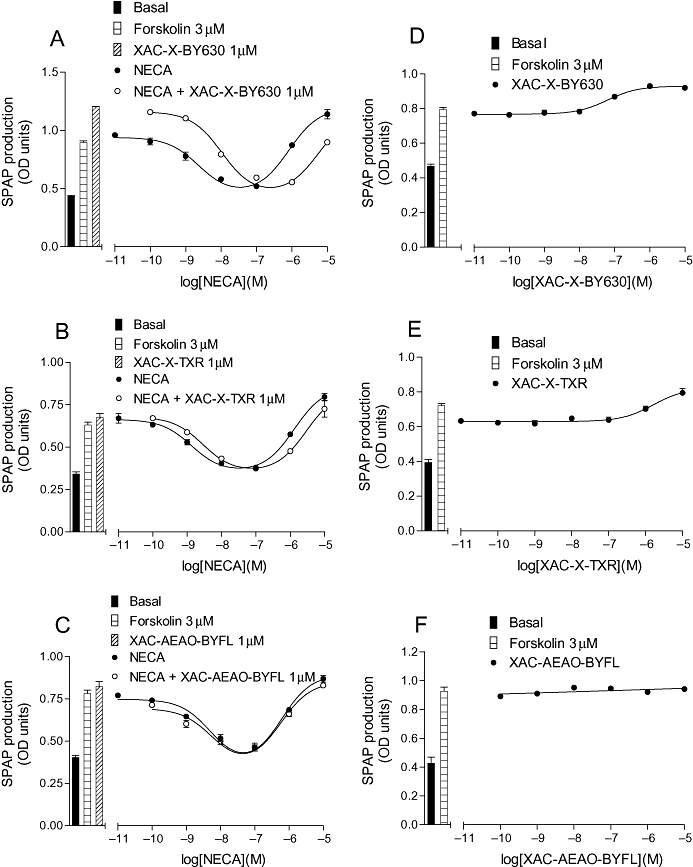
CRE-SPAP production in CHO-A1 cells in response to (A) NECA in the presence and absence of 1 µM XAC-X-BY630 (14); (B) NECA in the presence and absence of 1 µM XAC-X-Texas Red (XAC-X-TXR; 15); (C) NECA in the presence and absence of 1 µM XAC-AEAO-BYFL (17); (D) XAC-X-BY630 (14); (E) XAC-X-Texas Red (XAC-X-TXR) and (F) XAC-AEAO-BYFL (17). Bars show basal CRE-SPAP production, that in response to 3 µM forskolin, and for A–C, that in response to 1 µM of the XAC-derivative in the presence of 3 µM forskolin. Data points are mean ± SEM from triplicate values from a single experiment. These separate experiments are representative of (A) 9, (B) 6, (C) 10, (D) 9, (E) 6 and (F) 6 separate experiments. AEAO, 8-(2-aminoethylamino)-8-oxooctanoyl; CHO, Chinese hamster ovary; CRE-SPAP, cyclic 3′,5′ adenosine monophosphate response element-secreted placental alkaline phosphatase; NECA, 5′ (N-ethylcarboxamido)adenosine; X, 6-aminohexanoyl; XAC, xanthine amine congener.
Table 3.
Log KD values from antagonism of NECA-mediated inhibition (Gi) and enhancement (Gs) of forskolin-stimulated CRE reporter gene responses
| Antagonist |
Log KD |
n |
Log KD |
n | +PTX |
n |
|---|---|---|---|---|---|---|
| Gi | Gs | Gs | ||||
| XAC | −7.86 ± 0.05 | 14 | −7.92 ± 0.04 | 14 | −7.99 ± 0.05 | 6 |
| XAC-X-BY630 | −6.92 ± 0.09 | 9 | −6.94 ± 0.06 | 12 | −7.14 ± 0.05 | 6 |
| XAC-X-Texas Red | −6.00 ± 0.15 | 6 | −6.09 ± 0.08 | 7 | −6.31 ± 0.10 | 4 |
| XAC-dansyl | −7.37 ± 0.08 | 8 | −7.31 ± 0.03 | 7 | −7.22 ± 0.17 | 7 |
| XAC-AO-dansyl | −7.43 ± 0.07 | 6 | −7.42 ± 0.09 | 6 | −7.02 ± 0.10 | 6 |
| XAC-AHH-dansyl | −7.14 ± 0.15 | 5 | −7.30 ± 0.10 | 5 | −6.99 ± 0.09 | 6 |
Values represent mean ± SEM of n separate experiments. KD values were determined from the parallel shifts obtained in the inhibitory (Gi) and stimulatory (Gs) phases of the NECA concentration response curves. In some experiments (+PTX), cells were incubated overnight with PTX (100 ng·mL–1), and under these conditions, only a stimulatory response (Gs) was obtained. No antagonism was seen with XAC-AEAO-BYFL, XAC-EVOBlue 30 or XAC-Cy5 at concentrations up to 1 µM.
AEAO, 8-(2-aminoethylamino)-8-oxooctanoyl; AO, 8-aminooctanoyl; CRE, cyclic AMP response element; NECA, 5′(N-ethylcarboxamido)adenosine; PTX, Pertussis toxin; X, 6-aminohexanoyl; XAC, xanthine amine congener.
All of the fluorescent derivatives of XAC that were able to antagonize NECA-stimulated Gi-mediated responses, also acted as inverse agonists (Table 4; Figure 4). Table 4 shows the mean log EC50 values for an increase in CRE-mediated gene transcription that are in good agreement with the antagonist KD values obtained from antagonism of NECA-stimulated responses (Table 3). Interestingly, similar KD values were obtained for XAC-X-BY630 (14), XAC-X-TXR (15) and Dansyl derivatives of XAC (19, 20, 21) from inhibition of DPCPX binding (Table 2).
Table 4.
Inverse agonist effects of fluorescent XAC derivatives
| Antagonist | (log EC50) | n | Fold increase |
|---|---|---|---|
| XAC | −7.15 ± 0.14 | 9 | 1.41 ± 0.07 |
| XAC-X-BY630 | −6.93 ± 0.12 | 9 | 1.32 ± 0.04 |
| XAC-X-Texas Red | −5.82 ± 0.22 | 6 | 1.26 ± 0.06 |
| XAC-dansyl | −6.84 ± 0.16 | 9 | 1.47 ± 0.08 |
| XAC-AO-dansyl | −7.52 ± 0.17 | 7 | 1.20 ± 0.03 |
| XAC-AHH-dansyl | −6.80 ± 0.14 | 5 | 1.40 ± 0.10 |
Fluorescent NECA derivatives
In whole cell radioligand binding assays, the parent A1-receptor agonist, NECA, fully inhibited specific binding with a log KD value of −5.97 (see Table 2; Figure 3). The previously characterized A1 receptor agonist ABEA-X-BY630 (2) had a similar apparent log KD value to NECA (Table 2: Figure 3), but displaced only 50% of the specific binding as previously reported (Middleton et al., 2007). Maintaining a similar linker length, but altering the fluorophore to Texas Red (ABEA-X-TR, 11), Cy5 (ABEA-Cy5, 12), EVOBlue30 (ABEA-EVOBlue30, 13) or BODIPY FL (ABEA-X-BYFL, 9) effectively abolished any measurable affinity of the agonists for the A1 receptor. The dansyl equivalent of ABEA-X-BY630, AUEA-dansyl (10), did show measurable affinity for the A1 receptor, but was significantly less potent (Table 2).
For the BODIPY 630/650-labelled NECA derivatives, varying the linker length from three to eight carbon atoms (APrEA-, ABEA-, APEA- and AOEA-X-BY630, 1,2,3 and 4, respectively) did not significantly change their affinity for the adenosine A1 receptor or their inability to displace all of the specific binding. The exception to this was for the longest chain length, AOEA-X-BY630 (4), which displaced only 20% of the specific binding. This lack of displacement was unlikely to be a solubility issue, as a compound with a diethylene glycol linker of equivalent length (ADOEA-X-BY630, 5) showed similar properties. In the case of the dansyl derivatives varying the carbon chain from 4 carbon atoms in ABEA-dansyl (7) to 7 carbon atoms in ABEA-AO-dansyl (8), or 11 carbon atoms in AUEA-dansyl (10), indicated that the longer carbon chain length was required for measurable binding affinity (Table 2).
Several of the fluorescent NECA derivatives were also able to stimulate agonist responses via the adenosine A1 receptor (Table 5). In each case, the Gi-coupled agonist response was abolished following pretreatment of the cells with PTX (Table 5), and could be competitively antagonized by the non-fluorescent A1 receptor antagonists DPCPX, XAC and CGS 15943 (Table 6). BODIPY 630/650 derivatives of NECA were able to stimulate both Gi- and Gs- mediated responses (Figure 5). However, the increased length of the linker resulted in lower potency and reduced Gs responses (Figure 5). The dansyl derivatives of NECA elicited Gi-mediated responses, but no significant activation of Gs-mediated responses was observed over the concentration range studied (Table 5; Figure 6). This was probably a consequence of their lower potency and the inability to reach concentrations at which a Gs response would be visible.
Table 5.
Agonist responses to fluorescent NECA analogues at the adenosine A1 receptor
| Agonist | Gi (log IC50) | n | Gs (log EC50) | n | +PTX |
|||
|---|---|---|---|---|---|---|---|---|
| Gs (log EC50) | Gs EMAX(fold increase) | n | Log KD−Log IC50 | |||||
| NECA | −8.43 ± 0.04 | 15 | −6.13 ± 0.03 | 15 | −6.37 ± 0.04 | 1.81 ± 0.07 | 13 | 1.92 |
| APrEA-X-BY630 | −8.21 ± 0.11 | 8 | −6.18 ± 0.13 | 8 | −6.62 ± 0.13 | 1.67 ± 0.06 | 7 | 2.40 |
| ABEA-X-BY630 | −7.92 ± 0.06 | 8 | −6.38 ± 0.17 | 6 | −6.40 ± 0.06 | 1.44 ± 0.03 | 8 | 2.03 |
| APEA-X-BY630 | −7.97 ± 0.07 | 8 | −6.23 ± 0.13 | 5 | −6.58 ± 0.06 | 1.41 ± 0.06 | 11 | 1.93 |
| AOEA-X-BY630 | −7.32 ± 0.09 | 6 | NS | >−5 | 1.28 | |||
| ADOEA-X-BY630 | −7.20 ± 0.17 | 6 | −5.79 ± 0.11 | 4 | −5.97 ± 0.07 | 1.31 ± 0.06 | 4 | 0.97 |
| ABEA-dansyl | −5.95 ± 0.09 | 7 | NS | >−5 | 7 | |||
| ABEA-AO-dansyl | −6.64 ± 0.08 | 10 | NS | >−6 | 7 | |||
| AUEA-dansyl | −7.08 ± 0.08 | 8 | NS | NS | 7 | 2.25 | ||
| ABEA-X-Texas Red | −6.05 ± 0.17 | 3 | NS | 3 | NS | 3 | ||
| ABEA-EVOBlue 30 | −5.45 ± 0.11 | 3 | NS | 3 | NS | 3 | ||
| ABEA-Cy5 | −5.27 ± 0.35 | 3 | NS | 3 | NS | 3 | ||
| ABEA-BYFL | −6.03 ± 0.09 | 7 | NS | 7 | NS | 7 | ||
| ABEA-X-BYFL | −6.57 ± 0.08 | 7 | NS | 7 | >−5 | 7 | ||
Values represent mean ± SEM of n separate experiments. Values are log (IC50) and log (EC50) determinations from the agonist-mediated inhibition (Gi) or enhancement (Gs), respectively, of forskolin-stimulated CRE-reporter gene activity. In some experiments (+PTX), cells were incubated overnight with PTX (100 ng·mL−1), and under these conditions, only a stimulatory response (Gs) was obtained. An indication of agonist efficacy is provided by the difference between log IC50 values and the log KD values reported for each agonist in Table 2.
ABEA, N6-(4-aminobutyl)-5′-ethylamino-5′-oxo-5′-deoxyadenosine; ADOEA, N6-(8-amino-3,6-dioxaoctyl)-5′-ethylamino-5′-oxo-5′-deoxyadenosine; AEAO, 8-(2-aminoethylamino)-8-oxooctanoyl; AO, 8-aminooctanoyl; AOEA, N6-(8-aminooctyl)-5′-ethylamino-5′-oxo-5′-deoxyadenosine; APEA, N6-(5-aminopentyl)- 5′-ethylamino-5′-oxo-5′-deoxyadenosine; APrEA, N6-(3-aminopropyl)-5′-ethylamino-5′-oxo-5′-deoxyadenosine; AUEA, N6-(11-aminoundecyl)-5′-ethylamino-5′-oxo-5′-deoxyadenosine; PTX, Pertussis toxin; NECA, adenosine-5′-N-ethyluronamide; NS, no stimulation; X, 6-aminohexanoyl.
Table 6.
Antagonism of fluorescent agonist Gi-mediated responses by DPCPX, XAC and CGS15943
| Agonist | log KDDPCPX | n | tog KDXAC | n | log KDCGS | n |
|---|---|---|---|---|---|---|
| NECA | −9.13 ± 0.10 | 7 | −7.86 ± 0.05 | 14 | −8.80 ± 0.10 | 3 |
| APrEA-X-BY630 | −8.70 ± 0.09 | 8 | −7.62 ± 0.07 | 7 | −8.58 ± 0.12 | 7 |
| ABEA-X-BY630 | −8.69 ± 0.06 | 8 | −7.55 ± 0.08 | 8 | −8.54 ± 0.09 | 8 |
| APEA-X-BY630 | −8.61 ± 0.06 | 8 | −7.56 ± 0.08 | 8 | −8.57 ± 0.10 | 8 |
| AOEA-X-BY630 | −8.97 ± 0.07 | 3 | −7.87 ± 0.09 | 3 | −8.87 ± 0.15 | 3 |
| ADOEA-X-BY630 | −8.67 ± 0.09 | 6 | −7.71 ± 0.07 | 6 | −8.67 ± 0.08 | 6 |
| ABEA-dansyl | −8.76 ± 0.06 | 6 | −7.90 ± 0.06 | 6 | −8.78 ± 0.07 | 6 |
| ABEA-AO-dansyl | −8.78 ± 0.15 | 5 | −7.74 ± 0.12 | 5 | −8.90 ± 0.19 | 6 |
| AUEA-dansyl | −8.80 ± 0.12 | 7 | −7.97 ± 0.10 | 6 | −8.96 ± 0.11 | 7 |
| ABEA-X-BYFL | −8.73 ± 0.16 | 5 | −7.83 ± 0.13 | 5 | −8.69 ± 0.15 | 6 |
Values represent mean ± SEM from n separate experiments.
ABEA, N6-(4-aminobutyl)-5′-ethylamino-5′-oxo-5′-deoxyadenosine; ADOEA, N6-(8-amino-3,6-dioxaoctyl)-5′-ethylamino-5′-oxo-5′-deoxyadenosine; AO, 8-aminooctanoyl; AOEA, N6-(8-aminooctyl)-5′-ethylamino-5′-oxo-5′-deoxyadenosine; APEA, N6-(5-aminopentyl)- 5′-ethylamino-5′-oxo-5′-deoxyadenosine; APrEA, N6-(3-aminopropyl)-5′-ethylamino-5′-oxo-5′-deoxyadenosine; AUEA, N6-(11-aminoundecyl)-5′-ethylamino-5′-oxo-5′-deoxyadenosine; CGS 15943, 5-amino-9-chloro-2-(2-furyl)1,2,4-trizolo[1,5-c]quinazoline; DPCPX, 8-cyclopentyl-1,3-dipropylxanthine; NECA, 5′(N-ethylcarboxamido)adenosine; X, 6-aminohexanoyl; XAC, xanthine amine congener.
Figure 5.
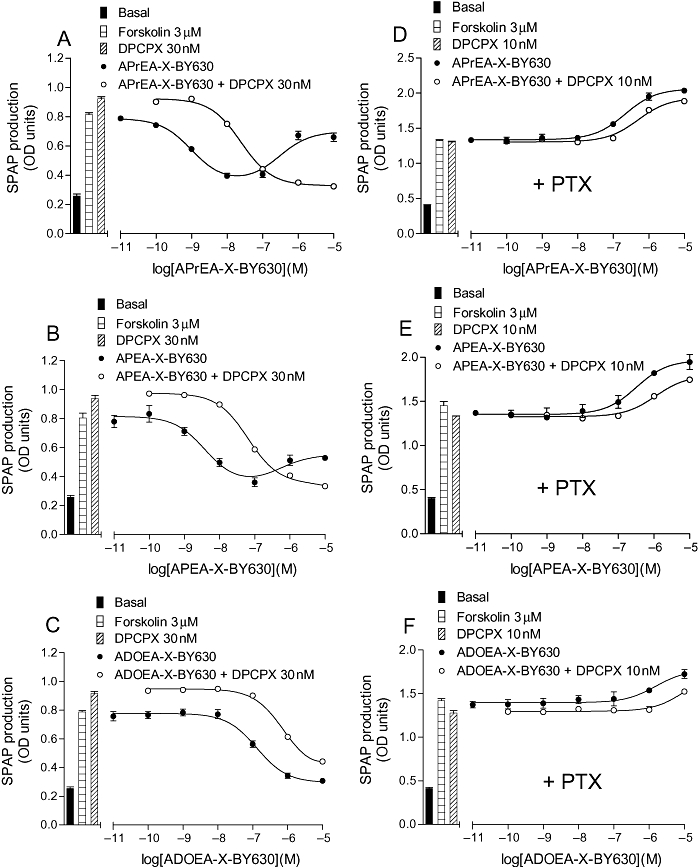
CRE-SPAP production in CHO-A1 cells in response to APrEA-X-BY630 (A and D), APEA-X-BY630 (B and E), ADOEA-X-BY630 (C and F) in the presence and absence of 30 nM DPCPX (A, B and C) and 10 nM DPCPX (D, E and F). The cells in D, E and F were incubated with PTX (100 ng·mL−1) for 24 h before experimentation. Bars show basal CRE-SPAP production, that in response to 3 µM forskolin and that in response to either 30 nM or 10 nM DPCPX in the presence of 3 µM forskolin. Data points are mean ± SEM from triplicate values from a single experiment. These separate experiments are representative of (A) 8, (B) 8, (C) 6, (D) 6, (E) 6 and (F) 6 separate experiments. ADOEA, N6-(8-amino-3,6-dioxaoctyl)-5′-ethylamino-5′-oxo-5′-deoxyadenosine; APEA, N6-(5-aminopentyl)-5′-ethylamino-5′-oxo-5′-deoxyadenosine; APrEA, N6-(3-aminopropyl)-5′-ethylamino-5′-oxo-5′-deoxyadenosine; CHO, Chinese hamster ovary; CRE-SPAP, cyclic AMP response element-secreted placental alkaline phosphatase; DPCPX, 8-cyclopentyl-1,3-dipropylxanthine; NECA, 5′ (N-ethylcarboxamido)adenosine; PTX, Pertussis toxin; X, 6-aminohexanoyl.
Figure 6.
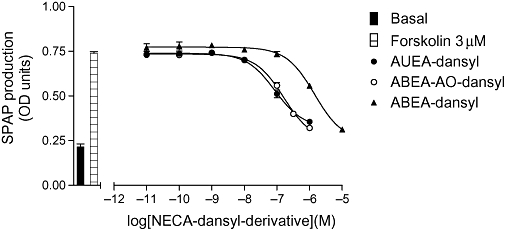
CRE-SPAP production in CHO-A1 cells in response to NECA-dansyl derivatives (AUEA-dansyl, ABEA-AO-dansyl and ABEA-dansyl). Bars show basal CRE-SPAP production, that in response to 3 µM forskolin. Data points are mean ± SEM from triplicate values from a single experiment and this is representative of seven separate experiments. ABEA, N6-(4-aminobutyl)-5′-ethylamino-5′-oxo-5′-deoxyadenosine; AUEA, N6-(11-aminoundecyl)-5′-ethylamino-5′-oxo-5′-deoxyadenosine; CHO, Chinese hamster ovary; CRE-SPAP, cyclic AMP response element-secreted placental alkaline phosphatase; NECA, 5′ (N-ethylcarboxamido)adenosine.
It was notable that while BODIPY 630/650 derivatives of NECA became less potent as the carbon chain length increased, the opposite was true for the dansyl derivatives, with the most potent compound being AUEA-dansyl (10), with an 11 carbon linker (Table 5; Figures 5 and 6). This was in keeping with AUEA-dansyl providing the only measurable binding affinity in whole cell ligand-binding studies. It was notable that IC50 values for the Gi-mediated function gene transcription responses were generally much lower than the KD values obtained in binding experiments for all agonists. This reflects the fact that this is a well-coupled system and explains why weak agonist responses were obtained for several compounds when no displacement of 3H-DPCPX binding was detectable. This was particularly true of the BODIPY FL derivatives ABEA-BYFL (6) and ABEA-X-BYFL (9).
Visualizing ligand binding to live cells
All of the fluorescent ligands were examined under the confocal microscope for their ability to bind to CHO-A1 cells (Figure 7). When XAC-X-TXR (15) was monitored at the single-cell level, no specific binding was seen at concentrations up to 30 nM. At 30 nM, bright fluorescence was seen between cells (Figure 7E), suggesting that enough of the fluorescent molecules were present to be detected by confocal microscopy, but this fluorescence was lost immediately on washout of the label (Figure 7F). In the case of the dansyl derivatives (both agonist and antagonist), no increase in fluorescence was seen above the level of autofluoresence from the cells (Figure 7G,H). Furthermore, unlike the situation with XAC-X-TXR (15), no dansyl fluorescence was detected in solution. When XAC-X-BY630 (14) and the BODIPY 630/650 derivatives of NECA (1–4) were visualized, clear membrane binding was observed even in the continued presence of fluorescent ligand (Figure 7A–D). This latter result suggests that the BODIPY 630/650 fluorophore is heavily quenched in aqueous solution. This suggestion was reinforced when excitation and emission spectra for XAC-dansyl (19), XAC-X-TR (15) and XAC-X-BY630 (14) were determined in HBS and methanol (Figure 8). The ratio of peak emission intensities in HBS compared with methanol was 0.89 for XAC-X-TR (15), 0.26 for XAC-dansyl (19) and 0.07 for XAC-X-BY630 (14). It was also notable that clear membrane binding could be detected with XAC-X-BY630 when confocal imaging was undertaken in the presence of Brilliant Black BN (50 µM), which heavily quenches the extracellular aqueous fluorescence (Figure 9).
Figure 7.

Confocal images of CHO-A1 cells incubated (5 min) with: (A) APrEA-X-BY630 (10 nM), (B) ADOEA-X-BY630 (10 nM), (C, D) XAC-X-BY630 (30 nM), (E, F) XAC-X-Texas Red (30 nM) and (G) XAC-dansyl (10 nM). In D and F, images were collected immediately after the fluorescent ligand had been removed from the cells. H shows a representative image of autofluorescence collected under identical conditions to image (G), but without the addition of XAC-dansyl. ADOEA, N6-(8-amino-3,6-dioxaoctyl)-5′-ethylamino-5′-oxo-5′-deoxyadenosine; APrEA, N6-(3-aminopropyl)-5′-ethylamino-5′-oxo-5′-deoxyadenosine; CHO, Chinese hamster ovary; X, 6-aminohexanoyl; XAC, xanthine amine congener.
Figure 8.
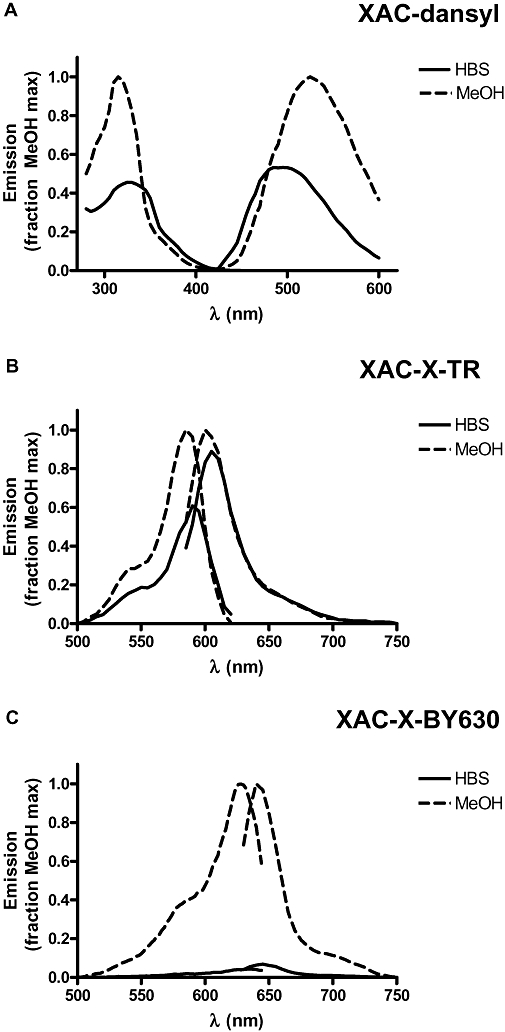
Normalized excitation and emission spectra obtained in HBS or methanol for (A) XAC-dansyl (50 µM), (B) XAC-X-Texas Red (1 µM) and (C) XAC-X-BY630 (1 µM). Data have been normalized to the maximum excitation or emission obtained with each ligand in methanol. Excitation maxima were: (A) 320, 315 nm; (B) 590, 585 nm and (C) 628, 634 nm in HBS and methanol respectively. Corresponding emission maxima were: (A) 500, 525 nm; (B) 605, 600 nm and (C) 645, 640 nm. The relative maximal emission intensities (HBS; methanol) were: (A) 0.26; (B) 0.89 and (C) 0.07. HBS, N-2-Hydroxyethylpiperazine-N′-2-ethanesulfonic acid-buffered saline; X, 6-aminohexanoyl; XAC, xanthine amine congener.
Figure 9.
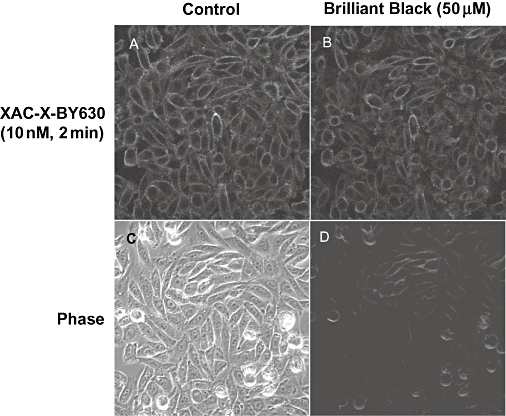
The effect of Brilliant Black on the fluorescence of XAC-X-BY630 bound to CHO-A1 cells. CHO-A1 cells were incubated with XAC-X-BY630 (10 nM, 37°C) for 2 min, and a single confocal (A) and simultaneous phase image (C) were acquired. Immediately following the addition of the fluorescence quencher, Brilliant Black (50 µM), similar confocal (B) and phase contrast (D) images were taken, with the darkening of the phase image indicating a successful addition of the Brilliant Black. CHO, Chinese hamster ovary; X, 6-aminohexanoyl; XAC, xanthine amine congener.
Discussion
XAC and its antagonist fluorescent derivatives
XAC is a well-known antagonist of the human adenosine A1 receptor. It bound with high affinity to the human adenosine A1 receptor in this transfected cell system (log KD−7.38). In keeping with previous findings, the inverse agonist nature of this ligand was also evident (Baker and Hill, 2007). The addition of EVOBlue30, Cy5 and BODIPY-FL fluorophores to XAC resulted in a large loss in affinity of the resultant molecules, with only very weak binding being detected for XAC-Cy5 (16) and XAC-EVOBlue30 (18). None of these XAC derivatives were able to inhibit any of the NECA agonist responses (at a concentration up to 1 µM for the fluorescent XAC ligand). The addition of the EVOBlue, Cy5 and BODIPY-FL fluorophores to XAC therefore resulted in a loss of pharmacological activity of the XAC molecule that was due to a large reduction in affinity for the adenosine A1 receptor.
When the XAC-X-Texas Red (15) molecule was examined, the affinity as measured by 3H-DPCPX binding was about 30-fold lower than that seen with the parent XAC. XAC-X-Texas Red (15) was also able to inhibit the NECA agonist responses, and this included both those occurring via the Gi-and Gs-coupled states of the receptor (Table 3). However, when XAC-X-Texas Red (15) was monitored at the single-cell level, no specific binding was seen at concentrations up to 30 nM. At 30 nM, bright fluorescence was seen between cells, suggesting that enough fluorescent molecules were present to be detected by confocal microscopy, but this fluorescence was lost immediately on washout of the label. This suggests that the affinity of XAC-X-Texas Red (15) for the adenosine A1 receptor is too low for successful imaging studies.
The addition of the smaller dansyl fluorophore to XAC resulted in a molecule that maintained high affinity at the A1 receptor, comparable with that of the parent XAC molecule. This was true whether the affinity was deduced from inhibition of specific 3H-DPCPX binding or from inhibition of the NECA-stimulated reporter gene responses (Tables 2 and 3). The addition of the dansyl fluorophore therefore had little effect on the pharmacological properties of XAC. However, when the ligands were visualized, no binding was seen at all. In fact, no increase in fluorescence was seen above the level of cellular autofluoresence (Figure 7). Furthermore, unlike the situation with XAC-X-Texas Red (15), no dansyl fluorescence was detected in solution. This is consistent with the relatively weak fluorescence intensity normally observed with dansyl fluorophores in aqueous solution (Hayashida et al., 2007). This fluorophore has been observed previously to demonstrate sensitivity to the microenvironment polarity such that its fluorescence intensity increases in lower polarity environments along with a blue shift in emission wavelength (Hayashida et al., 2007). The increase in fluorescence intensity in environments of lower polarity (methanol) was also demonstrated directly in the present study (Figure 8), although the emission wavelength increased slightly. These data suggest that when the dansyl derivatives are bound to the adenosine A1 receptor, the fluorophore is likely to be located within an aqueous and/or highly quenched environment.
The addition of BODIPY 630/650 fluorophore to the XAC molecule made no difference to the affinity of the molecules as determined from 3H-DPCPX whole cell binding. The inverse agonist activity of the molecule was maintained, as was the affinity when measured at both the Gi- and Gs-coupled states of the receptor. Furthermore, when XAC-X-BY630 (14) was visualized using the confocal microscope, clear membrane binding was observed, which remained even when the extracellular fluorescent ligands were washed away. Thus, the addition of BODIPY 630/650 to XAC had very little effect on the pharmacology of the molecule, with all the pharmacological properties being preserved in addition to good fluorescent properties. A striking property of the BODIPY 630/650 ligands was that membrane binding to cells expressing the adenosine A1 receptor could be determined in the continued presence of the fluorescent ligand. These data suggest that the fluorescence intensity of the BODIPY 630/650 fluorophore increases on binding to the receptor. Thus, unlike the dansyl congeners, the BODIPY 630/650 fluorophore is likely to be located within a non-polar environment when bound to the A1 receptor.
NECA and its fluorescent derivatives
NECA had a binding affinity as measured by 3H-DPCPX whole-cell binding of 1 µM. The IC50 for activation of the adenosine A1 receptor was, however, 38 nM. This is because NECA is a highly efficacious agonist and needs to occupy only a few receptors to stimulate a full agonist response. This highly efficacious nature of NECA makes it an ideal choice for the starting molecule from which to make fluorescent derivatives. Adenosine A1 receptors have also been shown to couple to Gs-coupled receptors in CHO cells (Cordeaux et al., 2000; 2004; Baker and Hill, 2007), and the EC50 for stimulation by NECA of the Gs-coupled state of the receptor (794 nM) shows that this coupling is much less efficient.
The NECA agonist response was inhibited by non-fluorescent adenosine A1 receptor antagonists to give values similar to those previously published (Baker and Hill, 2007). The affinity of non-fluorescent antagonists was the same for both the NECA–Gi-induced state of the receptor, and the NECA-induced Gs state of the receptor. The Gs-coupled state could be isolated by pre-incubating the cells with PTX. This resulted in a complete abolition of the inhibitory Gi-response (i.e. the reduction in CRE-gene transcription), leaving only the Gs-stimulatory response intact. The affinity of the non-fluorescent antagonists measured under these conditions was also identical.
The addition of the EVOBlue30, Texas Red and Cy5 fluorophores to the parent NECA molecule completely abolished all measurable pharmacological activity. The addition of the BODIPY-FL fluorophore resulted in molecules with much reduced potency, which was probably due to a reduction in affinity, as no binding was detectable. The agonist response to these molecules was mediated by the adenosine A1 receptor, as it could be inhibited by non-fluorescent A1 receptor antagonists to give the same affinity (log KD values) as for the parent NECA. Furthermore, the response was abolished following PTX pretreatment confirming that it was occurring via the Gi-coupled state of the receptor. However, when these NECA derivatives were examined using confocal microscopy, no specific binding was seen with any of the ligands. Thus, although ABEA-X-BYFL (9) had marginal functional activity, none of the Texas Red, EVOblue30, Cy5 or BODIPY-FL derivatives have useful functional or fluorescent use.
The addition of the dansyl derivatives to the parent NECA molecule did result in functionally active molecules. These molecules had reduced affinity for the adenosine A1 receptor (Table 2); however agonist Gi-coupled inhibitory functional responses were still seen. Although none of the dansyl derivatives of NECA were sufficiently efficacious to induce the Gs-coupled state of the A1 receptor, it is interesting to note that lengthening the carbon chain in the linker between the NECA moiety and fluorophore from C4 to C11 (AUEA-dansyl, 10) resulted in an increase in agonist potency of 10-fold, and that this was most likely due to an increase in affinity (Table 2). However, the combination of lower affinity for the adenosine A1 receptor, together with the problems highlighted above for dansyl XAC derivatives regarding the low fluorescence intensity of the dansyl fluorophore in polar aqueous environments, is the most likely explanation of the lack of success with these ligands in confocal microscopy studies.
The addition of a BODIPY 630/650 fluorophore resulted in a series of functionally active molecules. It was only possible to determine the apparent affinity (log KD values) of the fluorescent NECA BODIPY 630/650 derivatives from the 3H-DPCPX whole cell-binding studies (Table 2) because the fluorescent analogues did not inhibit all of the specific binding. We have observed this previously for the ABEA-X-BY630 (2) derivative (Middleton et al., 2007), and shown that this may be partly due to differential penetration of the fluorescent ligand and 3H-DPCPX into the intracellular environment of intact cells. Thus, permeabilization of cells did increase the percentage of specific binding inhibited by this fluorescent agonist by allowing access to intracellular receptors (Middleton et al., 2007). An alternative interpretation is that these fluorescent analogues are acting allosterically to inhibit binding of 3H-DPCPX (Christopolous and Kenakin, 2002; Kenakin, 2004; May et al., 2007).
It is interesting, however, to note that the log IC50 values of the BODIPY 630/650 derivatives in the functional Gi protein-coupled CRE response increased as the linker lengthened. This did not appear to be due to a decrease in binding affinity (Table 2), but rather reflected a decrease in agonist efficacy. If one takes the difference between log IC50 and apparent log KD values as a measure of efficacy, then there was a clear decrease in efficacy as the chain length increased (Table 5). All but AOEA-X-BY630 (4) were able to stimulate an increase in CRE-gene transcription by inducing a Gs-coupled state of the adenosine A1 receptor at higher concentrations. Interestingly, the ADOEA-X-BY630 (5) analogue was equally potent with AOEA-X-BY630 (which has an identical linker length) at inhibiting CRE-gene transcription, but retained some Gs-stimulating activity (Table 5). These data suggest that the latter compound has a reduced affinity and/or efficacy for the Gs-coupled conformation of the adenosine A1 receptor compared with the other fluorescent agonists.
In the case of the dansyl NECA derivatives, there is a hint that affinity and/or efficacy increases as the chain length increases. This is opposite to the finding with the BODIPY 630/650 derivatives, and this observation may provide a clue to the orientation of the fluorophore within the receptor-binding pocket. A comparison of the affinity of XAC-X-BY630 with all three XAC dansyl derivatives suggests that binding affinity is retained with both fluorophores. However, the marked differences in fluorescence intensity of ligand binding at the single-cell level with these fluorescent ligands suggest that the dansyl fluorophore is located within an aqueous environment, whereas the BODIPY 630/650 fluorophore is within a less polar membrane environment. This suggestion is supported by the data obtained with XAC-dansyl (19) and XAC-X-BY630 (14) in aqueous buffer or methanol (Figure 7), which shows a marked quenching of both agents in aqueous environments. The clear imaging of membrane binding of XAC-X-BY630 (Figure 9) in CHO-A1 cells in the presence of Brilliant Black is also consistent with this conclusion.
The opposite influence of chain length on agonist activity of the dansyl and BODIPY 630/650 NECA derivatives is entirely consistent with this interpretation. That is, the BODIPY 630/650 fluorophore could potentially be placed within the transmembrane lipid environment of the A1 receptor binding site without interfering with agonist action even with short linker lengths, whereas the dansyl fluorophore may alternatively need to exit the binding pocket into the extracellular aqueous medium on a long linker to avoid unfavourable interactions with either the surrounding lipid environment or the receptor itself.
In summary, the present study adds further weight to the argument that design of a fluorescent ligand needs to take into account the influence of both the fluorophore and the associated linker on the pharmacology of the final product. Furthermore, our data strongly suggest that the physicochemical properties of the fluorophore/linker pairing ultimately determine where in the environment of the target receptor the fluorophore is located, and this, together with the environmental sensitivity of the resulting fluorescence, may ultimately decide its utility as a fluorescent probe.
Acknowledgments
JGB is a Wellcome Trust Clinician Scientist Fellow. LTM holds an NHMRC Fellowship. We thank Tim Self, Richard Proudman and Marleen Groenen for technical assistance. We thank Wellcome Trust, BBSRC and MRC for financial support.
Glossary
Abbreviations:
- ABEA
N6-(4-aminobutyl)-5′-ethylamino-5′-oxo-5′-deoxyadenosine
- ADOEA
N6-(8-amino-3,6-dioxaoctyl)-5′-ethylamino-5′-oxo-5′-deoxyadenosine
- AEAO
8-(2-aminoethylamino)-8-oxooctanoyl
- AHH
6-(6-aminohexanamido)hexanoyl
- AO
8-aminooctanoyl
- AOEA
N6-(8-aminooctyl)-5′-ethylamino-5′-oxo-5′-deoxyadenosine
- APEA
N6-(5-aminopentyl)-5′-ethylamino-5′-oxo-5′-deoxyadenosine
- APrEA
N6-(3-aminopropyl)-5′-ethylamino-5′-oxo-5′-deoxyadenosine
- AUEA
N6-(11-aminoundecyl)-5′-ethylamino-5′-oxo-5′-deoxyadenosine
- cAMP
cyclic AMP
- CGS 15943
5-amino-9-chloro-2-(2-furyl)1,2,4-trizolo[1,5-c]quinazoline
- CHO
Chinese hamster ovary
- CRE
cyclic AMP response element
- DMEM/F12
Dulbecco's modified Eagle's medium/nutrient mix F12
- DPCPX
8-cyclopentyl-1,3-dipropylxanthine
- FCS
fluorescence correlation spectroscopy
- GPCR
G protein coupled receptor
- HBS
HEPES-buffered salt solution
- HEPES
N-2-Hydroxyethylpiperazine-N′-2-ethanesulfonic acid
- NECA
5′ (N-ethylcarboxamido)adenosine
- pNPP
4-nitrophenyl phosphate
- PTX
Pertussis toxin
- SPAP
secreted placental alkaline phosphatase
- X
6-aminohexanoyl
- XAC
xanthine amine congener
Conflicts of interest
SJH and BK are founding directors of the University of Nottingham spin-out company CellAura Technologies Ltd. RM and LA are currently employed by CellAura Technologies Ltd.
References
- Alexander SPH, Mathie A, Peters JA. Guide to Receptors and Channels (GRAC), 3rd edition (2008 revision) Br J Pharmacol. 2008;153(Suppl. 2):S1–S209. doi: 10.1038/sj.bjp.0707746. [DOI] [PMC free article] [PubMed] [Google Scholar]
- Baker JG, Hill SJ. A comparison of the antagonist affinities for the Gi and Gs-coupled states of the human adenosine A1 receptor. J Pharmacol Exp Ther. 2007;320:218–228. doi: 10.1124/jpet.106.113589. [DOI] [PubMed] [Google Scholar]
- Baker JG, Hall IP, Hill SJ. Pharmacology and direct visualisation of BODIPY-TMR-CGP: a long acting fluorescent β2-adrenoceptor agonist. Br J Pharmacol. 2003;139:232–242. doi: 10.1038/sj.bjp.0705287. [DOI] [PMC free article] [PubMed] [Google Scholar]
- Briddon SJ, Hill SJ. Pharmacology under the microscope: The use of fluorescence correlation spectroscopy to determine the properties of ligand-receptor complexes. Trends Pharmacol Sci. 2007;28:637–645. doi: 10.1016/j.tips.2007.09.008. [DOI] [PMC free article] [PubMed] [Google Scholar]
- Briddon SJ, Middleton RJ, Cordeaux Y, Flavin FM, Weinstein JA, George MW, et al. Quantitative analysis of the formation and diffusion of A1-adenosine receptor-antagonist complexes in living cells. Proc Natl Acad Sci USA. 2004;101:4673–4678. doi: 10.1073/pnas.0400420101. [DOI] [PMC free article] [PubMed] [Google Scholar]
- Christopolous A, Kenakin T. G protein-coupled receptor allosterism and complexing. Pharmacol Rev. 2002;54:323–374. doi: 10.1124/pr.54.2.323. [DOI] [PubMed] [Google Scholar]
- Cordeaux Y, Briddon SJ, Megson AE, McDonnell J, Dickenson J, Hill SJ. Influence of receptor number on functional responses elicited by agonists acting at the human adenosine A1 receptor: evidence for signalling pathway-dependent changes in agonist potency and relative intrinsic activity. Mol Pharmacol. 2000;58:1075–1084. doi: 10.1124/mol.58.5.1075. [DOI] [PubMed] [Google Scholar]
- Cordeaux Y, IJzerman AP, Hill SJ. Coupling of the human A1 receptor to different heterotrimeric G proteins: evidence for agonist-specific G protein activation. Br J Pharmacol. 2004;143:705–714. doi: 10.1038/sj.bjp.0705925. [DOI] [PMC free article] [PubMed] [Google Scholar]
- Cordeaux Y, Briddon SJ, Alexander SPH, Kellam B, Hill SJ. Agonist occupied A3 adenosine receptors exist within heterogeneous complexes in membrane microdomains of individual living cells. FASEB J. 2008;22:850–860. doi: 10.1096/fj.07-8180com. [DOI] [PubMed] [Google Scholar]
- Daly CJ, McGrath JC. Fluorescent ligands, antibodies, and proteins for the study of receptors. Pharmacol Ther. 2003;100:101–118. doi: 10.1016/j.pharmthera.2003.08.001. [DOI] [PubMed] [Google Scholar]
- Emmerson PJ, Archer S, El-Harmouly W, Mansour A, Akil H, Medzihradsky F. Synthesis and characterization of 4-difluoro-4-bora 3a,4a-diazo-s-indacene (BODIPY)-labeled fluorescent ligands for the mu opioid receptor. Biochem Pharmacol. 1997;54:1315–1322. doi: 10.1016/s0006-2952(97)00374-2. [DOI] [PubMed] [Google Scholar]
- Fredholm BB, Ijzerman AP, Jacobson KA, Klotz KN, Linden J. International Union of Pharmacology XXV: nomenclature and classification of adenosine receptors. Pharmacol Rev. 2001;53:527–552. [PMC free article] [PubMed] [Google Scholar]
- Gines S, Ciruela F, Burgueno J, Casado V, Canela EI, Mallol J, et al. Involvement of caveolin in ligand-induced recruitment and internalization of A1 adenosine receptor and adenosine deaminase in an epithelial cell line. Molec Pharmacol. 2001;59:1314–1323. [PubMed] [Google Scholar]
- Harikumar KG, Pinon DI, Wessels WS, Prendergast FG, Miller LJ. Environment and mobility of a series of fluorescent reporters at the amino terminus of structurally related peptide agonists and antagonists bound to the cholecystokinin receptor. J Biol Chem. 2002;277:18552–18560. doi: 10.1074/jbc.M201164200. [DOI] [PubMed] [Google Scholar]
- Hayashida O, Ogawa N, Uchiyama M. Surface recognition and fluorescence sensing of histone by dansyl-appended cyclophane based resorcinarene trimer. J Am Chem Soc. 2007;129:13698–13705. doi: 10.1021/ja074906h. [DOI] [PubMed] [Google Scholar]
- Helmreich EJM. Environmental influences on signal transduction through membranes: A retrospective mini-review. Biophys Chem. 2003;100:519–534. doi: 10.1016/s0301-4622(02)00303-4. [DOI] [PubMed] [Google Scholar]
- Kenakin T. Allosteric modulators: the new generation of receptor antagonist. Mol Interv. 2004;4:222–229. doi: 10.1124/mi.4.4.6. [DOI] [PubMed] [Google Scholar]
- Libert F, Van Senade J, Lefort A, Czernilofsky A, Dumont JE, Vassart G, et al. Cloning and functional characterization of a human A1 adenosine receptor. Biochem Biophys Res Commun. 1992;187:919–926. doi: 10.1016/0006-291x(92)91285-x. [DOI] [PubMed] [Google Scholar]
- May LT, Leach K, Sexton PM, Christopolous A. Allosteric modulation of G protein-coupled receptors. Annu Rev Pharmacol Toxicol. 2007;47:1–51. doi: 10.1146/annurev.pharmtox.47.120505.105159. [DOI] [PubMed] [Google Scholar]
- Middleton RJ, Kellam B. Fluorophore-tagged GPCR ligands. Curr Opin Chem Biol. 2005;9:517–525. doi: 10.1016/j.cbpa.2005.08.016. [DOI] [PubMed] [Google Scholar]
- Middleton RJ, Briddon SJ, Cordeaux Y, Yates AS, Dale CL, George MW, et al. New fluorescent adenosine A1-receptor agonists which allow quantification of ligand-receptor interactions in microdomains of single living cells. J Med Chem. 2007;50:782–793. doi: 10.1021/jm061279i. [DOI] [PubMed] [Google Scholar]
- Olah ME, Styles GL. Adenosine receptor subtypes: characterization and therapeutic regulation. Annu Rev Pharmacol Toxicol. 1995;35:581–606. doi: 10.1146/annurev.pa.35.040195.003053. [DOI] [PubMed] [Google Scholar]
- Zajchowshi LD, Robbins SM. Lipid rafts and little caves – compartmentalized signalling in membrane microdomains. Eur J Biochem. 2002;269:737–752. doi: 10.1046/j.0014-2956.2001.02715.x. [DOI] [PubMed] [Google Scholar]