

Abstract
The purpose of this study was to combine a three-dimensional NMR-compatible bioreactor with hyperpolarized 13C NMR spectroscopy in order to probe cellular metabolism in real time. JM1 (immortalized rat hepatoma) cells were cultured in a three-dimensional NMR-compatible fluidized bioreactor. 31P spectra were acquired before and after each injection of hyperpolarized [1-13C] pyruvate and subsequent 13C spectroscopy at 11.7 T. 1H and two-dimensional 1H-1H-total correlation spectroscopy spectra were acquired from extracts of cells grown in uniformly labeled 13C-glucose, on a 16.4 T, to determine 13C fractional enrichment and distribution of 13C label. JM1 cells were found to have a high rate of aerobic glycolysis in both two-dimensional culture and in the bioreactor, with 85% of the 13C label from uniformly labeled 13C-glucose being present as either lactate or alanine after 23 h. Flux measurements of pyruvate through lactate dehydrogenase and alanine aminotransferase in the bioreactor system were 12.18 ± 0.49 nmols/sec/108 cells and 2.39 ± 0.30 nmols/sec/108 cells, respectively, were reproducible in the same bioreactor, and were not significantly different over the course of 2 days. Although this preliminary study involved immortalized cells, this combination of technologies can be extended to the real-time metabolic exploration of primary benign and cancerous cells and tissues prior to and after therapy.
Keywords: hyperpolarized, carbon, DNP, metabolism, flux, bioreactor
There is growing interest in the changes in fluxes through a variety of metabolic pathways associated with the evolution and progression of cancer (1–7) and its response to therapy. Recently, dynamic nuclear polarization (DNP) spectroscopic techniques have been used to study these metabolic fluxes in real time (8,9). Focus has been placed on changes in pathways associated with lipid synthesis and degradation (10,11), bioenergetics (12,13), and redox potential (14,15). Increases in lactate dehydrogenase (LDH) activity (8,9), changes in glutaminolysis (2), and decreases in pyruvate kinase activity (1) have been associated with cancer. These studies have been conducted primarily in extracts of cell cultures (3) or by way of in vivo animal studies (16–18). Cell culture studies provide a controlled platform for long-term metabolic studies, but they are tedious since each measurement requires new cells. In contrast, in in vivo studies the same animal can be used for multiple metabolic measurements, but they are more costly, are biologically heterogeneous, require many animals to be sacrificed, and are inefficient for the initial screening of novel metabolic tracers.
For the last 3 decades, cell perfusion or “bioreactor” systems have been developed in an attempt to address these fundamental issues (15,19,20). These three-dimensional culture perfusion systems have allowed the monitoring of steady-state metabolites and their changes with time (21,22), typically through the analysis of output parameters such as concentrations of lactate, glucose, and alanine in media (23). Studies have also been performed in order to assess slow metabolic processes, such as phospholipid (24), glutathione (25), and glutamine metabolism (26), but these systems do not have the temporal resolution to study fast kinetic reactions.
Due to the dynamic nature of cellular metabolism and its instantaneous response to changing stimuli (environmental, genetic, etc.) the study of flux through pathways, now dubbed “fluxomics”, has become a rapidly expanding area of research in metabolomics (27,28). An inherent problem associated with determining real-time fluxes is the speed of some metabolic reactions. Enzymes of clinical interest, such as LDH, have been measured to have relatively high velocities (29), and thus measurement of flux through LDH in a living system is difficult. While glucose conversion to lactate by 13C NMR has been achieved, it has involved long glucose infusion periods relative to the rates of the reactions in tissues of interest (30). A great deal of work has been done determining steady-state metabolite concentrations and inferring metabolic flux by mass spectrometry (31), NMR (32), and spectrophotometry (33). However, these traditional methods require the system to be quenched and extracted for each time point necessary to calculate flux. NMR spectroscopy is a research tool that can be readily translated to the clinic. 13C NMR spectroscopy provides high spectral resolution and has been used to study metabolic fluxes in a variety of systems (34). The major shortcoming of 13C NMR spectroscopy is its lack of sensitivity due to a low gyromagnetic ratio (γ), resulting in the inability to measure flux with high spatial and temporal resolution. This major hindrance has been recently overcome through the development of DNP NMR spectroscopy (35). 13C-labeled substrates have been recently polarized using DNP techniques to obtain tens-of-thousands-fold enhancement of 13C NMR signals of the substrate and its metabolic products, enabling measurement of rapid metabolic fluxes such as those catalyzed by LDH and alanine aminotransaminase (ALT).
Recent studies of hyperpolarized 13C-labeled compounds, by way of the DNP method (8,9,36), have been used to investigate metabolic processes associated with increases in aerobic glycolysis, deemed the Warburg effect (36,37). The Warburg intermediates (elevated lactate, alanine, and pyruvate) have been used as a way to characterize cancer aggressiveness (8) and response to therapy (9). In this study, JM1 (immortalized rat hepatoma) cells were cultured in a three-dimensional NMR-compatible bioreactor (38), and injections of hyperpolarized [1-13C] pyruvate were used to serially measure LDH and ALT fluxes in real time.
MATERIALS AND METHODS
Cell Culture and Bioreactor
JM1 rat hepatoma cells (Michalopoulos Lab, University of Pittsburgh, PA) were cultured in Dulbecco’s modified Eagle’s medium (Invitrogen; 3 g/L glucose) supplemented with 10% fetal calf serum, 100 units/mL penicillin, and 100 μg/mL streptomycin (Invitrogen, Carlsbad, CA). Cells were grown in T150-flasks (Fisher Scientific, Pittsburgh, PA) to incubated at 37°C in a 95% air/5% CO2 incubator. For two-dimensional (2D) culture extract experiments, cells were plated on 150-cm2 coated plates (Fisher Scientific) and grown to less than 90% confluency (12.6 × 10⁶ cells). Medium was changed for each plate and replaced with analogous medium supplemented with uniformly labeled 13C-glucose (Cambridge Isotope Labs, Andover, MA). Plates were allowed to progress for 23 h (n = 4). At each time point, an aliquot of medium was collected, and plates were washed twice with ice-cold phosphate-buffered saline and extracted in ice-cold methanol as previously described (39). Residual pellets were also extracted in deuterated chloroform to assess the labeling of lipids (40). Fractional enrichment (FE) was defined as the percentage of 13C-labeled compound relative to the total pool.
For bioreactor experiments, cells were trypsinized, washed in phosphate-buffered saline, and electrostatically encapsulated at a concentrations of 25 (n = 1), 50 (n = 2), and 127 × 106 (n = 1) cells/mL in 500-μm beads, as previously described (41). Approximately 1.5 mL of encapsulates was perfused using the same medium formulation as above, recirculated at a rate of 4 mL/min. The bioreactor loop contains 40 mL in circulation. Medium was kept at a constant 37°C by way of water-jacketed lines, and gas pressures were maintained by a gas exchange module using 95% air/5% CO2 gas, as previously described (42). A schematic of the bioreactor system is shown in Fig. 1. Encapsulates were removed at the end of the experiment, embedded in optimal cutting temperature, and stained with hematoxylin and eosin as previously described (7) to confirm cells were greater than 90% viable.
FIG. 1.
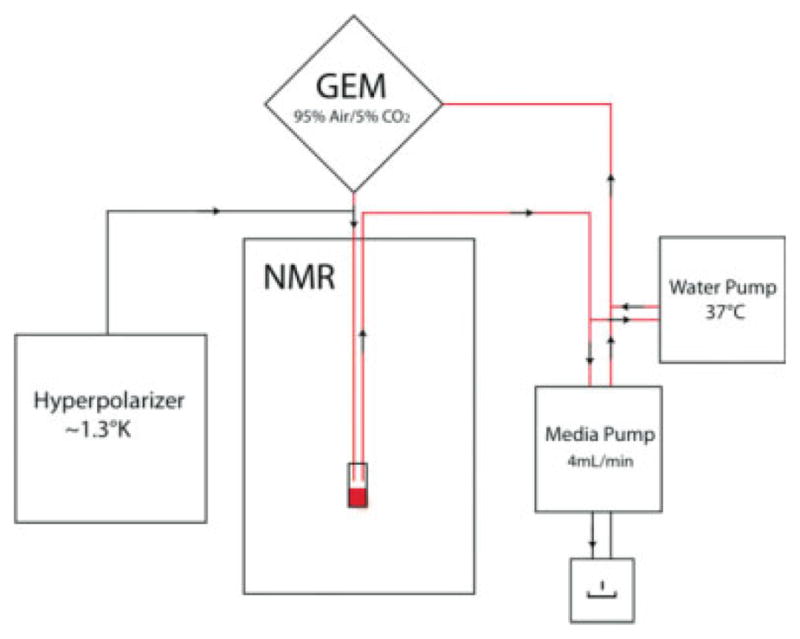
Schematic of bioreactor setup. The red line indicates the flow of media as it recirculates in the bioreactor. GEM, gas exchange module.
Hyperpolarization Methods
[1-13C]-pyruvate was hyperpolarized by the DNP method (35) using the Hypersense® (Oxford Instruments, Oxford, UK) to an average polarization of ~15%. The compound polarized was a mixture of [1-13C]-pyruvic acid (14.2 M) and the trityl radical (15 mM; tris[8-carboxyl-2,2,6,6-tetra[2-(1-hydroxyethyl)]-benzo(1,2-d:4,5-d)bis(1,3)dithiole-4-yl]methyl sodium salt) (GE Health, Menlo Park, CA). Samples were dissolved in a dissolution solution containing NaPO4 (50 mM)/ethylenediaminetetraacetic acid (EDTA) (0.3 mM) to bring the sample to the desired concentration and average pH of 7.5. A solution of 1 mL of the hyperpolarized pyruvate was injected into the bioreactor system with continuous flow, resulting in a final concentration of between 2- and 14-mM pyruvate. Higher concentrations were used in bioreactors, which contained a higher cell concentration. This was done to keep the same relative substrate concentration throughout the group of bioreactors. The bioreactor is water jacked and there were no observed temperature changes in the cell mass during the studies. These concentrations were kept constant relative to the encapsulated cell concentration, allowing the cell suspension to see an analogous influx of mass of pyruvate at each injection.
NMR Acquisition and Analysis
Cell extract samples were placed in a Speed-Vac® for 8 h to evaporate the methanol. Cell pellets were then reconstituted in 100% deuterium oxide (D2O) (with 2.5 mM 3-(trimethylsilyl) propionic acid (TSP) both from Sigma-Aldrich, St. Louis, MO for quantification). Media aliquots were supplemented with 10% D2O (and a final concentration of 2.5 mM TSP). 1H and 2D 1H-1H total correlation spectroscopy spectra were acquired at 16.4 T on a Varian INOVA (700-MHz 1H; Varian Instruments, Palo Alto, CA) equipped with 5mm 1H/13C indirect probe at 25°C. 1H spectra of extracts were acquired using a total pulse repetition time of 12.65 sec, number of transients of 64, and a 90° flip angle. Data were analyzed using ACD Labs 9.0 1D NMR Processor (ACD Labs, Toronto, Ontario). 1H spectra were zero filled to 32,000 points, line broadened 0.5 Hz using an exponential gaussian function. Peaks and 13C satellites corresponding to glucose, lactate, alanine, glutamate, and the nucleotide spin systems of the purines and pyrimidines (AXP+GXP, UXP+CXP) were peak fit and quantified relative to TSP in ACD, as previously described (34,43).
2D total correlation spectroscopy (TOCSY) data were acquired with pulse repetition time = 2.48 sec, number of transients = 16, and number of indirect dimension increments of 64. Data were linear predicted in 3 × N in the indirect dimension and zero filled to 2000 points. The data were 2D Fourier transformed, and cross-peaks corresponding to unlabeled and 13C-labeled lactate, alanine, glutamate, and the ribose of nucleotides were volume integrated, as previously described (34). These points were then used to calculate FE as the sum of the of center cross-peaks to the total volume. The peak areas from the one-dimensional 1H and volumes from the 2D 1H-1H total correlation spectroscopy (TOCSY) were used to calculate the absolute number of millimoles of each compound that was generated as a result of uniformly labeled 13C-glucose metabolism.
For bioreactor studies, 13C and 31P spectra were acquired on an 11.7-T Varian INOVA (125-MHz 13C and 202-MHz 31P; Varian Instruments) equipped with a 10mm, triple-tune, direct-detect, broadband probe at 37°C. 31P time courses were acquired before and after hyperpolarized injections, using a pulse repetition time = 3 sec, number of transients = 1024, and a 90° flip angle. 31P spectra were zero filled to 40,000 points and line broadened 15 Hz. Assessment of changes in the β-nucleotide triphosphate (βNTP) resonances as a function of time was used to monitor cell health through the progression of the bioreactor experiments in vivo. Hyperpolarized 13C experiments were acquired using a 5° flip angle and pulse repetition time = 3 sec and acquired for 300 sec. Data were zero filled to 16,000 points and line broadened 5 Hz. The resonances of pyruvate (171 ppm), lactate (182 ppm) and alanine (175 ppm) were integrated and compared as a function of time to determine the characteristics of enzymatic interconversion as a result of pyruvate injections. Fluxes were determined using a model of LDH and ALT labeling flux implemented in Interactive Data Language (ITT Visual Information Solutions, Boulder, CO) normalized for injected hyperpolarized pyruvate concentration and cell concentration estimated from relative changes in βNTP peak area. Briefly, the pyruvate peak area over time (Mp) was modeled to determine the arrival time (ta), rate of injection (ki), and signal decay of pyruvate (kp).
| [1] |
The te represents the end of the pyruvate injection time. These fitted parameters were then used to fit the 13C lactate and alanine data to estimate LDH and ALT labeling fluxes (kpx), where x represents either lactate or alanine (2).
| [2] |
One pool of pyruvate, lactate, and alanine was assumed in this model. In contrast to the model described by Day and coworkers (9), this model includes the rate of injection, which is a result of the flow of material into the bioreactor. This is not necessary in a model of cells in a nonperfused system but is important when small tip angles are used to assess magnetization as the substrate is flowing into the system. The exchange of lactate and alanine back to pyruvate was not included in this model, and therefore we are not measuring a kinetic constant but purely a measure of hyperpolarized label generation in time, or overall flux, which is specific for a given cell line or tissue under a given set of conditions. The large amount of hyperpolarized lactate observed in this study is consistent with the high LDH Keq in favor of lactate (44), as well as in prior in vivo studies of hyperpolarized [1-13C] pyruvate (8,9,36,45).
RESULTS AND DISCUSSION
Extracts of 2D Cultures and Determination of the Mass Balance of Uniformly Labeled 13C-Glucose
Figure 2a is a representative 1H spectrum of the aliphatic region obtained from a methanol extraction of JM1 cells after metabolism of 13C-substrate for 23 h. 13C satellites of lactate, alanine, glutamate (both as glutamate (Glut) and as the glutamyl group of the tripeptide glutathione (GSH)), and the nucleotide riboses (not pictured) are visible. The concentrations of these five compounds plus pyruvate and glucose in the initial medium formulation and at 23 h from the cell methanol extract and 2D culture media are given in Table 1. In comparison to normal rat liver (46), the JM1 rat hepatoma cell line produces significantly more lactate and alanine, and ribose (Table 1), demonstrating the Warburg effect and pentose phosphate pathway products for nucleotide synthesis, respectively. They also demonstrate a high concentration of glutathione, which has been observed in other cell lines such as MCF-7 human breast cancer (47) and DU145 prostate cancer cells (48). In fact, one of the largest resonances in the 1H spectrum is from glutathione (Fig. 2a).
FIG. 2.

a: Representative 1H spectrum of water soluble metabolites at 23 h. b: Representative total correlation spectroscopy spectra showing FE of compounds by infusion of uniformly labeled 13C-glucose. c: Cancer metabolic phenotype. Percentages ± standard of deviation are shown for the distribution of 13C compounds in the cell as a result of medium supplemented with uniformly labeled 13C glucose. The DNP pyruvate arrow denotes the mechanism for infusion of hyperpolarized pyruvate and its relationship to the distributions measured in 2D cultures of JM1 cells. Yellow box: glucose transporter (GLUT) (1,3,4); blue box: MCT: monocarboxylate transporter (predominantly 4). Light blue: pentose phosphate pathway (PPP) flux into ribose etc. Pink box: anaerobic/aerobic glycolysis. Light yellow box: tricarboxylic acid cycle (TCA). Aqua box: urea cycle. Light red box: fatty acid synthesis as a result of exchange with TCA pathway. Light green box: flux through ALT and into protein synthesis. *Indication of methodology of hyperpolarized pyruvate. **In lipid extracts, carbon labeling was below detection.
Table 1.
Glucose, Pyruvate, Glutamate, Glutamine, Alanine, Lactate, X-Purine, X-Pyrimidine, and Glutathione Concentrations in the Cell Methanol Extract (t = 23 h), Medium From 2D Cultures at 23 h, and From the Initial Medium Formulation
| Initial medium (μmols/15 mL) | 2D cultures (methanol) (μmols/106 cells) | 2D cultures (media) (μmol) | |
|---|---|---|---|
| Glucose | 249 | — | 111.84 ± 7.61 |
| Pyruvate | 15 | — | — |
| Glutamate | 0 | 0.037 ± 0.002 | — |
| Glutamine | 60 | — | 53.95 ± 0.63 |
| Glutathione | 0 | 0.046 ± 0.004 | — |
| Alanine | 0 | 0.026 ± 0.003 | 17.07 ± 1.53 |
| Lactate | 0 | 0.091 ± 0.007 | 242.57 ± 15.79 |
| X-Purine | 0 | 0.002 ± 0.0004 | — |
| X-Pyrimidine | 0 | 0.002 ± 0.0005 | — |
— Indicates compounds that were not detected by NMR.
Representative regions of a typical 2D 1H-1H total correlation spectroscopy spectrum are shown in Fig. 2b, demonstrating cross-peaks used to determine the 13C FE of the previously mentioned compounds. At 23 h, lactate and alanine FEs are 88.9 ± 2.9% and 57.8 ± 3.1%, respectively. The glutamate and glutamyl of GSH have FEs of 7.1 ± 2.2% and 10.1 ± 2.4%, respectively. The FEs of the ribose in nucleotides were similar for both purines and pyrimidines, enriching to 91.6 ± 2.7 and 91.5 ± 3.8%. It is important to note that after 5 min, the lactate pool inside the cell had an FE of 55.1 ± 7.9%, while that of alanine was 14.0 ± 5.9%. Glutamate labeling was not detectable at 5 min. Not surprising was that lipids were not labeled to a detectable level, likely because lipids form from anaplerotic products of the Krebs cycle. These intermediates were at most labeled to 10%, as can be inferred from the glutamate FE, and in turn could have internal labeled the lipids to a level below detection in this study.
By quantifying the absolute number of micromoles of 13C for each compound at 23 h in the cell, a distribution of label can be generated, which is shown in Fig. 2c. Nearly 85% of the label is present as either lactate or alanine in JM1 cells after 23 h. Activity of the pentose phosphate pathway in converting glucose to the ribose backbone of nucleotides accounts for approximately 4.7% of the 13C label distribution, while another 9.2% are resident in glutamate (half of which is GSH). At the 23 h time point, each 150-cm2 plate of JM1 cells had produced 242.57 ± 15.79 μmol of lactate and 17.7 ± 1.53 μmol of alanine and exported it to the medium.
Bioreactor Cultures of JM1 Cells and 31P NMR Studies
31P spectra were used to monitor changes in cell energetics with growth over time. Figure 3a shows a representative 500-μm bead of encapsulated JM1 cells, cryo-sectioned and stained by hematoxylin and eosin at 20× magnification. JM1 cells were evenly distributed throughout the alginate beads and were predominantly spherical. Figure 3b shows a representative 31P spectrum of JM1 cells encapsulated to a concentration of 1.2 × 10⁸ cells/mL at 4 h of perfusion in the bioreactor. NMR signals for the phosphates of the NTPs (γNTP, αNTP, and βNTP), phosphocholine, inorganic phosphate, glycerol phosphocholine, glycerophosphoethanolamine, nicotinamide (reduced and oxidized), diphosphodiesters (most commonly (UDP) uridine diphosphate UDP-glucose) (15,16) and the sugar phosphate groups (sugar PO4−3) are readily visible.
FIG. 3.

Representative 31P and histology of encapsulated beads. a: Hematoxylin and eosin–stained section of a 500-μm bead of encapsulated JM1 cells at 20× magnification. b: representative 31P spectrum at 4 h postencapsulation and perfusion in the bioreactor. γNTP, αNTP, and βNTP represent the phosphates of the NTPs. PC, phosphocholine; Pi, inorganic phosphate (this peak is composed of the Pi inside and outside the cell); GPC, glycerolphosphocholine; GPE, glycerophosphoethanolamine; NAD(H), nicotinamide (reduced and oxidized); DPDE, diphosphodiesters, most commonly UDP glucose; sugar PO4, sugar phosphate groups.
Figure 4a shows a representative 31P time course of βNTP changes of JM1 cells growing in the bioreactor over the time course of the bioreactor studies. The dotted red lines indicate the time of injection of hyperpolarized [1-13C] pyruvate. Increases in βNTP correlate to the cell concentration and are indicative of the cell growth with time (13,15,21,49). About 80% of βNTP is adenine nucleotide and about 90% is NMR visible in rat liver (50). As cells grew inside of the bioreactor, hyperpolarized [1-13C] pyruvate was injected to assess conversion of pyruvate to its metabolic products. Figure 4b demonstrates 31P spectra before and immediately after two injections of hyperpolarized [1-13C] pyruvate at 4 and 18.5 h. Increases in the 31P resonances at the later time point demonstrate that the cells not only survive the injection but also continue to grow over time.
FIG. 4.

31P monitoring and dynamic 13C spectra of JM1 cells. a: A 31P time course showing the relative changes in βNTP as JM1 cells encapsulated at a concentration of 127 × 106 cells/mL change over time. b: Before and after 31P spectra at the dictated time points of injection of 1 mL of 7.1-mM hyperpolarized pyruvate, 4 h and 18.5 h, respectively. c: 13C spectra at 90 sec postinjection, demonstrating the conversion of pyruvate (171 ppm) to lactate (182 ppm) and alanine (175 ppm).
Previous 31P NMR studies of NMR-compatible bioreactors containing alginate-encapsulated transformed cells (51) showed that cells are viable for several days. Here we demonstrate that the cells double in a comparable period of time as in 2D cultures of JM1 (49). This is likely due to the uniform diameter of 500 μm, which was permitted by use of electrostatic encapsulation. In normal aerobic cells such as hepatocytes, the diffusion distance for oxygen is typically 200 μm; cells become hypoxic at greater diffusion distances (38,52). Transformed cells consume less oxygen than primary hepatocytes at 250 μm, the maximal diffusion distance in the 500-μm diameter encapsulates. Although an oxygen gradient is created in the 500-μm-diameter encapsulates, dictated by the diffusion coefficient and oxygen consumption rate, there would be little or no hypoxic zone within the encapsulate compared to previous studies that used >1mm diameter (51). In short, the relatively small and uniform diameter of the encapsulates permitted sufficient diffusion of hyperpolarized [1-13C] pyruvate to the cells.
Bioreactor Cultures of JM1 Cells and 13C NMR DNP Studies
Figure 4c demonstrates injections of 1 mL of 7.1-mM hyperpolarized [1-13C] pyruvate at 4 h and 18.5 h in the same bioreactor system. Each 13C spectrum is at 90 sec postinjection and shows the high signal-to-noise ratio of labeled lactate and alanine as a result of interconversion from the injected pyruvate. The spectrum on the right exhibits higher SNR, due to the characteristic cell growth over time of the JM1 cells in the bioreactor. Lactate and alanine production as a result of flux through LDH and ALT, respectively, was seen to scale with cell concentration, as expected.
Hyperpolarized 13C spectra were integrated and time courses of lactate and alanine were generated. Figure 5 shows the 13C spectrum of a bioreactor at 84 sec postinjection (Fig. 5a) and its representative signal over time (Fig. 5b). The influx of pyruvate as a result of the injection is shown, and peaks corresponding to its metabolic products, lactate and alanine, are observed within 2 scans (i.e., 6 sec) of the pyruvate signal. A representative time course of 13C lactate, alanine, and pyruvate is shown in Fig. 5c. This data were fit to a two-state model of the interconversion of pyruvate to lactate and alanine, and the fit is shown as the solid line through the raw data. The flux rates of [1-13C] pyruvate to [1-13C] lactate and [1-13C] alanine, facilitated by LDH and ALT, were determined to be 12.18 ± 0.49 nmols/sec/108 cells and 2.39 ± 0.30 nmols/sec/108 cells, respectively. The low standard error (SE) in the bioreactor supports the reproducibility of the system as a real-time measurement of the flux through LDH. The measurement for ALT flux exhibited a higher standard error, most likely due to the lower signal to noise of [1-13C] alanine in hyperpolarized studies, in comparison to lactate. Figure 5d demonstrates the differences between flux measurements that were made on the first and second day in the bioreactor system. LDH flux and ALT flux were not found to be significantly different between the two days (P = 0.4 and 0.6, respectively). Multiple injections of hyperpolarized [1-13C] pyruvate were done on all bioreactors, yielding similar results, thus reinforcing the robustness of not only the bioreactor system but also the flux measurement by hyperpolarized [1-13C] pyruvate injection. These data suggest that differences in metabolic fluxes with cellular perturbations (i.e., changing oxygen tension, metabolic substrates, and/or therapy) as small as 5% can be measured in the bioreactor. Also, having accurate control over the bead size (500 μm) of the encapsulated cells provided an environment in which all cells are equally perfused (i.e., the 250-μm diffusion limit was maintained), a situation that is closer to physiologic than provided by other NMR-compatible bioreactors (19,38,49,51).
FIG. 5.

Study in bioreactor of JM1 cells at a concentration of 50 × 106 cells/mL. a: 13C spectrum acquired at 84 sec postinjection of 2 mL of 3.56-mM hyperpolarized pyruvate. b: Every third 13C spectrum acquired demonstrating the hyperpolarized 13C labeling of lactate (Lac) and alanine (Ala) as result of 13C pyruvate (Pyr). Pyruvate hydrate (Pyr-H) is also shown, which is in equilibrium with pyruvate. c: Red dots, pyruvate; blue dots, lactate ×10; green dots, alanine ×10; the lines for each respective color are the fits as a result of the flux model for 13C labeling of lactate and alanine via LDH and ALT, respectively. d: LDH (blue) and ALT (red) flux measurements for days 1 and 2 in the bioreactors.
The pyruvate metabolism in the bioreactor system, assessed by the DNP method, demonstrated fluxes through LDH and ALT analogous to those of glucose in the standard 2D culture system. Unlike the first cell study showing flux through LDH by DNP (9), concentrations in this study (Table 1) were closer to the physiologic conditions, as a result of continuous perfusion. The bolus of pyruvate creates a spike in pyruvate concentration that is similar for both perfused bioreactor and in vivo magnetic resonance spectroscopic imaging (MRSI) studies (1). Typically, the serum concentrations for these compounds are in the half to several millimolar range, and medium is near this range, except for glucose, which is several fold higher (25 mM [4.5g/L] vs 3.9 to 6.1 mM [0.7–1.1 g/L]) (52), as well as pyruvate, which is very low in serum (500 μM vs 100 μM). The goal of this study was to generate a model similar to an animal model. Although in both bioreactor and in vivo DNP studies a nonphysiologic bolus of pyruvate is given, a similar dose can be given in both cases for comparison of the ex vivo and in vivo fluxes. This information can be used in order to rapidly test novel molecules and save time, money, and animal lives for development of DNP imaging.
Metabolic fluxes, even for kinetically fast enzymes such as LDH, can be measured while maintaining cells in a physiologically viable state. This also allows for the monitoring of enzyme concentration, as well as real-time metabolism by way of modulation of substrate concentration. Combining 13C labeling interleaved between hyperpolarized 13C studies would allow for the assessment of both kinetically fast and slow metabolic processes. It must be noted that hyperpolarized 13C studies may not be appropriate for measuring slower metabolic fluxes or sequential steps in an enzymatic pathway (i.e., flux to glutamate or fatty acids). However, the dramatic increase in sensitivity provided by DNP will potentially allow for the measurement of fast metabolic fluxes in people.
Summary
This study demonstrates that hyperpolarized 13C NMR can be combined with an NMR-compatible bioreactor to measure metabolic fluxes in three-dimensional cell cultures. JM1 hepatoma cells were found to have a high rate of aerobic glycolysis in both conventional 2D culture and in the bioreactor. The high sensitivity of hyperpolarized 13C NMR allowed the measurement of metabolic fluxes in real time. Although this preliminary study involved immortalized cells, this combination of technologies could be extended to the real-time metabolic exploration of primary benign and cancerous cells and tissues.
Acknowledgments
National Institutes of Health; Grant numbers: R21 EB007588, R21 GM075941.
The project was funded by the National Institutes of Health, NIH R21 EB007588 (J.K.) and R21 GM075941 (J.M.M.). We appreciate the technical support of Dr. Pediatidakis for acquisition and culture of JM1 cells.
References
- 1.Christofk H, Vander Heiden M, Harris M, Ramanathan A, Gerszten R, Wei R, Fleming M, Schreiber S, Cantley L. The M2 splice isoform of pyruvate kinase is important for cancer metabolism and tumour growth. Nature. 2008;452:230–233. doi: 10.1038/nature06734. [DOI] [PubMed] [Google Scholar]
- 2.DeBerardinis RJ, Lum JJ, Hatzivassiliou G, Thompson CB. The biology of cancer: metabolic reprogramming fuels cell growth and proliferation. Cell Metab. 2008;7:11–20. doi: 10.1016/j.cmet.2007.10.002. [DOI] [PubMed] [Google Scholar]
- 3.Fan TW, Kucia M, Jankowski K, Higashi RM, Ratajczak J, Ratajczak MZ, Lane AN. Rhabdomyosarcoma cells show an energy producing anabolic metabolic phenotype compared with primary myocytes. Mol Cancer. 2008;7:79. doi: 10.1186/1476-4598-7-79. [DOI] [PMC free article] [PubMed] [Google Scholar]
- 4.Gatenby RA, Gillies RJ. Glycolysis in cancer: a potential target for therapy. Int J Biochem Cell Biol. 2007 doi: 10.1016/j.biocel.2007.03.021. [DOI] [PubMed] [Google Scholar]
- 5.Hsu PP, Sabatini DM. Cancer cell metabolism: Warburg and beyond. Cell. 2008;134:703–707. doi: 10.1016/j.cell.2008.08.021. [DOI] [PubMed] [Google Scholar]
- 6.Munger J, Bennett B, Parikh A, Feng X, Mcardle J, Rabitz H, Shenk T, Rabinowitz J. Systems-level metabolic flux profiling identifies fatty acid synthesis as a target for antiviral therapy. Nat Biotechnol. 2008;26:1179–1186. doi: 10.1038/nbt.1500. [DOI] [PMC free article] [PubMed] [Google Scholar]
- 7.Tessem M, Swanson MG, Keshari KR, Albers MJ, Joun D, Tabatabai ZL, Simko J, Shinohara K, Nelson SJ, Vigneron DB, Gribbestad IS, Kurhanewicz J. Evaluation of lactate and alanine as metabolic biomarkers of prostate cancer using 1H HR-MAS spectroscopy of biopsy tissues. Magn Reson Med. 2008;60:510–516. doi: 10.1002/mrm.21694. [DOI] [PMC free article] [PubMed] [Google Scholar]
- 8.Albers MJ, Bok R, Chen AP, Cunningham CH, Zierhut ML, Zhang VY, Kohler SJ, Tropp J, Hurd RE, Yen YF, Nelson SJ, Vigneron DB, Kurhanewicz J. Hyperpolarized 13C lactate, pyruvate, and alanine: noninvasive biomarkers for prostate cancer detection and grading. Cancer Res. 2008;68:8607–8615. doi: 10.1158/0008-5472.CAN-08-0749. [DOI] [PMC free article] [PubMed] [Google Scholar]
- 9.Day SE, Kettunen MI, Gallagher FA, Hu DE, Lerche M, Wolber J, Golman K, Ardenkjaer-Larsen JH, Brindle KM. Detecting tumor response to treatment using hyperpolarized 13C magnetic resonance imaging and spectroscopy. Nat Med. 2007;13:1382–1387. doi: 10.1038/nm1650. [DOI] [PubMed] [Google Scholar]
- 10.Ackerstaff E, Glunde K, Bhujwalla ZM. Choline phospholipid metabolism: a target in cancer cells? J Cell Biochem. 2003;90:525–533. doi: 10.1002/jcb.10659. [DOI] [PubMed] [Google Scholar]
- 11.Iorio E, Mezzanzanica D, Alberti P, Spadaro F, Ramoni C, D’Ascenzo S, Millimaggi D, Pavan A, Dolo V, Canevari S, Podo F. Alterations of choline phospholipid metabolism in ovarian tumor progression. Cancer Res. 2005;65:9369–9376. doi: 10.1158/0008-5472.CAN-05-1146. [DOI] [PubMed] [Google Scholar]
- 12.Bonarius HP, Ozemre A, Timmerarends B, Skrabal P, Tramper J, Schmid G, Heinzle E. Metabolic-flux analysis of continuously cultured hybridoma cells using (13)CO(2) mass spectrometry in combination with (13)C-lactate nuclear magnetic resonance spectroscopy and metabolite balancing. Biotechnol Bioeng. 2001;74:528–538. doi: 10.1002/bit.1145. [DOI] [PubMed] [Google Scholar]
- 13.Kurhanewicz J, Dahiya R, Macdonald JM, Jajodia P, Chang LH, James TL, Narayan P. Phosphorus metabolite characterization of human prostatic adenocarcinoma in a nude mouse model by 31P magnetic resonance spectroscopy and high pressure liquid chromatography. NMR Biomed. 1992;5:185–192. doi: 10.1002/nbm.1940050405. [DOI] [PubMed] [Google Scholar]
- 14.Thelwall PE, Yemin AY, Gillian TL, Simpson NE, Kasibhatla MS, Rabbani ZN, Macdonald JM, Blackband SJ, Gamcsik MP. Noninvasive in vivo detection of glutathione metabolism in tumors. Cancer Res. 2005;65:10149–10153. doi: 10.1158/0008-5472.CAN-05-1781. [DOI] [PubMed] [Google Scholar]
- 15.Gillies RJ, Liu Z, Bhujwalla ZM. 31P-MRS measurements of extracellular pH of tumors using 3-aminopropylphosphonate. Am J Physiol. 1994;267(1 pt 1):C195–203. doi: 10.1152/ajpcell.1994.267.1.C195. [DOI] [PubMed] [Google Scholar]
- 16.Macdonald JM, Schmidlin O, James TL. In vivo monitoring of hepatic glutathione in anesthetized rats by 13C NMR. Magn Reson Med. 2002;48:430–439. doi: 10.1002/mrm.10244. [DOI] [PubMed] [Google Scholar]
- 17.Jucker BM, Lee JY, Shulman RG. In vivo 13C NMR measurements of hepatocellular tricarboxylic acid cycle flux. J Biol Chem. 1998;273:12187–12194. doi: 10.1074/jbc.273.20.12187. [DOI] [PubMed] [Google Scholar]
- 18.van Zijl PC, Jones CK, Ren J, Malloy CR, Sherry AD. MRI detection of glycogen in vivo by using chemical exchange saturation transfer imaging (glycoCEST) Proc Natl Acad Sci USA. 2007;104:4359–4364. doi: 10.1073/pnas.0700281104. [DOI] [PMC free article] [PubMed] [Google Scholar]
- 19.Mancuso A, Fernandez EJ, Blanch HW, Clark DS. A nuclear magnetic resonance technique for determining hybridoma cell concentration in hollow fiber bioreactors. Biotechnology (NY) 1990;8:1282–1285. doi: 10.1038/nbt1290-1282. [DOI] [PubMed] [Google Scholar]
- 20.Wolfe SP, Hsu E, Reid LM, Macdonald JM. A novel multi-coaxial hollow fiber bioreactor for adherent cell types, part 1: hydrodynamic studies. Biotechnol Bioeng. 2002;77:83–90. doi: 10.1002/bit.10081. [DOI] [PubMed] [Google Scholar]
- 21.Mancuso A, Zhu A, Beardsley NJ, Glickson JD, Wehrli S, Pickup S. Artificial tumor model suitable for monitoring 31P and 13C NMR spectroscopic changes during chemotherapy-induced apoptosis in human glioma cells. Magn Reson Med. 2005;54:67–78. doi: 10.1002/mrm.20545. [DOI] [PubMed] [Google Scholar]
- 22.Farghali H, Caraceni P, Rilo HL, Borle AB, Gasbarrini A, Gavaler JS, Van Thiel DH. Biochemical and 31P-NMR spectroscopic evaluation of immobilized perfused rat Sertoli cells. J Lab Clin Med. 1996;128:408–416. doi: 10.1016/s0022-2143(96)80013-8. [DOI] [PubMed] [Google Scholar]
- 23.Bailey JE, Ollis DF. Biochemical engineering fundamentals. New York: McGraw-Hill; 1986. p. 928. [Google Scholar]
- 24.Beloueche-Babari M, Jackson LE, Al-Saffar NM, Eccles SA, Raynaud FI, Workman P, Leach MO, Ronen SM. Identification of magnetic resonance detectable metabolic changes associated with inhibition of phosphoinositide 3-kinase signaling in human breast cancer cells. Mol Cancer Ther. 2006;5:187–196. doi: 10.1158/1535-7163.MCT-03-0220. [DOI] [PubMed] [Google Scholar]
- 25.Gamcsik MP, Millis KK, Colvin OM. Noninvasive detection of elevated glutathione levels in MCF-7 cells resistant to 4-hydroperoxycyclophosphamide. Cancer Res. 1995;55:2012–2016. [PubMed] [Google Scholar]
- 26.DeBerardinis RJ, Mancuso A, Daikhin E, Nissim I, Yudkoff M, Wehrli S, Thompson CB. Beyond aerobic glycolysis: transformed cells can engage in glutamine metabolism that exceeds the requirement for protein and nucleotide synthesis. Proc Natl Acad Sci USA. 2007;104:19345–19350. doi: 10.1073/pnas.0709747104. [DOI] [PMC free article] [PubMed] [Google Scholar]
- 27.Droste P, Weitzel M, Wiechert W. Visual exploration of isotope labeling networks in 3D. Bioprocess Biosyst Eng. 2008;31:227–239. doi: 10.1007/s00449-007-0177-1. [DOI] [PubMed] [Google Scholar]
- 28.Massou S, Nicolas C, Letisse F, Portais JC. NMR-based fluxomics: quantitative 2D NMR methods for isotopomers analysis. Phytochemistry. 2007;68:2330–2340. doi: 10.1016/j.phytochem.2007.03.011. [DOI] [PubMed] [Google Scholar]
- 29.Chowdhury SK, Gemin A, Singh G. High activity of mitochondrial glycerophosphate dehydrogenase and glycerophosphate-dependent ROS production in prostate cancer cell lines. Biochem Biophys Res Commun. 2005;333:1139–1145. doi: 10.1016/j.bbrc.2005.06.017. [DOI] [PubMed] [Google Scholar]
- 30.van der Zijden JP, van Eijsden P, de Graaf RA, Dijkhuizen RM. 1H/13C MR spectroscopic imaging of regionally specific metabolic alterations after experimental stroke. Brain. 2008;131(pt 8):2209–2219. doi: 10.1093/brain/awn139. [DOI] [PubMed] [Google Scholar]
- 31.Miccheli A, Tomassini A, Puccetti C, Valerio M, Peluso G, Tuccillo F, Calvani M, Manetti C, Conti F. Metabolic profiling by 13C-NMR spectroscopy: [1,2-13C2]glucose reveals a heterogeneous metabolism in human leukemia T cells. Biochimie. 2006;88:437–448. doi: 10.1016/j.biochi.2005.10.004. [DOI] [PubMed] [Google Scholar]
- 32.Burgess SC, Weis B, Jones JG, Smith E, Merritt ME, Margolis D, Dean Sherry A, Malloy CR. Noninvasive evaluation of liver metabolism by 2H and 13C NMR isotopomer analysis of human urine. Anal Biochem. 2003;312:228–234. doi: 10.1016/s0003-2697(02)00465-7. [DOI] [PubMed] [Google Scholar]
- 33.Stephanopoulos G, Gill RT. In: Metabolic engineering. Nielsen J, editor. Heidelberg: Springer Berlin; 2001. [Google Scholar]
- 34.Lane AN, Fan TWM. Quantification and identification of isotopomer distributions of metabolites in crude cell extracts using 1H TOCSY. Metabolomics. 2007;3:79–86. [Google Scholar]
- 35.Ardenkjaer-Larsen JH, Fridlund B, Gram A, Hansson G, Hansson L, Lerche MH, Servin R, Thaning M, Golman K. Increase in signal-to-noise ratio of > 10,000 times in liquid-state NMR. Proc Natl Acad Sci USA. 2003;100:10158–10163. doi: 10.1073/pnas.1733835100. [DOI] [PMC free article] [PubMed] [Google Scholar]
- 36.Chen AP, Albers MJ, Cunningham CH, Kohler SJ, Yen YF, Hurd RE, Tropp J, Bok R, Pauly JM, Nelson SJ, Kurhanewicz J, Vigneron DB. Hyperpolarized C-13 spectroscopic imaging of the TRAMP mouse at 3T-initial experience. Magn Reson Med. 2007;58:1099–1106. doi: 10.1002/mrm.21256. [DOI] [PubMed] [Google Scholar]
- 37.Warburg O. On the origin of cancer cells. Science. 1956;123:309–314. doi: 10.1126/science.123.3191.309. [DOI] [PubMed] [Google Scholar]
- 38.Macdonald JM, Grillo M, Schmidlin O, Tajiri DT, James TL. NMR spectroscopy and MRI investigation of a potential bioartificial liver. NMR Biomed. 1998;11:55–66. doi: 10.1002/(sici)1099-1492(199804)11:2<55::aid-nbm502>3.0.co;2-f. [DOI] [PubMed] [Google Scholar]
- 39.Maharjan RP, Ferenci T. Global metabolite analysis: the influence of extraction methodology on metabolome profiles of Escherichia coli. Anal Biochem. 2003;313:145–154. doi: 10.1016/s0003-2697(02)00536-5. [DOI] [PubMed] [Google Scholar]
- 40.Tyagi RK, Azrad A, Degani H, Salomon Y. Simultaneous extraction of cellular lipids and water-soluble metabolites: evaluation by NMR spectroscopy. Magn Reson Med. 1996;35:194–200. doi: 10.1002/mrm.1910350210. [DOI] [PubMed] [Google Scholar]
- 41.Chandrasekaran P, Seagle C, Rice L, Macdonald JM, Gerber DA. Functional analysis of encapsulated hepatic progenitor cells. Tissue Eng. 2006;12:2001–2008. doi: 10.1089/ten.2006.12.2001. [DOI] [PubMed] [Google Scholar]
- 42.Gamcsik MP, Forder JR, Millis KK, McGovern KA. A versatile oxygenator and perfusion system for magnetic resonance studies. Biotechnol Bioeng. 1996;49:348–354. doi: 10.1002/bit.260490302. [DOI] [PubMed] [Google Scholar]
- 43.Swanson MG, Keshari KR, Tabatabai ZL, Simko JP, Shinohara K, Carroll PR, Zektzer AS, Kurhanewicz J. Quantification of choline- and ethanolamine-containing metabolites in human prostate tissues using (1)H HR-MAS total correlation spectroscopy. Magn Reson Med. 2008;60:33–40. doi: 10.1002/mrm.21647. [DOI] [PMC free article] [PubMed] [Google Scholar]
- 44.Karlsson J, Hulten B, Sjodin B. Substrate activation and product inhibition of LDH activity in human skeletal muscle. Acta Physiol Scand. 1974;92:21–26. doi: 10.1111/j.1748-1716.1974.tb05719.x. [DOI] [PubMed] [Google Scholar]
- 45.Kohler SJ, Yen Y, Wolber J, Chen AP, Albers MJ, Bok R, Zhang V, Tropp J, Nelson SJ, Vigneron DB, Kurhanewicz J, Hurd RE. In vivo 13 carbon metabolic imaging at 3T with hyperpolarized 13C-1-pyruvate. Magn Reson Med. 2007;58:65–69. doi: 10.1002/mrm.21253. [DOI] [PubMed] [Google Scholar]
- 46.Nicholas PC, Kim D, Crews FT, Macdonald JM. 1H NMR-based metabolomic analysis of liver, serum, and brain following ethanol administration in rats. Chem Res Toxicol. 2008;21:408–420. doi: 10.1021/tx700324t. [DOI] [PubMed] [Google Scholar]
- 47.Gamcsik MP, Dubay GR, Cox BR. Increased rate of glutathione synthesis from cystine in drug-resistant MCF-7 cells. Biochem Pharmacol. 2002;63:843–851. doi: 10.1016/s0006-2952(01)00931-5. [DOI] [PubMed] [Google Scholar]
- 48.Balendiran GK, Dabur R, Fraser D. The role of glutathione in cancer. Cell Biochem Funct. 2004;22:343–352. doi: 10.1002/cbf.1149. [DOI] [PubMed] [Google Scholar]
- 49.Macdonald JM, Kurhanewicz J, Dahiya R, Espanol MT, Chang LH, Goldberg B, James TL, Narayan P. Effect of glucose and confluency on phosphorus metabolites of perfused human prostatic adenocarcinoma cells as determined by 31P MRS. Magn Reson Med. 1993;29:244–248. doi: 10.1002/mrm.1910290213. [DOI] [PubMed] [Google Scholar]
- 50.Masson S, Quistorff B. The 31P NMR visibility of ATP in perfused rat liver remains about 90%, unaffected by changes of metabolic state. Biochemistry. 1992;31:7488–7493. doi: 10.1021/bi00148a008. [DOI] [PubMed] [Google Scholar]
- 51.Narayan KS, Moress EA, Chatham JC, Barker PB. 31P NMR of mammalian cells encapsulated in alginate gels utilizing a new phosphate-free perfusion medium. NMR Biomed. 1990;3:23–26. doi: 10.1002/nbm.1940030104. [DOI] [PubMed] [Google Scholar]
- 52.Gross JD, Constantinidis I, Sambanis A. Modeling of encapsulated cell systems. J Theor Biol. 2007;244:500–510. doi: 10.1016/j.jtbi.2006.08.012. [DOI] [PMC free article] [PubMed] [Google Scholar]