

Abstract
Retinoic acid (RA) is a critical signaling molecule that performs multiple functions required to maintain cellular viability. It is also used in the treatment of some cancers. Enzymes in the CYP26 family are thought to be responsible for the elimination of RA, and CYP26A1 appears to serve the most critical functions in this family. In spite of its importance, CYP26A1 has neither been heterologously expressed nor been characterized kinetically. We expressed the rCYP26A1 in baculovirus infected insect cells and purified the hexahistidine tagged protein to homogeneity. Heme incorporation was determined by carbon monoxide difference spectrum and a type 1 spectrum was observed with RA binding to CYP26A1. We found that RA is a tight binding ligand of CYP26A1 with low nM binding affinity. CYP26A1 oxidized RA efficiently (depletion Km 9.4 ± 3.3 nM and Vmax 11.3 ± 4.3 pmoles/min/pmole P450) when supplemented with P450 oxidoreductase and NADPH but was independent of cytochrome b5. 4-Hydroxy-RA (4-OH-RA) was the major metabolite produced by rCYP26A1 but two other primary products were also formed. 4-OH-RA was further metabolized by CYP26A1 to more polar metabolites and this sequential metabolism of RA occurred in part without 4-OH-RA leaving the active site of CYP26A1. The high efficiency of CYP26A1 in eliminating both RA and its potentially active metabolites supports the major role of this enzyme in regulating RA clearance in vivo. These results provide a biochemical framework for CYP26A1 function and offer insight into the role of CYP26A1 as a drug target as well as in fetal development and cell cycle regulation.
1. Introduction
Retinoic acid (RA, Figure 1) is the biologically active form of vitamin A. It is necessary for a multitude of biological functions including reproduction, embryonic development, immune competence, maintenance of healthy epithelia and regulation of apoptosis [1,2]. All of these functions are sensitive to the precise control of RA concentrations, and both an excess and a deficiency of RA are detrimental for life [3]. Complex systems have evolved to regulate RA concentrations via biosynthesis and metabolism as well as sequestration and targeting by specific binding proteins [3–5]. Our research is focused on characterizing the mechanisms that control the biodegradation and elimination of RA in humans.
Figure 1.
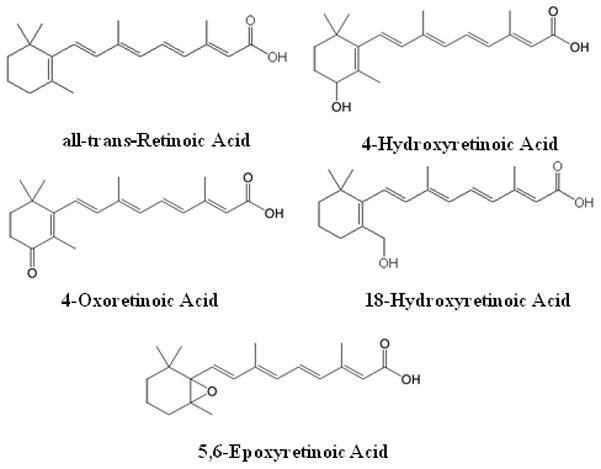
Chemical structures of all-trans-retinoic acid and its previously identified metabolites, 4-OH-RA, 4-oxo-RA, 18-OH-RA, and 5,6-epoxy-RA.
RA can exist as three geometric isomers, all-trans-RA, 13-cis-RA and 9-cis-RA. Of these, all-trans-RA is believed to be the primary biologically active isomer [6]. The biological effects of RA are mainly mediated by all-trans-RA binding to nuclear RA receptors (RAR) that regulate the transcription of multiple target genes [7,8]. The elimination of RA in mammals is mediated metabolically via multiple oxidations [9], but the identity of enzymes responsible for the elimination of RA isomers in various human tissues is not well established. To date, the major identified metabolites are 4-hydroxy-RA (4-OH-RA), 4-oxo-RA, 18-hydroxy-RA, and 5,6-epoxy-RA (Figure 1), which appear to be further oxidized to more polar metabolites [10,11]. Although there is evidence that 4-OH-RA, 18-OH-RA and 4-oxo-RA can bind to RAR [12] they do not appear to contribute to RA signaling during mouse development [13]. Previous studies have shown that common drug metabolizing P450 enzymes, namely CYP2C8, CYP2C9 and CYP3A catalyze the conversion of RA to 4-OH-RA, 4-oxo-RA and 5,6-epoxy-RA [11,14–16]. However, the Km values were much higher than the circulating concentrations of RA, the actual Km of RA hydroxylation in liver microsomes, and the Kd values of RA with the cellular retinoic acid binding proteins (CRABPs) [17,18], suggesting that these enzymes do not contribute significantly to the clearance of RA in vivo.
Recently, the CYP26 family was discovered as a group of RA metabolizing enzymes that may be responsible for RA catabolism [19]. In mammals, the CYP26 family consists of three highly conserved enzymes, CYP26A1, CYP26B1 and CYP26C1 [20–22]. In transiently transfected cell lines, both CYP26A1 and CYP26B1 metabolize RA to a series of oxidized metabolites [20,21] but CYP26A1 has been suggested as the most important enzyme of the CYP26 family [23]. Although use of transfected cells has been instrumental in producing initial information on the catalytic activity and substrate specificity of CYP26 enzymes, the low expression levels of CYPs in these systems have prevented detailed mechanistic and kinetic characterization of CYP26A1 and other members of this family [23].
Both CYP26A1 and CYP26B1 are essential for development. Cyp26a1 null mouse embryos die during mid-gestation and Cyp26b1 null pups die soon after birth with both knock-outs showing multiple developmental defects [24–26]. Despite the apparent critical role of the CYP26 enzymes in regulating RA concentrations, their activity and expression pattern in human tissues and their cellular localization are unknown, although transcripts of CYP26A1 and CYP26B1 have been detected in most human tissues [27]. Since no recombinant enzyme system has been available, the exact metabolic pathway and kinetics of RA metabolism by CYP26A1 are unknown. The goal of this study was to conduct a basic biochemical characterization of CYP26A1, and to establish the main metabolic determinants of RA oxidation by CYP26A1.
2. Materials and Methods
2.1 Reagents
RA isomers and Acitretin (I.S.) were purchased from Sigma-Aldrich (St. Louis, MO) and 4-oxo-RA from Toronto Research Chemicals (Toronto, ON). 4-OH-RA was synthesized as described previously by dissolving 4 mg of the 4-oxo-RA in 1200 μL methanol and 400 μL of 2-propanol [29]. The reaction mixture was made alkaline by the addition of aqueous sodium hydroxide (40 μl of a 1M solution). Sodium borohydride (4.08 mg, 108 μmole) was added and the reaction mixture was stirred for 30 hours. The mixture was then acidified by drop-wise addition of acetic acid and the product was extracted with ethyl acetate. The ethyl acetate extracts were combined and washed with water. Formation of the 4-OH-RA was confirmed by 1H-NMR and UV-Vis spectroscopy. Stock solutions of RA, 13-cis-RA, 9-cis-RA, 4-OH-RA and 4-oxo-RA were made in methanol such that the final concentration of methanol in incubations did not exceed 1%. All stock solutions were stored at −80°C and all experiments with RA or metabolites were conducted under red light. HPLC grade solvents were obtained from Fisher Scientific (Pittsburgh, PA) and NADPH was obtained from Sigma-Aldrich (St. Louis, MO). Rat P450 oxidoreductase, expressed in E. coli was a gift from Josh Pearson (University of Washington, Department of Medicinal Chemistry) and cytochrome b5 was purchased from Invitrogen (Carlsbad, CA).
2.2 Expression of CYP26A1 in insect cells
For CYP26A1 expression, full-length CYP26A1 mRNA was extracted from HEK293 cells. The corresponding cDNA, produced using RT-PCR, was cloned into pCRblunt-II TOPO vector (Invitrogen, Carlsbad, CA) and the sequence was verified to be identical with Genbank accession number NM000783. For CYP26A1 expression, primers were designed (forward primer sequence: 5′-gcgaattcatggggctcccggcgctgc-3′; reverse primer sequence: 5′gcaagcttttaatggtgatggtgatgatgtccctgaaaatacaggttttcgatttccccatggaaatgggtg-3′ to amplify the CYP26A1 coding sequence while adding a hexahistidine tag. The resulting PCR product was cloned into the Invitrogen Zero Blunt TOPO vector according to the manufacturer’s instructions. EcoRI and HindIII were used to excise the His-tagged CYP26A1 gene from the TOPO vector and the resulting fragment was ligated into pFastBac (from Invitrogen). The Bac-to-Bac Baculovirus Expression System (Invitrogen, Carlsbad, CA) was used to produce protein from Sf9 insect cells according to the manufacturer’s instructions using Sf-900 II SFM liquid media (Invitrogen, Carlsbad, CA) supplemented with 2.5% fetal bovine serum. During protein expression, ferric citrate (0.2 mM) and δ-aminolevulinic acid (δ-ala, 0.3 mM) were added to the media 24 hours post-infection to facilitate heme synthesis. The cells were harvested 72 hours post infection, washed once in PBS with 1 mM phenylmethanesulphonylfluoride (PMSF), pelleted and stored at −80°C.
2.3 Preparation of microsomes and characterization of expressed CYP26A1
To prepare ER membrane fractions (microsomes) the insect cells were lysed in 10 mM KPi buffer (pH 7.4) with 10 mM EDTA and 0.15 M KCl using a Thomas tube and a Teflon pestle followed by sonication. Cell debris, nuclei, and cell membranes were removed by centrifuging at 8,000g for 20 mins. The ER membranes were collected by centrifugation of the supernatant at 100,000g for 60 mins, the supernatant was discarded and the pellet was resuspended in 50 mM KPi buffer with 20% glycerol and 0.1 mM EDTA. The P450 content of the final microsomal preparation was determined by CO-difference spectrum [30] and the protein concentration was measured using a Pierce protein quantitation kit (BCA-assay) according to manufacturer’s instructions (Pierce, Rockford, IL). The obtained microsomes were used for all catalytic experiments with CYP26A1. The CYP26A1 concentrations used in microsomes refer to the active holo-protein.
2.4 Purification of CYP26A1
One ml of Talon affinity resin (Clontech, Mountainview, CA) was washed with equilibrium buffer (EB) containing 50 mM KPi, 20% glycerol, 1% Nonidet P40 (NP40), 1% cholate, and 150 mM KCl. Insect cell microsomes (containing EDTA) were diluted in buffer containing 50 mM KPi and 20% glycerol at pH 7.5. Detergents (NP40 and cholate) were added to a final concentration of 1% and the membranes were solubilized with gentle agitation at 4°C for 1 hour. Insoluble matter was pelleted via centrifugation at 20,000g for 40 mins at 4°C. The supernatant was passed through a Zeba Spin (Pierce, Rockford, IL) desalting column (according to the manufacturer’s protocol) equilibrated with EB in order to remove EDTA. The desalted protein was combined with the washed Talon resin and rocked gently for 1 hour on ice. The slurry was centrifuged and the supernatant removed. The resin was washed twice with EB, and then twice with EB + 10 mM imidazole. Bound protein was eluted with three washes of EB + 500 mM imidazole. Following SDS-PAGE analysis to confirm purification, washes containing CYP26A1 were pooled, concentrated using a Centricon centrifugal concentrator (Millipore, Billarica, MA) Molecular Weight cut-off of 10 kDa), buffer exchanged into storage buffer (50 mM KPi pH 7.4, 20% glycerol, 0.5 mM EDTA) with a Zeba Spin desalting column, and concentrated again prior to storage at −80°C. The concentration of functional CYP26A1 was determined by CO-difference spectrum and BCA protein assay.
2.5 Antibody to CYP26A1 and western blotting
A peptide antibody to the C-terminus of CYP26A1 protein was designed (Ac-PVDNLPARFTHFHGEIC-OH) and synthesized by Quality Controlled Biochemicals (Hopkinton, MA) according to Andreola et al [30]. Rabbits were used to generate an anti-hCYP26A1 antibody using a standard immunization protocol (R&R Rabbitry, Stanwood, WA). The obtained antiserum was purified using Immunopure IgG Purification kit (Pierce, Rockford, IL) including a Protein A affinity purification column according to manufacturer’s instructions. The resulting antibody was used to quantify CYP26A1 in the Sf9 cell microsomes. For Western blotting, 1–2 μg of total microsomal protein or 0.5–5 pmoles of purified CYP26 were loaded onto a 10% SDS PAGE gel and electrophoresed to separate proteins. The proteins were transferred to a PVDF membrane at 100V for 1 hr and the membrane was blocked overnight using blocking buffer (50% Odyssey block (LI-COR Biosciences, Lincoln, NE) and 50% PBS). Tween 20 (final concentration 0.1%) was added together with the primary antibodies. The membranes were incubated with either rabbit anti-hCYP26A1 antibody (1:1000) or mouse anti-6Xhis (Qiagen, Valencia, CA) antibody (1:2000) for 1 hour after which the membrane was rinsed 4 times with PBS-0.1% Tween and incubated for 1 hour with the secondary antibody mixture (anti-mouse 1:5000, IRDye 800, Rockland, Gilbertsville, PA and anti-rabbit; 1:4000, Alexa Fluor 680, Molecular Probes, Eugene, OR) in 1:1 mixture of Odyssey blocking buffer and PBS-0.1% Tween. The membrane was rinsed again with PBS-0.1% Tween and stored in PBS at 4°C until imaged. The proteins were visualized by fluorescence using the Odyssey infrared imaging system (LI-COR Biosciences, Lincoln, NE) and integrated fluorescence intensities were obtained using Odyssey software (v2.1). The concentration of CYP26A1 in the microsomal preparations was quantified based on a standard curve constructed using purified CYP26A1 protein.
2.6 Determination of ligand induced binding spectrum
The optical titration of the ligand induced binding spectrum was performed with an Aminco DW2 dual beam spectrophotometer as upgraded by Olis Instruments, Inc. Matched cuvettes containing KPi buffer (pH 7.4) with 20% glycerol were used. CYP26A1 microsomes (220 nM holo-CYP) were added to the sample cuvette. RA (5 or 50 μM) was added in 1 μl increments to both cuvettes to normalize the absorption of RA, and the absolute spectrum was measured by scanning from 500 nm to 350 nm. The difference spectrum was obtained by subtracting ligand free baseline spectrum from the ligand added spectra, the data was normalized to the absorbance at 490 nm and the difference of absorbance between 420 nm and 490 nm was used to analyze the titration data.
2.7 Incubation procedure and HPLC analysis of retinoic acid and metabolites
Unless otherwise stated, all incubations contained 10 nM CYP26A1 microsomes and 20 nM of rat P450 reductase in 100 mM KPi buffer. A reductase to P450 ratio of 2:1 was used to closely mimic physiological conditions while maintaining catalytic activity. To maximize reductase incorporation into the membrane, CYP26A1 and rat P450 reductase were first mixed and allowed to stand for 10 mins at room temperature. KPi buffer and RA were then added and the mixture was pre-incubated for 5 mins at 37 °C. All incubations were initiated by addition of 1 mM NADPH and carried out at 37 °C. 1 ml samples were quenched after a specified time period with 4 ml ethyl acetate and Acitretin (I.S., 3 μl of 6 μM solution) was added. After vortexing, the organic layer was separated, dried under nitrogen and the sample residue was reconstituted with 50 μl of methanol of which 10 μl was injected into the HPLC-UV. RA isomers and metabolites were separated using an Agilent Technologies (Palo Alto, CA) 1200 series HPLC system equipped with an Agilent Zorbax C-18 reverse phase column (3.5 μm, 2.1 × 100 mm), an Agilent temperature controlled auto-injector, a multiple wavelength detector and HP Chemstation software. RA and its metabolites were quantified using the absorbance at 360 nm. The mobile phase flow was 0.2 ml/min with a linear gradient from initial 90:10 water:acetonitrile to 10:90 water:acetonitrile over 15 mins, then held for 13 mins before returning to initial conditions 1 min later. The system was then allowed to re-equilibrate for another 11 mins before the next injection.
2.8 Effect of P450 reductase and cytochrome b5 on CYP26A1 activity
To study the effect of P450 reductase on CYP26A1 activity, CYP26A1 (5 nM) was preincubated with 0, 2.5, 5, 10, 20, 30 and 50 nM of rat P450 reductase and 100 nM RA. The incubations were allowed to run for 30 seconds and the formation of RA metabolites was measured. Additionally, the effect of reductase content on rate of depletion of RA by CYP26A1 was determined using 5 nM of CYP26A1 and 2.5, 10 and 50 nM of P450 reductase, and collecting 1 ml samples at 0.5, 5 and 15 mins after NADPH addition for analysis of RA concentrations. The effect of cytochrome b5 on RA turnover by CYP26A1 was determined in a 3 min incubation using 5 nM of CYP26A1, 10 nM of P450 reductase and 100 nM RA with 0, 2.5, 5, 10, 20 nM of b5.
2.9 Identification of RA metabolites formed by CYP26A1 and sequential metabolism of RA
CYP26A1 (5 nM) and rat P450 reductase (10 nM) were incubated with 100 nM RA or 50 nM of 4-OH-RA for 15 and 10 min, respectively, and metabolite formation and depletion of RA and 4-OH-RA was analyzed. After HPLC analysis, 4 μl of a 4-oxo-RA solution in methanol (50 nM) was spiked into the samples from RA incubation to distinguish between the hydroxylated products and 4-oxo-RA chromatographic peaks. The sequential metabolism of RA by CYP26A1 was studied at RA concentrations of 50 and 500 nM. After reactions were initiated with NADPH, 1 ml aliquots were collected at 0, 0.5, 1, 2, 5, 10 and 15 min and analyzed for formation of primary and secondary metabolites.
2.10 Determining kinetic constants of RA metabolism by CYP26A1
Kinetic constants were determined using both the product formation and substrate depletion approaches. For product formation, the amount of 4-OH-RA and other primary metabolites formed at substrate concentrations between 0–500 nM was measured after 30 sec incubation and the Km and Vmax were determined. For substrate depletion, 1 pmole/ml CYP26A1 and 2 nM of P450 reductase were incubated with RA (5–200 nM). 1 ml aliquots were collected from incubations at each RA concentration at 0, 0.5, 1, 1.5 and 2 mins after NADPH addition and quenched into 2 mls of ethyl acetate. Internal standard was added, organic layer separated and dried under nitrogen, and the sample residue reconstituted in 100 μl of methanol, of which 15 μl was injected into the HPLC-UV.
2.11 Data Analysis
Data was analyzed on Microsoft Excel (Redmond, WA). Analysis of kinetic data was done by WinNonLin v5.2 (Pharsight, Mountainview, CA). The Ks value for RA was obtained by fitting a modified version of the Morrison equation [31] to the spectral titration data:
in which [E] is the holo-CYP26A1 concentration, [S] is the substrate concentration added, Amax is the maximum absorbance observed and A is the absorbance at a given RA concentration.
The depletion data at each RA concentration was fitted log-linearly to the equation,
in which C equals RA concentration, C0 the initial concentration of RA, kdep the fitted depletion rate constant and t is time. The kdep obtained for each RA concentration was then used to determine Km according to equation 2 as previously described [32,33],
For [S], the mid-time point concentrations of the substrate instead of zero-time concentrations were used in order to correct for substrate depletion. To obtain the intrinsic clearance (Clint), the maximum depletion rate, kdep,max obtained from the nonlinear fit was divided by the enzyme concentration. Vmax for the reaction was calculated from Clint * Km.
The Km and Vmax for 4-OH-RA, M5 and M6 formation were determined using the Morrison equation [31]
where V is the product formation velocity at a given RA concentration. The data was analyzed using the holo-protein concentration determined via CO binding as [E]. The concentration of RA, [S], was corrected for substrate depletion by averaging the initial concentration with that of RA remaining at the end of the incubation.
3. Results
3.1 Expression and purification of CYP26A1
Recombinant human CYP26A1 was expressed using the baculovirus-infected insect cell system. To enrich the expressed enzyme and improve kinetic characterization of CYP26A1, ER membrane fractions (microsomes) were isolated. A classical CO-induced P450 spectrum was detected in the ER fractions from cells infected with CYP26A1 virus and supplemented with δ-ALA and iron citrate (Figure 2a) suggesting the presence of functional, heme-containing P450. The expression of the his-tagged CYP26A1 and the appropriate molecular weight (predicted 56.2 kDa) of the expressed protein was confirmed by western blotting using an anti-his and anti-CYP26A1 antibody (Figure 2b). The final concentration of holo-CYP26A1 in the membrane preparations, as determined by CO-difference spectrum, was 80 pmoles P450/mg protein. To further characterize the expressed CYP26A1, it was purified using a standard affinity column protocol to homogeneity as observed on SDS-PAGE with Coomassie staining (Figure 2d). The final concentration of the active purified protein (holo-CYP26A1) was approximately 1.2 μM as determined from a CO-difference spectrum (Figure 2c), representing a yield of about 80% from the insect cell microsomes. Comparison of concentrations of purified CYP26A1 measured by BCA assay (apo- + holo-protein) and by CO-difference spectrum showed that 80% of CYP26A1 in the purified preparation was in the apo-form not detectable by heme spectroscopy. The concentration of total (apo- + holo-P450) CYP26A1 in the microsomes was quantified by western blotting using the purified protein as a calibrator and the obtained apo- to holo-CYP26A1 ratio was identical in the microsomes and in the purified protein preparation demonstrating that the portion of apo-protein present was not a result of the purification procedure.
Figure 2.
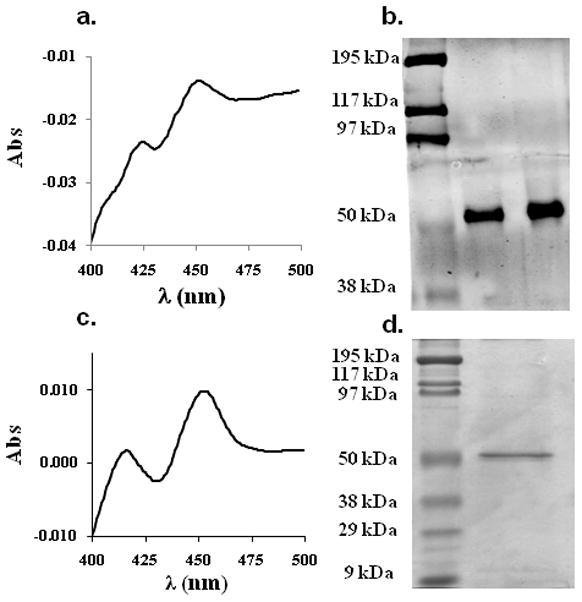
Characterization of CYP26A1 microsomes and purified CYP26A1. Panel (a.) shows the CO difference spectrum of the CYP26A1 microsomes with a peak at 450 nm, panel (b.) shows a western blot of CYP26A1 microsomes probed with antiCYP26A1 antibody, panel (c.) shows a CO difference spectrum of the purified CYP26A1 and panel (d.) a Coomassie stained SDS-page gel of the purified CYP26A1. Approximately 3 pmoles of the purified CYP26A1 were loaded on the gel in (d.).
3.2 Determination of ligand induced binding spectrum and spectral binding constant
RA has been suggested as the natural substrate for CYP26A1 [19,20]. Therefore, we tested whether addition of RA to the CYP26A1 microsomes would result in a ligand induced difference spectrum. To normalize for RA absorbance (absorbance maximum at 360 nm), RA was added to the sample and reference cuvette, and the P450 difference spectrum was obtained by subtracting the ligand free spectrum from the RA added samples manually. Figure 3 shows the type 1 binding spectrum obtained with addition of RA to CYP26A1 microsomes indicating that RA replaces a water molecule in the active site of CYP26A1 and causes a spin state shift of the heme iron from low to a high spin. A characteristic spectral minimum at 420 nm was observed in the difference spectrum, but no clear spectral maximum was observed at 390 nm most likely due to RA absorbance masking the heme absorbance. RA bound to P450 may have a different absorbance than RA free in solution. The magnitude of the spectral change (A490-A420)was dependent on RA concentration (Figure 3), and the titration showed that RA has a high binding affinity to CYP26A1. A binding constant (Ks) of 529 nM was obtained by fitting the Morrison equation to the data.
Figure 3.
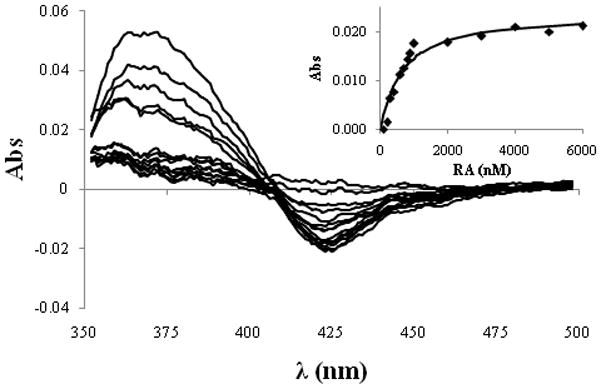
Spectral titration of CYP26A1 microsomes with RA. The difference spectra were obtained by subtracting the ligand free absolute spectrum from the experimental spectra and by normalizing for RA absorbance in the reference cuvette. The difference between absorbance at 420 and 490 nm was measured at each RA concentration and the absorbance difference was plotted against the RA concentration (inset). The Morrison equation was fitted to the data using the holo-CYP26A1 concentration 220 nM to obtain the binding constant of 529 nM of RA to CYP26A1.
3.3 Characterization of Retinoic Acid Metabolism by CYP26A1
Catalytic activity of rCYP26A1 was tested using RA as the substrate. First, we tested whether CYP26A1 mediated RA oxidation requires NADPH and P450 oxidoreductase and then investigated the metabolite profile of RA oxidation by CYP26A1. No formation of 4-OH-RA or of other metabolites was detected in incubations with CYP26A1 microsomes supplemented with P450 reductase but without NADPH (Figure 4) nor was any depletion of RA detectable. When P450 reductase and NADPH were added, formation of 4-OH-RA and two other primary metabolites (M5 and M6) was detected as well as formation of other more polar secondary metabolites (M1, M2, M3 and M4) that eluted several minutes earlier than 4-OH-RA (Figure 4). Interestingly, there was no appreciable formation of 4-oxo-RA, as confirmed by spiking 4-oxo-RA into the samples (Figure 4a). We hypothesized that the polar downstream metabolites (M1–M4) were formed sequentially from 4-OH-RA. To test this hypothesis, 4-OH-RA was incubated with CYP26A1 at a concentration of 50 nM. In this incubation, M1 was the major metabolite observed (Figure 4b) but M2, M3 and M4 were also detected. Overall, the downstream metabolite profile was very similar to that observed after incubation with RA confirming that RA is sequentially metabolized by CYP26A1. As synthetic standards were not available for M1–M4, their identity could not be confirmed but based on their UV absorbance (maximum at approximately 360 nm) and HPLC retention times they are most likely result of hydroxylations of the β-ionone ring. A proposed metabolic pathway is shown in Figure 4c.
Figure 4.
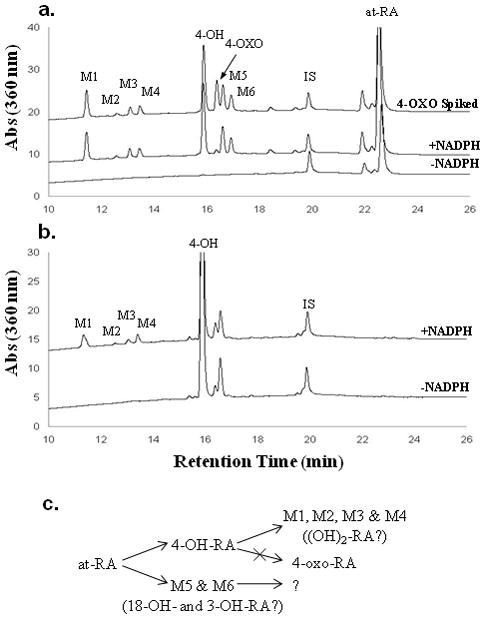
Identification of metabolites formed from RA by CYP26A1. The lines represent incubations with the substrate, P450 reductase (10 nM) and CYP26A1 (5 nM) lacking NADPH and supplemented with NADPH. The substrates were 100 nM RA (a.) and 50 nM 4-OH-RA (b.). 4-oxo-RA was spiked into the RA incubation (a., top trace) to differentiate between the primary metabolites. The proposed metabolic scheme is represented in (c.).
The formation of all three primary metabolites (4-OH-RA, M5 and M6) followed Michaelis-Menten kinetics (Table 1) increasing in a hyperbolic fashion when the initial concentration of RA was increased (Figure 5a). However, the ratio of the secondary metabolite (M1) to 4-OH-RA was dependent on RA concentration (Figure 5b) and decreased from 0.5 to 0.25 as the RA concentration was increased to saturating concentrations, suggesting that formation of M1 is partially inhibited at high substrate concentrations. The Km for the formation of 4-OH-RA was estimated using the Morrison equation. This method yielded a Km of 21.4 ± 3.6 nM for 4-OH-RA formation (Table 1).
Table 1.
Kinetic parameters for the formation of primary metabolites from RA by CYP26A1 and for RA depletion by CYP26A1. The Km and Vmax values were obtained using the P450 concentrations of 5 nM as measured by the CO-difference spectrum. The Standard Error of each estimate is shown in parentheses.
| Metabolite | Km nM (SE) | Vmax pmol min−1 pmol P450−1 (SE) |
|---|---|---|
| 4-OH-RA | 21.4 (3.6) | 3.5 (0.1) |
| M5 | 11.8 (5.5) | 1.6 (0.1) |
| M6 | 22.1 (6.2) | 1.1 (0.1) |
| Substrate depletion | 9.3 (3.3) | 11.4 (0.9) |
Figure 5.
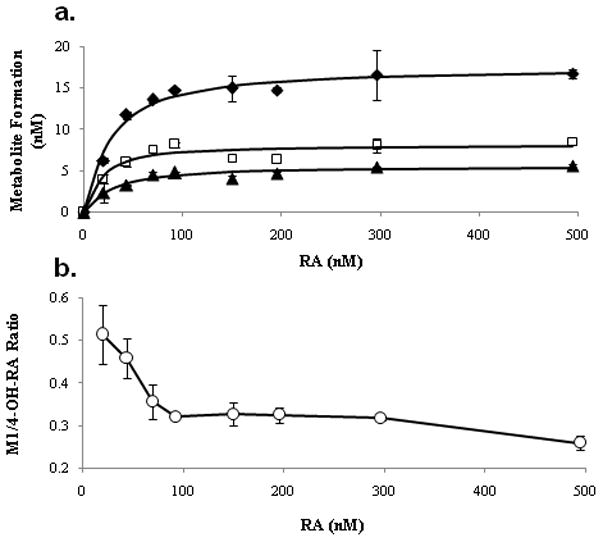
Formation kinetics of 4-OH-RA (◆), M5 (□) and M6 (▲) from RA by CYP26A1 (a.). Initial RA concentrations ranged from 0 to 500 nM and the Morrison equation was fitted to the data to obtain kinetic parameters. Panel (b.) shows the RA concentration dependent decrease in the M1 to 4-OH-RA formation ratio. The error bars represent the range of values.
3.4 Effect of P450 reductase and cytochrome b5 on CTP26A1 activity
As P450 reductase and cytochrome b5 should alter the catalytic rate of a P450 mediated process by facilitating electron transfer, the effect of these two enzymes on RA depletion and formation of RA metabolites was investigated using a range of P450 to reductase or cytochrome b5 ratios. Increasing the reductase to P450 ratios from 0.5 to 2 and 10 increased the depletion rate of RA (100 nM) from 0.13 to 0.26 and 0.86 min−1, respectively. Increasing the reductase to P450 ratio also increased the formation of primary and secondary metabolites from RA (Figure 6). The increased primary product formation was accompanied by increased ratio of M1 to 4-OH-RA formed. The increasing product ratio is in agreement with sequential metabolism (vide infra) and general increased catalytic rate of oxidation. In contrast to the effects of P450 reductase on catalytic rates by CYP26A1, the presence of cytochrome b5 did not change the overall rate of RA depletion or of metabolite formation by CYP26A1. None of the samples supplemented with cytochrome b5 (up to 4-fold excess) showed significant changes in RA metabolism when compared with samples devoid of b5 (data not shown).
Figure 6.
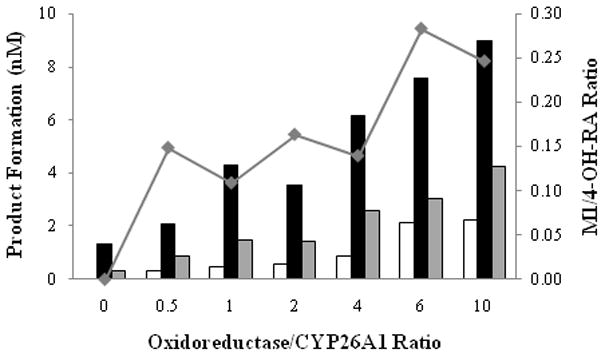
Effect of cytochrome P450 oxidoreductase on retinoic acid turnover by CYP26A1. All incubations were conducted for 30 seconds in the presence of NADPH and 100 nM RA. The formation of M1 (white bars), 4-OH-RA (black bars) and M5 (gray bars) is shown. Additionally, the M1/4-OH-RA ratio at each OR/CYP ratio is depicted (◆).
3.5 Analysis of the sequential metabolism of RA by CYP26A1
To further explore the sequential metabolism within the system, the time-course of RA metabolism was studied at both non-saturating and saturating concentrations of RA (50 and 500 nM respectively, Figure 7). At 50 nM, RA was completely depleted in 5 mins, whereas at 500 nM RA concentrations remained saturating through the course of the incubation (Figures 7a and 7b). At 50 nM RA, 4-OH-RA and M5 accumulated until there was no more available RA and then were depleted. At saturating RA concentration (500 nM), 4-OH-RA and M5 continued to accumulate throughout the 15 min time course (Figures 7c and 7d). These findings indicate that RA inhibits the depletion of 4-OH-RA and M5 when present at concentrations above its Km. Metabolite M6 accumulated at both concentrations, without subsequent depletion suggesting that it is not a substrate of CYP26A1. At 50 nM RA, the formation of the secondary metabolites (M1, M3 and M4, Figure 7e) plateaued once 4-OH-RA and M5 were significantly depleted, whereas they all accumulated in a linear fashion at 500 nM RA (Figures 7f). The presence of secondary metabolites at saturating concentration of RA indicates that formation of the secondary metabolites must be, in part, a nondissociative event, i.e. the intermediate (4-OH-RA) does not leave the active site of CYP26A1 before being further metabolized.
Figure 7.
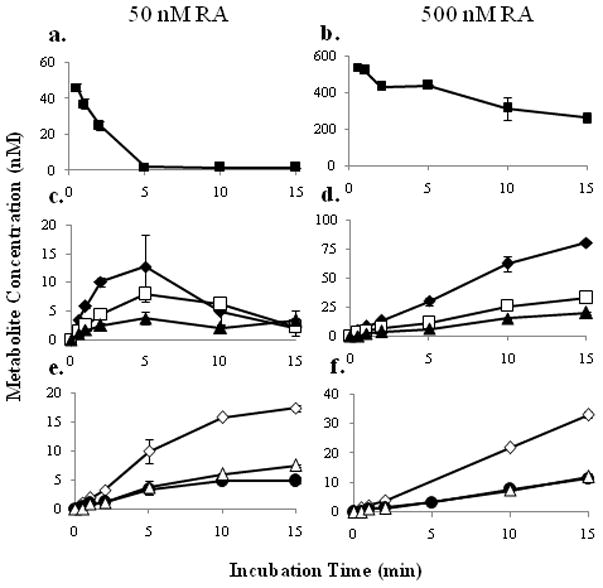
Time course of RA depletion and metabolite formation at 50 nM and 500 nM RA (left and right columns, respectively). Panels a. and b. depict RA depletion, c. and d., the time course of primary metabolites 4-OH-RA, M5 and M6, and e. and f., the time course of secondary metabolites M1, M3 and M4. The error bars represent the range of values. The symbols correspond to RA (■), 4-OH-RA (◆), M5 (□), M6 (▲), M1 (◇), M3 (●) and M4 (△).
Due to the sequential metabolism (depletion of metabolites) of RA by CYP26A1 and the formation of multiple primary metabolites, substrate depletion was also used to determine the kinetic constants of RA metabolism by CYP26A1. The rate of RA depletion was concentration dependant (Figure 8) and the depletion time courses could be fitted to a first-order decay function to obtain kdep. The maximum depletion rate (kdep,max) and Km were obtained from the nonlinear fit between the kdep -values and RA concentrations corrected for substrate depletion. The Km of RA turnover was estimated to be 9.3 ± 3.3 nM and kdep,max was 1.2 ± 0.1 min−1. Using these values, the Vmax for RA depletion was calculated as 11.4 ± 0.9 pmoles min−1 pmole P450−1 (Table 1).
Figure 8.
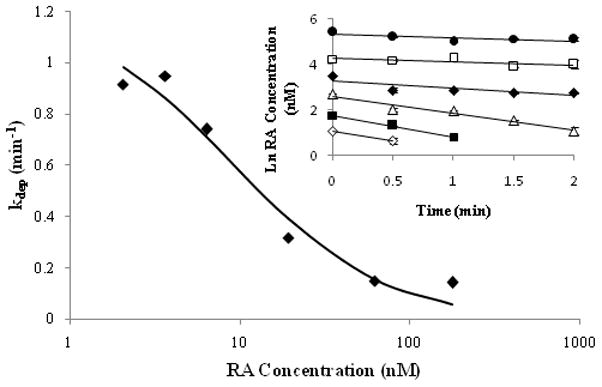
Kinetic characterization of RA metabolism by CYP26A1 using substrate depletion approach. The obtained depletion rate constants versus RA concentration data were used to fit the substrate depletion equation to obtain Km and kdep,max values. The log-linear fits of RA concentration versus time data when RA was incubated with CYP26A1 at initial concentrations between 5 nM and 200 nM are shown in the inset. The concentrations of RA (nM) are as follows: 200 (●), 80 (□), 40 (◆), 20 (△), 10 (■) and 5 (◇) nM. The error bars represent the range of values.
4. Discussion
Various methods are available for producing recombinant P450 enzymes including E. coli, yeast and insect cell systems [38]. Expression of P450 enzymes in E. coli requires codon optimization (Barnes modification [39]) to allow expression and Lee et al [23] reported lack of expression of CYP26A1 in the E. coli system. The baculovirus infected insect cell system is commonly used to produce P450 enzymes for catalytic experiments and is amenable to co-expression of P450 enzymes with P450 oxidoreductase. In addition, protein folding and post-transcriptional modifications are more similar to mammalian cell systems in Sf9 cells than in E. coli. For these reasons we selected the insect cell system for expressing CYP26A1. Using this system we were able to obtain satisfactory expression of CYP26A1 detected both by CO-difference spectrum and Western blotting and the protein was purified in sufficient quantities.
The fact that we could enrich the heterologously expressed CYP26A1 in ER membrane fractions from the Sf9 cells is the first indication that CYP26A1 is a typical ER P450 enzyme. Due to the lack of specific antibodies, the cellular localization of CYP26A1 has not been confirmed. Our results show that P450 oxidoreductase is required for the function of CYP26A1 and thus provide indirect evidence that ER membrane is the normal site of localization of CYP26A1 in the cell. We also showed that RA oxidation by CYP26A1 is NADPH-dependent. Interestingly cytochrome b5, that has been shown to interact with several mammalian P450 enzymes, had no effect on the catalytic activity of CYP26A1. Cytochrome b5 may not interact with CYP26A1 or the lack of b5 effect could be an indication of the basic efficiency of CYP26A1 in RA metabolism.
All our data suggests that RA is a tight binding ligand of CYP26A1. The Morrison equation best fitted the product formation data, and spectral titration of RA with CYP26A1 microsomes yielded a classical tight binding curve. Interestingly, the fits suggested that the total CYP26A1 concentration in the experiments was higher than that measured by P450 spectrum. Indeed, the apo-protein concentration was 4-fold higher than holo-P450 when quantified by Western blot. Similar apo-to-holo- protein ratios have been shown previously for CYP2A1, CYP2C9 and CYP2E1 [40,42]. Purification and characterization of CYP26A1 from tissues is required to determine whether the observed apo- to holo-protein ratio reflects in vivo systems, or is an artifact of the expression system.
Little has been published on the P450 mediated metabolism of the different hydroxyretinoic acids after initial oxidation [10,11,23]. Chithalen et al. [10] utilized both ultraviolet spectroscopy and mass spectrometry to identify the major primary and secondary metabolites formed from RA by CYP26A1. Using synthetic standards and CYP26A1 transfected mammalian cell lines, they established that RA was biotransformed to 4-OH-RA and 4-oxo-RA and subsequently to other polar metabolites in considerable quantities. In the present study, 4-OH-RA was the major metabolite formed from RA by CYP26A1 under all experimental conditions. In contrast to the results of Chithalen et al. [10] 4-oxo-RA was not detected in appreciable concentrations (Figure 4a). The difference is probably due to fact that, in contrast to the CYP26A1 microsomes, other enzymes are present in the CYP26A1 expressing mammalian cells that may contribute to the metabolism of 4-OH-RA and the formation of 4-oxo-RA. When CYP26A1 was expressed in Hela and V79 cells, the metabolite profiles obtained in the two cell lines were distinctly different: considerable amounts of downstream metabolites were formed in the HeLa cell line but not in the V79 cell line. Although 4-OH-RA was identified as the major CYP26A1 metabolite in the current study as well as in the cells, it is impossible distinguish what enzyme(s) is (are) responsible for the formation of the downstream metabolites of 4-OH-RA in the HeLa cells. The clear advantage of the insect cell system is that it allows for easy quantification of holo-CYP26A1 and accurate characterization of single enzyme kinetics.
In addition to 4-OH-RA, 18- and 3-OH-RA have been proposed to be primary metabolites formed from RA by CYP26A1 [10, 23] and it was suggested that 3-OH- and 18-OH-RA are formed by CYP26A1 [10]. Without chemical standards, M5 and M6 were only tentatively assigned as 18- or 3-OH-RA. If the β-ionone ring is hydroxylated at multiple locations by CYP26A1, it is likely that M1–M4 are di-hydroxylated metabolites. Our results show that M1–M4 are indeed formed from 4-OH-RA (Figure 4b), but similar to M5 and M6, we were not able to confirm their structures due to lack of reference materials.
Based on our results, RA is sequentially metabolized by CYP26A1. The sequential oxidation of RA via 4-OH-RA (and possibly M5 and M6) to M1–M4 can occur via two different mechanisms; either in a dissociative or nondissociative fashion. In dissociative metabolism, the intermediates leave the P450 active site and rebind, whereas in nondissociative metabolism, the intermediate metabolites undergo further oxidations without ever leaving the active site of the P450. Overall our data suggests that the formation of M1, M3 and M4 from RA via 4-OH-RA is partly nondissociative. Nondissociative metabolism is evident from the time course data of metabolite formation at 500 nM RA (Figure 7) as well as from the plateau in the M1/4-OH-RA ratio at RA concentration above 100 nM (Figure 5b). Based on enzyme kinetic principles, at saturating RA concentrations, any 4-OH-RA that dissociates from the P450 would not rebind as the enzyme is saturated with RA. Thus, the observed formation of M1, M3 and M4 in incubations with a saturating concentration of RA must result from nondissociative metabolism. It is apparent, however, that under these experimental conditions a significant portion of 4-OH-RA does also dissociate from the CYP26A1. As RA concentration changes from below to well above the Km, the formation of M1 decreases relative to that of 4-OH-RA resulting in a decreased M1/4OH ratio due to competition for CYP26A1 between RA and 4-OH-RA in solution (Figure 5). Dissociative metabolism is also shown by the appearance and disappearance of RA metabolites as a function of time at 50 nM concentration of RA. As RA partially inhibits the depletion of 4-OH-RA and the formation of secondary metabolites, 4-OH-RA, must at least in part be released to the bulk phase before undergoing further metabolism. Finally, results obtained with increasing relative amount of P450 reductase are in agreement with a partially dissociative mechanism. Increased formation of downstream metabolites (M1) was observed and the M1 to 4-OH-RA ratio increased considerably between the low and high reductase to P450 ratios. Based on the increased product formation (Figure 6), the increase in oxidoreductase to P450 ratio increases the catalytic rate of CYP26A1 in agreement with improved electron transfer. The increased overall catalytic rate would increased the kcat to koff ratio for the primary metabolite allowing for less primary metabolite to dissociate from the active site before being subsequently metabolized. This increase in the kcat to koff ratio will result in an increase in M1 formed relative to 4-OH-RA at saturating RA concentrations (100 nM RA ≫Km for RA).
Sequential metabolism of RA may have biological importance because 4-OH-RA has been shown to bind to RAR isoforms and 4-oxo-, 4-OH-, 18-OH- and 5,6-epoxy-RA have been shown to induce maturation of NB4 cells and bind to RAR with similar affinities to that of RA [12]. However, studies have suggested that the role of CYP26A1 in fetal development is dependent on its efficiency to deplete RA, not to form biologically active metabolites [13]. The results obtained in this study show that 4-OH-RA is at least partly further oxidized (to likely biologically inactive species) by CYP26A1 without leaving the active site of CYP26A1. Such non-dissociative metabolism would assure that the metabolites, if biologically active, would not be available to elicit any biological responses in the cell. To date, no studies have been published that elucidate the nature of dissociation of the primary RA metabolites from CYP26A1. Further study is needed to fully understand the kinetics of this metabolic process. In our system, the sequential metabolism is clearly a mixture of dissociative and nondissociative processes. However, in vivo, the fraction of 4-OH-RA that leaves the active site before being further metabolized will depend on the rate of electron transfer, the availability of P450 reductase and the dissociation rates of the intermediates. Isotope dilution experiments may provide useful information about the fraction of metabolism that is dissociative in the different systems.
The sequential metabolism within this system suggests that CYP26A1 is integral in the inactivation of RA and that it is not only necessary to inactivate RA, but also to inactivate any resulting biologically active metabolites. The high kinetic efficiency, sequential metabolism and high affinity for RA, suggest that CYP26A1 is a critical enzyme in elimination of RA from cells. CYP26A1 is much more efficient in depleting RA than other P450 enzymes previously indicated as RA hydroxylases. The Km value for RA depletion was 9.4 nM, a value close to the physiological concentration of RA, estimated to be 5–10 nM [2,42] and much lower than the Km of RA for other drug metabolizing P450s (>1000 nM) [16]. The intrinsic clearance (i.e. the efficiency) of RA by CYP26A1 was 1.2 mL min−1 pmole P450−1, a value that is more than 10,000-fold higher than those observed for CYP3A7, CYP3A4, CYP2C8 and CYP2C9 (0.003–0.128 mL min−1 nmole P450−1) [11,14–16]. From this comparison it is clear that even if expressed at very low levels, CYP26A1 will be the major RA hydroxylase in humans. In cells that express CRABPs, the difference in affinities between P450 isozymes might be even greater. It is noteworthy, that the Km (and Kd) of RA to CYP26A1 is of the same order of magnitude as the binding affinity of RA to CRABPI and CRABPII [18,42].
In conclusion, this study provides the first biochemical characterization of CYP26A1 protein and its function, including the first kinetic description of the metabolism of RA by human rCYP26A1. The kinetic results show that CYP26A1 is likely to be the major RA eliminating enzyme in humans when compared to those previously identified, such as CYP2C8, CYP2C9 and CYP3A4. The qualitative analysis of the metabolite profile demonstrated significant sequential metabolism of RA by CYP26A1 suggesting that 4-OH-RA is unlikely to accumulate in cellular environment to cause biological responses. The obtained kinetic and enzymological data are important for the design of new agents that inhibit retinoic acid metabolism (RAMBAs) that could be used in cancer chemotherapy, as well as in our understanding of the function of CYP26 enzymes in fetal development and in adult life. Finally, the development of an expression and purification system for CYP26A1 in Sf9 cells will facilitate future studies of the effects of genetic polymorphisms on the function of this enzyme as well as more detailed mechanistic and structural characterization.
Acknowledgments
The authors wish to thank Professors William M. Atkins and Kent L Kunze for helpful discussions and Dr Babu Kantipudi for conducting the NMR analyses of 4-OH-RA.
This work was supported in part by a grant from the National Institutes of Health R01GM081569-01 and by the UW NIEHS sponsored Center for Ecogenetics and Environmental Health P30ES07033.
Nonstandard Abbreviations used
- RA
all-trans-retinoic acid
- 4-OH-RA
4-hydroxyretinoic acid
- 4-oxo-RA
4-oxo-retinoic acid
- CYP
cytochrome P450
- RAR
retinoic acid receptor
- RXR
retinoid x receptor
- ER
endoplasmic reticulum
- NADPH
nicotinamide adenine dinucleotide phosphate
- KPi
potassium phosphate
- PBS
phosphate buffered saline
- EB
equilibrium buffer
- δ-Ala
δ-aminolevulinic acid
- NP40
Nonidet P40
- CRABP
cellular retinoic acid binding protein
References
- 1.Blomhoff R, Blomhoff HK. Overview of retinoid metabolism and function. J Neurobiol. 2006;66(7):606–630. doi: 10.1002/neu.20242. [DOI] [PubMed] [Google Scholar]
- 2.Napoli JL. Retinoid acid biosynthesis and metabolism. Faseb J. 1996;10(9):993–1001. doi: 10.1096/fasebj.10.9.8801182. [DOI] [PubMed] [Google Scholar]
- 3.Napoli JL. Biochemical pathways of retinoid transport, metabolism, and signal transduction. Clin Immunol Immunopathol. 1996;80:s52–62. doi: 10.1006/clin.1996.0142. [DOI] [PubMed] [Google Scholar]
- 4.Noy N. Retinoid binding proteins: mediators of retinoid action. Biochem J. 2000;348:481–495. [PMC free article] [PubMed] [Google Scholar]
- 5.Ross AC, Ternus ME. Vitamin A as a hormone: recent advances in understanding the actions of retinol, retinoic acid and beta-carotene. J Am Diet Assoc. 1993;93(11):1285–1291. doi: 10.1016/0002-8223(93)91956-q. [DOI] [PubMed] [Google Scholar]
- 6.Lampen A, Meyer S, Arnhold T, Nau H. Metabolism of vitamin A and its active metabolite, all-trans-retinoic acid, in small intestinal enterocytes. J Pharmacol Exp Ther. 2000;295(3):979–985. [PubMed] [Google Scholar]
- 7.Allenby G, Bocquel MT, Saunders M, Kazmer S, Speck J, Rosenberger M, et al. Retinoic acid receptors and retinoid X receptors: interactions with endogenous retinoic acids. Proc Natl Acad Sci U S A. 1993;90:30–34. doi: 10.1073/pnas.90.1.30. [DOI] [PMC free article] [PubMed] [Google Scholar]
- 8.Allenb G, Janocha R, Kazner S, Speck J, Grippo JF, Levin AA. Binding of 9-cis-retinoic acid and all-trans-retinoic acid to retinoic acid receptors alpha, beta, and gamma. Retinoic acid receptor gamma binds all-trans-retinoic acid preferentially over 9-cis-retinoic acid. J Biol Chem. 1994;269(24):16689–16695. [PubMed] [Google Scholar]
- 9.Tzimas G, Nau N. The role of metabolism and toxicokinetics in retinoid teratogenesis. Curr Pharm Des. 2001;7:803–831. doi: 10.2174/1381612013397708. [DOI] [PubMed] [Google Scholar]
- 10.Chithalen V, Luu L, Petkovich M, Jones G. HPLC-MS/MS analysis of the products generated from all-trans-retinoic acid using recombinant human CYP26A. J Lipid Res. 2002;43(7):1133–1142. doi: 10.1194/jlr.m100343-jlr200. [DOI] [PubMed] [Google Scholar]
- 11.Marill J, Cresteil T, Lanotte M, Chabot GG. Identification of human cytochrome P450s involved in the formation of all-trans retinoic acid principal metabolites. Mol Pharmacol. 2000;58(6):1341–1348. doi: 10.1124/mol.58.6.1341. [DOI] [PubMed] [Google Scholar]
- 12.Idres N, Marill J, Flexor MA, Chabot GG. Activation of retinoic acid receptor-dependent transcription by all-trans retinoic acid metabolites and isomers. J Biol Chem. 2002;277(35):31491–31498. doi: 10.1074/jbc.M205016200. [DOI] [PubMed] [Google Scholar]
- 13.Niederreither K, Abu-Abed S, Schuhbau B, Petkovich M, Chambon P, Dolle P. Genetic evidence that oxidative derivatives of retinoic acid are not involved in retinoid signaling during mouse development. Nat Genet. 2002;31(1):84–88. doi: 10.1038/ng876. [DOI] [PubMed] [Google Scholar]
- 14.Nadin L, Murray M. Participation of CYP2C8 in retinoic acid 4-hydroxylation in human hepatic microsomes. Biochem Pharmacol. 1999;58(7):1201–1208. doi: 10.1016/s0006-2952(99)00192-6. [DOI] [PubMed] [Google Scholar]
- 15.Chen H, Fantel AG, Juchau MR. Catalysis of the 4-hydroxylation of retinoic acids by cyp3a7 in human fetal hepatic tissues. Drug Metab Dispos. 2000;28(9):1051–1057. [PubMed] [Google Scholar]
- 16.McSorley LC, Daly AK. Identidication of human cytochrome P450 isoforms that contribute to all-trans-retinoic acid 4-hydroxylation. Biochem Pharmacol. 2000;60(4):517–526. doi: 10.1016/s0006-2952(00)00356-7. [DOI] [PubMed] [Google Scholar]
- 17.Napoli JL. Retinoid binding-proteins redirect retinoid metabolism: biosynthesis and metabolism of retinoic acid. Semin Cell Dev Biol. 1997;8(4):403–415. doi: 10.1006/scdb.1997.0164. [DOI] [PubMed] [Google Scholar]
- 18.Dong D, Ruuska SE, Levinthal DJ, Noy N. Distinct roles for cellular retinoic acid-binding proteins I and II in regulating signaling by retinoic acid. J Biol Chem. 1999;274(34):23695–23698. doi: 10.1074/jbc.274.34.23695. [DOI] [PubMed] [Google Scholar]
- 19.White JA, Guo YD, Baetz K, Beckett-Jones B, Bonasoro J, Hsu KE, et al. Identification of the retinoic acid inducible all-trans-retinoic acid 4-hydroxylase. J Biol Chem. 1996;271(47):29922–29927. doi: 10.1074/jbc.271.47.29922. [DOI] [PubMed] [Google Scholar]
- 20.White JA, Beckett-Jones B, Guo YD, Dilworth FJ, Bonasoro J, Jones G, et al. cDNA cloning of human retinoic acid-metabolizing enzyme (hP450RAI) identifies a novel family of cytochromes P450. J Biol Chem. 1997;272(30):18538–18541. doi: 10.1074/jbc.272.30.18538. [DOI] [PubMed] [Google Scholar]
- 21.White JA, Ramshaw H, Taimi M, Stangle W, Zhang A, Everingham S, et al. Identification of the human cytochrome P450, P450RAI-2, which is predominantly expressed in the adult cerebellum and is responsible for all-trans-retinoic acid metabolism. Proc Natl Acad Sci U S A. 2000;97(12):6403–6408. doi: 10.1073/pnas.120161397. [DOI] [PMC free article] [PubMed] [Google Scholar]
- 22.Taimi M, Helvig C, Wisniewski J, Ramshaw H, White J, Amad M, et al. A novel human cytochrome P450, CYP26C1, involved in the metabolism of 9-cis and all-trans isomers of retinoic acid. J Biol Chem. 2004;279(1):77–85. doi: 10.1074/jbc.M308337200. [DOI] [PubMed] [Google Scholar]
- 23.Lee SJ, Perera L, Coulter SJ, Mohrenweiser HW, Jetten A, Goldstein JA. The discovery of new coding alleles of human CYP26A1 that are potentially defective in the metabolism of all-trans-retinoic acid and their assessment in a recombinant cDNA expression system. Pharmacogenet Genomics. 2007;17(3):169–180. doi: 10.1097/FPC.0b013e32801152d6. [DOI] [PMC free article] [PubMed] [Google Scholar]
- 24.Sakai Y, Meno C, Fujii H, Nishino J, Shiratori H, Saijoh Y, et al. The retinoic acid-inactivating enzyme CYP26 is essential for establishing an uneven distribution of retinoic acid along the antero-posterior axis within the mouse embryo. Genes Dev. 2001;15(2):213–225. doi: 10.1101/gad.851501. [DOI] [PMC free article] [PubMed] [Google Scholar]
- 25.Yashiro K, Zhao X, Uehara M, Yamashita K, Nishijima M, Nishino JS, et al. Regulation of retinoic acid distribution is required for proximodistal patterning and outgrowth of the developing mouse limb. Dev Cell. 2004;6(3):411–422. doi: 10.1016/s1534-5807(04)00062-0. [DOI] [PubMed] [Google Scholar]
- 26.Abu-Abed S, Dolle P, Metzger D, Beckett B, Chambon P. The retinoic acid-metabolizing enzyme, CYP26A1, is essential for normal hindbrain patterning, vertebral identity, and development of posterior structures. Genes Dev. 2001;15:226–240. doi: 10.1101/gad.855001. [DOI] [PMC free article] [PubMed] [Google Scholar]
- 27.Trofimova-Griffin ME, Brzezinski MR, Juchau MR. Patterns of CYP26 expression in human prenatal cephalic and hepatic tissues indicate an important role during early brain development. Brain Res Dev Brain Res. 2000;120(1):7–16. doi: 10.1016/s0165-3806(99)00185-6. [DOI] [PubMed] [Google Scholar]
- 28.Samokyszyn VM, Gall WE, Zawada G, Freyaldenhoven MA, Chen G, Mackenzie PI, et al. 4-hydroxyretinoic acid, a novel substrate for human liver microsomal UDP-glucuronosyltransferase(s) and recombinant UGT2B7. J Biol Chem. 2000;275(10):6908–6914. doi: 10.1074/jbc.275.10.6908. [DOI] [PubMed] [Google Scholar]
- 29.Omura T, Sato R. The carbon monoxide-binding pigment of liver microsomes. I. Evidence for its hemoprotein nature. J Biol Chem. 1964;239:2370–2378. [PubMed] [Google Scholar]
- 30.Andreola F, Hayhurst GP, Luo G, Ferguson SS, Gonzalez FJ, Goldstein JA, et al. Mouse liver CYP2C39 is a novel retinoic acid 4-hydroxylase. Its down-regulation offers a molecular basis for liver retinoid accumulation and fibrosis in aryl hydrocarbon receptor-null mice. J Biol Chem. 2004;279(5):3434–3438. doi: 10.1074/jbc.M305832200. [DOI] [PubMed] [Google Scholar]
- 31.Segel IH. Enzyme Kinetics. New York: Wiley; 1993. [Google Scholar]
- 32.Obach RS, Reed-Hagen AE. Measurement of Michaelis constants for cytochrome P450-mediated biotransformation reactions using a substrate depleteion approach. Drug Metab Dispos. 2002;30(7):831–837. doi: 10.1124/dmd.30.7.831. [DOI] [PubMed] [Google Scholar]
- 33.Nath A, Atkins WM. A theoretical validation of the substrate depletion approach to determining kinetic parameters. Drug Metab Dispos. 2006;34(9):1433–1435. doi: 10.1124/dmd.106.010777. [DOI] [PubMed] [Google Scholar]
- 34.Fujii H, Sato T, Kaneko S, Gotoh O, Fujii-Kuriyama Y, Osawa K, et al. Metabolic inactivation of retinoic acid by a novel P450 differentially expressed in developing mouse embryos. Embo J. 1997;16(14):4163–4173. doi: 10.1093/emboj/16.14.4163. [DOI] [PMC free article] [PubMed] [Google Scholar]
- 35.Wang Y, Zolfaghari R, Ross AC. Cloning of rat cytochrome P450RAI (CYP26) cDNA and regulation of its gene expression by all-trans-retinoic acid in vivo. Arch Biochem Biophys. 2002;401:235–243. doi: 10.1016/S0003-9861(02)00043-7. [DOI] [PubMed] [Google Scholar]
- 36.MacLean G, Abu-Abed S, Dolle P, Tahayoto A, Chambon P, Petkovich M. Cloning of a novel retinoic-acid metabolizing cytochrome P450, Cyp26B1, and comparative expression analysis with Cyp26A1 during early murine development. Mech Dev. 2001;107:195–201. doi: 10.1016/s0925-4773(01)00463-4. [DOI] [PubMed] [Google Scholar]
- 37.Hernandez RE, Putzke AP, Myers JP, Margaretha L, Moens CB. Cyp26 enzymes generate the retinoic acid response pattern necessary for hindbrain development. Development. 2007;134:177–187. doi: 10.1242/dev.02706. [DOI] [PMC free article] [PubMed] [Google Scholar]
- 38.Gonzalez FJ, Korzekwa KR. Cytochromes P450 expression systems. Ann Rev Pharmacol Toxicol. 1995;35:369–390. doi: 10.1146/annurev.pa.35.040195.002101. [DOI] [PubMed] [Google Scholar]
- 39.Barnes HJ, Arlotto MP, Waterman MR. Expression and enzymatic activity of recombinant cytochrome P450 17-alpha-hydroxylase in Esterichia coli. Proc Natl Acad Sci U S A. 1991;88(13):5597–5601. doi: 10.1073/pnas.88.13.5597. [DOI] [PMC free article] [PubMed] [Google Scholar]
- 40.Grogan J, Shou M, Andruisak EA, Tamura S, Buters JTM, Gonzalez FJ, et al. Cytochrome P450 2A1, 2E1, and 2C9 cDNA-expression by insect cells and partial purification using hydrophobic chromatography. Biochem Pharmacol. 1995;50(9):1509–1515. doi: 10.1016/0006-2952(95)02065-9. [DOI] [PubMed] [Google Scholar]
- 41.Buters JTM, Shou M, Hardwick JP, Kozekwa KR, Gonzalez FJ. cDNA-directed expression of human cytochrome P450 CYP1A1 using baculovirus. Purification, dependency on NADPH-P450 oxidoreductase, and reconstitution of catalytic properties without purification. Drug Metab Dispos. 1995;23(7):696–701. [PubMed] [Google Scholar]
- 42.Ross AC. Cellular metabolism and activation of retinoids: roles of cellular retinoid-binding proteins. Faseb J. 1993;7(2):317–327. doi: 10.1096/fasebj.7.2.8440409. [DOI] [PubMed] [Google Scholar]