

Abstract
Mitochondria are integral elements of many nerve terminals. They must be appropriately positioned to regulate microdomains of Ca2+ concentration and metabolic demand, but structures that anchor them in place have not been described. By applying the high resolution of electron tomography (ET) to the study of a central terminal, the calyx of Held, we revealed an elaborate cytoskeletal superstructure that connected a subset of mitochondria to the presynaptic membrane near active zones. This cytoskeletal network extended laterally and was well integrated into the nerve terminal cytoskeleton, which included filamentous linkages among synaptic vesicles. ET revealed novel features of inner membrane for these mitochondria. Crista structure was polarized in that crista junctions, circular openings of the inner membrane under the outer membrane, were aligned with the cytoskeletal superstructure and occurred at higher density in mitochondrial membrane facing the presynaptic membrane. These characteristics represent the first instance where a subcomponent of an organelle is shown to have a specific orientation relative to the polarized structure of a cell. The ratio of cristae to outer membrane surface area is large in these mitochondria relative to other tissues, indicating a high metabolic capacity. These observations suggest general principles for cytoskeletal anchoring of mitochondria in all tissues, reveal potential routes for nonsynaptic communication between presynaptic and postsynaptic partners using this novel cytoskeletal framework, and indicate that crista structure can be specialized for particular functions within cellular microdomains.
Introduction
To sustain high rates of synaptic transmission, nerve terminals must maintain ionic gradients, including regulation of intracellular Ca2+ levels, and support fusion and recycling of synaptic vesicles. Mitochondria are hallmark structures of many nerve terminals, long considered to function in all of these processes, but only relatively recently have their specific roles in energy supply and Ca2+ buffering been linked to the dynamics of synaptic transmission (Tang and Zucker, 1997; Jonas et al., 1999; Billups and Forsythe, 2002; Verstreken et al., 2005). Positioning of mitochondria within the nerve terminal is likely important for these functions. Even small bouton terminals, which can lack mitochondria, recruit motile mitochondria in an activity-dependent manner that park for extended periods near active zones (Shepherd and Harris, 1998; Chang et al., 2006). In nerve terminals from diverse regions such as thalamic nuclei, hippocampus, vestibular nuclei and cerebral cortex, many mitochondria appear to take up a calibrated position near the active zone (Peters et al., 1991; Lieberman and Spacek, 1997; Spacek and Harris, 1998). This positioning is suggestive of a generalized cytoskeletal system for anchoring mitochondria in nerve terminals. However, the cytoskeletal elements that position and anchor mitochondria and their potential interaction with the nerve terminal cytoskeleton have not been well described.
The calyx of Held, perhaps the largest nerve terminal in the CNS and a key structure of brainstem circuits that mediate the early stages of sound localization (Schneggenburger and Forsythe, 2006), offers a model system to investigate positioning of mitochondria within the terminal. A single calyx contains hundreds of mitochondria with a well ordered placement over adhering junctions that are adjacent to active zones (Rowland et al., 2000). This organelle arrangement, termed the mitochondrion-associated adherens complex (MAC; Spirou et al., 1998), was initially described in dorsal horn of the spinal cord (Gray, 1963) and is found in calyces and other large terminals of the auditory brainstem (Cant and Morest, 1979; Tolbert and Morest, 1982; Rowland et al., 2000) and in a variety of mammalian species including humans (Kimura et al., 1987; Thiers et al., 2000, 2002).
Few studies have used specialized electron microscopic techniques, such as deep-etch freezing and electron tomography (ET), to examine the nerve terminal at high spatial resolution. These approaches provided an emerging, yet still incomplete, picture of filamentous linkages among vesicles and between vesicles and the active zone that likely manage vesicle translocation (Landis et al., 1988; Hirokawa et al., 1989; Gotow et al., 1991; Gustafsson et al., 2002; Siksou et al., 2007). Improvements in ET techniques have yielded high-resolution three-dimensional (3-D) information about ultrastructural differences among mitochondria from different cell types and cellular compartments (Mannella et al., 1994, 1997; Perkins et al., 1997a,b, 2001; Frey et al., 2006). We performed the first application of ET to the calyx of Held to provide new structural details about MAC mitochondria and compared them to other mitochondria in the calyx and from other tissues by extending analyses from published studies. The novel features of crista structure and cytoskeletal anchoring of mitochondria described here reveal new aspects of nerve terminal organization in support of synaptic transmission and suggest nonsynaptic routes for communication between presynaptic and postsynaptic partners.
Materials and Methods
Five adult cats were used in these experiments. All animal protocols were approved by the Institutional Animal Care and Use Committee at West Virginia University. One animal was used for tract tracing, two animals for immunocytochemistry and two animals for both electron microscopy and electron tomography. Cats were used because this study builds upon description in this species of the spatial relationship between MAC structures and synapses (Rowland et al., 2000) and cats have been a common animal model for anatomical and physiological studies of the central auditory system.
Tissue preparation for tract tracing and immunocytochemistry.
Details of surgical procedures have been published recently (Spirou et al., 2008) and are briefly summarized here. One animal, colony-raised to be free of ear infection (Harlan Sprague Dawley, Minneapolis, MN), was decerebrated under ketamine (10 mg/kg; Fort Dodge Animal Health, Fort Dodge, IA) anesthesia after receiving xylazine (10 mg; Phoenix Pharmaceuticals, St Joseph, MO) as a tranquilizer. Low molecular weight biotinylated dextran amine (BDA; 10% in normal saline) was iontophoresed into the cell group targeted by calyx-forming axons, the medial nucleus of the trapezoid body (MNTB), to label calyces. After 3 d, the animal was deeply anesthetized with Nembutal (40 mg/kg), and perfused transcardially using a mixed aldehyde fixative composed of 4% freshly depolymerized paraformaldehyde and 0.2% glutaraldehyde (EM grade, Polysciences, Warrington, PA) in 0.12 m sodium phosphate buffer (2 l; pH 7.2; all chemicals from Sigma, St Louis, MO, unless otherwise noted). For immunocytochemistry, two animals were perfused as for tract tracing, except the fixative consisted only of 4% freshly depolymerized paraformaldehyde in phosphate buffer. After cryoprotection, frozen sections were collected in the transverse plane at 12 μm thickness onto glass slides using a cryostat (immunocytochemistry; Leica) or 45 μm thickness (tract tracing) into 0.5 m Tris-HCl buffer (Tris), pH 7.6, using a freezing microtome.
Tissue preparation for electron microscopy and electron tomography.
In preparation for perfusion, animals were anesthetized by using a combination of xylazine (10 mg) and ketamine (10 mg/kg) and immobilized over a downdraft table, and deeply anesthetized intravenously with Nembutal (40 mg/kg). Vascular rinse and fixation was accomplished as described in the previous paragraph except the mixed aldehyde fixative was composed of 2% freshly depolymerized paraformaldehyde and 2.5% glutaraldehyde in 0.12 m sodium phosphate buffer (2 l; pH 7.2). Fixative was introduced within 45 s after beginning the perfusion. Brains were dissected in ice-cold fixative and sectioned by using a Vibratome (Vibratome, St Louis, MO) at a thickness of 200 μm. Sections were collected into individual wells and held between nylon mesh rings to remain flat during staining and dehydration (Hoffpauir et al., 2007). Sections were rinsed several times in 0.12 m sodium phosphate buffer, postfixed for 1 h in chilled 0.5% osmium tetroxide, stained en bloc with chilled 2% aqueous uranyl acetate, dehydrated in graded ethanols and propylene oxide, infiltrated in resin (Polybed 812; Polysciences, Warrington, PA) and flat-embedded.
Tissue blocks containing the MNTB were selected and semithin sections (0.5–1 μm) were cut, collected onto pioloform-coated slotted grids or clamshell grids and stained with 1% uranyl acetate and 1% lead citrate using an automated grid stainer (Leica). The first semithin section was mounted on a glass slide, stained with toluidine blue (2%) and imaged using an oil-immersion lens (100×). The boundaries of the MNTB and cells within the MNTB that were contacted by noticeably large portions of the calyx (stalks or large swellings) were marked on a printout of the images to identify subjects for ET. Tissue sections were transported to the National Center for Microscopy and Imaging Research (NCMIR) for collection of tomographic images.
Electron tomography.
Colloidal gold particles (15 and 20 nm diameter) were deposited on opposite sides of the section to serve as fiducial cues. For stability in the beam, the section was coated with carbon on both sides. For each reconstruction, either a single series or double series of images at regular tilt increments was collected with a JEOL 4000EX intermediate-voltage electron microscope operated at 400 kV. The specimens were irradiated before initiating a tilt series to limit anisotropic specimen thinning during image collection. Tilt series were recorded using either a slow-scan CCD camera or film at 15–20,000 magnification. Angular increments of 2° from −60° to +60° about an axis perpendicular to the optical axis of the microscope were achieved using a computer-controlled goniometer to increment accurately the angular steps. The pixel dimensions of the CCD camera were 1960 × 2560 and the pixel resolution was 1.1 nm. For film tilt series, negatives were digitized using various scanners with pixel resolutions ranging from 0.7 to 2.2 nm. The illumination was held to near parallel beam conditions and optical density maintained constant by varying the exposure time. For the initial several tilt series, the IMOD software package (Kremer et al., 1996) was used for the complete image processing. After TxBR software became available, IMOD was used for the rough alignment and the fine alignment and reconstruction performed using the TxBR package (Lawrence et al., 2006). Volume segmentation was performed by manual tracing in the planes of highest resolution (X-Y) with the program Xvoxtrace (Perkins et al., 1997b) or Jinx [National Center for Microscopy and Imaging Research (NCMIR), San Diego, CA]. The mitochondrial reconstructions were visualized using Analyze (Mayo Foundation, Rochester, MN) or the surface-rendering graphics of Synu (NCMIR) as described by Perkins et al. (1997b). These programs allow one to step through slices of the reconstruction in any orientation and to track or model features of interest in three dimensions.
Measurements of structural features were made within the reconstructions using ImageJ (http://rsb.info.nih.gov/ij/) and within the segmented volumes by the programs Synuarea and Synuvolume (NCMIR). Nine MAC complexes from five calyx swellings were analyzed. The crista/outer mitochondrial membrane (OMM) surface area ratio was calculated by summing the measurements of individual crista membrane surface area taken from Synuarea and then dividing this sum by the OMM surface area, again calculated using Synuarea. The crista/mitochondrion volume ratio was calculated in a similar manner by using volume measurements from Synuvolume. The crista junction densities were calculated by counting the number of crista junctions in a mitochondrial volume using ImageJ then dividing this value by the OMM surface area measured with Synuvolume. The crista junction diameters were measured with ImageJ by using the line tool to draw across the opening from one membrane to the other without including the membrane density. Values are given as mean ± SD unless otherwise indicated. Movies were made with Amira (Visage Imaging). Measurements of calyx mitochondria were compared with mitochondria in other neuronal and non-neuronal cell types from the image archive at NCMIR. The published studies from which these images were taken and further analyzed for this publication are listed in Table 1. These citations can be consulted for details of tissue preparation.
Table 1.
Tissue and brain region comparison of mitochondrial structure
| Tissue or cell type | Crista/OMM surface arearatio | Crista/mitochondrionvolume ratio | Reference |
|---|---|---|---|
| Neural tissue—CNS | |||
| Rod spherule | 5.2 ± 0.17 | 0.31 ± 0.017 (4) | Johnson et al. (2007) |
| Calyx—MAC | 2.7 ± 0.26 | 0.24 ± 0.047 (9) | This paper |
| Cone inner segment | 2.6 ± 0.50 | 0.22 ± 0.04 (7) | He et al. (2003) |
| Cone pedicle | 2.0 ± 0.78 | 0.14 ± 0.048 (3) | Johnson et al. (2007) |
| Calyx—non-MAC | 1.3 ± 0.25 | 0.17 ± 0.027 (6) | This paper |
| Rod inner segment | 1.2 ± 0.47 | 0.16 ± 0.05 (7) | He et al. (2003) |
| Retinal ganglion | 1.7 ± 0.40 | 0.17 ± 0.039 (21) | Ju et al. (2007) |
| Optic nerve head | 1.3 ± 0.46 | 0.16 ± 0.055 (21) | Ju et al. (2008) |
| Cerebellum | 1.6 ± 0.28 | 0.098 ± 0.0035 (3) | Perkins et al. (2001) |
| Hippocampus | 1.7 ± 0.79 | 0.16 ± 0.037 (5) | Perkins et al. (2001) |
| Striatum | 1.6 ± 1.0 | 0.18 ± 0.057 (5) | Perkins et al. (2001) |
| Cortex | 1.7 ± 0.32 | 0.20 ± 0.050 (9) | Perkins et al. (2001) |
| Spinal cord | 1.6 ± 0.41 | 0.17 ± 0.033 (6) | M. Ellisman, personal communication |
| Neural tissue—PNS | |||
| Schwann cell | 0.70 ± 0.18 | 0.08 ± 0.033 (3) | M. Ellisman, personal communication |
| Axon (spinal root) | 0.41 ± 0.13 | 0.15 ± 0.04 (9) | M. Ellisman, personal communication |
| Non-neural tissue | |||
| Brown fat | 4.9 ± 1.2 | 0.23 ± 0.053 (37) | Perkins et al. (1998) |
| Isolated liver | 2.3 ± 0.70 | 0.19 ± 0.03 (3) | Yamaguchi et al. (2008) |
| HeLa | 0.95 ± 0.52 | 0.08 ± 0.03 (11) | M. Ellisman, personal communication |
All measurements were performed on tomographic reconstructions.
Tract-tracing.
Sections were preincubated in hydrogen peroxide and methanol to reduce endogenous peroxidase activity, rinsed in Tris and washed in Tris-Triton to permeabilize cell membranes. BDA was visualized using an Elite ABC kit (Vector Laboratories) and incubated for up to 30 min in hydrogen peroxide and diaminobenzidine. After rinsing in Tris buffer, all sections were dry mounted from a gelatin alcohol solution. Sections were counterstained with cresyl violet; every eighth section was not counterstained so that all areas of labeling could be identified easily.
Immunocytochemistry.
Tissue sections were incubated with a blocking solution of 3% goat serum/0.1% Triton in PBS for 1 h. The sections are incubated overnight at 4°C in primary antibodies diluted in washing solution (0.5% goat serum and 0.1% Triton in PBS). The antibody concentrations were MAP-2 (1:10,000, Encor Biotechnology), vGlut 1 and 2 (1:2500 each, Millipore), α-tubulin (1:500, Sigma-Aldrich) and Cox1 (1:500, MitoSciences). The sections were rinsed 3 times for 10 min each in PBS before being incubated in secondary antibodies (1:200, Invitrogen) for 2 h and phalloidin conjugated to Alexa-568 (1:200, Invitrogen) for 2 h. Sections were rinsed 3 times in PBS, wet mounted in Vectashield (Vector Laboratories) and sealed with nail polish to prevent reduction of tissue thickness. Image stacks were collected using a confocal microscope (LSM 510 Meta, Carl Zeiss Microimaging).
Results
Branching structure and internal organization of the calyx terminal
The calyx of Held exhibits a complex geometry that consists of branch structures of varying thickness and linked swellings of varying size (Fig. 1A) (Spirou et al., 2008), which collectively can envelop the cell body of their postsynaptic target. The calyx-forming axon is of large caliber, on the order of 10 μm diameter in cats (Spirou et al., 1990), and typically branches into one to several main stalks of up to 4 μm diameter. Second and third order branches typically consist of ellipsoid swellings often linked by narrow (<1 μm diameter) necks (Rowland et al., 2000; Spirou et al., 2008). Numerous mitochondria are located in the core of calyx stalks, branches and swellings but also are arranged near the presynaptic membrane, which contains multiple synaptic sites supported by a large number of synaptic vesicles (Fig. 1B). Mitochondria that are positioned near the presynaptic membrane within each swelling and along stalks can form mitochondrion-associated adherens complexes (MACs) (Fig. 1C) (Rowland et al., 2000). The MAC is comprised of a mitochondrion positioned about 200 nm from the presynaptic membrane, and the following structural elements that are indistinctly revealed by standard transmission electron microscopy (sTEM): (1) an electron dense mitochondrial plaque adjacent to the OMM that faces the presynaptic membrane, (2) filament-like elements appearing to link the mitochondrial plaque to a (3) punctum adherens, and (4) tubular or vesicular-appearing membrane interposed among the filaments (Fig. 1C). Cristae of MAC mitochondria in many images appear to be oriented perpendicular to the punctum adherens at the presynaptic membrane, and these puncta adherentia are located adjacent to and often encircled by synapses (Rowland et al., 2000). These observations led to our hypotheses that mitochondria located nearest synapses may function in vesicle recycling and reconditioning through synthesis of ATP and glutamate and in Ca2+ buffering in part by shuttling this ion along the length of mitochondria (Rowland et al., 2000). ET revealed the key elements of the MAC in greater detail, including clear delineation of crista membrane (single image from a tomographic series shown in Fig. 1D), due to an order of magnitude improved resolution relative to sTEM in the dimension orthogonal to the image plane (Frank, 2006). In the following paragraphs, detailed features of the internal structure of the MAC mitochondrion, cytoskeletal features linking the mitochondrion to the presynaptic membrane and its connections to the larger nerve terminal cytoskeleton, resolvable only using ET, will be presented. Tomographic analysis was performed on five nerve terminals and focused analysis of nine MACs within those terminals.
Figure 1.
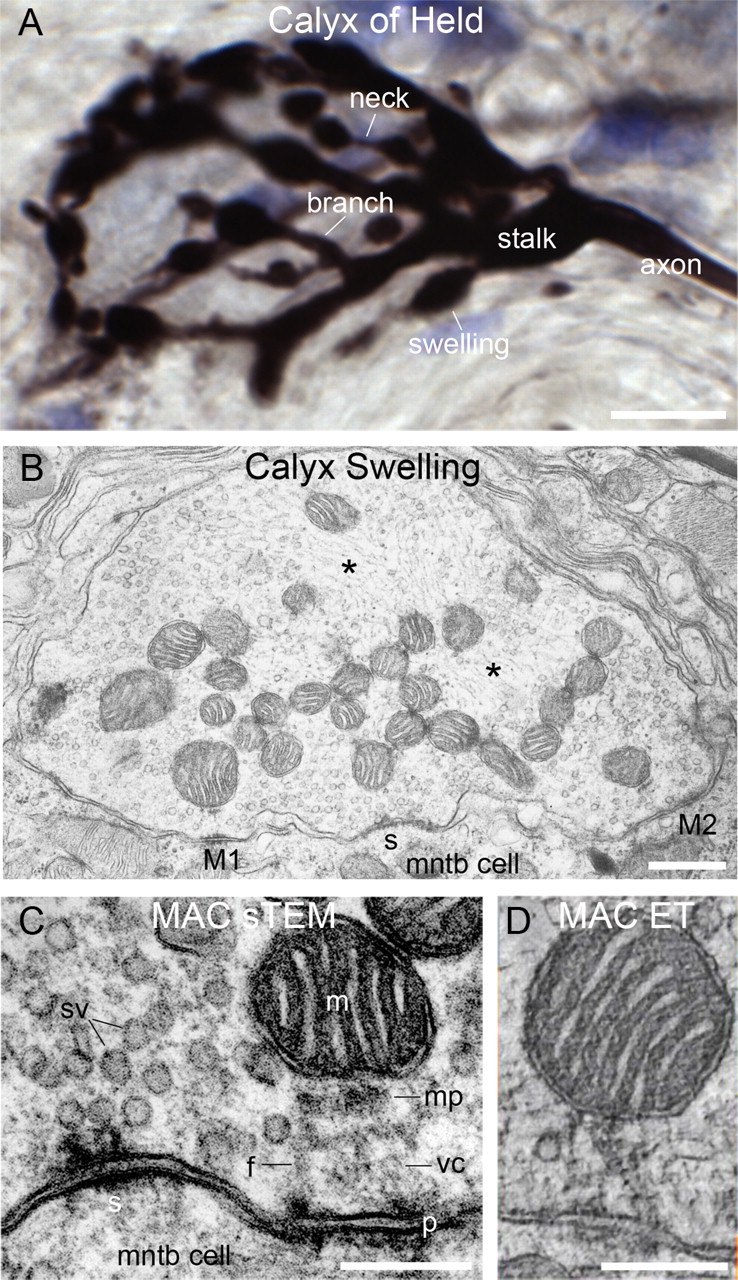
Geometry and internal structure of the calyx of Held. A, Calyx of Held labeled via injection of biotinylated dextran amine in vivo. A large caliber axon branches into thick stalks as it approaches the MNTB cell body, which is unstained in this preparation but outlined by the calyx. Further branches from the stalks consist of branches that lead to swellings of various sizes, many of which are linked by narrow necks. B, A single calyx swelling viewed in cross-section using sTEM of a 70 nm ultrathin section. Ordered cytoskeletal elements (asterisks) and mitochondria occupy the core of the swelling. Vesicle populations are distributed toward the periphery. MACs (M1, M2) and synapses (s) are located in swellings. C, Structure of the MAC viewed by sTEM from a different terminal than B. A mitochondrion (m) is positioned near the presynaptic membrane with the portion of outer membrane that faces the presynaptic membrane flattened parallel to an electron dense bar termed the mitochondrial plaque (mp). The mitochondrial plaque appears to be linked by filaments, which are not revealed well by sTEM, to a punctum adherens (p). Tubular or vesicular-appearing membrane, termed the vesicular chain (vc), is interposed between the mitochondrial plaque and punctum adherens. MACs are located adjacent to synapses; sv, synaptic vesicle. D, Appearance of the MAC in a single image from an image stack constructed using ET. The elements of the MAC are evident, but do not have the composite density that is observed in a single TEM image, so their internal structure can be studied. Scale bars: A, 10 μm; B, 500 nm; C, D, 200 nm.
Polarized structure of MAC mitochondria
Application of ET to mitochondrial structure over the past 15 years has revealed a new paradigm in crista structure whereby both lamellar and tubular cristae connect to the intermembrane space through narrow tubules and circular openings termed crista junctions (Mannella et al., 1994; Perkins et al., 1997a, 2001, 2003). Segmentation of the tomographic reconstruction and three-dimensional rendering of the inner mitochondrial membrane (IMM) revealed the cristae of MAC mitochondria to have a lamellar organization, imparting a polarized structure to the mitochondrion (Fig. 2A–C; 3-D structure explored in supplemental movie M1, available at www.jneurosci.org as supplemental material). These lamellae were regularly spaced, were not interconnected and were relatively flat but became slightly curved near the lateral boundary of the mitochondrion. No tubular cristae were observed, which is unusual for brain mitochondria (Perkins et al., 1997a, 2001). Because the great majority of electron transport chain molecules reside on the crista membranes (Gilkerson et al., 2003; Vogel et al., 2006), the ratio of crista/OMM surface area can be interpreted as the ATP synthesizing capacity of the mitochondrion (Perkins et al., 2003). Among neural cell types, MAC mitochondria had a large crista/OMM ratio, similar to those of the cone photoreceptor inner segment and eclipsed only by mitochondria in the rod synaptic region (Table 1). The ratio of crista/OMM surface area was significantly greater in MAC than non-MAC mitochondria in the calyx (2.7 ± 0.26 (n = 9) vs 1.3 ± 0.25 (n = 6); mean ± SD, p < 0.001) as was also the crista/mitochondrion volume ratio (0.24 ± 0.05 vs 0.17 ± 0.03; p < 0.01). The large surface area ratios for photoreceptors were consistent with the high metabolic rate of retina and the highest rate within retina occurring in the photoreceptor layers (Perkins et al., 2003).
Figure 2.

Membrane segmentation of a MAC mitochondrion. A, MAC mitochondria have cristae that fill their interior. The OMM and crista membranes were segmented separately and surface-rendered. A top-view of the surface-rendered volume is superimposed over a roughly central slice through the reconstruction shown for perspective. The OMM is shown in translucent blue and each crista in a different color. Crista junction location is measured as maximum angular deviation (rays a–d) from a line segment (e) through the center of the mitochondrion and perpendicular to its presynaptic face. B, A side-view of the surface-rendered volume. C, MAC mitochondria have only lamellar cristae that are not interconnected. The segmented cristae are shown in different colors over a central slice through the reconstruction. D, E, Examples from two cristae are shown. The lamellar cristae have “fingers” that connect to the periphery via circular openings and are termed crista junctions (arrowheads in E; inset in D shows crista junction opening). F, G, Views of inner mitochondrial membrane with OMM removed. Crista junctions have a polar distribution within MAC mitochondria. There are more junctions along the presynaptic face (viewed from presynaptic membrane in F) than along the opposite face (viewed from interior of terminal in G). The openings are visualized using right lighting of a side view. Scale bar (A), 100 nm.
ET revealed that the cristae of MAC mitochondria extended crista junctions, several per crista, that connected from the edge of the crista to the intermembrane space (Fig. 2D,E, arrowheads). A close-up view of the crista junction openings under the OMM is shown in the insert at lower right in Figure 2D. In this figure, one image from the tomographic series was inserted into the volume rendered structure (Fig. 2A–E) to demonstrate that crista junctions were only located under portions of the OMM that faced toward or generally away from the presynaptic membrane. The positioning of crista junctions was quantified as the angular deviation from a line extended from the center of the mitochondrion perpendicular to the presynaptic face of the OMM (Fig. 2A). An average of 102 ± 24° (range −81° to +78°; n = 9) encompassed crista junctions oriented toward the presynaptic membrane. Values were 93 ± 34° (range 107° to 293°) for oppositely oriented crista junctions. Rendering of the IMM surface, with the OMM removed, suggested a further aspect of structural polarization, whereby crista junctions occurred at higher density where the mitochondrion faced the presynaptic membrane compared with the region oriented away from the presynaptic membrane (Fig. 2F,G, respectively). This feature was confirmed by quantification of the density of crista junctions (174 ± 89/μm2 at the synaptic face vs 96 ± 30/μm2 at the opposite face; p = 0.03, n = 9 MAC mitochondria; Table 2). Non-MAC mitochondria in the same region also had lamellar cristae, did not exhibit a difference in the density of crista junctions at each end of the cristae, and had a lower density of crista junctions (58 ± 25/μm2) than were found at either end of the cristae in the MAC mitochondria. The sizes of the crista junction opening varied slightly between these two populations of mitochondria (15 ± 2 nm for MAC mitochondria vs 12 ± 1 nm for non-MAC mitochondria; p = 0.04) and were similar to those from other neural mitochondria (Table 2), but the crista width (between lamellar portions of IMM) did not differ (12 ± 4 nm vs 13 ± 4 nm; n = 100 each). The polarization of crista junction location and density in MAC mitochondria suggests preferential routes for biochemical communication between the mitochondrion and cellular microdomain nearest the presynaptic membrane.
Table 2.
Crista junction densities
| Tissue or cell type | Crista junctiondensity (per μm2) | Crista junctiondiameter (nm) |
|---|---|---|
| Neural tissue—CNS | ||
| Calyx—MAC synaptic face | 174 ± 89 (9) | 15 ± 2 (105) |
| Calyx —MAC nonsynaptic face | 96 ± 30 (9) | 15 ± 3 (46) |
| Calyx—non-MAC | 58 ± 25 (9) | 12 ± 1 (48) |
| Rod spherule | 54 ± 17 (6) | 12 ± 4 (102) |
| Rod inner segment | 72 ± 29 (5) | 17 ± 4 (148) |
| Cone pedicle | 56 ± 45 (6) | 9 ± 2 (32) |
| Cone inner segment | 52 ± 17 (12) | 12 ± 3 (215) |
| Retinal ganglion | 25 ± 11 (7) | 14 ± 4 (184) |
| Cerebellum | 136 ± 55 (3) | 16 ± 5 (85) |
| Hippocampus | 25 ± 15 (3) | 14 ± 4 (38) |
| Striatum | 65 ± 27 (6) | 14 ± 4 (43) |
| Cortex | 37 ± 8 (6) | 14 ± 5 (26) |
| Spinal cord | 28 ± 10 (6) | 13 ± 3 (99) |
| Neural tissue—PNS | ||
| Schwann cell | 80 ± 29 (6) | 13 ± 4 (40) |
| Axon (spinal root) | 19 ± 10 (6) | 13 ± 4 (65) |
| Non-neural tissue | ||
| Brown fat | 59 ± 26 (6) | 14 ± 5 (524) |
| Isolated liver | 13 ± 5 (5) | 17 ± 7 (197) |
| HeLa | 54 ± 19 (11) | 12 ± 3 (177) |
All values are indicated as mean ± SD; number of samples indicated in parentheses. All measurements were performed on tomographic reconstructions.
The MAC cytoskeleton
Mitochondrial plaque
In sTEM the mitochondrial plaque appeared as an electron dense, solid planar slab oriented parallel to the apposed surface of the OMM, which often appeared flattened, with unrevealed attachments to the mitochondrion (Fig. 1C) (Rowland et al., 2000). ET provided a more detailed view of the mitochondrial plaque, and showed it was not a solid bar but was instead comprised of spherical or cuboidal structures and laterally oriented filaments. The spherical structures were similar in size to the subunits of puncta adherentia (Fig. 3B,C, arrowheads) and in many image planes appeared as a tangle of filaments. Figure 3, D–F, shows an expanded view of the mitochondrial plaque region of Figure 3A–C, respectively. Laterally oriented filaments attached to these spherical structures (Fig. 3D,F, vertical arrows), so the mitochondrial plaque was in part a meshwork of long and short filaments of uneven density. ET also revealed multiple connections of microfilaments (Fig. 3D–F, 7 ± 2 nm diameter, n = 41; thin arrows angled downward at 45°) extending between and approximately perpendicular to the mitochondrial plaque and OMM. These filaments likely prevent flattening of the OMM along the mitochondrial plaque, consistent with a thermodynamic model indicating that a gently curving membrane represents a lower energy state for a bilayer than does a sharp angle (Renken et al., 2002).
Figure 3.

The MAC has a complex cytoskeleton but few membranous structures. A–C, ET images of a MAC, separated by 10 (panels A, B) and 25 nm (panels B, C). A, Filaments extend from the mitochondrial plaque to the punctum adherens (90° angled arrows) and can crisscross giving a strut-like appearance. Some intermediate filaments run orthogonal to the section plane (medium-sized arrow at 45° angle). Microfilaments extend laterally from the MAC and link to a synaptic vesicle, which is linked to an active zone (thin arrows at 45° angle). B, C, The mitochondrial plaque contains spherical subunits (arrowhead in C adjacent to mitochondrion) that are similar in size to components of the punctum adherens (arrowheads in panels B, C along presynaptic membrane). A–C, Narrow, tube–like structures are found within the MAC (squiggled arrows angled upward at 45° in each panel) but do not link to synaptic vesicles. Structures in A, B and leftmost structure in C are continuous and range in diameter from 22 to 33 nm. Microtubules (thick horizontal arrows track a single microtubule across panels) extend along the OMM. D–F, Expanded view of the mitochondrial plaque region of the MAC from each of panels A–C. The mitochondrial plaque is comprised not only of spherical elements but also of laterally oriented filaments (thin vertical arrows). Linkages connect these lateral filaments and the spherical subunits to the OMM (thin arrows at 45° angle). Images from different calyx swelling than shown in Figure 2. Scale bars, 100 nm.
Scaffold between the mitochondrial plaque and punctum adherens
sTEM images of MAC structures in calyces and other nerve terminals inconsistently showed the indistinct appearance of filaments that were interpreted to extend in nearly a straight line between the mitochondrial plaque and the punctum adherens (Fig. 1B,C) (Tolbert and Morest, 1982; Spirou et al., 1998; Rowland et al., 2000). ET, however, revealed a detailed cytoskeletal network of both linear and branched elements. In places the filaments were long (100 nm) and appeared like struts, crossing through an organizing center about halfway between the mitochondrial plaque and punctum adherens (Fig. 3A, right-angled arrows). These filaments, with dimensions indicative of both microfilaments (7 ± 2 nm; n = 29) and thicker filaments (16 ± 2 nm; n = 15) that may be conglomerates of micro and intermediate filaments, formed the core region, or superstructure, of the MAC cytoskeleton. Filaments could also be of variable length with a range of orientations (Fig. 3A, example indicated by medium-sized arrow). The MAC superstructure largely excluded synaptic vesicles. Only 2/9 MACs contained synaptic vesicles within the superstructure (one MAC contained one vesicle and the other contained two vesicles). Single mitochondria could form more than one MAC (Rowland et al., 2000) and some vesicles were located between the MACs where the superstructure did not fill all of the space between the mitochondrial plaque and punctum adherens (Fig. 3B, example to right of arrowhead). The calyx swelling containing the features shown in Figures 3 and 4 was segmented for three-dimensional rendering to better visualize the organization of cytoskeletal elements and their relationship to organelles and the larger structure of the nerve terminal (Fig. 5). This process revealed the architectural complexity of the MAC superstructure, the typical absence of vesicles inside the superstructure and the paucity of synaptic vesicles within this territory (Fig. 5A arrows, D,E). Other features of the nerve terminal are described in subsequent sections and displayed in Figure 5 and supplemental movie M2, available at www.jneurosci.org as supplemental material.
Figure 4.

A lateral cytoskeletal network extends along the MAC mitochondrial OMM. A–C, Intermediate and microfilaments of the mitochondrial plaque curve along the OMM, and have connections to the OMM. Three intermediate filaments are tracked by three medium sized arrows, oriented at about 45° and numbered in each panel. Microfilaments are indicated by thin arrows in C. Microtubules are located adjacent to lateral portions of the OMM (the horizontal thick arrow tracks a single microtubule across A–C), but may also be located within the MAC superstructure (vertical thick arrows). The MAC contains few synaptic vesicles, which are typically smooth but can also be coated (arrowhead in C). Synaptic vesicles are attached to restricted regions of the lateral OMM (thin arrows angled downward at 45° in A and B). Images separated by 45 (A, B) and 35 nm (B, C). Images from same calyx swelling but different MAC than shown in Figure 3. Scale bar, 100 nm.
Figure 5.

Rendering of calyx structure. MACs from Figures 3 and 4 and synaptic vesicle populations are shown. Other structures outside of this region are not shown (black space inside terminal). A, View of rendered volume in the plane of section. The presynaptic membrane (dark blue) defines the border of the terminal. The terminal is filled with synaptic vesicles (light blue), which are linked by filaments (yellow; note that not all linkages are depicted). Three mitochondria (green; two mitochondria at left and one at right) are shown. Two mitochondria form MACs (white arrows), which define a largely synaptic vesicle-free zone. Details of the MAC cytoskeleton linking the mitochondrion to the presynaptic membrane are shown in subsequent panels. B, C, Structures as in A except that synaptic vesicles and linkages have been removed, and viewed on angle from left (B) or right (C). The MAC cytoskeleton is comprised of attachments to the presynaptic membrane (called the MAC superstructure and shown in greater detail in D–H) and a lateral cytoskeleton (also shown in G, H). Microtubules (thick blue filaments) and some intermediate filaments (light green) are aligned with the long axis of the mitochondrion. Active zones (yellow) are mapped onto the presynaptic membrane. D, Close-up of the MAC at left in A. The mitochondrial plaque (purple) and punctum adherens (light red, located on the presynaptic membrane) consist of discontinuous spherical and oblong structures. The mitochondrial plaque elements are themselves connected by microfilaments (red; note that all microfilaments in the rendering, regardless of location, are colored red). The mitochondrial plaque and punctum adherens are connected by the MAC superstructure, comprised of microfilaments and filaments that formed struts (gold) that could be thicker filaments or combinations of microfilaments and intermediate filaments. E, Close-up view of filaments forming a strut-like appearance, extending from the mitochondrial plaque to the punctum adherens. A narrow tubular structure (green) is located at the intersection point of the filaments. F, View from below the presynaptic membrane, in approximately the direction of the left arrow in A. The vesicular chain (dark green) is a narrow, discontinuous structure extending throughout the space between the mitochondrion and presynaptic membrane. Many of these structures vary in caliber from values similar to microtubules to larger values, but not as large as synaptic vesicle diameter. G, Lateral view of mitochondrion at right in A, showing the lateral cytoskeleton. Some microfilaments (thin green lines, white arrowheads) course in a crossing orientation to microtubules. One microtubule (asterisk) is located near two mitochondria along different portions of its length. H, View approximately in same orientation as left arrow in A, but from above the edge of the tissue. Mitochondria, MAC superstructure and lateral cytoskeleton are shown. Only vesicles tethered to the mitochondria are shown. Relatively few vesicles are tethered to the OMM.
Vesicles and reticulated membrane are not common elements of the MAC
In sTEM, vesicle-like structures could be found attached to tubular looking membrane within and surrounding the MAC with sufficient frequency that this membrane was proposed to be an endosomal intermediate structure for vesicle recycling (Rowland et al., 2000). In single electron micrographs from MAC-containing nerve terminals, circular structures could be linked by short bridges forming a chain (Tolbert and Morest, 1982; Spirou et al., 1998) and traversing the MAC approximately halfway between the mitochondrial plaque and punctum adherens. ET is especially useful for revealing the organization of reticulated membrane, and showed that, aside from occasional synaptic vesicles, such membranous elements were uncommon elements of the MAC. Reticulated membrane was found in only 3/9 MACs that were reconstructed and was limited in extent. One structure extends through all panels of Figure 3 (Fig. 3A,B, leftmost arrow in C, squiggled arrows), showing that reticulated membrane had variable diameter that was smaller than synaptic vesicle diameter. Reticulated membrane was not fused to vesicle-like structures, but rather was linked to filaments (Fig. 3C, rightmost squiggled arrow). The presence of vesicles adjacent to the superstructure or interposed between superstructure units (Fig. 3B, right of arrowhead) may give the appearance in sTEM that they are common components of the MAC and form a vesicular chain.
All MACs, though, contained narrow tubes with diameters similar to microtubules that appeared to form part of the cytoskeletal superstructure (Fig. 4A–C, arrowhead; supplemental Fig. 1A, vertical arrows, available at www.jneurosci.org as supplemental material). Three-dimensional rendering portrays the complex and discontinuous arrangement of some of these narrow tubular structures within the MAC superstructure (Fig. 5D,F, dark green structures). Short, narrow tubular structures did appear as an organizing center for crisscrossing struts of the superstructure (Fig. 5E, also colored dark green). Other narrow tubes within the superstructure were longer and can be more definitively identified as microtubules (Fig. 5D,G, colored blue).
Cytoskeleton lateral to the mitochondrion
Given the central location of MACs relative to multiple synapses (Rowland et al., 2000), we considered whether the mitochondrion might function as a synaptic body or ribbon, as found in hair cells and photoreceptors, to funnel synaptic vesicles to the active zone. However, an unexpected feature of the MAC revealed by ET was the presence of filaments that extended out of the MAC superstructure and along the sides of the mitochondrion away from the presynaptic membrane. A sequence of three images, separated by 45 and 35 nm, demonstrates the progression of filaments curving along the OMM (three filaments are indicated by medium-sized arrows angled 45° upward and numbered in Fig. 4A–C). These filaments, which had diameters characteristic of intermediate filaments, had perpendicular linkages to the OMM, like those between the mitochondrial plaque and OMM. Thinner filaments, which had diameters characteristic of microfilaments, also extended along the side of the mitochondrion toward the center of the swelling (Fig. 4C, small arrows; supplemental Fig. 1, available at www.jneurosci.org as supplemental material). Microtubules (diameter 25 ± 2 nm, n = 60) were positioned along the lateral surface of the mitochondrion at low density (Figs. 3A–C and 4A–C, large horizontal arrows; Fig. 5B,C,G,H, blue tubular structures). These filaments and microtubules defined a largely synaptic vesicle-free layer along the lateral boundaries of the mitochondrion (Figs. 3A–C, 4C; asterisks in supplemental Fig. 1, available at www.jneurosci.org as supplemental material), although this space could be punctuated occasionally by the presence of small numbers of synaptic vesicles which were linked to the OMM by microfilaments (thin arrows pointed down and left at 45° in Fig. 4A,B and pointed down in supplemental Fig. 1, available at www.jneurosci.org as supplemental material). Three-dimensional rendering showed the vesicle free space along the OMM and the small number of vesicles that were linked to it via microfilaments (Fig. 5H). These findings were inconsistent with a role for MAC mitochondria as a physical substrate in vesicle mobilization. The rendering also showed the crossing orientation of microtubules (blue) adjacent to the mitochondria and micro and intermediate filaments (green) extending away from the MAC superstructure (Fig. 5B,C,G,H).
Vesicle-filled regions of the nerve terminal
The MAC superstructure and lateral cytoskeleton link to synaptic vesicles
Despite defining largely vesicle-free zones, the MAC cytoskeleton was linked into the dense population of synaptic vesicles located in the calyx. Linkages could extend obliquely from the MAC cytoskeleton over long distances (200 nm) to attach to synaptic vesicles positioned near the active zone (Fig. 3A, thin arrows at 45° angle). Shorter, lateral linkages also attached to synaptic vesicles immediately adjacent to the MAC. These nearby vesicle populations were associated with active zones, due to the proximity of MACs and synapses (Rowland et al., 2000). ET permitted accurate measurement of the distance between the puncta adherentia of MACs and active zones, which was 49 ± 41 nm (range 14–161 nm; n = 13). This short distance further suggests that sTEM images suggestive of a vesicular chain could have been confounded by synaptic vesicles near active zones and immediately adjacent to the MAC superstructure.
Tethers among synaptic vesicles (a subset rendered as yellow linkages in Fig. 5A) were a consistent feature of the synaptic vesicle population. These tethers varied in length from 8 nm, which was the approximate minimum spacing between vesicles, to 119 nm in length for distantly linked vesicles (32 ± 21 nm, n = 158). We investigated a population of 400 vesicles to determine the number of linkages per vesicle. All vesicles had at least one linkage, with an average of 2.8 ± 1.1 linkages per vesicle. The linkage system could create a beads-on-a-string appearance, extending away from the active zone toward the interior of the terminal (Fig. 6A,C, arrowheads; 6B is 3-D rendering of A). Due to the multiplicity of active zones in the calyx, we considered whether linkages formed between vesicle groups that were positioned over nearby active zones. Three-dimensional rendering of one tomographic reconstruction of four active zones (yellow patches in presynaptic membrane) and two MACs revealed that MACs, by excluding synaptic vesicles from the superstructure, could establish partial barriers between the vesicle populations associated with adjacent active zones. The arrows in Figure 6D point to the space occupied by the MAC superstructure, which was not rendered to better reveal the synaptic vesicle distribution. However, where vesicles filled the space between active zones (between the leftmost two and between the rightmost two active zones in Fig. 6D), we did not find breaks in vesicle linkage that partitioned the vesicle population. These data, then, reveal a general picture of nerve terminal organization whereby the MAC cytoskeleton (superstructure and lateral cytoskeleton) likely shares features with the nerve terminal core of microtubules and neurofilaments (Fig. 1B, asterisks) to restrict distribution of the synaptic vesicle pool. Vesicles, in turn, maintain their organization via a high degree of interconnectivity.
Figure 6.

Organization of synaptic vesicles relative to active zones. A, Vesicles linked into string emanating from active zone, captured fortuitously in single tomographic image plane. Connecting filaments indicated by arrowheads; connection from vesicle to active zone dense projection shown by arrowhead pointing upward. B, Rendering across image planes of vesicles in A reveals interconnecting linkages. C, Image from a different nerve terminal showing branch in vesicle string. D, Rendering of vesicle populations (light blue) near active zones (yellow). Four mitochondria (green) are aligned with presynaptic membrane, two of which form MACs within the tomographic volume (white arrows). Vesicle string in A emanates from left-most active zone. Arrows point to gaps in the vesicle population that are occupied by the MAC superstructure, which was not rendered so the vesicle distribution could be seen more clearly. Asterisk indicates location of multivesicular body, which also was not rendered. Images from different calyx swelling than shown in previous figures. Scale bar (in A), A, C, 100 nm.
Actin and tubulin have different spatial organization in the calyx
Although it is beyond the scope of even a single dedicated report to identify all the cytoskeletal constituents of the MAC superstructure, lateral cytoskeleton and vesicle pool, we pursued some basic questions about organelle and cytoskeletal arrangement raised by these tomographic images. ET images of mitochondrial clusters and microtubules defining vesicle-free domains, and synaptic vesicles emanating from the active zone and linked by microfilaments of variable length are consistent with actin, but not tubulin, distribution throughout the synaptic vesicle domain. More global views of organelle and protein distribution within the calyx elements are most efficiently obtained using light microscopy, because even the 3-D views afforded by ET are tedious to extend over such large tissue volumes. In the mouse calyx, actin is concentrated along the presynaptic membrane (Saitoh et al., 2001). Individual calyx compartments have greater volume in cats than rodents, so we focused upon the distributions of actin and tubulin relative to vesicle pool domains and mitochondria using fluorescent phalloidin labeling and immunofluorescence confocal microscopy.
Postsynaptic cell bodies and proximal dendrites were immunolabeled using a MAP2 antibody. Synaptic vesicle domains within calyces were labeled using an antibody mixture to vGlut1 and 2, and revealed large swellings and stalks that had unlabeled cores where synaptic vesicles were excluded (Fig. 7A, MAP2 and phalloidin, used to label actin filaments; B, same section as A but also showing vGlut). The presence of mitochondria and cytoskeletal elements in the core of swellings as revealed by EM (Fig. 1B) and ET explain the description of vesicle domains as “donut-like” in light microscopic images (Wimmer et al., 2006). Combined immunolabeling for synaptic vesicles and mitochondria (Cox1 antibody) revealed exclusive domains and confirmed positioning of mitochondria within the holes of the “donut-like” vesicle domains (Fig. 7E,F). Actin labeling was largely coextensive with vGlut immunolabeling, indicating that actin filaments were abundant in cat calyces and were intermixed with the vesicle population (insets in A depict calyx swelling boxed in B). In calyx stalks (a different MNTB cell is shown in Fig. 7C,D), vGlut labeling was densest along the presynaptic membrane, consistent with observations that the stalk regions away from the membrane contained axon cytoskeleton and few synaptic vesicles (Rowland et al., 2000). Tubulin immunolabeling was present in the calyx stalk, branches and swellings, except within the vesicle population along the presynaptic membrane (Fig. 7C,D; inset in C shows region boxed in D). This pattern is consistent with our observations of microtubules in the axonal cytoskeleton extending along calyx stalks and through the core of calyx swellings and in vesicle-free regions within the MAC cytoskeleton.
Figure 7.
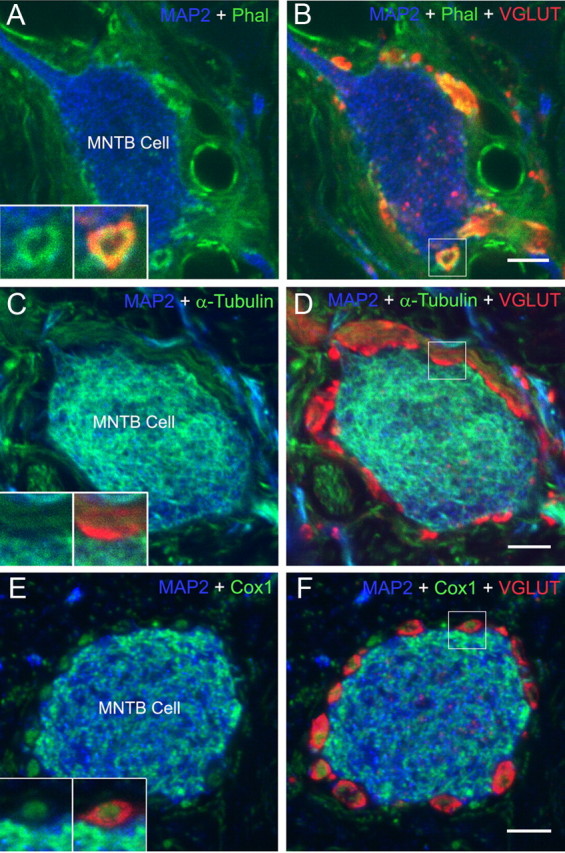
Distributions of actin and tubulin differ relative to synaptic vesicles. A, B, Fluorescence images of MNTB cell (blue, MAP2 immunolabeling), innervated by a calyx that was localized using a synaptic vesicle marker (red, VGLUT1 and 2 immunolabeling). Actin was revealed by binding to fluorescent phalloidin (green). Calyx swellings and stalks showed regions that exclude synaptic vesicles (boxed terminal in B). Matching these areas (insets in A show boxed terminal in B) showed intermingling of actin with synaptic vesicles. C, D, Tubulin (green) was distributed through the cytoskeletal core of calyx stalks, branches and large swellings, and excluded from the region of highest concentration of synaptic vesicles nearest the presynaptic membrane (inset in C). E, F, Mitochondria (green, Cox1 immunolabeling) were located in the core of calyx swellings in areas that excluded synaptic vesicles (red). Higher magnification of swelling boxed in F is shown as insets to E. Scale bar, 10 μm.
Discussion
The increased spatial resolution of ET relative to serial section sTEM offered new perspectives on the global organization of a well studied central nerve terminal based upon the high-resolution depiction of its constituent organelles and cytoskeleton. We revealed that mitochondria anchored near active zones were organized for high-rate metabolism and efficient communication between their interior and the cytosol near the presynaptic membrane. A cytoskeletal superstructure anchors the mitochondrion to a punctum adherens, yet other cytoskeletal elements, such as microtubules and intermediate filaments along the lateral OMM, may mediate translocation and fine positioning of the mitochondrion. We also revealed that these structures were components of a pervasive cytoskeleton whose elements both exclude and interlink synaptic vesicle populations and could restrict vesicle access to subsets of active zones.
Polarized crista structure in MAC mitochondria
Crista/OMM surface area
We showed that MAC mitochondria had a higher density of crista membrane, and by implication a higher metabolic capacity, relative to most other neural and non–neural mitochondria. Measurements of crista surface area are less sensitive to chemical fixation artifacts than crista volume, which can be affected by crista intermembrane distance, as shown by comparing two common modes of tissue preparation, chemical fixation and cryofixation (Perkins et al., 1998; Sosinsky et al., 2008). Although the dynamic properties of crista structure are increasingly appreciated (Mannella et al., 2001), crista organization in MAC mitochondria may be relatively stable, given its similarity among all specimens we examined and the consistent high rate of neural activity in these neurons both in the presence and absence of sound (Spirou et al., 1990).
Polarized structure—ATP synthesis
Asymmetry in crista junction density facing toward compared with away from the presynaptic membrane is superimposed on structural polarization due to the lamellar organization of cristae, whereby no crista junctions occurred along the lateral membrane of the mitochondrion. Crista junctions are hypothesized to limit movement of enzymatic substrates into the cristae and regulate ATP-synthesizing capability on the IMM (Perkins et al., 1997a; Mannella et al., 2001; Vogel et al., 2006). We suggest that crista junction polarization is a general characteristic of anchored mitochondria in nerve terminals, other neural compartments and other cell types. This is the first description of an organelle subcomponent, the crista junction, oriented with the polarized structure of a cell, defined by the anchoring cytoskeleton and presynaptic membrane. The density of crista junctions in MAC mitochondria exceeded that measured from other brain regions. Energy usage by neurons scales with the number of vesicles released per action potential and firing rate (Attwell and Laughlin, 2001), which for calyx-forming neurons can exceed 100 Hz in the absence of sound and 400 Hz in response to sound (Spirou et al., 1990; Joris et al., 1994). Therefore, crista junction density and the crista/OMM ratio may be highest for mitochondria nearest the active zone, but may also adapt to ambient activity rates across types of nerve terminals.
The necessity for mitochondrial-generated ATP in vesicle recycling and mobilization during high- but not low-rate neurotransmission is supported by Drosophila mutants that limit mitochondrial transport to nerve terminals (Stowers et al., 2002; Guo et al., 2005; Verstreken et al., 2005; Rikhy et al., 2007). Indeed, a positive correlation has been noted in some systems between the mitochondrial content of nerve terminals and levels of synaptic activity (Nguyen et al., 1997; Brodin et al., 1999). ATP is rapidly diffusible (Yoshizaki et al., 1990), so polarization of mitochondria may not be important for its delivery into particular cellular compartments to support the synaptic vesicle life cycle. The calyx of Held sustains high activity rates, which may be supported by the many mitochondria located in the core of terminal swellings and stalks. The MAC superstructure, however, may contain proteins that have phosphorylation-dependent function and therefore may be a direct target for ATP delivery via crista junctions. This proposed property could involve the MAC in phosphorylation-dependent cell-cell signaling via the punctum adherens.
Polarized structure—Ca2+ buffering
Mitochondria also affect the dynamics of synaptic transmission through modulation of Ca2+ levels. Drosophila mutants with reduced numbers of mitochondria exhibit an increased buildup of Ca2+ during stimulus trains (Guo et al., 2005; Verstreken et al., 2005). In the calyx, mitochondrial buffering of Ca2+ affects short-term plasticity and vesicle release probability (Billups and Forsythe, 2002; Lee et al., 2008), but Ca2+ buffering proteins such as calmodulin also affect short-term responses such as recovery from synaptic depression (Sakaba and Neher, 2001). Ca2+ transients in the calyx can reach 10 μm and must be modulated rapidly (Bollmann et al., 2000; Schneggenburger and Neher, 2000). The polarization of crista structure and lack of interconnections between lamellar cristae may facilitate rapid entry of Ca2+ into and diffusion along cristae of mitochondria nearest the active zone, in line with our original conjecture (Rowland et al., 2000). Lamellar cristae imply lamellar matrix structure, which could also provide a conduit for diffusion to support rapid buffering of Ca2+ in the cytosolic volume near the presynaptic membrane. Ca2+ uptake into mitochondria stimulates ATP production (Denton and McCormack, 1980), and one function of ATP is to fuel plasmalemma pumps that extrude Ca2+. Mitochondria near the active zone, then, may calibrate their high metabolic capacity by efficiently sensing, due to their structural polarization, increased Ca2+ levels during neural activity.
Nerve terminal cytoskeleton
The MAC cytoskeleton
ET revealed the MAC superstructure, anchoring the mitochondrion to the presynaptic membrane via a complex arrangement of filaments and microtubules and attached by microfilaments directly to the OMM region of highest crista junction density. Our suggestion that the superstructure provides a scaffold for cell signaling pathways implies an influence on oxidative metabolism, consistent with descriptions of phosphorylation sites on electron transport enzymes (Hüttemann et al., 2007). Because the other end of the superstructure is an adhering junction, identification of the anchoring cytoskeleton opens new areas of investigation into nonsynaptic intercellular signaling that regulates metabolic activity and synaptic communication.
A lateral cytoskeleton of intermediate and microfilaments extended from the superstructure alongside the mitochondrion and across microtubules. Mitochondria are moved within neurons primarily on microtubule tracks with linking proteins such as kinesins and syntaphilin (Kang et al., 2008), so the lateral cytoskeleton likely consists of transport machinery for local or fine-tuned positioning. The MAC cytoskeleton, then, provides a template to identify proteins that move and park mitochondria at locations of high metabolic demand, including active zones in boutons that are visited by motile mitochondria.
Vesicle populations and movement
Filamentous attachments to synaptic vesicles of a roughly constant 30–50 nm length were noted initially in deep-etch frozen tissue from neuromuscular junction (Hirokawa et al., 1989; Gotow et al., 1991). Immuno-EM and biochemical evidence reveals synapsin I to be these short filaments (Hirokawa et al., 1989; Benfenati et al., 1993). ET of nerve terminals in synapsin knock-out mice shows a reduced number of vesicles and filaments (Siksou et al., 2007) indicating that other proteins can form these filaments. Microfilaments of variable length could be actin, a prominent cytoskeletal element in nerve terminals with unresolved functions in vesicle mobilization (Doussau and Augustine, 2000). In the calyx of Held, dispersion of actin microfilaments delays recovery from synaptic depression (Sakaba and Neher, 2003). Consistent with this observation, we showed phalloidin labeling to be coextensive with vGlut immunolabeling, indicating that actin filaments are interspersed with synaptic vesicle domains in the calyx.
A microfilament meshwork does not seem ideally suited for vesicle translocation to the active zone. Linkages from the active zone were the beginning point for strings of up to 15 vesicles, each of which was linked laterally to other vesicles (Fig. 6A–C). In the neuromuscular junction, microtubules form tracks linked to vesicles (Hirokawa et al., 1989) and shuttling of vesicles, perhaps bound directly to myosin and moving along actin filaments, is ATP-dependent (Prekeris and Terrian, 1997; Verstreken et al., 2005). Microtubules were not oriented similarly in the calyx of Held. Recovery from depression in the calyx is an ATP-dependent process (Sakaba and Neher, 2003), but myosin may function primarily near the active zone to increase the size of the readily releasable vesicle pool (Srinivasan et al., 2008).
3-D reconstruction of a rat calyx reveals that nearly one-half of synaptic vesicles are located within 200 nm of an active zone (Sätzler et al., 2002). Using ET we showed that vesicle populations were interlinked by microfilaments between adjacent active zones, but could be separated from one another by intervening MACs and their cytoskeleton. Heterogeneous release probability in the calyx may stem from variation in Ca2+ sensitivity by individual vesicles or among active zones (Wölfel et al., 2007) and unequal invasion of action potentials into all calyx compartments due to its complex electrotonic structure (Spirou et al., 2008). We suggest that the physical separation of vesicles into pools of differing size among active zones in the same calyx swelling is another mechanism to vary release probability among active zones during a dynamic stimulus.
Prevalence of anchored mitochondria in nerve terminals
As summarized in the introduction, a large number of nerve terminals throughout the brain likely contain a subset of mitochondria that take up calibrated positions near the presynaptic membrane, especially in proximity to a punctum adherens. A gradient of organization of these structures may exist across types of terminals, with varying numbers of mitochondria and complexity of cytoskeletal and membranous elements interposed between the mitochondrion and presynaptic membrane. We propose that further application of high-resolution techniques will reveal similarities in mitochondrion-anchoring protein complexes among an increasingly diverse list of neural territories, including locations where motile mitochondria park transiently in bouton terminals. We also propose that anchored mitochondria, as a general principle, exhibit structural polarization toward the subcellular regions tied to their function. Clues to these cellular processes will be found in experimental dissection of the protein constituents of the MAC cytoskeleton. These elements will shed light on functions of the cytoskeleton linking the mitochondrion to the punctum adherens, including possible roles in communication between synaptic partners independent of synaptic transmission.
Footnotes
Supported by National Institutes of Health (NIH) Grants DC007695 to G.A.S., NIH/National Center for Research Resources (NCRR) Centers of Biomedical Research Excellence Grant P20 RR15574 to the Sensory Neuroscience Research Center (SNRC), and NIH/NCRR Grant P41 RR004050 to the National Center for Microscopy and Imaging Research. We thank Steve Lamont for providing software, Brian Pope for tissue processing, and A. Agmon and other colleagues at the SNRC and H. von Gersdorff for comments on this manuscript. Arrowsmith (http://arrowsmith.psych.uic.edu) was used for literature searches.
References
- Attwell D, Laughlin SB. An energy budget for signaling in the grey matter of the brain. J Cereb Blood Flow Metab. 2001;21:1133–1145. doi: 10.1097/00004647-200110000-00001. [DOI] [PubMed] [Google Scholar]
- Benfenati F, Valtorta F, Rossi MC, Onofri F, Sihra T, Greengard P. Interactions of synapsin I with phospholipids: possible role in synaptic vesicle clustering and in the maintenance of bilayer structures. J Cell Biol. 1993;123:1845–1855. doi: 10.1083/jcb.123.6.1845. [DOI] [PMC free article] [PubMed] [Google Scholar]
- Billups B, Forsythe ID. Presynaptic mitochondrial calcium sequestration influences transmission at mammalian central synapses. J Neurosci. 2002;22:5840–5847. doi: 10.1523/JNEUROSCI.22-14-05840.2002. [DOI] [PMC free article] [PubMed] [Google Scholar]
- Bollmann JH, Sakmann B, Borst JG. Calcium sensitivity of glutamate release in a calyx-type terminal. Science. 2000;289:953–957. doi: 10.1126/science.289.5481.953. [DOI] [PubMed] [Google Scholar]
- Brodin L, Bakeeva L, Shupliakov O. Presynaptic mitochondria and the temporal pattern of neurotransmitter release. Philos Trans R Soc Lond B Biol Sci. 1999;354:365–372. doi: 10.1098/rstb.1999.0388. [DOI] [PMC free article] [PubMed] [Google Scholar]
- Cant NB, Morest DK. The bushy cells in the anteroventral cochlear nucleus of the cat. A study with the electron microscope. Neuroscience. 1979;4:1925–1945. doi: 10.1016/0306-4522(79)90066-6. [DOI] [PubMed] [Google Scholar]
- Chang DT, Honick AS, Reynolds IJ. Mitochondrial trafficking to synapses in cultured primary cortical neurons. J Neurosci. 2006;26:7035–7045. doi: 10.1523/JNEUROSCI.1012-06.2006. [DOI] [PMC free article] [PubMed] [Google Scholar]
- Denton RM, McCormack JG. The role of calcium in the regulation of mitochondrial metabolism. Biochem Soc Trans. 1980;8:266–268. doi: 10.1042/bst0080266. [DOI] [PubMed] [Google Scholar]
- Doussau F, Augustine GJ. The actin cytoskeleton and neurotransmitter release: an overview. Biochimie. 2000;82:353–363. doi: 10.1016/s0300-9084(00)00217-0. [DOI] [PubMed] [Google Scholar]
- Frank J. Electron tomography. Ed. 2. New York: Plenum; 2006. [Google Scholar]
- Frey TG, Perkins GA, Ellisman MH. Electron tomography of membrane-bound cellular organelles. Annu Rev Biophys Biomol Struct. 2006;35:199–224. doi: 10.1146/annurev.biophys.35.040405.102039. [DOI] [PubMed] [Google Scholar]
- Gilkerson RW, Selker JM, Capaldi RA. The cristal membrane of mitochondria is the principal site of oxidative phosphorylation. FEBS Lett. 2003;546:355–358. doi: 10.1016/s0014-5793(03)00633-1. [DOI] [PubMed] [Google Scholar]
- Gotow T, Miyaguchi K, Hashimoto PH. Cytoplasmic architecture of the axon terminal: filamentous strands specifically associated with synaptic vesicles. Neuroscience. 1991;40:587–598. doi: 10.1016/0306-4522(91)90143-c. [DOI] [PubMed] [Google Scholar]
- Gray EG. Electron microscopy of presynaptic organelles of the spinal cord. J Anat. 1963;97:101–106. [PMC free article] [PubMed] [Google Scholar]
- Guo X, Macleod GT, Wellington A, Hu F, Panchumarthi S, Schoenfield M, Marin L, Charlton MP, Atwood HL, Zinsmaier KE. The GTPase dMiro is required for axonal transport of mitochondria to Drosophila synapses. Neuron. 2005;47:379–393. doi: 10.1016/j.neuron.2005.06.027. [DOI] [PubMed] [Google Scholar]
- Gustafsson JS, Birinyi A, Crum J, Ellisman M, Brodin L, Shupliakov O. Ultrastructural organization of lamprey reticulospinal synapses in three dimensions. J Comp Neurol. 2002;450:167–182. doi: 10.1002/cne.10310. [DOI] [PubMed] [Google Scholar]
- He L, Perkins GA, Poblenz AT, Harris JB, Hung M, Ellisman MH, Fox DA. Bcl-xL overexpression blocks bax-mediated mitochondrial contact site formation and apoptosis in rod photoreceptors of lead-exposed mice. Proc Natl Acad Sci U S A. 2003;100:1022–1027. doi: 10.1073/pnas.0333594100. [DOI] [PMC free article] [PubMed] [Google Scholar]
- Hirokawa N, Sobue K, Kanda K, Harada A, Yorifuji H. The cytoskeletal architecture of the presynaptic terminal and molecular structure of synapsin 1. J Cell Biol. 1989;108:111–126. doi: 10.1083/jcb.108.1.111. [DOI] [PMC free article] [PubMed] [Google Scholar]
- Hoffpauir BK, Pope BA, Spirou GA. Serial sectioning and electron microscopy of large tissue volumes for 3D analysis and reconstruction: a case study of the calyx of Held. Nat Protoc. 2007;2:9–22. doi: 10.1038/nprot.2007.9. [DOI] [PubMed] [Google Scholar]
- Hüttemann M, Lee I, Samavati L, Yu H, Doan JW. Regulation of mitochondrial oxidative phosphorylation through cell signaling. Biochim Biophys Acta. 2007;1773:1701–1720. doi: 10.1016/j.bbamcr.2007.10.001. [DOI] [PubMed] [Google Scholar]
- Johnson JE, Jr, Perkins GA, Giddabasappa A, Chaney S, Xiao W, White AD, Brown JM, Waggoner J, Ellisman MH, Fox DA. Spatiotemporal regulation of ATP and Ca2+ dynamics in vertebrate rod and cone ribbon synapses. Mol Vis. 2007;13:887–919. [PMC free article] [PubMed] [Google Scholar]
- Jonas EA, Buchanan J, Kaczmarek LK. Prolonged activation of mitochondrial conductances during synaptic transmission. Science. 1999;286:1347–1350. doi: 10.1126/science.286.5443.1347. [DOI] [PubMed] [Google Scholar]
- Joris PX, Smith PH, Yin TC. Enhancement of neural synchronization in the anteroventral cochlear nucleus. II. Responses in the tuning curve tail. J Neurophysiol. 1994;71:1037–1051. doi: 10.1152/jn.1994.71.3.1037. [DOI] [PubMed] [Google Scholar]
- Ju WK, Liu Q, Kim KY, Crowston JG, Lindsey JD, Agarwal N, Ellisman MH, Perkins GA, Weinreb RN. Elevated hydrostatic pressure triggers mitochondrial fission and decreases cellular ATP in differentiated RGC-5 cells. Invest Ophthalmol Vis Sci. 2007;48:2145–2151. doi: 10.1167/iovs.06-0573. [DOI] [PubMed] [Google Scholar]
- Ju WK, Kim KY, Lindsey JD, Angert M, Duong-Polk KX, Scott RT, Kim JJ, Kukhmazov I, Ellisman MH, Perkins GA, Weinreb RN. Intraocular pressure elevation induces mitochondrial fission and triggers OPA1 release in glaucomatous optic nerve. Invest Ophthalmol Vis Sci. 2008;49:4903–4911. doi: 10.1167/iovs.07-1661. [DOI] [PMC free article] [PubMed] [Google Scholar]
- Kang JS, Tian JH, Pan PY, Zald P, Li C, Deng C, Sheng ZH. Docking of axonal mitochondria by syntaphilin controls their mobility and affects short-term facilitation. Cell. 2008;132:137–148. doi: 10.1016/j.cell.2007.11.024. [DOI] [PMC free article] [PubMed] [Google Scholar]
- Kimura RS, Bongiorno CL, Iverson NA. Synapses and ephapses in the spiral ganglion. Acta Otolaryngol Suppl. 1987;438:1–18. [PubMed] [Google Scholar]
- Kremer JR, Mastronarde DN, McIntosh JR. Computer visualization of three-dimensional image data using IMOD. J Struct Biol. 1996;116:71–76. doi: 10.1006/jsbi.1996.0013. [DOI] [PubMed] [Google Scholar]
- Landis DM, Hall AK, Weinstein LA, Reese TS. The organization of cytoplasm at the presynaptic active zone of a central nervous system synapse. Neuron. 1988;1:201–209. doi: 10.1016/0896-6273(88)90140-7. [DOI] [PubMed] [Google Scholar]
- Lawrence A, Bouwer JC, Perkins G, Ellisman MH. Transform-based backprojection for volume reconstruction of large format electron microscope tilt series. J Struct Biol. 2006;154:144–167. doi: 10.1016/j.jsb.2005.12.012. [DOI] [PubMed] [Google Scholar]
- Lee JS, Kim MH, Ho WK, Lee SH. Presynaptic release probability and readily releasable pool size are regulated by two independent mechanisms during posttetanic potentiation at the calyx of Held synapse. J Neurosci. 2008;28:7945–7953. doi: 10.1523/JNEUROSCI.2165-08.2008. [DOI] [PMC free article] [PubMed] [Google Scholar]
- Lieberman AR, Spacek J. Filamentous contacts: the ultrastructure and three-dimensional organization of specialized non-synaptic interneuronal appositions in thalamic relay nuclei. Cell Tissue Res. 1997;288:43–57. doi: 10.1007/s004410050791. [DOI] [PubMed] [Google Scholar]
- Mannella CA, Marko M, Penczek P, Barnard D, Frank J. The internal compartmentation of rat-liver mitochondria: tomographic study using the high-voltage transmission electron microscope. Microsc Res Tech. 1994;27:278–283. doi: 10.1002/jemt.1070270403. [DOI] [PubMed] [Google Scholar]
- Mannella CA, Marko M, Buttle K. Reconsidering mitochondrial structure: new views of an old organelle. Trends Biochem Sci. 1997;22:37–38. doi: 10.1016/s0968-0004(96)30050-9. [DOI] [PubMed] [Google Scholar]
- Mannella CA, Pfeiffer DR, Bradshaw PC, Moraru II, Slepchenko B, Loew LM, Hsieh CE, Buttle K, Marko M. Topology of the mitochondrial inner membrane: dynamics and bioenergetic implications. IUBMB Life. 2001;52:93–100. doi: 10.1080/15216540152845885. [DOI] [PubMed] [Google Scholar]
- Nguyen PV, Marin L, Atwood HL. Synaptic physiology and mitochondrial function in crayfish tonic and phasic motor neurons. J Neurophysiol. 1997;78:281–294. doi: 10.1152/jn.1997.78.1.281. [DOI] [PubMed] [Google Scholar]
- Perkins G, Renken C, Martone ME, Young SJ, Ellisman M, Frey T. Electron tomography of neuronal mitochondria: three-dimensional structure and organization of cristae and membrane contacts. J Struct Biol. 1997a;119:260–272. doi: 10.1006/jsbi.1997.3885. [DOI] [PubMed] [Google Scholar]
- Perkins GA, Renken CW, Song JY, Frey TG, Young SJ, Lamont S, Martone ME, Lindsey S, Ellisman MH. Electron tomography of large, multicomponent biological structures. J Struct Biol. 1997b;120:219–227. doi: 10.1006/jsbi.1997.3920. [DOI] [PubMed] [Google Scholar]
- Perkins GA, Song JY, Tarsa L, Deerinck TJ, Ellisman MH, Frey TG. Electron tomography of mitochondria from brown adipocytes reveals crista junctions. J Bioenerg Biomembr. 1998;30:431–442. doi: 10.1023/a:1020586012561. [DOI] [PubMed] [Google Scholar]
- Perkins GA, Renken CW, Frey TG, Ellisman MH. Membrane architecture of mitochondria in neurons of the central nervous system. J Neurosci Res. 2001;66:857–865. doi: 10.1002/jnr.10050. [DOI] [PubMed] [Google Scholar]
- Perkins GA, Ellisman MH, Fox DA. Three-dimensional analysis of mouse rod and cone mitochondrial cristae architecture: bioenergetic and functional implications. Mol Vis. 2003;9:60–73. [PubMed] [Google Scholar]
- Peters A, Palay SL, Webster Hd. The fine structure of the nervous system. New York: Oxford UP; 1991. [Google Scholar]
- Prekeris R, Terrian DM. Brain myosin V is a synaptic vesicle-associated motor protein: evidence for a Ca2+-dependent interaction with the synaptobrevin-synaptophysin complex. J Cell Biol. 1997;137:1589–1601. doi: 10.1083/jcb.137.7.1589. [DOI] [PMC free article] [PubMed] [Google Scholar]
- Renken C, Siragusa G, Perkins G, Washington L, Nulton J, Salamon P, Frey TG. A thermodynamic model describing the nature of the crista junction; a structural motif in the mitochondrion. J Struct Biol. 2002;138:137–144. doi: 10.1016/s1047-8477(02)00012-6. [DOI] [PubMed] [Google Scholar]
- Rikhy R, Kamat S, Ramagiri S, Sriram V, Krishnan KS. Mutations in dynamin-related protein result in gross changes in mitochondrial morphology and affect synaptic vesicle recycling at the Drosophila neuromuscular junction. Genes Brain Behav. 2007;6:42–53. doi: 10.1111/j.1601-183X.2006.00218.x. [DOI] [PubMed] [Google Scholar]
- Rowland KC, Irby NK, Spirou GA. Specialized synapse-associated structures within the calyx of Held. J Neurosci. 2000;20:9135–9144. doi: 10.1523/JNEUROSCI.20-24-09135.2000. [DOI] [PMC free article] [PubMed] [Google Scholar]
- Saitoh N, Hori T, Takahashi T. Activation of the epsilon isoform of protein kinase C in the mammalian nerve terminal. Proc Natl Acad Sci U S A. 2001;98:14017–14021. doi: 10.1073/pnas.241333598. [DOI] [PMC free article] [PubMed] [Google Scholar]
- Sakaba T, Neher E. Calmodulin mediates rapid recruitment of fast-releasing synaptic vesicles at a calyx-type synapse. Neuron. 2001;32:1119–1131. doi: 10.1016/s0896-6273(01)00543-8. [DOI] [PubMed] [Google Scholar]
- Sakaba T, Neher E. Involvement of actin polymerization in vesicle recruitment at the calyx of Held synapse. J Neurosci. 2003;23:837–846. doi: 10.1523/JNEUROSCI.23-03-00837.2003. [DOI] [PMC free article] [PubMed] [Google Scholar]
- Sätzler K, Söhl LF, Bollmann JH, Borst JG, Frotscher M, Sakmann B, Lübke JH. Three-dimensional reconstruction of a calyx of Held and its postsynaptic principal neuron in the medial nucleus of the trapezoid body. J Neurosci. 2002;22:10567–10579. doi: 10.1523/JNEUROSCI.22-24-10567.2002. [DOI] [PMC free article] [PubMed] [Google Scholar]
- Schneggenburger R, Forsythe ID. The calyx of Held. Cell Tissue Res. 2006;326:311–337. doi: 10.1007/s00441-006-0272-7. [DOI] [PubMed] [Google Scholar]
- Schneggenburger R, Neher E. Intracellular calcium dependence of transmitter release rates at a fast central synapse. Nature. 2000;406:889–893. doi: 10.1038/35022702. [DOI] [PubMed] [Google Scholar]
- Shepherd GM, Harris KM. Three-dimensional structure and composition of CA3-CA1 axons in rat hippocampal slices: implications for presynaptic connectivity and compartmentalization. J Neurosci. 1998;18:8300–8310. doi: 10.1523/JNEUROSCI.18-20-08300.1998. [DOI] [PMC free article] [PubMed] [Google Scholar]
- Siksou L, Rostaing P, Lechaire JP, Boudier T, Ohtsuka T, Fejtová A, Kao HT, Greengard P, Gundelfinger ED, Triller A, Marty S. Three-dimensional architecture of presynaptic terminal cytomatrix. J Neurosci. 2007;27:6868–6877. doi: 10.1523/JNEUROSCI.1773-07.2007. [DOI] [PMC free article] [PubMed] [Google Scholar]
- Sosinsky GE, Crum J, Jones YZ, Lanman J, Smarr B, Terada M, Martone ME, Deerinck TJ, Johnson JE, Ellisman MH. The combination of chemical fixation procedures with high pressure freezing and freeze substitution preserves highly labile tissue ultrastructure for electron tomography applications. J Struct Biol. 2008;161:359–371. doi: 10.1016/j.jsb.2007.09.002. [DOI] [PMC free article] [PubMed] [Google Scholar]
- Spacek J, Harris KM. Three-dimensional organization of cell adhesion junctions at synapses and dendritic spines in area CA1 of the rat hippocampus. J Comp Neurol. 1998;393:58–68. doi: 10.1002/(sici)1096-9861(19980330)393:1<58::aid-cne6>3.0.co;2-p. [DOI] [PubMed] [Google Scholar]
- Spirou GA, Brownell WE, Zidanic M. Recordings from cat trapezoid body and HRP labeling of globular bushy cell axons. J Neurophysiol. 1990;63:1169–1190. doi: 10.1152/jn.1990.63.5.1169. [DOI] [PubMed] [Google Scholar]
- Spirou GA, Rowland KC, Berrebi AS. Ultrastructure of neurons and large synaptic terminals in the lateral nucleus of the trapezoid body of the cat. J Comp Neurol. 1998;398:257–272. doi: 10.1002/(sici)1096-9861(19980824)398:2<257::aid-cne7>3.0.co;2-#. [DOI] [PubMed] [Google Scholar]
- Spirou GA, Chirila FV, von Gersdorff H, Manis PB. Heterogeneous Ca2+ influx along the adult calyx of held: a structural and computational study. Neuroscience. 2008;154:171–185. doi: 10.1016/j.neuroscience.2008.04.002. [DOI] [PMC free article] [PubMed] [Google Scholar]
- Srinivasan G, Kim JH, von Gersdorff H. The pool of fast releasing vesicles is augmented by myosin light chain kinase inhibition at the calyx of Held synapse. J Neurophysiol. 2008;99:1810–1824. doi: 10.1152/jn.00949.2007. [DOI] [PubMed] [Google Scholar]
- Stowers RS, Megeath LJ, Górska-Andrzejak J, Meinertzhagen IA, Schwarz TL. Axonal transport of mitochondria to synapses depends on milton, a novel Drosophila protein. Neuron. 2002;36:1063–1077. doi: 10.1016/s0896-6273(02)01094-2. [DOI] [PubMed] [Google Scholar]
- Tang Y, Zucker RS. Mitochondrial involvement in post-tetanic potentiation of synaptic transmission. Neuron. 1997;18:483–491. doi: 10.1016/s0896-6273(00)81248-9. [DOI] [PubMed] [Google Scholar]
- Thiers FA, Burgess BJ, Nadol JB., Jr Prevalence and ultrastructural morphology of axosomatic synapses on spiral ganglion cells in humans of different ages. Hear Res. 2000;150:119–131. doi: 10.1016/s0378-5955(00)00193-3. [DOI] [PubMed] [Google Scholar]
- Thiers FA, Burgess BJ, Nadol JB., Jr Axodendritic and dendrodendritic synapses within outer spiral bundles in a human. Hear Res. 2002;164:97–104. doi: 10.1016/s0378-5955(01)00414-2. [DOI] [PubMed] [Google Scholar]
- Tolbert LP, Morest DK. The neuronal architecture of the anteroventral cochlear nucleus of the cat in the region of the cochlear nerve root: electron microscopy. Neuroscience. 1982;7:3053–3067. doi: 10.1016/0306-4522(82)90229-9. [DOI] [PubMed] [Google Scholar]
- Verstreken P, Ly CV, Venken KJ, Koh TW, Zhou Y, Bellen HJ. Synaptic mitochondria are critical for mobilization of reserve pool vesicles at Drosophila neuromuscular junctions. Neuron. 2005;47:365–378. doi: 10.1016/j.neuron.2005.06.018. [DOI] [PubMed] [Google Scholar]
- Vogel F, Bornhövd C, Neupert W, Reichert AS. Dynamic subcompartmentalization of the mitochondrial inner membrane. J Cell Biol. 2006;175:237–247. doi: 10.1083/jcb.200605138. [DOI] [PMC free article] [PubMed] [Google Scholar]
- Wimmer VC, Horstmann H, Groh A, Kuner T. Donut-like topology of synaptic vesicles with a central cluster of mitochondria wrapped into membrane protrusions: a novel structure–function module of the adult calyx of Held. J Neurosci. 2006;26:109–116. doi: 10.1523/JNEUROSCI.3268-05.2006. [DOI] [PMC free article] [PubMed] [Google Scholar]
- Wölfel M, Lou X, Schneggenburger R. A mechanism intrinsic to the vesicle fusion machinery determines fast and slow transmitter release at a large CNS synapse. J Neurosci. 2007;27:3198–3210. doi: 10.1523/JNEUROSCI.4471-06.2007. [DOI] [PMC free article] [PubMed] [Google Scholar]
- Yamaguchi R, Lartigue L, Perkins G, Scott RT, Dixit A, Kushnareva Y, Kuwana T, Ellisman MH, Newmeyer DD. Opa1-mediated cristae opening is Bax/Bak and BH3 dependent, required for apoptosis, and independent of Bak oligomerization. Mol Cell. 2008;31:557–569. doi: 10.1016/j.molcel.2008.07.010. [DOI] [PMC free article] [PubMed] [Google Scholar]
- Yoshizaki K, Watari H, Radda GK. Role of phosphocreatine in energy transport in skeletal muscle of bullfrog studied by 31P-NMR. Biochim Biophys Acta. 1990;1051:144–150. doi: 10.1016/0167-4889(90)90186-h. [DOI] [PubMed] [Google Scholar]