

Abstract
Objective
To test the hypothesis that obesity resulting from deletion of the leptin gene or leptin receptor gene results in increased knee osteoarthritis, systemic inflammation, and altered subchondral bone morphology.
Methods
We studied leptin deficient (ob/ob) and leptin receptor deficient (db/db) female mice compared to wild-type animals to document knee osteoarthritis via histopathology. Serum pro- and anti-inflammatory cytokines were measured using a multiplex bead immunoassay. Cortical and trabecular subchondral bone changes were documented by micro-computed tomography, and body composition was quantified by dual-energy X-ray absorptiometry.
Results
Adiposity was increased by approximately 10-fold in ob/ob and db/db mice compared to controls, but it was not associated with increased incidence of knee osteoarthritis. Serum cytokine levels also were unchanged in ob/ob and db/db mice relative to controls, except for KC (murine analog of interleukin 8), which was elevated. Leptin impairment was associated with reduced subchondral bone thickness and increased relative trabecular bone volume in the tibial epiphysis.
Conclusion
Extreme obesity due to impaired leptin signaling induced alterations in subchondral bone morphology without increased incidence of knee osteoarthritis. Systemic inflammatory cytokine levels remained largely unchanged in ob/ob and db/db mice. These findings suggest that body fat, in and of itself, may not be a risk factor for joint degeneration as adiposity in the absence of leptin signaling is insufficient to induce systemic inflammation and knee osteoarthritis in female C57BL/6J mice. The results imply a pleiotropic role for leptin in the development of osteoarthritis by regulating both the skeletal and immune systems.
INTRODUCTION
Obesity is a primary risk factor for osteoarthritis; however, there is currently no comprehensive explanation for why obesity increases the risk of OA at sites throughout the body. Most hypotheses focus on mechanical factors because the risk of developing knee osteoarthritis increases with body weight (1). However, a systemic factor may be involved based on a portion of epidemiological studies showing that osteoarthritis at non-load bearing joints, such as the hand, is also associated with obesity, albeit to a lesser extent than the knee (2). Body fat itself may be the systemic mediator of an osteoarthritis outcome. Increasing evidence in support of this hypothesis comes from recent studies showing that adipose tissue is not simply an inert energy storage depot, but rather it is an active endocrine organ that secretes numerous cytokines and cytokine-like molecules termed adipokines. Excessive centrally located adipose tissue is implicated as a major source of pro-inflammatory adipokines due to the infiltration of activated macrophages associated with adipocyte necrosis (3). Consequently, obesity is now considered a mild, chronic inflammatory disease. In addition to mediating inflammation, adipokines regulate systemic metabolic, skeletal, and reproductive processes (4). One adipokine in particular, leptin, is known to influence all of these varied processes (5).
Leptin is a 16 kDa polypeptide hormone encoded by the obese (ob) gene (5). Leptin is primarily secreted by adipocytes, and it regulates adipose tissue mass and body weight by functioning as an afferent signal in a negative-feedback loop involving the hypothalamus (5). Mutations in either the ob gene, or the gene encoding the leptin receptor (i.e., the diabetes, or db, gene), result in severe obesity. Impaired leptin signaling also results in increased axial bone mass via a central mechanism involving a hypothalamic relay and neural outputs (6). The effect of leptin on bone is heterogeneous within the body; leptin knock-out mice have increased lumbar vertebral bone mass and decreased femoral bone mass (7). Leptin-mediated bone remodeling may be relevant to the development of osteoarthritis by inference from the known association of subchondral bone thickening and remodeling with progression of cartilage degeneration (8).
Perhaps the most intriguing link between leptin and the pathogenesis of osteoarthritis is leptin’s role in mediating inflammatory processes. For example, Otero and colleagues showed that co-stimulation of chondrocytes with leptin and interleukin-1 or interferon-γ increased expression of inducible nitric oxide synthase and produced a synergistic increase in nitric oxide production (9, 10). Nitric oxide mediates the effects of IL-1 on joint degradation by down-regulating matrix synthesis and up-regulating matrix metalloprotease (MMP) activity (11). Further evidence that leptin mediates catabolic processes comes from a study by Iliopoulos and colleagues, who showed that silencing leptin gene expression in severely arthritic cartilage reduced MMP-13 gene expression by half (12). Yet leptin has also been shown to exert anabolic effects in articular cartilage by stimulating the production of two growth factors—transforming growth factor-β and insulin-like growth factor (13). These findings are significant because both anabolic and catabolic activities of chondrocytes are upregulated with the development of osteoarthritis.
Given the well-established relationship between body mass index (BMI) and the risk of developing osteoarthritis, particularly for the knee (1, 2), the strong correlation between serum leptin concentration and body fat is consistent with a pro-degenerative role for leptin. Furthermore, with leptin concentrations in synovial fluid exceeding those in serum (14, 15), local souces of leptin production in the joint, or factors affecting leptin clearance, may be of particular importance in understanding how leptin affects joint health. Synovial fluid leptin concentrations were significantly correlated with BMI in people with severe osteoarthritis (13), and leptin gene expression was also significantly correlated with BMI in severely arthritic cartilage (15). Moreover, women were found to have higher concentrations of free leptin in the joint when compared to men of similar age and BMI (14), which is consistent with the observation that women are more likely to develop osteoarthritis as they age.
These studies support a role for leptin as a metabolic link between obesity and altered articular cartilage metabolism. While there is strong evidence that obesity induced by a high-fat diet in C57BL mice accelerates osteoarthritis (16–19), it is not known if impaired leptin signaling in vivo alters the development of spontaneous age-dependent degenerative changes in the joints of mice. Both leptin deficient (ob/ob) and leptin receptor deficient (db/db) mice develop morbid obesity, providing models in which to examine the relationships among leptin signaling, obesity, and osteoarthritis. While obesity is a strong risk factor for osteoarthritis, the pro-inflammatory effects of leptin and its effects on bone mass suggest that impaired leptin signaling may mitigate joint degeneration. To address these questions, we characterized the degenerative changes in the knee joint, quantified the epiphyseal bone structure, and measured serum cytokine levels in female ob/ob, db/db, and C57BL/6 wild-type (WT) control mice.
MATERIALS AND METHODS
Animals
Female WT (C57BL/6J, n=15), ob/ob (B6.V-Lepob/J, n=6), ob/+ (B6.V-Lepob/+, n=5) and db/db (B6.Cg-m +/+ Leprdb/J, n=5) mice were purchased from the Jackson Laboratories and housed in the Duke University Vivarium. Mice were housed in groups of 2–4 per cage, and were kept on a 12h light:dark cycle with unlimited access to food and water for the duration of the study. At 10–12 months of age, mice were anesthetized (pentobarbital: 60 mg/kg, IP) and scanned for body composition analysis (see following section). At this time, blood was collected for serum cytokine analysis resulting in exsanguination. Death was confirmed via a thoracotamy. Following death, limbs were dissected and immediately frozen in phosphate-buffered saline. All procedures were performed in accordance with a protocol approved by the Duke University Institutional Animal Care and Use Committee (IACUC).
Body composition
Lean body mass and body fat content were measured in mice using a dual-energy X-ray absorptiometry system (PIXImus2 DEXA, Faxitron X-ray Corp.). Percent body fat was measured as body fat content, excluding the head, divided by total body mass.
Histological Analysis
Knee joints were thawed and fixed in 10% buffered formalin for micro-CT evaluation (see next section). Following micro-CT evaluation, intact knee joints were decalcified, dehydrated, and embedded in paraffin. Serial sagittal 6 μm sections were collected throughout the medial and lateral condyles. Sections were stained with hematoxylin, fast green, and Safranin-O, and sections in the tibio-femoral cartilage-cartilage contact region from the medial and lateral condyles were scored for degenerative changes using a modified Mankin scoring system (20). Briefly, this scoring system included changes in articular cartilage structure [0–11], Safranin-O staining [0–8], tidemark duplication [0–3], fibrocartilage [0–2], chondrocyte clones in uncalcified cartilage [0–2], hypertrophic chondrocytes [0–2], and relative subchondral bone thickness [0–2] for a maximum score of 30 per location. Scores were determined by averaging values from 3–5 experienced, blinded graders for each of four locations in the joint: lateral femur, lateral tibia, medial femur, and medial tibia.
MicroCT Skeletal Analysis
To quantify the effects of impaired leptin signaling on knee joint skeletal morphology and material properties, joints from each mouse were scanned using a microCT system (microCT 40 and vivaCT, Scanco Medical AG, Basserdorf, Switzerland). A global thresholding procedure was used to segment calcified tissue from soft tissue. Linear attenuation values for the calcified tissue were scaled to bone density values (mg hydroxyapatite/cm3) using a hydroxyapatite calibration phantom. Morphometric parameters of fully calcified cortical and trabecular bone in the tibial epiphysis were determined using a direct 3-D approach in the region distal to the subchondral bone and proximal to the growth plate. The following parameters were determined for the tibial epiphysis: cortical bone volume (BVcort, cm3), total volume (TV, cm3), relative cortical bone volume (BVcort/TV), cortical bone density (mg hydroxyapatite/cm3), trabecular bone volume (BVtrab, cm3), total trabecular volume (TVtrab = TV − BVcort), relative trabecular bone volume (BVtrab/TVtrab), and trabecular bone density (mg hydroxyapatite/cm3). Subchondral thickness was determined by creating 2-D sagittal section images from the 3-D rendering of each joint. Images were taken at the mid-point of the medial and lateral calcified meniscus, which approximates the tibio-femoral cartilage-cartilage loading region. Images were imported into Image J (NIH), and subchondral thickness was measured by averaging 3 measurements in the central third of the subchondral region along the anterior-posterior direction. Thickness measurements were made for each of four locations in the joint: lateral femur, lateral tibia, medial femur, and medial tibia.
Serum Cytokine, Chemokine, and Biomarker Analysis
Blood was collected in anesthetized mice and dispensed into BD Vacutainer SST serum tubes (VWR #VT6514, Morrisville, NC). After approximately 30 minutes, the tubes were centrifuged for 15 minutes at 3500 rpm, and the serum was aliquoted into cryotubes for immediate storage at −80°C until analysis. Levels of serum leptin were quantified by a sandwich ELISA (Linco #EZML-82K) specific for the detection of mouse leptin. The minimum detectable concentration of leptin is reported as 0.05 ng/ml. Intra- and inter-assay coefficients of variation are 3% and 2.7%, respectively. The following cytokines and chemokines were measured in the serum using a multiplex bead immunoassay (Biosource), specific to mouse, with the Luminex 100 instrument: IL-1α, IL-1β, IL-2, IL-4, IL-6, IL-10, IL-12, IL-17, KC (mouse analog of IL-8), and tumor necrosis factor alpha (TNF-α). All samples were analyzed as recommended by the manufacturer. For samples that were below the level of detection, a number one-half the value of the lowest level of quantification was assigned for the purpose of performing statistical analyses. Levels of hyaluronic acid (HA) in the sera were quantified by a commercially available ELISA (Corgenix, Westminster, CO) that utilizes hyaluronic acid binding protein as a capture molecule. The HA molecule is universal, rather than species-specific, thus the assay accurately detects HA levels in non-human samples. The minimum detectable concentration of HA is reported as 10 ng/ml. The intra- and inter-assay coefficients of variation are 4.2% and 6.2%, respectively.
Statistical Analysis
A nested 2-level analysis of variance (ANOVA) was used to determine the statistical significance of differences in mean values due to either impaired leptin signaling (i.e., level 1: pooled ob/ob and db/db vs. WT) or strain (i.e., level 2: ob/ob vs. db/db). Cytokine data were log transformed to correct for non-normal distributions. Although a few other parameters were not normally distributed, re-analyses with the non-parametric Wilcoxon test did not alter the original ANOVA results. Statistical tests were performed using JMP 7.0 (SAS). All data are reported as mean ± SEM.
RESULTS
Body composition and joint histological changes in leptin-impaired mice
Disruption of leptin signaling resulted in more than a 3-fold increase in body mass and approximately 10-fold increase in body fat (Table 1). Heterozygote (ob/+) mice showed a smaller, 30–40%, increase in body mass and fat (Table 1). Increased adiposity was also observed in the bone marrow cavities of the distal femoral epiphysis and the proximal tibial epiphysis and metaphysis of leptin-impaired mice (Figure 1). Impaired leptin signaling did not, however, increase articular cartilage degeneration. There was no difference in either site-specific osteoarthritis scores (Figure 2) or in osteoarthritis scores summed together from each location to obtain a total average degenerative joint score per strain (WT: 18.5 ± 1.9, ob/ob: 19.5 ± 1.9, db/db: 14.9 ± 2.7; p = 0.67, impaired vs. intact). Analysis of the individual components of the modified Mankin scoring system showed that impaired leptin signaling did not affect cartilage structural changes (WT: 4.88 ± 0.80; ob/ob: 7.53 ± 1.02; db/db: 5.12 ± 0.78; p = 0.18 impaired vs. intact; site scores summed for maximum value of 44) or the loss of Safranin-O staining intensity (WT: 8.68 ± 1.58; ob/ob: 8.33 ± 1.04; db/db: 5.56 ± 1.64; p = 0.83 impaired vs. intact; site scores summed for maximum value of 32). However, two of the components of the modified Mankin osteoarthritis scoring system were different between WT and leptin-impaired mice: leptin-impaired mice had fewer hypertrophic chondrocytes (p < 0.04) and reduced subchondral bone thickness (p < 0.01). Site-specific osteoarthritis scores, total average scores, structural changes, and loss of safranin-O staining intensity did not differ between ob/+ and WT mice (data not shown). ob/+ mice, however, showed significantly less cartilage structural changes compared to ob/ob mice (ob/ob: 7.53 ± 1.02 vs. ob/+: 3.73 ± 0.54; p = 0.013).
Table 1.
Body mass and adiposity
| Leptin intact | Leptin impaired | Intact v. Impaired | |||
|---|---|---|---|---|---|
| WT (+/+) | ob/+ | ob/ob | db/db | ||
| Body mass (g) | 23.8 ± 0.8 | 32.8 ± 0.9# | 83.5 ± 2.4 | 73.8 ± 3.0‡ | ** |
| Body fat (g) | 4.0 ± 0.4 | 6.9 ± 0.4# | 43.4 ± 1.5 | 39.7 ± 2.7‡ | ** |
| Body fat (%) | 16.3 ± 1.0 | 21.0 ± 0.8# | 52.0 ± 0.6 | 53.6 ± 1.8 | ** |
| Peritoneal fat (g) | 0.5 ± 0.1 | 1.9 ± 0.2# | 3.2 ± 0.4 | 3.7 ± 0.4 | ** |
Values are presented as group means ± standard error of the mean.
p<0.05,
p<0.01.
P<0.05 for WT versus ob/+;
P<0.05 for ob/ob versus db/db; nested ANOVA.
Figure 1.
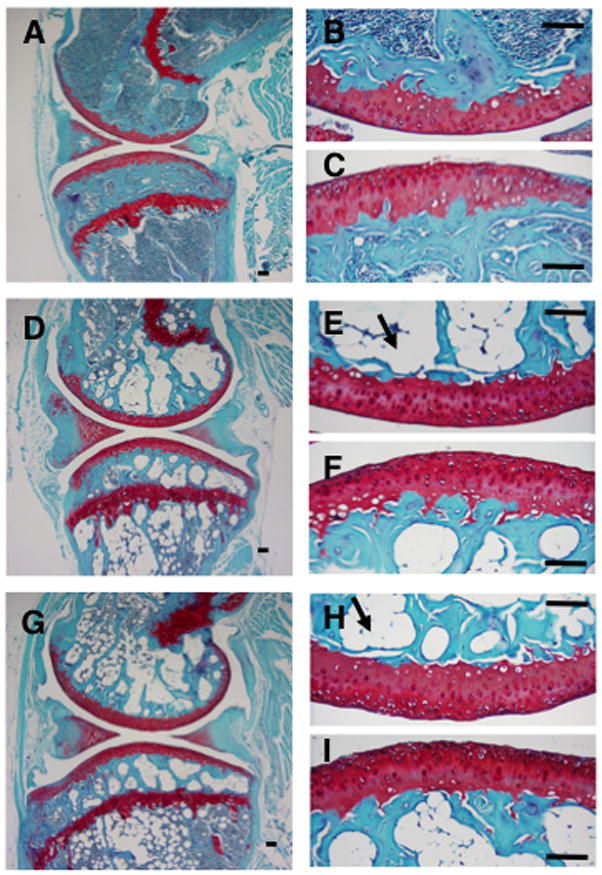
Histological sagittal sections of knee joints for 44-wk old WT (A, B, C), db/db (D, E, F), and ob/ob (G, H, I) female mice. Higher magnification images are of the central regions of the medial femoral condyle (B, E, H) and tibial plateau (C, F, I). Arrows show examples of lipid deposits in the inter-trabecular region of the epiphysis. Sections are stained with S afranin-O, fast green, and hematoxylin. Bars = 100 μm.
Figure 2.
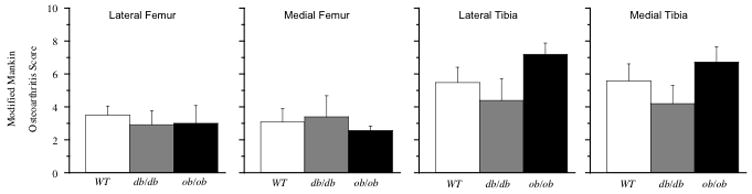
Modified Mankin score of histological changes in the articular cartilage by location in the knee joint of leptin intact (WT) and leptin-impaired (db/db, ob/ob) mice. Values = mean ± SEM.
Effect of impaired leptin signaling on joint skeletal morphology and bone mineral density
To determine how impaired leptin signaling affected skeletal joint structure, the subchondral bone region and tibial epiphysis were examined in detail. Subchondral bone thickness was generally reduced in ob/ob and db/db mice, with the greatest reductions occurring in the lateral compartment of the knee (Figure 3; lateral femur, p = 0.09; lateral tibia, p < 0.01). However, the overall relative cortical bone volume (BVcort/TV) in the tibial epiphysis was not significantly altered in ob/ob, ob/+, or db/db mice (Table 2). In contrast, the relative trabecular bone volume (BVtrab/TVtrab) in the tibial epiphysis was approximately 25% greater in ob/ob, db/db (Table 2) and ob/+ mice (0.54 ± 0.02). This finding is associated with a trend for increased BVtrab in leptin-impaired mice. Impaired leptin signaling was not associated with changes in subchondral cortical bone density or trabecular bone density in the tibial epiphysis (Table 2).
Figure 3.

Sub chondral bone thickness by location in the knee joint of leptin intact (WT) and leptin-impaired (db/db, ob/ob) mice. Values = mean ± SEM.
Table 2.
Tibial epiphysis cortical and trabecular bone volume and density
| Leptin intact | Leptin impaired | Intact v. impaired | ||
|---|---|---|---|---|
| WT (n=11) | ob/ob (n=6) | db/db (n=5) | ||
| Cortical Bone | ||||
| Bone volume, BVcort (cm3) | 0.20 ± 0.02 | 0.17 ± 0.03 | 0.20 ± 0.01 | NS, p = 0.56 |
| Total epiphyseal volume, TV (cm3) | 0.62 ± 0.06 | 0.58 ± 0.11 | 0.60 ± 0.03 | NS, p = 0.77 |
| Relative bone volume (BVcort/TV) | 0.33 ± 0.02 | 0.29 ± 0.01 | 0.33 ± 0.01 | NS, p = 0.41 |
| Bone density (mg hydroxyapatite/cm3) | 1118 ± 9 | 1074 ± 13 | 1102 ± 17 | NS, p = 0.06 |
| Trabecular bone | ||||
| Bone volume, BVtrab (cm3) | 0.17 ± 0.02 | 0.23 ± 0.04 | 0.22 ± 0.01 | NS, p = 0.09 |
| Total volume, (TVtrab = TV - BVcort) (cm3) | 0.42 ± 0.04 | 0.42 ± 0.08 | 0.41 ± 0.02 | NS, p = 0.93 |
| Relative bone volume (BVtrab/ TVtrab) | 0.43 ± 0.02 | 0.57 ± 0.03 | 0.53 ± 0.03 | ** p <0.001 |
| Bone density (mg hydroxyapatite/cm3) | 1039 ± 12 | 1020 ± 3 | 1036 ± 9 | NS, p = 0.34 |
Values are presented as group means ± standard error of the mean.
p<0.05,
p<0.01.
Serum cytokines and markers of cartilage degeneration
Consistent with their genotypes, serum leptin levels were significantly different among WT, ob/ob, and db/db mice, namely, low in ob/ob and high in db/db compared with control (Table 3). Of the seven pro-inflammatory cytokines measured in the serum, only KC was significantly different (p<0.05) between control and leptin-impaired mice, being about 2.8 fold greater in leptin-impaired mice (Table 3). There was also a trend for ob/ob and db/db mice to have lower levels of IL-2 compared to WT mice. Impaired leptin signaling had no significant effect on basal circulating levels of IL-1α, IL-1β, IL-6, IL-17, or TNF-α. However, IL-1α levels were significantly greater in db/db mice compared with ob/ob mice.
Table 3.
Serum concentrations of leptin, cytokines, and hyaluronic acid
| Leptin intact | Leptin impaired | Intact v. impaired | ||
|---|---|---|---|---|
| WT (n = 13) | ob/ob (n = 6) | db/db (n = 5) | P | |
| Leptin | 6.06 ± 1.31 | 1.02 ± 0.01 | 169.3 ± 32.9# | ** |
| Pro-inflammatory cytokines | ||||
| IL-1α | 979.4 ± 205.5 | 323.5 ± 61.7 | 1153.6 ± 329.1# | NS |
| IL-1β | 80.9 ± 49.8 | 82.7 ± 48.2 | 76.0 ± 67.9 | NS |
| IL-2 | 151.8 ± 77.0 | 6.0 ± 0.0 | 6.0 ± 0.0 | NS |
| IL-6 | 79.0 ± 37.4 | 6.1 ± 0.0 | 16.7 ± 10.6 | NS |
| IL-17 | 52.6 ± 35.7 | 9.3 ± 0.0 | 95.5 ± 53.1 | NS |
| KC | 243.5 ± 63.7 | 391.8 ± 45.7 | 524.9 ± 57.2 | * |
| TNF-α | 16.5 ± 1.7 | 14.8 ± 0.0 | 70.8 ± 56.0 | NS |
| Anti-inflammatory cytokines | ||||
| IL-4 | 9.4 ± 0.0 | 9.4 ± 0.0 | 21.3 ± 9.4# | NS |
| IL-10 | 91.5 ± 70.6 | 20.9 ± 0.0 | 20.9 ± 0.0 | NS |
| IL-12 | 278.0 ± 50.5 | 214.2 ± 54.6 | 229.9 ± 74.2 | NS |
| Biomarker | ||||
| Hyaluronic Acid (ng/ml) | 431.6 ± 43.8 | 327.5 ± 90.4 | 487.8 ± 283.1 | NS |
Data presented as mean ± standard error of the mean (pg/ml unless otherwise noted). Values below the lowest level of quantification (LLQ) were given a value of 0.5×LLQ. Statistical analyses conducted on log10 values to correct for non-normal distributions.
p<0.05,
p<0.01.
P<0.05 for ob/ob versus db/db comparison (nested ANOVA).
Of the three anti-inflammatory cytokines measured in the serum, there was a trend for IL-4 to be greater in leptin-impaired compared with controls (Table 3). This result was solely due to elevated levels of IL-4 in db/db mice compared to ob/ob mice (p < 0.05). There were no other leptin signaling or strain-related differences in anti-inflammatory cytokine levels.
In addition to measuring markers of inflammation, circulating levels of HA were measured as a biomarker of cartilage degradation. Serum levels of circulating HA did not differ between leptin-impaired mice and their controls or between the leptin-impaired ob/ob and db/db strains (Table 3). Furthermore, the values obtained in the present study were comparable to values for C57BL/6 mice (20) and were less than those for the intervention group, a trauma model of knee OA (546.8 ng/ml) (20). There were, however, moderate correlations between HA and degenerative changes occurring in the knee joint. These correlations were greatest for degenerative changes occurring in the lateral compartment. Lateral femur and tibia osteoarthritis score correlations with HA were rs = 0.49 and 0.45, p = 0.04 and 0.06, respectively (correlations calculated using the non-parametric Spearman’s ρ test).
DISCUSSION
Obesity is a significant risk factor for osteoarthritis in both weight-bearing and non-weight bearing joints (1, 2, 21). Here, we report that older mice lacking leptin signaling due to non-functional circulating leptin (ob/ob) or non-functional leptin receptors (db/db) develop extreme obese phenotypes without increased incidence of knee osteoarthritis. These findings suggest that body fat alone may not be a risk factor for joint degeneration, but rather, other local and systemic factors are responsible for the relationship between obesity and osteoarthritis. In weight-bearing joints, such as the knee, much progress has been made in identifying relationships among mechanical factors and osteoarthritis onset and progression (22, 23). Yet mechanical factors seem less likely to explain the increased risk of osteoarthritis in non-weight bearing joints, implicating the involvement of a systemic factor. Recent studies suggest that leptin may be that obesity-linked systemic factor because of leptin’s pro-inflammatory effects in cartilage and its elevated levels in osteoarthritic joints (9, 10, 12–15).
It is surprising that the incidence of knee osteoarthritis is unchanged in ob/ob and db/db mice given their dramatic obese phenotype—they weigh more than three times as much and have approximately 10-fold more body fat compared with age-matched controls (Table 1). Studies using diet-induced models of obesity show that feeding C57BL mice a high-fat diet increases the incidence of osteoarthritis in the knee despite a much less severe obese phenotype (16–19). Thus, given the severity of obesity in the leptin-impaired mice, it seems likely that both local (e.g., mechanical) and systemic (e.g., metabolic or inflammatory) factors would promote the development of knee osteoarthritis.
The fact that knee osteoarthritis is not increased is consistent with the interpretation that leptin influences the pathogenesis of knee osteoarthritis directly rather than being correlated with obesity. This interpretation is also supported by two additional observations. First, hyperphagia-induced obesity, which is caused by administration of aurothioglucose and results in reduces hypothalamic leptin signaling (24), does not increase the incidence of osteoarthritis (25). Second, we find that heterozygosity for the ob gene, which results in reduced plasma leptin concentrations, increased body mass, and increased fat mass compared to WT mice (Table 1) (26), does not increase knee osteoarthritis. Intriguingly, though, cartilage structural changes in ob/+ mice are reduced relative to ob/ob mice, suggesting that potential chondroprotective effects of reduced leptin signaling can be modified by other factors.
Discerning a direct role for leptin in the pathogenesis of osteoarthritis is difficult because non-specific disruption of leptin signaling produces phenotypes that may be primary, secondary, or tertiary to the interruption in brain and peripheral tissue signaling pathways that regulate energy homeostasis (27). Nevertheless, the resultant phenotype provides a model for interpreting the relationship between obesity-related pathologies and osteoarthritis with and without intact leptin signaling. Furthermore, the severity of weight gain in leptin-impaired mice may provide a model of altered joint loading associated with morbid obesity.
Body mass and body mass index are associated with changes in the magnitude and orientation of joint loading and the subsequent development of knee osteoarthritis in humans (22, 23, 28). We observed medial-lateral differences in subchondral bone thinning between leptin-impaired and leptin-intact mice—specifically decreased subchondral bone thickness in the lateral, but not medial, compartments in leptin-impaired mice. This pattern of an increased ratio of medial:lateral subchondral bone thickness in leptin-impaired mice (Figure 3) is consistent with observations in overweight humans (29) and may be related to altered joint loading patterns.
As in obese humans (30, 31), leptin-impaired mice load their joints less frequently and likely generate joint stresses that are much less than proportional to body weight compared to controls. The ob/ob mice have significantly reduced levels of spontaneous activity (32), and muscular forces, which contribute significantly to joint stresses, are likely reduced in ob/ob mice due to reduced skeletal muscle contractile dynamics and mass (33). Furthermore, their large abdominal fat deposits may unweight the limbs by providing significant bodyweight support (unpublished observations). It is not clear to what extent these changes in musculoskeletal loading affect the pathogenesis of osteoarthritis in leptin-impaired mice. A reduction in loading may seem to be protective; however, increased physical activity in mice and humans does not necessarily increase the incidence of osteoarthritis (34, 35).
We investigated the circulating serum levels of pro- and anti-inflammatory cytokines to determine how systemic inflammatory status was affected by excessive adiposity in ob/ob and db/db mice. Adipose tissue is a potent source of pro- and anti-inflammatory cytokine production (4), which may promote catabolic processes that link obesity with osteoarthritis (14, 36). Leptin-impaired mice, however, were not in a generalized inflammatory state, as indicated by comparable serum levels of pro-inflammatory cytokines in leptin-impaired and intact mice (Table 3). Only KC, a C-X-C chemokine and human IL-8 analog that functions as an inflammatory chemoattractant (37), was elevated in leptin-impaired mice. Furthermore, IL-2 was reduced in leptin-impaired mice, similar to that seen in obese humans (38). Additionally, impaired leptin signaling did not dramatically affect serum levels of anti-inflammatory cytokines, except for IL-4, which was elevated in db/db mice.
The lack of association between obesity and inflammation in ob/ob mice, while perhaps surprising given their extreme adiposity, is consonant with research showing that leptin deficiency modulates immune function (39). Leptin deficiency increases sensitivity to innate (i.e., monocyte/macrophage-activating) immune responses (40); whereas, it decreases sensitivity to acquired (i.e., T cell-mediated) immune response (41). These effects of leptin on the immune response have been demonstrated by two recent studies targeting innate versus acquired immune-mediated arthritis in ob/ob mice (42, 43). The overall similarity in serum cytokines levels and knee osteoarthritis scores in leptin-impaired and control mice is consistent with a hypothesized relationship between systemic inflammation and obesity-associated osteoarthritis. Future studies are needed to determine the relationship between systemic and local (i.e., intra-articular) inflammation.
Leptin may also mediate the development of osteoarthritis via central and peripheral mechanisms that regulate bone mass (6, 44). In ob/ob mice, leptin deficiency results in a mosaic bone mass phenotype with bone mass being increased in the axial skeleton and decreased in the appendicular skeleton (7). While the relationship linking altered bone remodeling to osteoarthritis is complex, being dependent on both osteoarthritis model and degree of disease progression (45), osteoarthritis is typically associated with increased subchondral bone mass (i.e., sclerosis) as well as osteophyte growth in the joint periphery. We found that leptin deficiency produced a mosaic bone phenotype in the joint with respect to subchondral cortical versus trabecular bone (Table 2).
Leptin-impaired mice showed regional subchondral bone thinning without changes in the overall relative cortical bone volume or density in the proximal tibial epiphysis. In contrast, the trabecular bone volume was increased in the proximal tibial epiphysis. Thus, unlike the femoral neck region in which there is reduced cortical bone thickness and trabecular bone volume (7), the proximal tibial epiphysis exhibits similarities with the lumbar vertebrae of ob/ob mice, manifesting increased trabecular bone volume and decreased subchondral cortical bone thickness relative to wild-type controls (7). The extent to which this phenotype is influenced by altered joint loading patterns is unknown. However, our observation that the relative trabecular bone volume is also increased in the tibial epiphysis of ob/+ mice, similar to that observed in vertebral bodies of ob/+ mice (6), supports a direct role for the involvement of leptin signaling in mediating trabecular bone morphology in the knee. Thus, leptin signaling appears to regulate both cortical and trabecular bone mass in ways that may be relevant to osteoarthritis pathogenesis.
Leptin may further regulate tissue mineralization is by targeting chondrocytes. In the growth plate, leptin is localized in prehypertrophic chondrocytes and the leptin receptor is localized in hypertrophic chondrocytes (44). Leptin deficiency, as observed in ob/ob mice, increases hypertrophic chondrocyte apoptosis and impairs endochondral ossification (44). In the current study, we observed that ob/ob and db/db mice had significantly fewer hypertrophic chondrocytes in the calcified cartilage of the tibia. Dumond et al. (13) has previously shown that rat articular chondrocytes express leptin receptors (Ob-Rb) and that injections of leptin into the knee joint increases the expression transforming growth factor β1, insulin-like growth factor 1, and leptin messenger RNA. These localized pro-anabolic effects of leptin, when considered in conjunction with the proposed inflammatory and pro-catabolic effects of leptin, are consistent with an overall increase in anabolic and catabolic activities of chondrocytes in osteoarthritis.
An additional way that leptin may mediate the etiology of osteoarthritis is via its actions on the reproductive system. Administration of leptin rescues infertility in ob/ob mice (46). Articular chondrocytes express functional estrogen receptors (47), and the concurrence of a spike in osteoarthritis onset with menopause has implicated an osteoarthritis-protective effect for estrogen in women. Many ovariectomy and estrogen treatment animal models also show a protective effect of estrogen on osteoarthritis pathogenesis (48). Although little is known about the interaction between leptin and estrogen in osteoarthritis, both ovariectomy and menopause precede increases in adiposity (49, 50) indicating that osteoarthritis associated with these low-estrogen transitions is also associated with increasing levels of leptin. Interestingly, ob/ob and db/db mice have low estrogen levels, impaired leptin signaling, and unaltered incidence of knee osteoarthritis.
There are several additional factors to consider in the interpretation of our findings. First, given the significant variation in susceptibility to obesity and osteoarthritis among different mouse strains, additional studies with leptin-impaired mice created on different backgrounds strains are needed to generalize the findings from this study. Furthermore, a high-fat diet pair-feeding experimental design for comparing wild-type and leptin deficient mice would provide additional weight and dietary controls for evaluating the protective effects of impaired leptin signaling on the development of osteoarthritis.
In conclusion, extremely obese leptin-impaired mice do not develop increased incidence of knee osteoarthritis. This finding is consistent with recent studies that implicate leptin as a pro-inflammatory and pro-catabolic mediator of osteoarthritis associated with obesity (9, 10, 12–15). Leptin, however, has many pleiotropic effects on the body, including significant roles in the musculoskeletal, immune, and reproductive systems. Our findings indicate that impaired leptin signaling significantly alters subchondral bone morphology without altering knee osteoarthritis, suggesting that obesity, other obesity-dependent factors, or the absence of leptin signaling independently moderate subchondral bone morphology. Furthermore, adiposity alone, in the absence of leptin signaling, is insufficient to induce systemic inflammation. Additional insight into the potential chondroprotective effects of disrupting leptin signaling may be obtained by examining leptin-impaired mice in acute models of osteoarthritis, such as instability or injury models.
Acknowledgments
The authors would like to thank Stephen Johnson for his excellent technical assistance and Bridgette Furman, Holly Leddy, Amy McNulty, and Benjamin Ward for histological grading. This study was supported by a Hulda Irene Duggan Arthritis Investigator Award from the Arthritis Foundation, and NIH grants AR51672, EB01630, AG15768, AR48182, and AR50245.
References
- 1.Felson DT, Chaisson CE. Understanding the relationship between body weight and osteoarthritis. Baillieres Clin Rheumatol. 1997;11(4):671–81. doi: 10.1016/s0950-3579(97)80003-9. [DOI] [PubMed] [Google Scholar]
- 2.Oliveria SA, Felson DT, Cirillo PA, Reed JI, Walker AM. Body weight, body mass index, and incident symptomatic osteoarthritis of the hand, hip, and knee. Epidemiology. 1999;10(2):161–6. [PubMed] [Google Scholar]
- 3.Weisberg SP, Hunter D, Huber R, Lemieux J, Slaymaker S, Vaddi K, et al. CCR2 modulates inflammatory and metabolic effects of high-fat feeding. J Clin Invest. 2006;116(1):115–24. doi: 10.1172/JCI24335. [DOI] [PMC free article] [PubMed] [Google Scholar]
- 4.Ahima RS. Adipose tissue as an endocrine organ. Obesity (Silver Spring) 2006;14 (Suppl 5):242S–249S. doi: 10.1038/oby.2006.317. [DOI] [PubMed] [Google Scholar]
- 5.Friedman JM, Halaas JL. Leptin and the regulation of body weight in mammals. Nature. 1998;395(6704):763–70. doi: 10.1038/27376. [DOI] [PubMed] [Google Scholar]
- 6.Ducy P, Amling M, Takeda S, Priemel M, Schilling AF, Beil FT, et al. Leptin inhibits bone formation through a hypothalamic relay: a central control of bone mass. Cell. 2000;100(2):197–207. doi: 10.1016/s0092-8674(00)81558-5. [DOI] [PubMed] [Google Scholar]
- 7.Hamrick MW, Pennington C, Newton D, Xie D, Isales C. Leptin deficiency produces contrasting phenotypes in bones of the limb and spine. Bone. 2004;34(3):376–83. doi: 10.1016/j.bone.2003.11.020. [DOI] [PubMed] [Google Scholar]
- 8.Huebner JL, Hanes MA, Beekman B, TeKoppele JM, Kraus VB. A comparative analysis of bone and cartilage metabolism in two strains of guinea-pig with varying degrees of naturally occurring osteoarthritis. Osteoarthritis Cartilage. 2002;10(10):758–67. doi: 10.1053/joca.2002.0821. [DOI] [PubMed] [Google Scholar]
- 9.Otero M, Gomez Reino JJ, Gualillo O. Synergistic induction of nitric oxide synthase type II: in vitro effect of leptin and interferon-gamma in human chondrocytes and ATDC5 chondrogenic cells. Arthritis Rheum. 2003;48(2):404–9. doi: 10.1002/art.10811. [DOI] [PubMed] [Google Scholar]
- 10.Otero M, Lago R, Lago F, Reino JJ, Gualillo O. Signalling pathway involved in nitric oxide synthase type II activation in chondrocytes: synergistic effect of leptin with interleukin-1. Arthritis Res Ther. 2005;7(3):R581–91. doi: 10.1186/ar1708. [DOI] [PMC free article] [PubMed] [Google Scholar]
- 11.Pelletier JP, DiBattista JA, Roughley P, McCollum R, Martel-Pelletier J. Cytokines and inflammation in cartilage degradation. Rheum Dis Clin North Am. 1993;19(3):545–68. [PubMed] [Google Scholar]
- 12.Iliopoulos D, Malizos KN, Tsezou A. Epigenetic regulation of leptin affects MMP-13 expression in osteoarthritic chondrocytes: possible molecular target for osteoarthritis therapeutic intervention. Ann Rheum Dis. 2007 doi: 10.1136/ard.2007.069377. [DOI] [PMC free article] [PubMed] [Google Scholar]
- 13.Dumond H, Presle N, Terlain B, Mainard D, Loeuille D, Netter P, et al. Evidence for a key role of leptin in osteoarthritis. Arthritis Rheum. 2003;48(11):3118–29. doi: 10.1002/art.11303. [DOI] [PubMed] [Google Scholar]
- 14.Presle N, Pottie P, Dumond H, Guillaume C, Lapicque F, Pallu S, et al. Differential distribution of adipokines between serum and synovial fluid in patients with osteoarthritis. Contribution of joint tissues to their articular production. Osteoarthritis Cartilage. 2006;14(7):690–5. doi: 10.1016/j.joca.2006.01.009. [DOI] [PubMed] [Google Scholar]
- 15.Simopoulou T, Malizos KN, Iliopoulos D, Stefanou N, Papatheodorou L, Ioannou M, et al. Differential expression of leptin and leptin’s receptor isoform (Ob-Rb) mRNA between advanced and minimally affected osteoarthritic cartilage; effect on cartilage metabolism. Osteoarthritis Cartilage. 2007 doi: 10.1016/j.joca.2007.01.018. [DOI] [PubMed] [Google Scholar]
- 16.Silberberg M, Silberberg R. Degenerative joint disease in mice fed a high-fat diet at various ages. Exp Med Surg. 1952;10(1):76–87. [PubMed] [Google Scholar]
- 17.Silberberg M, Silberberg R. Effects of a high fat diet on the joints of aging mice. AMA Arch Pathol. 1950;50(6):828–46. [PubMed] [Google Scholar]
- 18.Griffin TM, Rodriguiz RM, Wetsel WC, Huebner JL, Kraus VB, Flahiff CM, et al. Trans Orthop Res Soc. San Francisco: 2008. Biomechanical, behavioral, and inflammatory factors in a diet-induced obese mouse model of osteoarthritis; p. 123. [Google Scholar]
- 19.Griffin TM, Guilak F. Why is obesity associated with osteoarthritis? Insights from mouse models of obesity. Biorheology. 2008;45(3–4):387–98. [PMC free article] [PubMed] [Google Scholar]
- 20.Ward BD, Furman BD, Huebner JL, Kraus VB, Guilak F, Olson SA. Absence of posttraumatic arthritis following intraarticular fracture in the MRL/MpJ mouse. Arthritis Rheum. 2008;58(3):744–53. doi: 10.1002/art.23288. [DOI] [PubMed] [Google Scholar]
- 21.Hochberg MC, Lethbridge-Cejku M, Scott WW, Jr, Reichle R, Plato CC, Tobin JD. The association of body weight, body fatness and body fat distribution with osteoarthritis of the knee: data from the Baltimore Longitudinal Study of Aging. J Rheumatol. 1995;22(3):488–93. [PubMed] [Google Scholar]
- 22.Felson DT, Goggins J, Niu J, Zhang Y, Hunter DJ. The effect of body weight on progression of knee osteoarthritis is dependent on alignment. Arthritis Rheum. 2004;50(12):3904–9. doi: 10.1002/art.20726. [DOI] [PubMed] [Google Scholar]
- 23.Sharma L, Song J, Felson DT, Cahue S, Shamiyeh E, Dunlop DD. The role of knee alignment in disease progression and functional decline in knee osteoarthritis. Jama. 2001;286(2):188–95. doi: 10.1001/jama.286.2.188. [DOI] [PubMed] [Google Scholar]
- 24.Fei H, Okano HJ, Li C, Lee GH, Zhao C, Darnell R, et al. Anatomic localization of alternatively spliced leptin receptors (Ob-R) in mouse brain and other tissues. Proc Natl Acad Sci U S A. 1997;94(13):7001–5. doi: 10.1073/pnas.94.13.7001. [DOI] [PMC free article] [PubMed] [Google Scholar]
- 25.Silberberg R. Obesity and joint disease. Gerontology. 1976;22(3):135–40. doi: 10.1159/000212130. [DOI] [PubMed] [Google Scholar]
- 26.Chung WK, Belfi K, Chua M, Wiley J, Mackintosh R, Nicolson M, et al. Heterozygosity for Lep(ob) or Lep(rdb) affects body composition and leptin homeostasis in adult mice. Am J Physiol. 1998;274(4 Pt 2):R985–90. doi: 10.1152/ajpregu.1998.274.4.R985. [DOI] [PubMed] [Google Scholar]
- 27.Ahima RS, Flier JS. Leptin. Annu Rev Physiol. 2000;62:413–37. doi: 10.1146/annurev.physiol.62.1.413. [DOI] [PubMed] [Google Scholar]
- 28.Messier SP, Gutekunst DJ, Davis C, DeVita P. Weight loss reduces knee-joint loads in overweight and obese older adults with knee osteoarthritis. Arthritis Rheum. 2005;52(7):2026–32. doi: 10.1002/art.21139. [DOI] [PubMed] [Google Scholar]
- 29.Yamada K, Healey R, Amiel D, Lotz M, Coutts R. Subchondral bone of the human knee joint in aging and osteoarthritis. Osteoarthritis Cartilage. 2002;10(5):360–9. doi: 10.1053/joca.2002.0525. [DOI] [PubMed] [Google Scholar]
- 30.Jebb SA, Moore MS. Contribution of a sedentary lifestyle and inactivity to the etiology of overweight and obesity: current evidence and research issues. Med Sci Sports Exerc. 1999;31(11 Suppl):S534–41. doi: 10.1097/00005768-199911001-00008. [DOI] [PubMed] [Google Scholar]
- 31.DeVita P, Hortobagyi T. Obesity is not associated with increased knee joint torque and power during level walking. J Biomech. 2003;36(9):1355–62. doi: 10.1016/s0021-9290(03)00119-2. [DOI] [PubMed] [Google Scholar]
- 32.Pelleymounter MA, Cullen MJ, Baker MB, Hecht R, Winters D, Boone T, et al. Effects of the obese gene product on body weight regulation in ob/ob mice. Science. 1995;269(5223):540–3. doi: 10.1126/science.7624776. [DOI] [PubMed] [Google Scholar]
- 33.Warmington SA, Tolan R, McBennett S. Functional and histological characteristics of skeletal muscle and the effects of leptin in the genetically obese (ob/ob) mouse. Int J Obes Relat Metab Disord. 2000;24(8):1040–50. doi: 10.1038/sj.ijo.0801357. [DOI] [PubMed] [Google Scholar]
- 34.Lapvetelainen T, Hyttinen M, Lindblom J, Langsjo TK, Sironen R, Li SW, et al. More knee joint osteoarthritis (OA) in mice after inactivation of one allele of type II procollagen gene but less OA after lifelong voluntary wheel running exercise. Osteoarthritis Cartilage. 2001;9(2):152–60. doi: 10.1053/joca.2000.0370. [DOI] [PubMed] [Google Scholar]
- 35.Felson DT, Niu J, Clancy M, Sack B, Aliabadi P, Zhang Y. Effect of recreational physical activities on the development of knee osteoarthritis in older adults of different weights: the Framingham Study. Arthritis Rheum. 2007;57(1):6–12. doi: 10.1002/art.22464. [DOI] [PubMed] [Google Scholar]
- 36.Schaffler A, Ehling A, Neumann E, Herfarth H, Tarner I, Scholmerich J, et al. Adipocytokines in synovial fluid. Jama. 2003;290(13):1709–10. doi: 10.1001/jama.290.13.1709-c. [DOI] [PubMed] [Google Scholar]
- 37.Bozic CR, Kolakowski LF, Jr, Gerard NP, Garcia-Rodriguez C, von Uexkull-Guldenband C, Conklyn MJ, et al. Expression and biologic characterization of the murine chemokine KC. J Immunol. 1995;154(11):6048–57. [PubMed] [Google Scholar]
- 38.Aygun AD, Gungor S, Ustundag B, Gurgoze MK, Sen Y. Proinflammatory cytokines and leptin are increased in serum of prepubertal obese children. Mediators Inflamm. 2005;2005(3):180–3. doi: 10.1155/MI.2005.180. [DOI] [PMC free article] [PubMed] [Google Scholar]
- 39.Matarese G, Moschos S, Mantzoros CS. Leptin in immunology. J Immunol. 2005;174(6):3137–42. doi: 10.4049/jimmunol.174.6.3137. [DOI] [PubMed] [Google Scholar]
- 40.Faggioni R, Fantuzzi G, Gabay C, Moser A, Dinarello CA, Feingold KR, et al. Leptin deficiency enhances sensitivity to endotoxin-induced lethality. Am J Physiol. 1999;276(1 Pt 2):R136–42. doi: 10.1152/ajpregu.1999.276.1.R136. [DOI] [PubMed] [Google Scholar]
- 41.Lord GM, Matarese G, Howard JK, Baker RJ, Bloom SR, Lechler RI. Leptin modulates the T-cell immune response and reverses starvation-induced immunosuppression. Nature. 1998;394(6696):897–901. doi: 10.1038/29795. [DOI] [PubMed] [Google Scholar]
- 42.Bernotiene E, Palmer G, Talabot-Ayer D, Szalay-Quinodoz I, Aubert ML, Gabay C. Delayed resolution of acute inflammation during zymosan-induced arthritis in leptin-deficient mice. Arthritis Res Ther. 2004;6(3):R256–63. doi: 10.1186/ar1174. [DOI] [PMC free article] [PubMed] [Google Scholar]
- 43.Busso N, So A, Chobaz-Peclat V, Morard C, Martinez-Soria E, Talabot-Ayer D, et al. Leptin signaling deficiency impairs humoral and cellular immune responses and attenuates experimental arthritis. J Immunol. 2002;168(2):875–82. doi: 10.4049/jimmunol.168.2.875. [DOI] [PubMed] [Google Scholar]
- 44.Kishida Y, Hirao M, Tamai N, Nampei A, Fujimoto T, Nakase T, et al. Leptin regulates chondrocyte differentiation and matrix maturation during endochondral ossification. Bone. 2005;37(5):607–21. doi: 10.1016/j.bone.2005.05.009. [DOI] [PubMed] [Google Scholar]
- 45.Sniekers YH, Intema F, Lafeber FP, van Osch GJ, van Leeuwen JP, Weinans H, et al. A role for subchondral bone changes in the process of osteoarthritis; a micro-CT study of two canine models. BMC Musculoskelet Disord. 2008;9:20. doi: 10.1186/1471-2474-9-20. [DOI] [PMC free article] [PubMed] [Google Scholar]
- 46.Chehab FF, Mounzih K, Lu R, Lim ME. Early onset of reproductive function in normal female mice treated with leptin. Science. 1997;275(5296):88–90. doi: 10.1126/science.275.5296.88. [DOI] [PubMed] [Google Scholar]
- 47.Richmond RS, Carlson CS, Register TC, Shanker G, Loeser RF. Functional estrogen receptors in adult articular cartilage: estrogen replacement therapy increases chondrocyte synthesis of proteoglycans and insulin-like growth factor binding protein 2. Arthritis Rheum. 2000;43(9):2081–90. doi: 10.1002/1529-0131(200009)43:9<2081::AID-ANR20>3.0.CO;2-I. [DOI] [PubMed] [Google Scholar]
- 48.Sniekers YH, Weinans H, Bierma-Zeinstra SM, van Leeuwen JP, van Osch GJ. Animal models for osteoarthritis: the effect of ovariectomy and estrogen treatment - a systematic approach. Osteoarthritis Cartilage. 2008;16(5):533–41. doi: 10.1016/j.joca.2008.01.002. [DOI] [PubMed] [Google Scholar]
- 49.Torto R, Boghossian S, Dube MG, Kalra PS, Kalra SP. Central leptin gene therapy blocks ovariectomy-induced adiposity. Obesity (Silver Spring) 2006;14(8):1312–9. doi: 10.1038/oby.2006.149. [DOI] [PubMed] [Google Scholar]
- 50.Toth MJ, Tchernof A, Sites CK, Poehlman ET. Effect of menopausal status on body composition and abdominal fat distribution. Int J Obes Relat Metab Disord. 2000;24(2):226–31. doi: 10.1038/sj.ijo.0801118. [DOI] [PubMed] [Google Scholar]