Abstract
Objective:
To determine whether premature sagittal craniosynostosis is associated with developmental instability in the skull by analyzing fluctuating asymmetry in skull shape.
Design:
Cranial shape was quantified by collecting coordinate data from landmarks located on three-dimensional reconstructions of preoperative computed tomography (CT) images of 22 children with sagittal craniosynostosis and 22 age-matched controls. A fluctuating asymmetry application of Euclidean distance matrix analysis (EDMA) was used to quantify and compare asymmetry in cranial shape using these landmark data.
Results:
In contrast to expectations, the sagittal craniosynostosis group did not show a statistically significant increase in the overall level of fluctuating asymmetry relative to the control group. However, we discerned statistically significant localized increases in fluctuating asymmetry in the sagittal craniosynostosis group at pterion and the anterior clinoid processes (α = .05). We also determined a significant correlation of fluctuating asymmetry values between the two groups (r = .71).
Conclusions:
We conclude that there is no evidence of a role for system-wide developmental instability in the etiology of nonsyndromic sagittal craniosynostosis. However, the localized evidence of asymmetry at the anterior clinoid processes in the sagittal synostosis group suggests an association with the tracts of dura mater that attach there.
Keywords: developmental instability, dural tracts, fluctuating asymmetry, sagittal craniosynostosis
Isolated sagittal craniosynostosis is the premature fusion of the parietal bones at the midline sagittal suture. It is the most common of all craniosynostoses (Cohen, 1995) and is characterized by an elongated skull shape (dolichocephaly) and frontal bossing (Virchow, 1851; Cohen, 1995; Schmelzer et al., 2007). Significant advances have been made in understanding the etiology of many forms of craniosynostoses, including both syndromic and isolated craniosynostoses (reviewed in Cohen, 1995; Morriss-Kay and Wilkie, 2005; Cunningham et al., 2007). Although sagittal craniosynostosis is a component of some craniosynostotic syndromes with known genetic causes, the pathogenesis of isolated, nonsyndromic sagittal craniosynostosis remains unclear.
Here we consider the role of developmental instability as a possible underlying cause of isolated sagittal craniosynostosis. Developmental stability is the ability of an organism to achieve a given phenotype under specific genetic and environmental conditions. In contrast, developmental instability is a function of the minor perturbations that occur during development. These perturbations, also known as developmental noise, cause random, subtle deviations from symmetry in otherwise bilaterally symmetric structures. The accumulation of these subtle, microscopic developmental deviations results in fluctuating asymmetry, a phenotypic character that can be measured macroscopically. Increased levels of fluctuating asymmetry have been used to infer relatively greater levels of developmental noise or developmental instability, and this relationship has been the subject of multiple recent comprehensive reviews (e.g., Markow, 1994; Møller and Swaddle, 1997; Polak, 2003).
Increased levels of fluctuating asymmetry have been associated with certain developmental anomalies, including attention-deficit hyperactivity disorder (ADHD) (Burton et al., 2003), developmental delay (Malina and Buschang, 1984; Naugler and Ludman, 1996), and conditions of development with still unknown genetic components (Livshits and Kobyliansky, 1991). However, the causal link between these anomalies and the apparent developmental asymmetry is unclear. Fluctuating asymmetry has been associated with Down syndrome, where the underlying genetic cause is known (Barden, 1980; Shapiro, 1983; Townsend, 1983; cf. Shaner et al., 2000). It is unclear, however, whether the chromosomal abnormality in Down syndrome directly produces the observed fluctuating asymmetry, or whether the developmental stability of the individual is compromised by the gene dosage imbalance, making the individual more vulnerable to external environmental stressors. Fluctuating asymmetry has also been associated with isolated cleft lip (with or without palate involvement), which appears to result from a combination of genetic and environmental factors (Adams and Niswander, 1967; etiology is reviewed in Murray, 2002; Zeiger and Beaty, 2002; Riley et al., 2007).
We evaluated fluctuating asymmetry in children with nonsyndromic sagittal craniosynostosis relative to a control sample in an effort to test the hypothesis of increased developmental instability in this population. Because sagittal craniosynostosis is a midline, nondirectional developmental defect, the resulting deviations from an ideal growth trajectory are expected to occur equally on each side. We predicted that children with sagittal craniosynostosis would display relatively higher levels of fluctuating asymmetry than a control sample. If developmental instability of the craniofacial system plays a role in the production of isolated sagittal craniosynostosis, then we expected to see a greater degree of generalized fluctuating asymmetry in all parts of the skull in the children with sagittal craniosynostosis. We also considered localized evidence of fluctuating asymmetry as possible indicators of localized centers of developmental instability in the craniofacial complex.
Materials and Methods
The study sample (Table 1) consists of clinically obtained computed tomography (CT) scans from children with sagittal craniosynostosis (the “sagittal” group; N = 22) and from an age-matched control group of morphologically normal children (the “control” group; N = 22). We chose to use very young children (11 to 81 weeks of age) because most individuals with sagittal craniosynostosis undergo corrective surgery during infancy, and we required preoperative CT data to represent the morphological and developmental impact of sagittal craniosynostosis. Limited availability of CT data made it impossible to control the samples for the effect of sex, but we expect minimal sexual dimorphism at these ages. CT scans were obtained from radiological archives at the Johns Hopkins Hospital, Baltimore, Maryland; Children's Hospital, St. Louis, Missouri; and Oklahoma Children's Hospital, Oklahoma City, Oklahoma. The scans are utilized for this project under an approved Institutional Review Board protocol.
TABLE 1.
The Study Sample: Computed Tomography Data Used to Assess the Effect of Biomechanical Constraint on Fluctuating Asymmetry
| Control |
Sagittal |
||
|---|---|---|---|
| Age (wks) | Sex | Age (wks) | Sex |
| 12 | F | 11 | M |
| 16 | F | 14 | M |
| 16 | F | 15 | M |
| 17 | M | 15 | M |
| 19 | F | 16 | M |
| 19 | F | 17 | M |
| 20 | F | 20 | F |
| 20 | M | 21 | M |
| 22 | M | 22 | M |
| 27 | M | 26 | M |
| 28 | F | 27 | M |
| 29 | F | 28 | M |
| 31 | M | 30 | M |
| 31 | F | 31 | M |
| 33 | M | 35 | M |
| 35 | M | 35 | M |
| 39 | F | 37 | F |
| 46 | F | 43 | M |
| 56 | M | 52 | M |
| 62 | M | 69 | M |
| 75 | M | 71 | M |
| 81 | M | 80 | F |
| Mean age = 33.4 | Mean age = 32.5 | ||
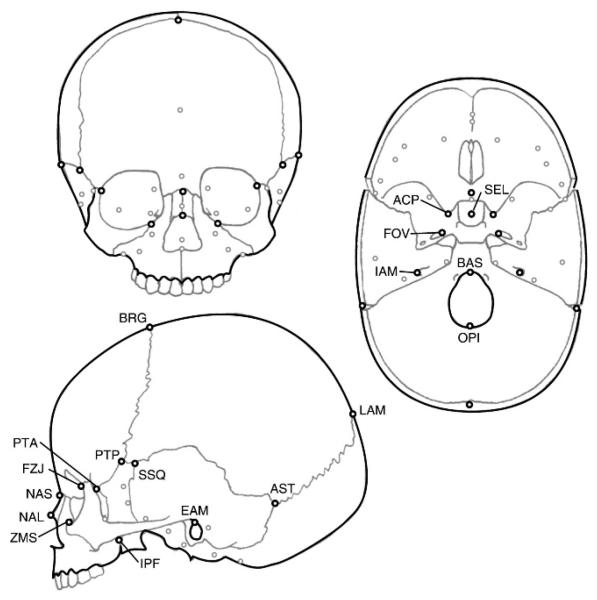
Three-dimensional coordinate data from biologically relevant landmarks on the skull were used to quantify and assess craniofacial form in this study (Fig. 1, Table 2). Landmarks were chosen to represent all parts of the skull; although, the cranial base and face have a much higher density of landmarks than the neurocranium. A large subset of the clinically-obtained data was restricted to imaging of the neurocranium and excluded the lower face. For this reason, palatal landmarks are not included in this study. Most landmarks used here are defined by sutural intersections or neurovascular foramina. Landmark coordinates were collected from three-dimensional computer reconstructions of the CT image files. Reconstructions of the bony skull were created using etdips, a multidimensional volume visualization and analysis software, codeveloped by the National Institutes of Health and the National University of Singapore under CRADA (CACR-645) http://www.cc.nih.gov/cip/software/etdips/. Reconstructions of CT scans allowed us to include landmarks from both ectocranial and endocranial surfaces in this analysis. Landmarks were identified on the three-dimensional surface reconstruction or on one of three orthogonal planes (the raw axial slice image or reconstructed sections in the coronal or sagittal planes), and coordinate data were obtained using an integrated landmarking tool. The coordinate data for each landmark collection trial were exported as independent text files.
FIGURE 1.
Landmarks used in this study. All landmark locations are illustrated on each anterior, lateral, and endocranial view of the skull. Label abbreviations are from Table 2 and appear only once in this figure. Black circles represent landmarks visible in the view, and grey circles represent approximate landmark locations obscured by bone. The landmarks hormion (VSJ), hypoglossal canals (HYP), and jugular processes (JUG) are represented only by grey circles and are not labeled.
TABLE 2.
Biological Landmarks and Corresponding Abbreviations Referenced in This Study
| Midline Landmarks | |
| BAS | basion |
| BRG | bregma |
| LAM | lambda |
| NAL | nasale |
| NAS | nasion |
| OPI | opisthion |
| SEL* | center of sella turcica (on bone) |
| VSJ | hormion (posterior midline point on vomer) |
| Bilateral Landmarks | |
| ACP* | anterior clinoid process |
| AST | asterion |
| EAM | external auditory meatus (superior) |
| FOV* | endocranial foramen ovale (anteromedial point) |
| FZJ | frontomalare orbitale |
| HYP | hypoglossal canal (superior external point) |
| IAM* | internal auditory meatus (postero-lateral point) |
| IPF | inferior pterygopalatine fissure |
| JUG | jugular process (anterior point) |
| PTA | pterion anterior (fronto-spheno-zygomatic intersection) |
| PTP | pterion posterior (fronto-spheno-parietal intersection) |
| SSQ | superior junction of spheno-squamosal suture |
| ZMS | zygomaxillare superior |
Endocranial landmarks. Note: Most landmarks are illustrated in Figure 1.
Landmark coordinate data were collected in two trials, checked for gross error (e.g., swapping right- and left-side landmarks), and then averaged to minimize any potential effects of measurement error. Measurement error analyses for the collection of landmark data from 3D CT reconstructions were conducted previously (DeLeon, 2004) and indicated that average error for most landmarks in this study is less than 1 mm (Table 3). Over 75% (16/21) of the landmarks had average error of less than 1 mm. The highest average error (2.29 mm) was at PTP (pterion posterior, at the fronto-parieto-sphenoid junction). PTP marks a sutural intersection that exhibits a high degree of normal biological variation, and elevated biological variation can contribute to measurement error (Corner et al., 1992). Additionally, personal observation indicates that the intersection of the superior edge of the greater wing of the sphenoid bone with the frontal and parietal bones is frequently difficult to visualize in CT reconstructions, and the observed error at this landmark may be a direct result of this problem with visualization. Error along the superior-inferior Z-axis was greater than error on the other axes for this landmark in all cases, supporting the explanation that visualization contributed significantly to error at this landmark. Midline landmarks generally displayed the lowest amount of error, with the exception of bregma (BRG; 1.46 mm). The exact location of bregma must be estimated on most juvenile subjects because the anterior fontanelle is usually patent. No linear distances were excluded from this study on the basis of this measurement error analysis, but the results of these measurement error analyses were considered in the interpretation of results of this study.
TABLE 3.
Measurement Precision Estimates for Landmark Placement on Computed Tomography Reconstructions*
| Landmark | (mm) |
|---|---|
| ACP | 0.48 |
| AST | 0.43 |
| BAS | 0.30 |
| BRG | 1.46† |
| EAM | 0.79 |
| FOV | 0.75 |
| FZJ | 0.40 |
| HYP | 0.31 |
| IAM | 0.45 |
| IPF | 0.82 |
| JUG | 1.01† |
| LAM | 0.38 |
| NAL | 0.40 |
| NAS | 0.55 |
| OPI | 0.21 |
| PTA | 1.05† |
| PTP | 2.29† |
| SEL | 0.34 |
| SSQ | 1.57† |
| VSJ | 0.58 |
| ZMS | 0.82 |
Precision values () for all landmarks considered in the error study (K = 34; eight midline and 13 bilateral landmarks). These values estimate the average measurement error for placement of a landmark (in millimeters). Error data for right and left bilateral landmarks are incorporated in a single value.
Landmarks with error between 1 mm and 2.5 mm, constituting fewer than 25% of the landmarks under consideration. Error estimates for all landmarks were less than 2.5 mm.
An application of Euclidean distance matrix analysis (EDMA) was used to quantify fluctuating asymmetry in this study (Cole, 2001; Richtsmeier et al., 2004). EDMA quantifies form or shape using matrices of interlandmark linear distances. This morphometric approach is invariant to the coordinate system used to represent landmark locations and as a result, does not rely on the assumptions about variance structure, which have been criticized in the context of methods based on the superimposition or deformation of landmarks (e.g., Richtsmeier and Lele, 1990; Lele, 1993; Lele and Richtsmeier, 2001; Lele and McCulloch, 2002; Richtsmeier et al., 2002).
The fluctuating asymmetry application of EDMA relies on the population-distribution definitions of directional asymmetry, fluctuating asymmetry, and antisymmetry (Palmer and Strobeck, 1986). The variable of interest is the signed asymmetry value (L – R) for each bilateral interland-mark linear distance in a given specimen, where L is the length of that distance on the left side, and R is the length of the same distance on the right side. The distribution of the variable (L – R) within a sample provides estimates of the population parameters of directional asymmetry and fluctuating asymmetry. Directional asymmetry (DA) for a given interlandmark linear distance is estimated as the mean signed asymmetry for the sample of i individuals.
Fluctuating asymmetry (FA) is estimated as the dispersion of the signed asymmetry around the sample mean asymmetry (Mather, 1953; Van Valen, 1962; Soule, 1967; Livshits et al., 1988; cf. Palmer and Strobeck, 1992).
In other words, DA is an estimate of “normal” asymmetry in the population, and FA is an estimate of the average deviation from normal asymmetry. Importantly, these measures are calculated separately for each linear distance. Statistical significance of the difference in these parameters between our two study samples was addressed using the bootstrap method to calculate confidence intervals for each linear distance (following Hall and Martin, 1988; Richtsmeier et al., 2004). In the current set of studies, a distribution of 1000 test statistics was produced using the bootstrap to estimate 95% confidence intervals for each of the linear distances considered. Because of the predicted developmental instability associated with sagittal craniosynostosis, we expected the sagittal group to display a relatively greater level of fluctuating asymmetry than the control group.
Results
Overall FA
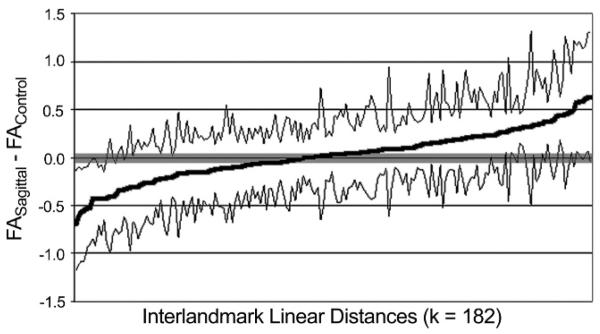
Approximately 18% of all bilateral interlandmark linear distances (32 out of a total 182 linear distances) showed statistically significantly different levels of fluctuating asymmetry between the sagittal and control groups (α = .05) (Fig. 2). Of these, 53% (17/32) were more asymmetric in the sagittal group; 47% (15/32) were more asymmetric in the control group. However, a one-sided binomial test indicated that this difference was nonsignificant (p = .43). These results do not support the hypothesis that the sagittal group displays a greater overall magnitude of fluctuating asymmetry, and by extension a higher level of developmental instability, relative to the control group.
FIGURE 2.
Differences in fluctuating asymmetry. This graph shows the ordered distribution of the differences in magnitude of fluctuating asymmetry (FASagittal – FAControl). The thick gray line (middle) indicates the values of FASagittal – FAControl for each linear distance. Each data point on the x-axis represents one of 182 bilateral interlandmark linear distances and appears linear as a result of the density of data. Thinner black lines (upper and lower) indicate the upper and lower limits of a 95% confidence interval for FASagittal – FAControl. When the confidence interval does not include zero, a significant difference in magnitude of fluctuating asymmetry exists between the sagittal and control groups for that particular linear distance. The majority of confidence intervals include zero, indicating a lack of statistically significant difference between samples overall.
Local Differences in FA
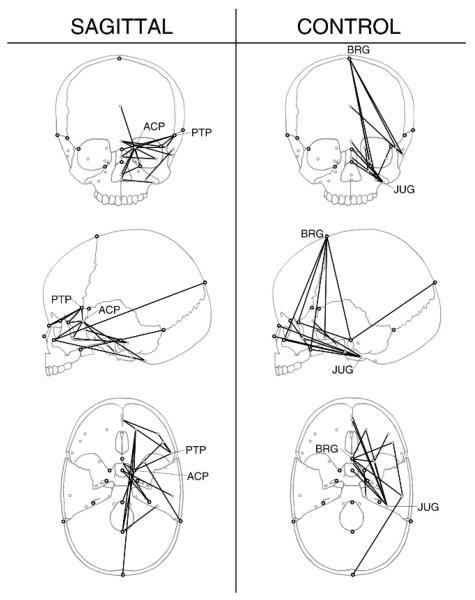
Despite the lack of difference in overall levels of fluctuating asymmetry between our sagittal and control groups, approximately one fifth of all linear distances did show statistically significant differences in degree of fluctuating asymmetry. Figure 3 illustrates linear distances that had significantly different values of fluctuating asymmetry in the sagittal and control groups. One way to discern patterns among large numbers of linear distances is through the identification of landmarks that act as endpoints for multiple linear distances of interest (Valeri et al., 1998; Richtsmeier et al., 2002). The landmarks anterior clinoid process (ACP) and pterion posterior (PTP) were involved in a number of linear distances that had significantly more fluctuating asymmetry in the sagittal as compared with the control group. Five of the 20 linear distances involving ACP had greater fluctuating asymmetry in the sagittal group, as did 4 of the 20 distances involving PTP, but neither landmark was involved in any linear distances that were more asymmetric in the control group. The significantly different linear distances involving ACP were oriented mediolaterally, suggesting asymmetric variation in the mediolateral position of the anterior clinoid process. The significantly different linear distances involving PTP fanned out inferiorly into the face and anterior cranial base, consistent with a highly variable superior extension of the greater wing of the sphenoid over the coronal suture. Zygomaxillare superior (ZMS) and opisthion (OPI) were also involved in multiple (three) linear distances with significantly more fluctuating asymmetry in the sagittal group.
FIGURE 3.
Linear distances with significantly different levels of fluctuating asymmetry. The left column shows linear distances with significantly more fluctuating asymmetry in the sagittal group (α = .05). The right column shows linear distances with significantly more fluctuating asymmetry in the control group.
In contrast, almost all linear distances (11/15) with significantly more fluctuating asymmetry in the control group involved the landmarks jugular process (JUG) or BRG. All linear distances involving JUG extend anteriorly into the face and basisphenoid, suggesting that asymmetric variation of the jugular process, and by extension, the jugular foramen occurs in an anterior-posterior direction. The substantial asymmetry at BRG noted here in the control group is addressed below in the context of directional asymmetry.
Patterns of Asymmetry Within Groups
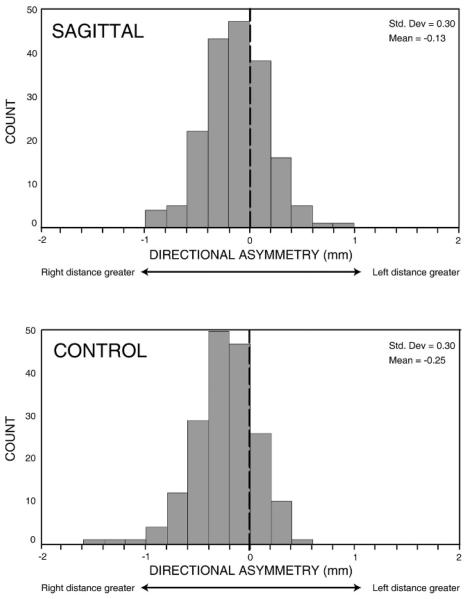
Specific patterns of asymmetry were investigated further to elucidate the biological implications of asymmetry in the human skull. Estimates of directional and fluctuating asymmetry were assessed for 182 bilateral interlandmark linear distances (ILD) in each of the sagittal and control groups. For the set of all ILD, directional asymmetry ranged from −0.91 mm to 0.90 mm in the sagittal group and from −1.42 mm to 0.50 mm in the control group (Fig. 4). There was an unambiguous trend toward right-side dominance in both the sagittal and control individuals [(L – R) < 0]. Right-side dominant values were more frequent (66% in the sagittal group and 80% in the control group) and of a greater magnitude as compared with left-side dominant values. Almost all directional asymmetry values in both the sagittal and control individuals (100% and 98%, respectively) were within 1 mm of perfect symmetry, indicating that directional asymmetry was of small magnitude overall. Five linear distances in the control group had left-side dominant directional asymmetry that exceeded 0.85 mm, to which may be attributed the negative skewness of the distribution of directional asymmetry in the control group. All of these five distances involve bregma, suggesting that bregma may be located slightly right of a hypothetical midline in the control group (greater distances on the left side indicate that the position is displaced to the right). The exact position of bregma (intersection of coronal, metopic, and sagittal sutures) is usually estimated in juvenile crania because the anterior fontanelle remains patent. Estimation may lead to increased risk of error, but the magnitude of error for all linear distances including bregma as an endpoint in the control group (mean: 0.66 mm) was less than that for other linear distances (mean: 0.73 mm). Therefore, the observed left-side bias for distances involving bregma might be explained by a consistent directional bias in the location of bregma.
FIGURE 4.
Distribution of directional asymmetry values. These histograms illustrate the distribution of directional asymmetry values for the 182 bilateral linear distances in the sagittal and control groups. A dotted line indicates the axis of symmetry at a directional asymmetry score of zero. In both samples, the mean directional asymmetry was less than zero, and negative values were more extreme, indicating a right-side bias (i.e., bilateral linear distances tend to be greater on the right side).
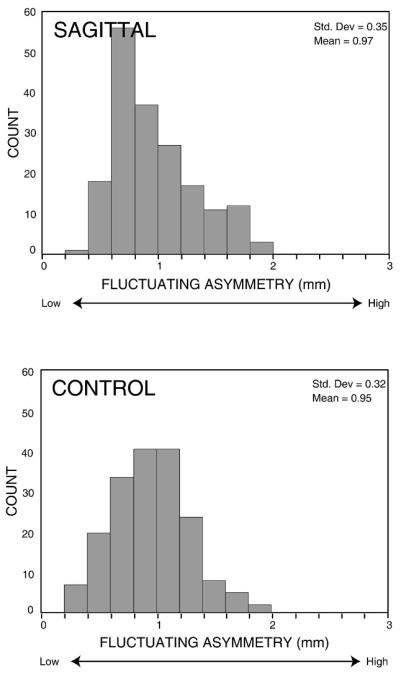
Fluctuating asymmetry estimates for the set of all linear distances ranged from 0.37 mm to 1.95 mm in the sagittal group and from 0.30 mm to 1.84 mm in the control group (Fig. 5). The ranges of fluctuating asymmetry were similar in the two groups and suggest that some linear distances may display greater amounts of fluctuating asymmetry than others regardless of group membership. Figure 6 illustrates linear distances for which the magnitude of fluctuating asymmetry was relatively low (less than 0.5 mm) in each group. In both the sagittal and control groups, the landmarks anterior clinoid process (ACP) and zygomaxillare superior (ZMS) were included in many of the linear distances with relatively low levels of fluctuating asymmetry. Note that ACP was a landmark displaying a significant increase in fluctuating asymmetry in the sagittal group relative to controls. In addition, linear distances involving internal auditory meatus (IAM) in the control group showed consistent low levels of fluctuating asymmetry. Note that these linear distances almost all involve midline landmarks as well and that ACP, ZMS, and IAM are located relatively close to the midline. This result suggests that asymmetric variation of structures close to the midline, demonstrated here in the maxillary and basicranial regions, is constrained in both groups.
FIGURE 5.
Distribution of fluctuating asymmetry values. These histograms illustrate the distribution of fluctuating asymmetry values for the 182 bilateral linear distances in the sagittal and control groups. The fluctuating asymmetry estimate for each bilateral linear distance is determined by centering the signed asymmetry distribution (L – R) at the sample mean (the estimate of directional asymmetry in the sample) and calculating the mean absolute deviation of all individuals from the sample mean for that linear distance.
FIGURE 6.
Low fluctuating asymmetry values. The linear distances shown in this figure had relatively low fluctuating asymmetry estimates of less than 0.50 mm. Values were calculated separately for the sagittal and control groups.
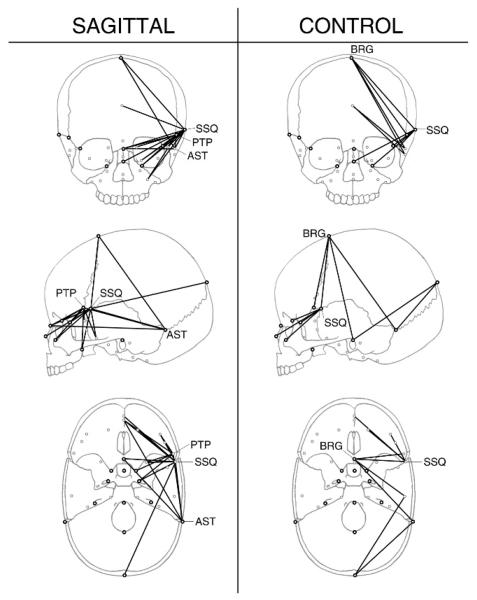
Figure 7 illustrates linear distances for which the magnitude of fluctuating asymmetry was relatively high (greater than 1.5 mm) in each group. Regardless of group membership, most linear distances with high levels of fluctuating asymmetry involved the landmark sphenosquamosal suture (SSQ). The sagittal group had high fluctuating asymmetry at the landmark pterion posterior (PTP). Asterion (AST) was also an endpoint for linear distances with high fluctuating asymmetry in the sagittal group and to a lesser extent in the control group. In the control group, mediolateral asymmetry of BRG was notable. As discussed above, this landmark was frequently identified as a locus of increased asymmetry in the control group because the anterior fontanelle was usually patent in individuals from the control group. However, measurement error in the current study for linear distances involving this landmark was no higher than for all other landmarks.
FIGURE 7.
High fluctuating asymmetry values. The linear distances shown in this figure had relatively high fluctuating asymmetry estimates (greater than 1.5 mm). Values were calculated separately for the sagittal and control groups.
Shared Patterns of FA
Previous research found patterns of bilateral asymmetry shared across separate samples, including both fluctuating and directional asymmetry values (DeLeon, 2004, 2007). However, although we identified shared patterns of fluctuating asymmetry in the current study, no correlation was found between directional asymmetry values for the set of all bilateral linear distances in the sagittal and control groups (Kendall's τβ = .04; p = .43). The negatively skewed distribution of directional asymmetry values in the control group was described previously and required the use of a nonparametric Kendall's τβ test of correlation. The extreme negative (right-side dominant) directional asymmetry values in the control group are driven by the displacement of bregma to the left of midline. If linear distances involving bregma are removed from the analysis, the distribution of directional asymmetry values in the control group has no significant skewness or kurtosis. However, the correlation between directional asymmetry values in the sagittal and control groups remains minimal (Kendall's τβ = .03; p = .55 and Pearson r = .10; p = .19).
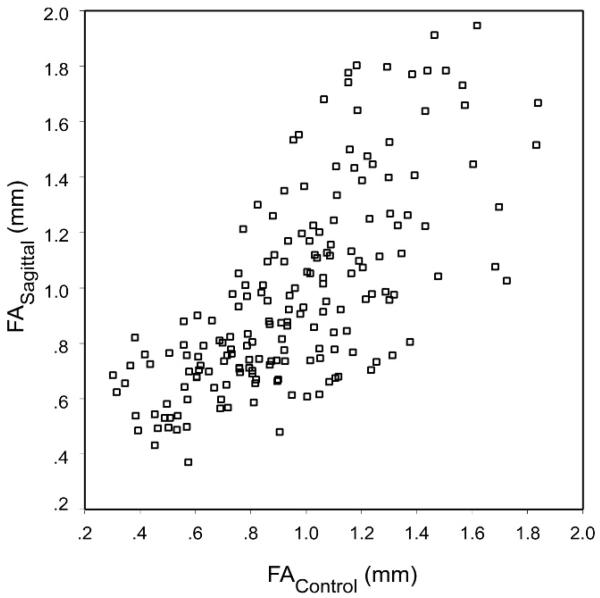
In contrast, fluctuating asymmetry values for the set of all bilateral linear distances were correlated in the sagittal and control groups (r = .71; p < .01) (Fig. 8). The correlation of fluctuating asymmetry values in the sagittal and control groups provides strong evidence for the existence of common biological processes influencing craniofacial fluctuating asymmetry, independent of a developmental anomaly and concomitant changes in growth trajectory. To determine the validity of this observation, it was first necessary to address other possible factors that might have influenced the between-group correlation of asymmetry values: (1) length of linear distance, (2) variation between individuals, and (3) measurement error. Our purpose was to determine whether the correlations of asymmetry values in the sagittal and control groups were significant, independent of the influence of these other three factors.
FIGURE 8.
Correlation of fluctuating asymmetry values in sagittal and control groups. Each point represents one of the 182 linear distances under consideration in these analyses.
The relative length of each linear distance was potentially a confounding factor in the observed correlation. A positive association between the size of a character and magnitude of its fluctuating asymmetry is well known (e.g., Palmer and Strobeck, 1986). We determined the “length” of each interlandmark linear distance separately for the sagittal and control groups as the average of the right- and left-side linear distances across all individuals in each sample. Interindividual variability was another potentially confounding factor in the observed correlations because these results might reflect the fact that some linear distances are simply more variable than others. We estimated “variability” of each interlandmark linear distance separately for the sagittal and control groups as the standard deviation of the average length for each individual. Finally, measurement error could have been a confounding factor in the correlations observed between the two groups in fluctuating asymmetry values for all linear distances. “Error” was determined separately for the sagittal and control groups and was estimated for each linear distance by averaging the standard deviation of the signed asymmetry values (L – R) for the two trials across all individuals in each of the two groups.
Multiple regression analysis was used to test the correlation of fluctuating asymmetry values in the sagittal and control groups, given the group-specific covariates of length, variability, and error. Two analyses were conducted in which data points represented each of the bilateral linear distances under consideration. In the first analysis, fluctuating asymmetry in the sagittal group was the dependent variable, and length, variability, and error in the sagittal group were independent variables. Fluctuating asymmetry in the control group was included as an additional independent variable. In the second analysis, fluctuating asymmetry in the control group was the dependent variable, and length, variability, and error in the control group were independent variables, along with fluctuating asymmetry of the sagittal group. The goal of this design was to test the predictive value of fluctuating asymmetry values in one group for fluctuating asymmetry in the other group, holding constant the covariates of group-specific length, variability, and error. Multiple regression analysis makes the assumption that variables are normally and symmetrically distributed, and data were appropriately transformed using square-root functions. Results obtained using these transformed data were nearly identical to results obtained using the raw data.
Partial correlations demonstrate that asymmetry values are correlated between the sagittal and control groups independent of the variables length, variability, and error (Table 4). There were low zero-order correlations between fluctuating asymmetry values and length, variability, and error values. In addition, the partial correlations for these factors were low (−.235 ≤ r ≤ .313). In contrast, the partial correlations for fluctuating asymmetry between the sagittal and control groups, controlling for those confounding factors, remained relatively strong (r = .642 and .537, for the sagittal and control groups, respectively). These results demonstrate that the observed correlation of asymmetry values between the sagittal and control groups is a result of common biological processes in the skull operating in both populations, rather than a byproduct of size, interindividual variability, or measurement error.
TABLE 4.
Partial Correlations for Fluctuating Asymmetry Values
| Sagittal |
Control |
||||
|---|---|---|---|---|---|
| Fluctuating Asymmetry* Correlations |
Fluctuating Asymmetry Correlations |
||||
| Zero-Order | Partial | Zero-Order | Partial | ||
| Length (sagittal)* | .228 | −.174 | Length (control)** | .336 | .194 |
| Variability (sagittal)* | .345 | −.235 | Variability (control)** | .405 | −.056 |
| Error (sagittal)** | .367 | .271 | Error (control)** | .460 | .313 |
| FA (control) | .712 | .642 | FA (sagittal)* | .712 | .537 |
Fourth-root transformation.
Square-root transformation.
Discussion
We found no evidence of a role for system-wide developmental instability in the etiology of nonsyndromic sagittal craniosynostosis. We were unable to identify a statistically significant difference between the sagittal and control groups in the overall degree of cranial fluctuating asymmetry. Similar negative findings and lack of evidence for systemic instability have been noted in the context of dental asymmetry in a rabbit model of isolated coronal craniosynostosis (Hyre et al., 2005, 2006). It is possible that larger sample sizes or reduced age variance in our study would increase statistical power sufficiently to uncover a difference between the groups, but our results suggest that the effect size would be quite small. The control group included equal numbers of male and female subjects (11 male and 11 female). However, the sagittal group included 19 male and only three female subjects, reflecting the greater incidence of sagittal craniosynostosis reported in boys (Lajeunie et al., 1996). Boys are proposed to be more developmentally unstable than girls (Palmer and Strobeck, 1986); however, we would expect this to increase artificially the relative degree of fluctuating asymmetry in the sagittal group. In summary, we do not expect that unequal distribution of sexes in the study samples contributed to our negative results.
We were successful in identifying a number of ILD with statistically significantly different levels of fluctuating asymmetry between the two groups. The identification of statistically significant differences in magnitude of fluctuating asymmetry and by implication, differences in developmental instability, allowed us to localize developmental instability in the human skull associated with the presence or absence of sagittal craniosynostosis. Bregma and the jugular process were the landmarks that served as endpoints of the smaller number of linear distances with significantly more fluctuating asymmetry in the control group. Although measurement error at bregma was not notably higher than that at any other landmark in this study, the necessity of estimating its position in a patent fontanel in the control group and a directional bias in locating the landmark may have contributed to its apparent asymmetry. The pattern of asymmetry in the jugular process noted in the control group may be related to the normal pattern of asymmetric venous blood from the head via the internal jugular veins that pass through these foramina.
In contrast, the anterior clinoid processes and pterion posterior were both endpoints in multiple linear distances that had significantly more fluctuating asymmetry in the sagittal group. The involvement of the anterior clinoid processes in the increased asymmetry in sagittal craniosynostosis is of particular interest because they are the posteriorly-projecting extensions of the lesser wings of the sphenoid and serve as attachment sites for the dura mater (Moss, 1959; Burton et al., 2003). The role of the dural tracts as a mechanical cause of sagittal synostosis was postulated by Dr. Melvin Moss as part of his functional matrix hypothesis; although, he predicted that sagittal synostosis would be associated with abnormal position of the crista galli, and that abnormality of the lesser wings would be associated with coronal craniosynostosis (Moss, 1959). Moss proposed that sutural fusion is a response to extrinsic forces and that premature synostosis originates as a primary malformation of the skull base. He described five principal tracts of organized dural fibers underlying the coronal, sagittal, and lambdoid sutures and attaching on the cranial base anteriorly at the ethmoidal crista galli, anterolaterally at the lesser sphenoidal wings, and postero-laterally at the otic capsules (Moss, 1959; Moss and Young, 1960). Abnormal tensile forces transmitted via these tracts were proposed to produce premature sutural fusion. He subsequently proposed a theoretical framework for mechanotransduction of these forces to the cellular level of the suture (Moss, 1997a; Moss, 1997b). We have demonstrated a high level of fluctuating asymmetry, and by extension developmental instability, at the anterior clinoid processes of the lesser wings of the sphenoid in children with isolated sagittal craniosynostosis, suggesting an association between sagittal synostosis and dysmorphology of the lesser sphenoidal wings. We also note that the anterior lateral dural tracts (folds of dura separating the frontal and temporal cerebral lobes of the brain) contact the vault on the endocranial surface just deep to the landmark pterion posterior, which also showed increased fluctuating asymmetry in the sagittal group.
Despite the differences in fluctuating asymmetry noted in this study, a correlation in fluctuating asymmetry values across all linear distances was found between the sagittal and control groups. Landmarks close to the midline displayed the most symmetry in both groups. In contrast, landmarks with the most fluctuating asymmetry were located on the neurocranium and generally further from the midline. These patterns are consistent with those previously noted in the context of sexual dimorphism (DeLeon, 2004) and health/environmental stress (DeLeon, 2007) models, again providing intriguing evidence of common patterns of fluctuating asymmetry in the human skull.
In summary, we were unable to find evidence for system-wide developmental instability as a factor in the etiology of isolated, nonsyndromic sagittal craniosynostosis. However, we did find localized patterns of fluctuating asymmetry that were statistically significantly different between our sagittal and control samples. Among these, we noted the apparent increased asymmetry in the anterior clinoid processes and pterion posterior among the sagittal group, suggesting an association between sagittal craniosynostosis and localized developmental instability related to the developmental association between dura (the meninges) and the skull.
Acknowledgments
We would like to express our appreciation to Drs. Jeffrey Marsh, Alex Kane, Craig VanderKolk, Benjamin Carson, and Jayesh Panchal for access to CT data and to Dr. Theodore M. Cole III for making the EDMA programs available. We thank Dr. Mark Teaford and the reviewers who offered their helpful comments and insight to improve the manuscript.
Funding for this research provided by the National Science Foundation and by National Institutes of Health grants R01-DE016886 and R01-DE018500.
Contributor Information
Dr. Valerie Burke DeLeon, Center for Functional Anatomy and Evolution, Johns Hopkins University, Baltimore, Maryland..
Dr. Joan T. Richtsmeier, Department of Anthropology, Pennsylvania State University, State College, Pennsylvania..
REFERENCES
- Adams MS, Niswander JD. Developmental ‘noise’ and a congenital malformation. Genet Res. 1967;10:313–317. doi: 10.1017/s0016672300011071. [DOI] [PubMed] [Google Scholar]
- Barden HS. Fluctuating dental asymmetry: a measure of developmental instability in Down syndrome. Am J Phys Anthropol. 1980;52:169–173. doi: 10.1002/ajpa.1330520203. [DOI] [PubMed] [Google Scholar]
- Burton C, Stevenson JC, Williams DC, Everson PM, Mahoney ER, Trimble JE. Attention-deficit hyperactivity disorder (AD/HD) and fluctuating asymmetry (FA) in a college sample: An exploratory study. Am J Hum Biol. 2003;15:601–619. doi: 10.1002/ajhb.10179. [DOI] [PubMed] [Google Scholar]
- Cohen MM. Perspectives on craniofacial asymmetry. I. The biology of asymmetry. Int J Oral Maxillofac Surg. 1995;24:2–7. doi: 10.1016/s0901-5027(05)80848-3. [DOI] [PubMed] [Google Scholar]
- Cole TM., III . Further applications of EDMA. In: Lele S, Richtsmeier JT, editors. An Invariant Approach to Statistical Analysis of Shapes. Chapman and Hall/CRC; Boca Raton, FL: 2001. pp. 263–284. [Google Scholar]
- Corner BD, Lele S, Richtsmeier JT. Measuring precision of three-dimensional landmark data. J Quant Anthropol. 1992;3:347–359. [Google Scholar]
- Cunningham ML, Seto ML, Ratisoontorn C, Heike CL, Hing AV. Syndromic craniosynostosis: from history to hydrogen bonds. Orthod Craniofac Res. 2007;10:67–81. doi: 10.1111/j.1601-6343.2007.00389.x. [DOI] [PubMed] [Google Scholar]
- DeLeon VB. Fluctuating Asymmetry in the Human Craniofacial Skeleton: Effects of Sexual Dimorphism, Stress, and Developmental Anomalies. Johns Hopkins University; Baltimore: 2004. Dissertation. [Google Scholar]
- DeLeon VB. Fluctuating asymmetry and stress in a medieval Nubian population. Am J Phys Anthropol. 2007;132:520–534. doi: 10.1002/ajpa.20549. [DOI] [PubMed] [Google Scholar]
- Hall P, Martin M. On the bootstrap and two-sample problems. Aust J Stat. 1988;30A:179–192. [Google Scholar]
- Hyre MA, Weinberg SM, Quilin K, Mooney MP, Siegel MI. Fluctuating asymmetry in craniosynostotic rabbit dentition: Measuring developmental instability. J. Dent. Res. 2005;84:1311. [Google Scholar]
- Hyre MA, Weinberg SM, Radtke JM, Rode EA, Goldstein-McHenry TH, Siegel MI, Mooney MP. Tooth size and asymmetry in a rabbit model with naturally occurring premature coronal suture synostosis. J. Dent. Res. 2006;85:2215. [Google Scholar]
- Lajeunie E, Le Merrer M, Bonaïti-Pellie C, Marchac D, Renier D. Genetic study of scaphocephaly. Am J Med Genet. 1996;62:282–285. doi: 10.1002/(SICI)1096-8628(19960329)62:3<282::AID-AJMG15>3.0.CO;2-G. [DOI] [PubMed] [Google Scholar]
- Lele S. Euclidean Distance Matrix Analysis (EDMA): estimation of mean form and mean form difference. Math Geol. 1993;25:573–602. [Google Scholar]
- Lele S, McCulloch CE. Invariance, identifiability, and morphometrics. J Am Stat Assoc. 2002;97(459):1–11. [Google Scholar]
- Lele S, Richtsmeier JT. An Invariant Approach to the Statistical Analysis of Shapes. Chapman and Hall/CRC; Boca Raton, FL: 2001. [Google Scholar]
- Livshits G, Davidi L, Kobyliansky E, Ben-Amitai D, Levi Y, Merlob P. Decreased developmental stability as assessed by fluctuating asymmetry of morphometric traits in preterm infants. Am J Med Genet. 1988;29:793–805. doi: 10.1002/ajmg.1320290409. [DOI] [PubMed] [Google Scholar]
- Livshits G, Kobyliansky E. Fluctuating asymmetry as a possible measure of developmental homeostasis in humans: a review. Hum Biol. 1991;63:441–466. [PubMed] [Google Scholar]
- Malina RM, Buschang PH. Anthropometric asymmetry in normal and mentally retarded males. Ann Hum Biol. 1984;11:515–531. doi: 10.1080/03014468400007431. [DOI] [PubMed] [Google Scholar]
- Markow TA, editor. Developmental Instability: Its Origins and Evolutionary Implications. Kluwer Academic Publishers; Dordrecht, Germany: 1994. [Google Scholar]
- Mather K. Genetical control of stability in development. Heredity. 1953;7:297–336. [Google Scholar]
- Møller A, Swaddle J. Asymmetry, Developmental Stability, and Evolution. Oxford University Press; Oxford: 1997. [Google Scholar]
- Morriss-Kay GM, Wilkie AO. Growth of the normal skull vault and its alteration in craniosynostosis: insights from human genetics and experimental studies. J Anat. 2005;207:637–653. doi: 10.1111/j.1469-7580.2005.00475.x. [DOI] [PMC free article] [PubMed] [Google Scholar]
- Moss ML. The functional matrix hypothesis revisited. 1. The role of mechanotransduction. Am J Orthod Dentofacial Orthop. 1997a;112:8–11. doi: 10.1016/s0889-5406(97)70267-1. [DOI] [PubMed] [Google Scholar]
- Moss ML. The functional matrix hypothesis revisited. 2. The role of an osseous connected cellular network. Am J Orthod Dentofacial Orthop. 1997b;112:221–226. doi: 10.1016/s0889-5406(97)70249-x. [DOI] [PubMed] [Google Scholar]
- Moss ML. The pathogenesis of premature cranial synostosis in man. Acta Anat (Basel) 1959;37:351–370. doi: 10.1159/000141479. [DOI] [PubMed] [Google Scholar]
- Moss ML, Young RW. A functional approach to craniology. Am J Phys Anthropol. 1960;18:281–292. doi: 10.1002/ajpa.1330180406. [DOI] [PubMed] [Google Scholar]
- Murray JC. Gene/environment causes of cleft lip and/or palate. Clin Genet. 2002;61:248–256. doi: 10.1034/j.1399-0004.2002.610402.x. [DOI] [PubMed] [Google Scholar]
- Naugler CT, Ludman MD. Fluctuating asymmetry and disorders of developmental origin. Am J Med Genet. 1996;66:15–20. doi: 10.1002/(SICI)1096-8628(19961202)66:1<15::AID-AJMG4>3.0.CO;2-V. [DOI] [PubMed] [Google Scholar]
- Palmer AR, Strobeck C. Fluctuating asymmetry: measurement, analysis, patterns. Ann Rev Ecol Syst. 1986;17:391–421. [Google Scholar]
- Palmer AR, Strobeck C. Fluctuating asymmetry as a measure of developmental stability: implications of non-normal distributions and power of statistical tests. Acta Zoologica Fennica. 1992;191:57–72. [Google Scholar]
- Polak M, editor. Developmental Instability: Causes and Consequences. Oxford University Press; New York: 2003. [Google Scholar]
- Richtsmeier JT, DeLeon VB, Lele S. The promise of geometric morphometrics. Am J Phys Anthropol. 2002;119(S35):63–91. doi: 10.1002/ajpa.10174. [DOI] [PubMed] [Google Scholar]
- Richtsmeier JT, Lele S. Analysis of craniofacial growth in Crouzon syndrome using landmark data. J Craniofac Genet Dev Biol. 1990;10:39–62. [PubMed] [Google Scholar]
- Richtsmeier JT, Lele S, Cole TM., III . An invariant approach to the study of fluctuating asymmetry: developmental instability in a mouse model for Down syndrome. In: Slice D, editor. Modern Morphometrics in Physical Anthropology. Kluwer Academic/Plenum Publishers; New York: 2004. [Google Scholar]
- Riley BM, Mansilla MA, Ma J, Daack-Hirsch S, Maher BS, Raffensperger LM, Russo ET, Vieira AR, Dodé C, Mohammadi M. Impaired FGF signaling contributes to cleft lip and palate. Proc Natl Acad Sci U S A. 2007;104:4512–4517. doi: 10.1073/pnas.0607956104. [DOI] [PMC free article] [PubMed] [Google Scholar]
- Schmelzer RE, Perlyn CA, Kane AA, Pilgrim TK, Govier D, Marsh JL. Identifying reproducible patterns of calvarial dysmorphology in nonsyndromic sagittal craniosynostosis may affect operative intervention and outcomes assessment. Plast Reconstr Surg. 2007;119:1546–1552. doi: 10.1097/01.prs.0000256067.42651.30. [DOI] [PubMed] [Google Scholar]
- Shaner DJ, Peterson AE, Beattie OB, Bamforth JS. Assessment of soft tissue facial asymmetry in medically normal and syndrome-affected individuals by analysis of landmarks and measurements. Am J Med Genet. 2000;93:143–154. doi: 10.1002/1096-8628(20000717)93:2<143::aid-ajmg12>3.0.co;2-q. [DOI] [PubMed] [Google Scholar]
- Shapiro B. Down syndrome—a disruption of homeostasis. Am J Med Genet. 1983;14:241–269. doi: 10.1002/ajmg.1320140206. [DOI] [PubMed] [Google Scholar]
- Soule M. Phenetics of natural populations. II. Asymmetry and evolution in a lizard. Am Nat. 1967;101(918):141–160. [Google Scholar]
- Townsend GC. Fluctuating dental asymmetry in Down syndrome. Aust Dent J. 1983;28:39–44. doi: 10.1111/j.1834-7819.1983.tb01068.x. [DOI] [PubMed] [Google Scholar]
- Valeri CJ, Cole TMIII, Lele S, Richtsmeier JT. Capturing data from three-dimensional surfaces using fuzzy landmarks. Am J Phys Anthropol. 1998;107:113–124. doi: 10.1002/(SICI)1096-8644(199809)107:1<113::AID-AJPA9>3.0.CO;2-O. [DOI] [PubMed] [Google Scholar]
- Van Valen L. A study of fluctuating asymmetry. Evolution. 1962;16:125–142. [Google Scholar]
- Virchow R. Über den Cretinismus, namentlich in Franken und über pathologische Schaädelformen. Verh Phys Med Ges Würzburg. 1851;2:230–281. [Google Scholar]
- Zeiger JS, Beaty TH. Is there a relationship between risk factors for oral clefts? Teratology. 2002;66:205–208. doi: 10.1002/tera.10104. [DOI] [PubMed] [Google Scholar]


