

Abstract
Background
EGFR expression is associated with aggressive phenotypes in preclinical breast cancer models, but in clinical studies, EGFR has been inconsistently linked to poor outcome. We hypothesized that EGFR expression in human breast tumors, when centrally and uniformly assessed, is associated with an aggressive phenotype and resistance to systemic therapy.
Methods
In a database of 47,286 patients with breast cancer, EGFR status was known on 2,567. EGFR levels were measured centrally by ligand binding assay, and tumors with ≥10 fmol/mg were prospectively deemed positive. Clinical and biological features of EGFR positive and negative tumors were compared. Clinical outcomes were assessed by systemic therapy status.
Results
475 out of 2,567 tumors (18%) were EGFR positive. EGFR-positive tumors were more common in younger and in black women, were larger, had a higher S-phase fraction, and were more likely to be aneuploid. EGFR positive tumors were more likely to be HER2-positive (26% vs. 16%, p<0.0001), but less likely to be ER-positive (60% vs. 88%, p<0.0001), or PR-positive (26% vs. 65%, p<0.0001).
In multivariate analyses, EGFR expression independently correlated with worse DFS (HR=1.66, 95% CI=1.4–2.41, p=0.007) and OS (HR=1.98, 95% CI=1.36–2.88, p=0.0004) in treated patients, but not in untreated patients.
Conclusions
EGFR expression is more common in breast tumors in younger and black women. It is associated with lower hormone receptor levels, higher proliferation, genomic instability, and HER2 over-expression. It is correlated with higher risk of relapse in patients receiving adjuvant treatment. Blocking EGFR may improve outcome in selected patients.
Keywords: Breast cancer, EGFR, resistance to endocrine therapy, chemotherapy resistance
Introduction
The epidermal growth factor receptor (EGFR; ErbB-1; HER1 in humans) is a tyrosine kinase receptor of the epidermal growth factor receptor family. Other members are HER2, HER3, and HER4. These receptors are activated by ligand-dependent homo-and heterodimerization, which lead to kinase activation and initiation of signaling. Interaction between these four receptors and their various ligands may regulate and modulate their effects on cell growth and survival [1].
EGFR expression, biological impact, and influence on clinical outcome have been reported in several tumor types [2, 3]. In preclinical models of breast cancer, overexpression of EGFR leads to malignant transformation of mouse cells. It is associated with increased proliferation and resistance to apoptosis [4]. Additionally, its role in resistance to hormone therapy through crosstalk with estrogen receptor (ER) is now better understood [5].
There have also been multiple reports on EGFR in clinical breast cancer. The studies were mostly small in size, used variable methodologies, and had inconsistent results [6–15]. This may be explained in part by the many challenges facing studies of EGFR in clinical breast cancer samples. There has been little standardization of analytic techniques, and most studies used formalin fixation of tissue, a process which can vary considerably between institutions and may alter antigen detectability. Moreover, immunohistochemical staining of EGFR has had inconsistent results, and is not a functional assay. Radiolabeled ligand-binding is a functional assay but is time-consuming and requires frozen tissue, which is not widely collected or banked anymore in the United States. Antigen detection is less likely to be altered in frozen tissue.
We hypothesized that EGFR expression, when centrally and uniformly measured in frozen tissue obtained from a large number of patients, would be associated with an aggressive phenotype of breast cancer and would confer resistance to systemic adjuvant therapy. We tested these hypotheses using a large frozen tissue breast tumor bank in which EGFR was assessed by a central laboratory using ligand-binding assay, and results were correlated with clinical and biologic tumor characteristics as well as clinical outcomes.
Methods
Patient Data and Specimens
The Lester and Sue Smith Breast Center at Baylor College of Medicine maintains a database of breast cancer patients whose tissue specimens were originally sent to a central reference laboratory for steroid receptor assays at the Nichols Institute in California serving more than 370 institutions throughout the United States. Demographics were reported by the patients and staff at each contributing institution. Follow-up information as well as clinical and pathologic characteristics were obtained from tumor registries, medical records, or by data collection forms completed by the office staff of the referring physicians. This database contains information on 47,286 patients diagnosed between 1984 and 1999 with early breast cancer (stage I–IIIA). This repository has been reviewed by Institutional Review Boards at the University of Texas Health Science Center at San Antonio and at Baylor College of Medicine and both boards provided a waiver of informed consent. No patient identifiers were provided to the authors.
Prognostic Factors
EGFR levels were measured by radioligand binding assay. Tumor specimens were pulverized in liquid nitrogen, homogenized, and centrifuged. Cytosol fractions and suspended fat were removed. Membrane fraction samples were incubated with fixed concentrations of radiolabeled EGF and varying concentrations of unlabeled EGF. Total protein was determined by the Lowry method [16]. Levels of ≥10 fmol/mg of membrane protein were prospectively deemed positive as in previous studies [17].
HER2 status was determined by Western blotting, using a rabbit polyclonal antibody directed against the C-terminus of the HER2 protein [18]. The cutoff value for HER2 expression was set at 1U/µg protein based on prior studies [18, 19].
ER levels were measured by the dextran-coated charcoal method, as previously described [20]. From 1970 to 1984, PR levels were measured by sucrose density gradient [21]. In 1985, the standard multipoint dextran-coated charcoal assay incorporated [125I]-estradiol and [3H]-R5020 in a single assay, allowing the simultaneous determination of ER and PR. Samples containing at ≥3 fmol/mg protein were prospectively considered ER-positive, and those containing ≥5 fmol/mg protein were considered PR-positive, based on prior clinical studies [22–24].
DNA ploidy and S-phase fraction were evaluated by flow cytometry and the histograms were analyzed by Modfit (Verify Software House, Topsham, ME) using single-cut, debris stripping [25]. Cutoff points were determined by calibrating S-phase fraction with clinical outcome in a group of more than 28,800 patients with breast cancer (low, <6%; intermediate, 6–10%; high >10%) [26].
Statistical Methods
Patient and tumor characteristics were summarized in the 2,567 patients with EGFR data, and the relationships between these characteristics and EGFR status were examined using descriptive statistics and the chi-squared test. Then, the study dataset was compared to the 44,719 patients without EGFR data in the overall dataset using descriptive statistics, the chi-squared test, and Fisher’s exact test.
Disease-free survival (DFS) was calculated from the diagnostic biopsy date and a first recurrence was scored as an event while patients without an event were censored at the time of death or last follow-up. Overall survival (OS) was calculated from the diagnostic biopsy date and death was scored as an event whereas patients who were alive at the time of last follow-up were censored. Post-relapse survival was calculated from the recurrence date in patients who had a relapse, and death was scored as an event while patients who were alive at the time of last follow-up were censored.
The effects of EGFR status on disease-free, post-relapse, and overall survival were examined by treatment group using Kaplan-Meier curves, and differences in survival were evaluated with the log-rank test. Univariate Cox regression was used to model the effect of EGFR on survival in treatment subgroups. Multivariate analysis assessed the simultaneous importance of EGFR status and other patients and tumor characteristics on DFS and OS by treatment group and Cox regression was used to model the relationships. Final multivariate models were fitted using backwards selection and adjusted hazards ratios, 95% confidence intervals, and p-values were calculated for the final models. All analyses were performed using SAS 9.1 (SAS, Cary, NC) and Stata (Statacorp, College Station, TX).
Results
From a total of 47,286 patients with breast cancer in this database, EGFR status was known on 2,567 tumors. We compared this subset to the entire database and found that it was representative of the patient population (Table 2). Tumors without EGFR data were less likely to over-express HER2 though this was probably due to the play of chance in a small sample size (n=56). Eighteen percent of the dataset we studied over-expressed HER2, which is the expected rate in breast cancer.
Table 2.
Comparison of EGFR dataset to all patients in the database
| Characteristic | EGFR data | No EGFR data | |
|---|---|---|---|
| Age | Number tested | 2552 | 52,293 |
| Median Age | 61 | 62 | |
| < 50 years | 27% | 25% | |
| ≥ 50 years | 73% | 75% | |
| Tumor size | Number tested | 2420 | 50,229 |
| ≤ 2 cm | 51% | 51% | |
| 2 – 5 cm | 42% | 42% | |
| > 5 cm | 7% | 7% | |
| Nodal status | Number tested | 2263 | 48,376 |
| 0 | 62% | 60% | |
| 1–3 | 23% | 23% | |
| > 3 | 15% | 18% | |
| Tumor ploidy | Number tested | 2515 | 4366 |
| % Diploid | 50% | 47% | |
| % Aneuploid | 50% | 53% | |
| S-phase | Number tested | 2251 | 3912 |
| Low | 52% | 52% | |
| Intermediate | 20% | 19% | |
| High | 28% | 28% | |
| ER | Number tested | 2567 | 52,298 |
| Positive | 83% | 82% | |
| Negative | 17% | 18% | |
| PR | Number tested | 2567 | 52,298 |
| Positive | 58% | 60% | |
| Negative | 42% | 40% | |
| HER2 | Number tested | 2200 | 56 |
| Positive | 18% | 7% | |
| Negative | 82% | 93% | |
| Hormone receptor groups | Number tested | 2567 | 52,298 |
| ER+/PR+ | 56% | 57% | |
| ER+/PR− | 27% | 24% | |
| ER−/PR+ | 2% | 3% | |
| ER−/PR− | 14% | 15% |
Of the tumors with known EGFR status, 18% (n=475) were EGFR-positive (≥10 fmol/mg membrane protein) and 82% (n=2092) were EGFR-negative (≤10 fmol/mg). Levels varied widely among EGFR-positive tumors (10–11084 fmol/mg), but 90% of them had concentrations less than 100 fmol/mg (Figure 1).
Figure 1.
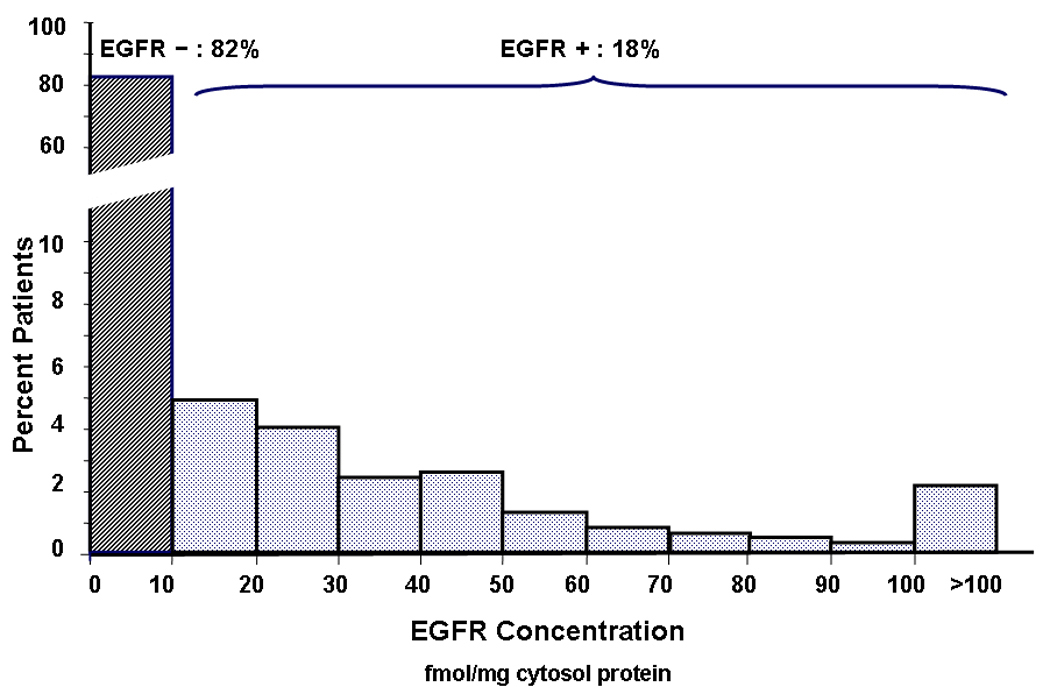
EGFR concentration histogram: EGFR concentration was determined using ligand binding assay. Tumors with protein concentration of ≥10fmol/mg membrane protein were prospectively deemed positive. Of the tumors with known EGFR status, 18% (n=475) were EGFR positive and 82% (n=2092) were EGFR negative. EGFR levels of EGFR-positive tumors varied widely (10–11084 fmol/mg) but 90% had concentrations less than 100 fmol/mg.
Clinical and Biologic Characteristics
Table 1 compares demographic and clinical characteristics between EGFR-positive and negative tumors. Notably, EGFR-positive tumors were more common in women younger than 50 years (40% vs. 24%). Additionally, there were more black women with EGFR-positive than EGFR-negative tumors. EGFR signaling may be a contributing reason to the worse prognosis in these groups.
Table 1.
Clinical and biological characteristics between EGFR-positive and EGFR-negative groups
| Variable | EGFR + | EGFR − | p-value | |
|---|---|---|---|---|
| Age | No. tested | 473 | 2079 | |
| Median age | 54 | 62 | ||
| <50 yrs | 40% | 24% | <0.0001 | |
| ≥50 yrs | 60% | 76% | ||
| Race | No. tested | 401 | 1793 | |
| White | 87% | 92% | ||
| Black | 9% | 6% | 0.0029* | |
| Other | 3% | 2% | 0.1490** | |
| Menopause status | No. tested | 258 | 1459 | |
| Pre/Peri | 20% | 10% | <0.0001 | |
| Post | 80% | 90% | ||
| Histology | No. tested | 475 | 2092 | |
| DCIS/LCIS | 0 | 0 | <0.0001 | |
| IDC | 87% | 81% | ||
| ILC | 3% | 9% | ||
| Other | 10% | 10% | ||
| Tumor size | No. tested | 454 | 1966 | |
| ≤2 cm | 36% | 54% | <0.0001 | |
| >2cm | 64% | 46% | ||
| Nodal status | No. tested | 424 | 1839 | |
| 0 | 57% | 63% | ||
| 1–3 | 26% | 22% | 0.034 | |
| >3 | 17% | 15% | ||
| DNA ploidy | No. tested | 469 | 2046 | |
| % diploid | 32% | 54% | <0.0001 | |
| % aneuploid | 68% | 46% | ||
| S-phase | No. tested | 396 | 1855 | |
| Low | 27% | 57% | ||
| Intermediate | 20% | 21% | <0.0001 | |
| High | 53% | 22% | ||
| ER | No. tested | 475 | 2092 | |
| Positive | 60% | 88% | <0.0001 | |
| Negative | 40% | 12% | ||
| PR | No. tested | 475 | 2092 | |
| Positive | 26% | 65% | <0.0001 | |
| Negative | 74% | 35% | ||
| HER2 | No. tested | 430 | 1770 | |
| Positive | 26% | 16% | <0.0001 | |
| Negative | 74% | 84% | ||
| Hormone receptor groups | No. tested | 475 | 2092 | |
| ER+/PR+ | 23% | 63% | <0.0001 | |
| ER+/PR− | 37% | 25% | ||
| ER−/PR+ | 3% | 2% | ||
| ER−/PR− | 37% | 9% |
This Chi-square test p-value compares the distribution of EGFR status between White and Black patients.
This Fisher’s test p-value compares the distribution of EGFR status between White and Other Race patients.
EGFR-positive tumors were also more likely to be associated with adverse pathologic or biologic characteristics compared to EGFR-negative tumors (Table 1). They were more likely to be larger than 2cm, (64% vs. 46%), aneuploid (68% vs. 46%), and modestly more likely to be node-positive. Strikingly, EGFR-positive tumors were more than twice as likely to have a high proliferative fraction as EGFR-negative tumors, 53% vs. 22% respectively.
HER2 and Hormone Receptor Expression
Other biomarkers were studied to investigate how EGFR correlates to other prognostic markers. EGFR expressing tumors were more likely to over-express HER2 than EGFR-negative tumors, (26% vs. 16%), further indicating the more aggressive nature of this phenotype.
Preclinical and clinical evidence has indicated that growth factor receptor signaling can downregulate hormone receptor expression [6–9, 11–15, 27–34]. We therefore examined the relationship of ER and PR status to EGFR expression in this dataset. EGFR-positive tumors were less likely to express ER than EGFR-negative tumors (60% vs. 88%), and only 26% of EGFR-positive tumors expressed PR compared to 65% of EGFR-negative tumors. EGFR-positive tumors were also more likely to be hormone receptor negative than EGFR-negative tumors (37% vs. 9%).
Currently, there is substantial interest in the ER-negative, PR-negative, and HER2 negative subset of breast cancer. EGFR-positive tumors were four times more likely to have this “triple-negative” phenotype than EGFR-negative tumors (29% vs. 7%). Of 284 patients in our dataset with triple-negative tumors, 48% expressed EGFR (data not shown).
Clinical Outcomes
In our data set, 1068 patients (46%) did not receive any systemic adjuvant therapy and 1256 (54%) did: 529 (23%) received chemotherapy, 497 (21%) hormonal therapy, and 230 (10%) received both. Of patients receiving hormonal therapy, 97% got tamoxifen.
To separate any prognostic effect of EGFR from prediction of treatment effect, outcome was analyzed separately for systemically treated vs. untreated patients. In patients who were not treated with systemic adjuvant therapy, DFS was not significantly different between EGFR-positive and negative groups (HR=1.37, 95%CI=0.85–2.21, p=0.20) (Figure 2A). In contrast, patients who received adjuvant therapy had a significantly worse DFS in the EGFR expressing group (HR=1.77, 95%CI=1.36–2.29, p<0.0001) (Figure 2B), suggesting that EGFR expression may be associated with resistance to some forms of systemic therapy. Findings were very similar in OS analysis as well (data not shown).
Figure 2.
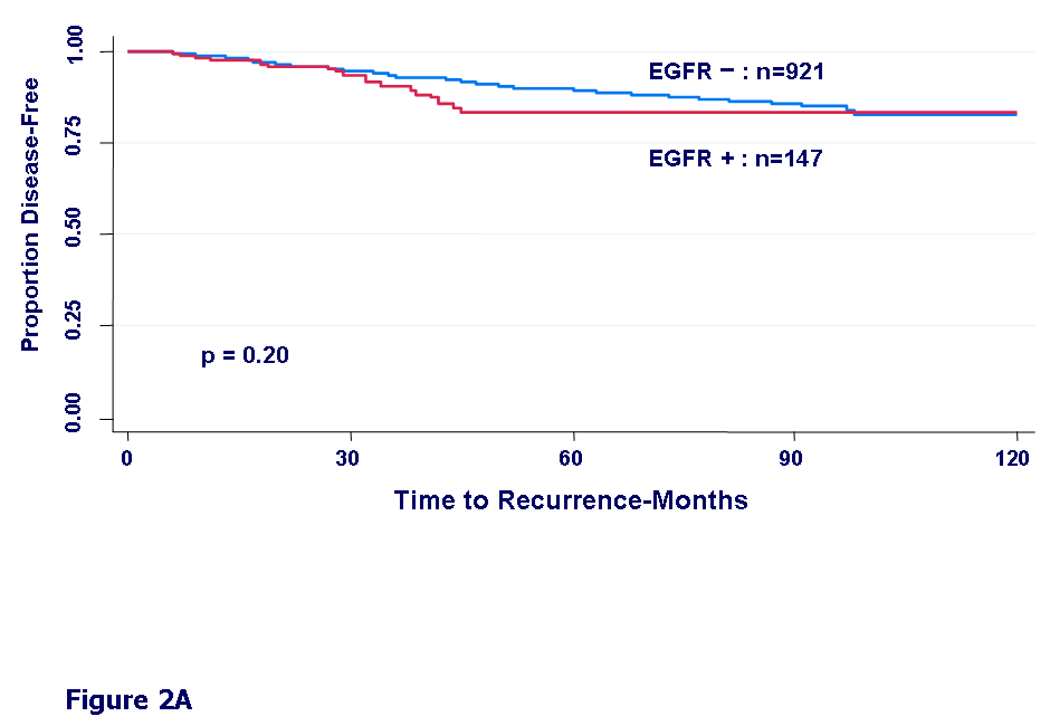
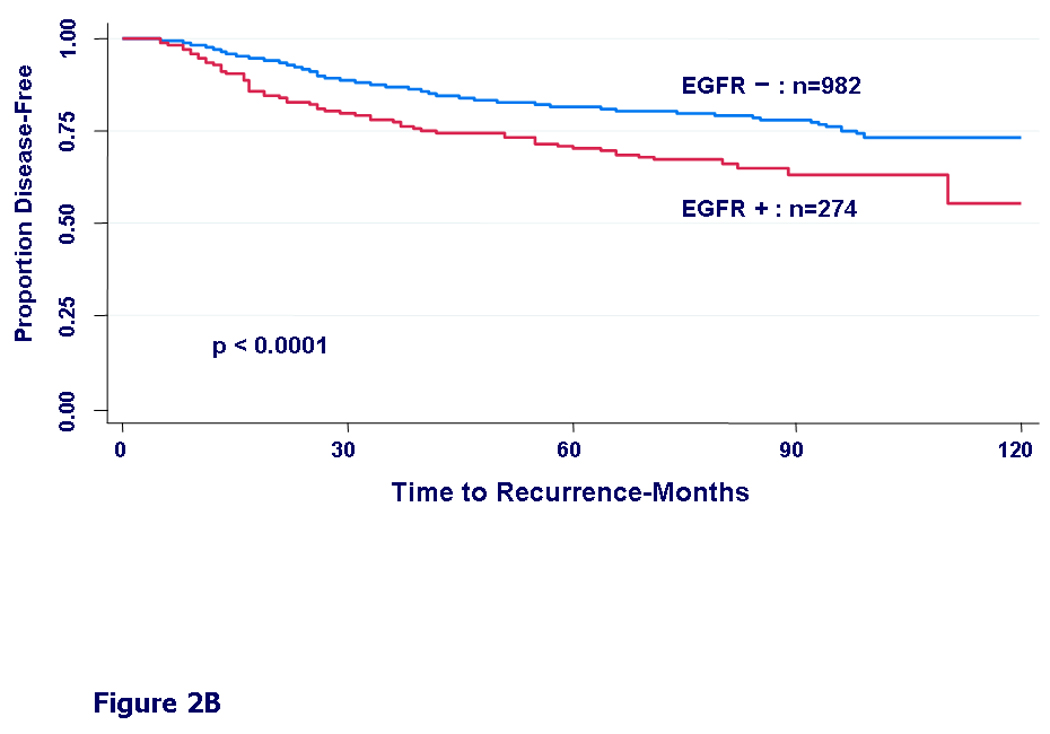
Kaplan-Meier curves for disease-free survival by EGFR status. A) In patients who did not receive any adjuvant systemic therapy (untreated patients), HR = 1.37, 95% CI (0.85 – 2.21), (p=0.20). B) In patients who received any form of adjuvant systemic therapy: chemotherapy, hormonal therapy, or both (treated patients), HR = 1.77, 95% CI (1.36 – 2.29), (p<0.0001).
We then examined DFS by different treatment types. In patients who received only chemotherapy, we found only a non-significant trend towards worse DFS in the EGFR expressing group (HR=1.30, 95%CI=0.91–1.86, p=0.15) (Fig 3A). In patients who received only hormonal therapy, the EGFR-positive group had a significantly worse disease free survival (HR=1.99, 95%CI=1.13–3.49, p=0.015) (Fig 3B). In patients who received both hormonal therapy and chemotherapy, the difference in DFS by EGFR status was even more prominent (HR=2.20, 95%CI=1.30–3.71, p=0.003) (Fig 3C).
Figure 3.
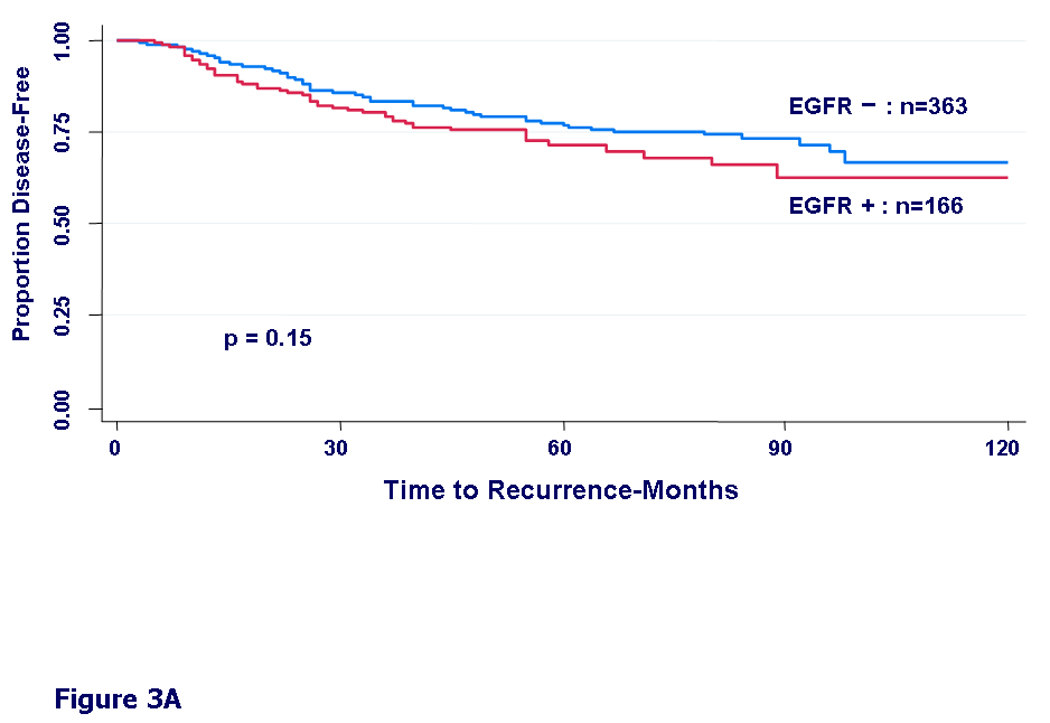
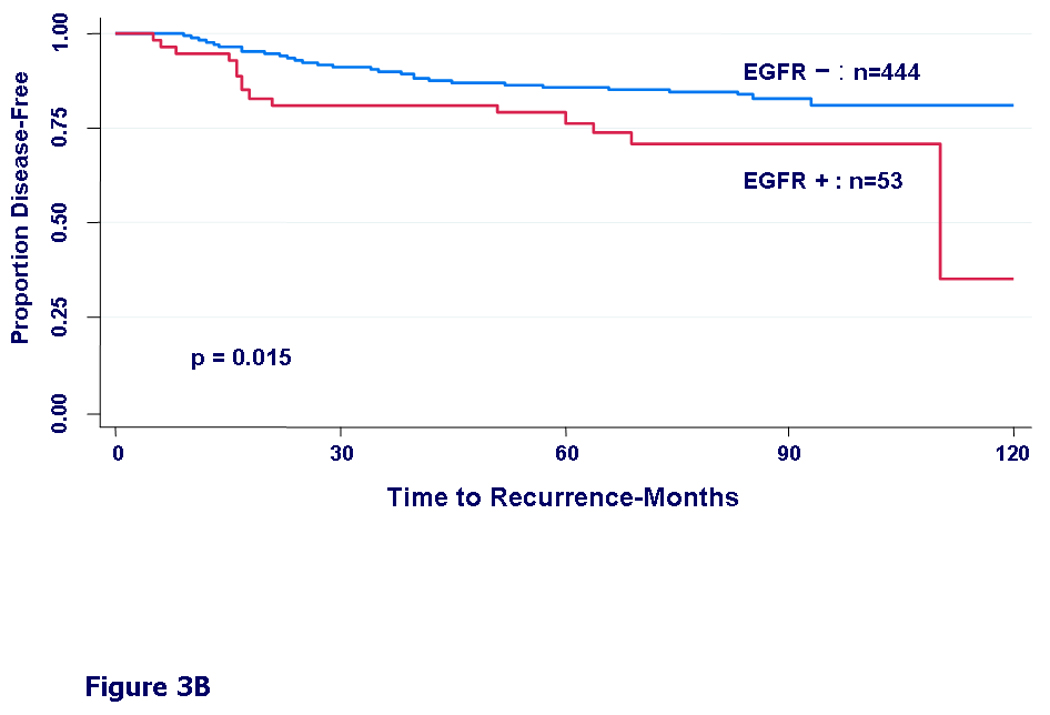
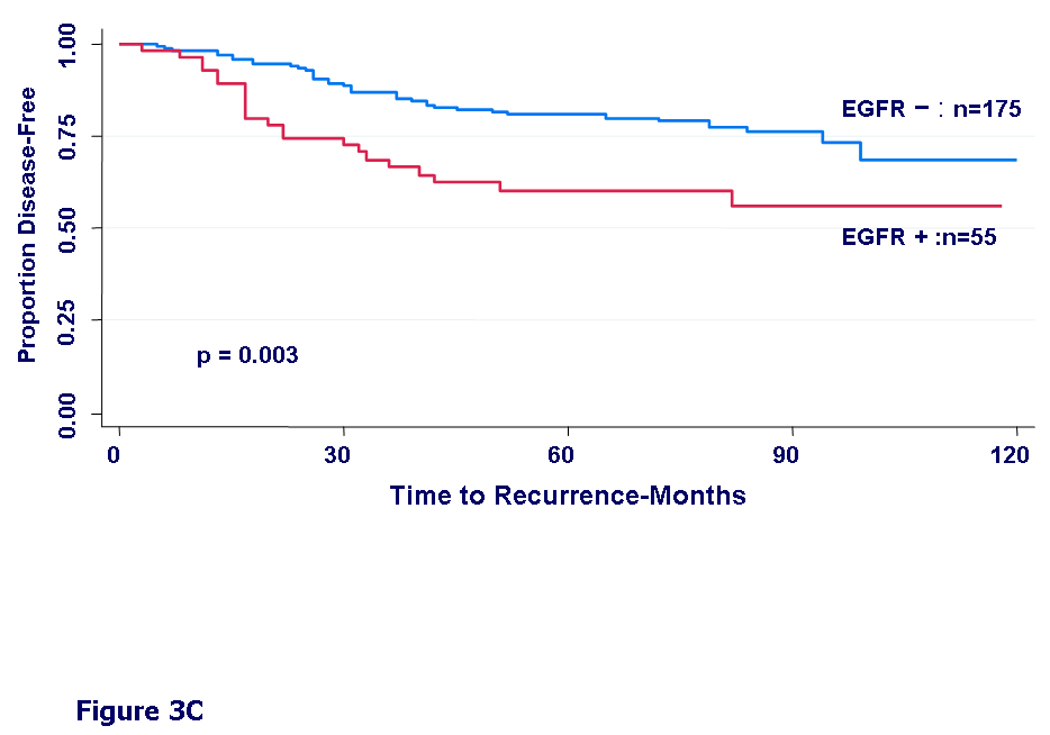
Kaplan-Meier curves for disease-free survival by EGFR status. A) In patients who received any adjuvant chemotherapy, HR = 1.30, 95% CI (0.91 – 1.86), (p=0.15). B) In patients who received adjuvant hormonal therapy, HR = 1.99, 95% CI (1.13 – 3.49), (p=0.015). C) In patients who received both chemotherapy and hormonal therapy, HR = 2.20, 95% CI (1.30 – 3.71), (p=0.003).
Similar patterns were also found in OS in these groups. Specifically, patients who were EGFR-positive and received only chemotherapy had worse OS (HR=1.56, 95%CI=1.09–2.23, p=0.0142), and those who received both hormone therapy and chemotherapy had worse OS than EGFR-negative patients (HR=2.97, 95%CI=1.77–4.99, p<0.0001).
In the subgroup of patients who experienced relapse, patients with EGFR-positive tumors had significantly worse post-relapse survival than patients with EGFR-negative tumors regardless of their treatment status prior to relapse (17 months vs. 28 months, respectively, HR=1.72, 95%CI=1.34–2.20, p<0.0001) (Fig 4).
Figure 4.
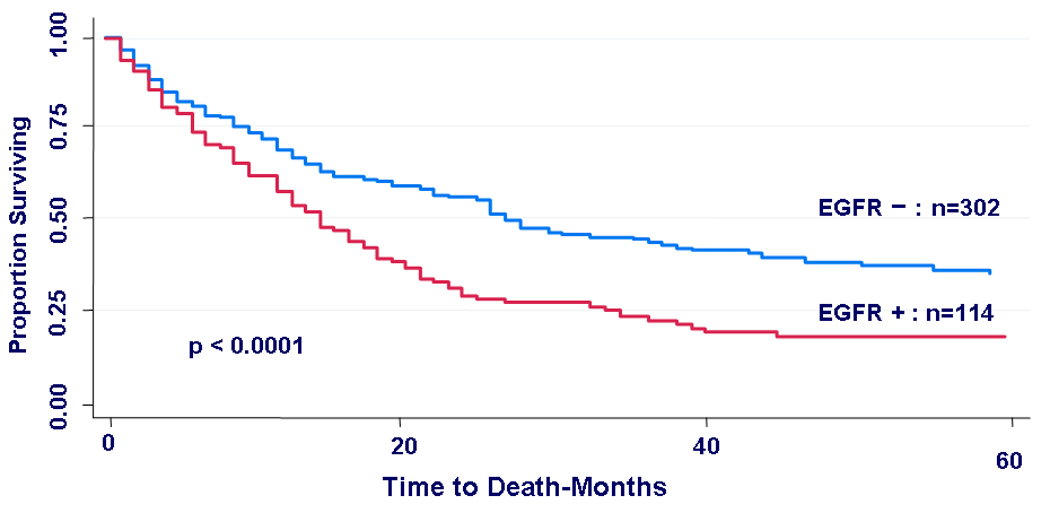
Kaplan-Meier curves for post-relapse survival by EGFR status. In the subgroup that suffered tumor relapse (n=416), patients whose primary tumors were EGFR-positive had a significantly worse post-relapse survival than those with EGFR negative primary tumors, (HR = 1.72, 95% CI (1.34 – 2.20), p < 0.0001).
In multivariate analyses by treatment group, the role of EGFR as a prognostic variable for disease-free survival DFS and OS was evaluated. Variables included were: age, race, tumor size, nodal status, ER, PR, HER2, S-phase fraction, DNA ploidy, and EGFR status. In untreated patients, EGFR was not associated with DFS or OS after adjusting for the effect of other characteristics (data not shown). However, in patients treated with systemic adjuvant therapy, EGFR expression was independently associated with worse DFS and OS. EGFR-positive patients had 66% higher risk of relapse and almost double the risk of death than EGFR-negative patients (DFS adjusted HR=1.66, 95%CI=1.15–2.41, p=0.0074; OS adjusted HR=1.98, 95%CI=1.36–2.88, p=0.0004).
Discussion
This is the largest and most comprehensive study to date analyzing EGFR expression in breast cancer patients. It demonstrates that EGFR expression is associated with an aggressive phenotype with distinct clinical and biologic characteristics. EGFR expressing tumors occurred more often in young and minority women. These tumors were larger and slightly more likely to metastasize to the lymph nodes. They had a substantially higher proliferation rate and greater genomic instability. They were also more likely to co-express HER2 but much less likely to express hormone receptors, especially PR.
EGFR has been extensively studied in the preclinical and clinical settings in different types of cancer. In breast cancer, preclinical evidence has indicated its clear role in increasing proliferation, resistance to apoptosis, and ligand-independent activation of the estrogen receptor, and in mediating hormone therapy resistance [4, 35, 36]. Additionally, activating mutations of pathway elements downstream of EGFR in cancer cells may render them resistant to EGFR inhibition [37]. This was recently shown in colon and lung cancers [38–40].
In the clinical setting, multiple studies have examined EGFR expression in breast cancer, but results have varied possibly due to relatively small sample sizes and non-uniform methodologies for the measurement of EGFR [31, 37, 41]. These studies reported that EGFR is expressed in 15%– 45% of breast tumors, is inversely related to hormone receptor expression, and they inconsistently linked EGFR expression to poor prognosis [6–15, 41, 42]. A recent study utilized a quantitative immunofluorescence-based technology to measure EGFR in a subset of premenopausal women treated with adjuvant tamoxifen [43]. The authors found EGFR in 39% of the tumors they tested, and linked its expression to higher tumor grade and worse clinical outcome in patients treated with tamoxifen but not in untreated patients. However, that study found no correlation with tumor size, lymph node status or co-expression of HER2. This technology is promising and warrants further study.
The present study sought to overcome these deficiencies by analyzing frozen tumors from a large number of patients. EGFR expression was objectively quantified by ligand binding assay and all measurements were performed at a central lab with strict quality control.
Only a minority of breast cancer specimens (18%) expressed EGFR and apparently only low levels are needed to exert an effect on biologic and clinical characteristics. The association with a different biology, such as down-regulation of ER or PR, was strong– 37% of EGFR-positive tumors were negative for both ER and PR compared to only 9% of EGFR-negative tumors, representing a fourfold difference. b
This study provides further evidence of the inverse relation between hormone receptor expression and growth factor receptor expression and signaling, in this case EGFR. This relationship was most pronounced with PR expression, where only a quarter of EGFR-positive tumors expressed PR compared to almost two thirds of the EGFR-negative tumors.
In recent years, DNA microarray profiling studies on breast tumors defined distinct subtypes of breast carcinomas and linked them to varying clinical outcomes [44, 45]. Basal-type breast cancer is one such subtype that has been associated with EGFR expression [46, 47] and a poorer prognosis [44, 48]. The triple-negative phenotype (ER-negative, PR-negative, HER2-negative) is considered a surrogate for this basal type breast cancer. In our study, nearly half (48%) of these triple-negative tumors were EGFR-positive compared to 18% of the overall study tumors. These findings are also consistent with other studies of triple-negative or basal tumors which also found a higher incidence of EGFR expression [46, 47].
EGFR expression was positively correlated with HER2 over-expression, which has been associated with worse prognosis as well. The two molecules may be potent signaling partners, and based on animal models, effective EGFR and HER2 double blockade may result in improved clinical therapies and thus warrants further study in the clinical setting.
One of our most intriguing findings is the association of EGFR expression with clinical outcome. There were notable associations between EGFR expression and worse DFS and OS in patients who received systemic treatment (chemotherapy, tamoxifen, or both) but not in those who did not receive systemic therapy.
These findings have two possible explanations. First, the two groups were unbalanced in regards to a number of factors. As expected, the untreated patients tended to have tumors with more favorable clinical and biologic features (Table 4). If the event rate in this group is relatively low, the effect of EGFR expression would need even larger numbers to become evident. In a higher risk population with greater event rates, the adverse prognostic effect of EGFR would be more clearly discernable.
Table 4.
Comparison of tumor characteristics by treatment group
| Any Treatment (n=1256) |
No Treatment (n=1068) |
p-value | ||
|---|---|---|---|---|
| EGFR | EGFR+ | 22% | 14% | p < 0.0001 |
| EGFR− | 78 | 86% | ||
| Age (years) | Median Age | 57 | 65 | |
| < 50 years | 34% | 18% | p < 0.0001 | |
| ≥ 50 years | 66% | 82% | ||
| Tumor Size (cm) | > 2 cm | 55% | 41% | |
| ≤ 2 cm | 45% | 59% | p < 0.0001 | |
| Positive Nodes | > 3 | 22% | 6% | |
| 1–3 | 30% | 14% | p < 0.0001 | |
| 0 | 48% | 80% | ||
| Tumor Ploidy | Aneuploid | 53% | 45% | |
| Diploid | 47% | 55% | p = 0.0002 | |
| S-phase | High | 31% | 22% | |
| Intermediate | 21% | 19% | p < 0.0001 | |
| Low | 47% | 58% | ||
| ER | Negative | 18% | 14% | |
| Positive | 82% | 86% | p = 0.0118 | |
| PR | Negative | 42% | 41% | |
| Positive | 58% | 59% | p = 0.6068 | |
| HER2 | Positive | 19% | 16% | |
| Negative | 81% | 84% | p = 0.0560 |
Alternatively, EGFR may result in poorer outcome by causing resistance to systemic treatments. In support of this, EGFR expression has been associated with resistance to hormone therapy and chemotherapy in a number of studies [9, 11, 43, 49–51]. These two possible possibilities may also explain the significant difference in post-relapse survival between patients with EGFR-positive and EGFR-negative tumors.
Targeting EGFR therapeutically resulted in limited efficacy with the use of small molecules such as gefitinib and erlotinib [52–54], or with monoclonal antibodies such as cetuximab [55]. Reasons for this may be the complexity and redundancy of its signaling network, and therefore, multiple points in the pathway may need to be blocked [56]. Unlike lung cancer, there is no evidence that altered forms of the receptor influence the efficacy of current therapeutics [57, 58]. However, there may be activating mutations of downstream components of the signaling axis. Recent evidence shows that downstream mutations in K-RAS limits response to EGFR targeted therapies in colon and lung cancer [38–40] and warrants investigation in breast cancer. Additionally, there is a clear need for technologies that functionally or globally assess the activated status of EGFR and related downstream pathways.
This study has several limitations: It is a retrospective review of a non-randomized database collected over a long period of time. Treatment was not controlled or specified, and chemotherapy was heterogeneous, although most patients received CMF or a CMF-like regimen. However, this remains the largest and most comprehensive study of EGFR in breast cancer. It provides further insight into this so-far elusive biomarker, its effect on tumor biology, and its clinical impact.
EGFR needs to be studied as part of a robust signaling network with multiple signaling partners, intricate downstream components, and crosstalk with other pathways. Only small amounts of this receptor may need to be expressed to exert an effect on tumors. Assessment of the EGFR pathway may also need a functional assay to discern its signaling activity. This may help identify subgroups of patients in whom EGFR or related pathways play an important role, and may enable specific and effective inhibition of these active signaling elements by targeting EGFR, its signaling partners, or downstream pathways. This may be the best way to realize the promise of EGFR as a biomarker and therapeutic target, a promise that is earnestly awaited and long overdue.
Table 3.
Final fitted model of main effects on survival
| Variable | Treated Multivariate DFS HR (95% CI) |
Treated Multivariate DFS p-value |
Treated Multivariate OS HR (95% CI) |
Treated Multivariate OS p-value |
|---|---|---|---|---|
| EGFR positive vs. EGFR negative | 1.66 (1.145, 2.408) | 0.0074 | 1.98 (1.360, 2.880) | 0.0004 |
| Race: black vs. white | 1.96 (1.143, 3.370) | 0.0145 | 2.94 (1.765, 4.887) | < 0.0001 |
| Tumor size: > 2 cm vs. ≤ 2 cm | . | . | 2.08 (1.413, 3.064) | 0.0002 |
| Node positive vs. node negative | 2.72 (1.875, 3.939) | < 0.0001 | 2.15 (1.478, 3.136) | < 0.0001 |
| Age: ≥ 50 yrs vs. < 50 yrs | . | . | 1.51 (1.039, 2.193) | 0.0308 |
Acknowledgments
This work was supported in part by NIH grants P50 CA58183 (SPORE) and P01 CA30195.
References
- 1.Citri A, Yarden Y. EGF-ERBB signalling: towards the systems level. Nat Rev Mol Cell Biol. 2006;7(7):505–516. doi: 10.1038/nrm1962. [DOI] [PubMed] [Google Scholar]
- 2.Nicholson RI, Gee JM, Harper ME. EGFR and cancer prognosis. Eur J Cancer. 2001;37 suppl 4:S9–S15. doi: 10.1016/s0959-8049(01)00231-3. [DOI] [PubMed] [Google Scholar]
- 3.Normanno N, et al. Epidermal growth factor receptor (EGFR) signaling in cancer. Gene. 2006;366(1):2–16. doi: 10.1016/j.gene.2005.10.018. [DOI] [PubMed] [Google Scholar]
- 4.Di Fiore PP, et al. Overexpression of the human EGF receptor confers an EGF-dependent transformed phenotype to NIH 3T3 cells. Cell. 1987;51(6):1063–1070. doi: 10.1016/0092-8674(87)90592-7. [DOI] [PubMed] [Google Scholar]
- 5.Massarweh S, et al. Mechanisms of tumor regression and resistance to estrogen deprivation and fulvestrant in a model of estrogen receptor-positive, HER-2/neu-positive breast cancer. Cancer Res. 2006;66(16):8266–8273. doi: 10.1158/0008-5472.CAN-05-4045. [DOI] [PubMed] [Google Scholar]
- 6.Ferrero JM, et al. Epidermal growth factor receptor expression in 780 breast cancer patients: a reappraisal of the prognostic value based on an eight-year median follow-up. Ann Oncol. 2001;12(6):841–846. doi: 10.1023/a:1011183421477. [DOI] [PubMed] [Google Scholar]
- 7.Fox SB, et al. The epidermal growth factor receptor as a prognostic marker: results of 370 patients and review of 3009 patients. Breast Cancer Res Treat. 1994;29(1):41–49. doi: 10.1007/BF00666180. [DOI] [PubMed] [Google Scholar]
- 8.Knoop AS, et al. Value of epidermal growth factor receptor, HER2, p53, and steroid receptors in predicting the efficacy of tamoxifen in high-risk postmenopausal breast cancer patients. J Clin Oncol. 2001;19(14):3376–3384. doi: 10.1200/JCO.2001.19.14.3376. [DOI] [PubMed] [Google Scholar]
- 9.Klijn JG, et al. The clinical significance of epidermal growth factor receptor (EGF-R) in human breast cancer: a review on 5232 patients. Endocr Rev. 1992;13(1):3–17. doi: 10.1210/edrv-13-1-3. [DOI] [PubMed] [Google Scholar]
- 10.Newby JC, et al. Expression of epidermal growth factor receptor and c-erbB2 during the development of tamoxifen resistance in human breast cancer. Clin Cancer Res. 1997;3(9):1643–1651. [PubMed] [Google Scholar]
- 11.Nicholson RI, et al. Epidermal growth factor receptor expression in breast cancer: association with response to endocrine therapy. Breast Cancer Res Treat. 1994;29(1):117–125. doi: 10.1007/BF00666187. [DOI] [PubMed] [Google Scholar]
- 12.Pawlowski V, et al. Prognostic value of the type I growth factor receptors in a large series of human primary breast cancers quantified with a real-time reverse transcription-polymerase chain reaction assay. Clin Cancer Res. 2000;6(11):4217–4225. [PubMed] [Google Scholar]
- 13.Tsutsui S, et al. Prognostic value of epidermal growth factor receptor (EGFR) and its relationship to the estrogen receptor status in 1029 patients with breast cancer. Breast Cancer Res Treat. 2002;71(1):67–75. doi: 10.1023/a:1013397232011. [DOI] [PubMed] [Google Scholar]
- 14.Rampaul RS, et al. Clinical value of epidermal growth factor receptor expression in primary breast cancer. Adv Anat Pathol. 2005;12(5):271–273. doi: 10.1097/01.pap.0000184178.43048.80. [DOI] [PubMed] [Google Scholar]
- 15.Skasko E, Paszko Z, Mazur S. A new look at the prognostic value of the estrogen, progesterone and epidermal growth factor receptors in breast cancer tissue. Neoplasma. 2005;52(1):10–17. [PubMed] [Google Scholar]
- 16.Lowry OH, et al. Protein measurement with the Folin phenol reagent. J Biol Chem. 1951;193(1):265–275. [PubMed] [Google Scholar]
- 17.Klijn JG, et al. The clinical significance of epidermal growth factor receptor (EGF-R) in human breast cancer: a review on 5232 patients. Endocr Rev. 1992;13(1):3–17. doi: 10.1210/edrv-13-1-3. [DOI] [PubMed] [Google Scholar]
- 18.Ciocca DR, et al. Correlation of HER-2/neu amplification with expression and with other prognostic factors in 1103 breast cancers. J Natl Cancer Inst. 1992;84(16):1279–1282. doi: 10.1093/jnci/84.16.1279. [DOI] [PubMed] [Google Scholar]
- 19.Tandon AK, Clark GM, Chamness GC, Ullrich A, McGuire WL. HER-2 / neu oncogene protein and prognosis in breast cancer. J Clin Oncol. 1989;7:1120–1128. doi: 10.1200/JCO.1989.7.8.1120. [DOI] [PubMed] [Google Scholar]
- 20.McGuire WL, De La Garza M, Chamness GC. Evaluation of estrogen receptor assays in human breast cancer tissue. Cancer Res. 1977;37(3):637–639. [PubMed] [Google Scholar]
- 21.Powell B, et al. Measurement of progesterone receptor in human breast cancer biopsies. Cancer Res. 1979;39(5):1678–1682. [PubMed] [Google Scholar]
- 22.Ravdin PM, et al. Prognostic significance of progesterone receptor levels in estrogen receptor-positive patients with metastatic breast cancer treated with tamoxifen: results of a prospective Southwest Oncology Group study. J Clin Oncol. 1992;10(8):1284–1291. doi: 10.1200/JCO.1992.10.8.1284. [DOI] [PubMed] [Google Scholar]
- 23.Bardou VJ, et al. Progesterone receptor status significantly improves outcome prediction over estrogen receptor status alone for adjuvant endocrine therapy in two large breast cancer databases. J Clin Oncol. 2003;21(10):1973–1979. doi: 10.1200/JCO.2003.09.099. [DOI] [PubMed] [Google Scholar]
- 24.Clark GM, Osborne CK, McGuire WL. Correlations between estrogen receptor, progesterone receptor and patient characteristics in human breast cancer. Journal of Clinical Oncology. 1984;2(10):1102–1109. doi: 10.1200/JCO.1984.2.10.1102. [DOI] [PubMed] [Google Scholar]
- 25.Wenger CR, Clark GM. S-phase fraction and breast cancer -- a decade of experience. Breast Cancer Res Treat. 1998;51:255–265. doi: 10.1023/a:1006188512927. [DOI] [PubMed] [Google Scholar]
- 26.Wenger CR, Clark GM. S-phase fraction and breast cancer - a decade of experience. Brease Cancer Research and Treatment. 1998;51:255–265. doi: 10.1023/a:1006188512927. [DOI] [PubMed] [Google Scholar]
- 27.Huang H, et al. Association between tumor characteristics and HER-2/neu by immuniohistochemistry in 1362 women with primary operable breast cancer. J Clin Pathol. 2005;58:611–616. doi: 10.1136/jcp.2004.022772. [DOI] [PMC free article] [PubMed] [Google Scholar]
- 28.Balleine RL, et al. Absence of progesterone receptor associated with secondary breast cancer in postmenopausal women. Br J Cancer. 1999;79(9–10):1564–1571. doi: 10.1038/sj.bjc.6690249. [DOI] [PMC free article] [PubMed] [Google Scholar]
- 29.Dowsett M, et al. Effect of raloxifene on breast cancer cell Ki67 and apoptosis: a double-blind, placebo-controlled, randomized clinical trial in postmenopausal patients. Cancer Epidemiol Biomarkers Prev. 2001;10(9):961–966. [PubMed] [Google Scholar]
- 30.Bamberger AM, et al. Progesterone receptor isoforms, PR-B and PR-A, in breast cancer: correlations with clinicopathologic tumor parameters and expression of AP-1 factors. Horm Res. 2000;54(1):32–37. doi: 10.1159/000063434. [DOI] [PubMed] [Google Scholar]
- 31.Arpino G, et al. HER-2 amplification, HER-1 expression, and tamoxifen response in estrogen receptor-positive metastatic breast cancer: a Southwest Oncology Group study. Clin Cancer Res. 2004;10(17):5670–5676. doi: 10.1158/1078-0432.CCR-04-0110. [DOI] [PubMed] [Google Scholar]
- 32.Arpino G, et al. Estrogen receptor-positive, progesterone receptor-negative breast cancer: association with growth factor receptor expression and tamoxifen resistance. J Natl Cancer Inst. 2005;97(17):1254–1261. doi: 10.1093/jnci/dji249. [DOI] [PubMed] [Google Scholar]
- 33.Konecny G, et al. Quantitative association between HER-2/neu and steroid hormone receptors in hormone receptor-positive primary breast cancer. J Natl Cancer Inst. 2003;95(2):142–153. doi: 10.1093/jnci/95.2.142. [DOI] [PubMed] [Google Scholar]
- 34.Dowsett M, et al. Benefit from adjuvant tamoxifen therapy in primary breast cancer patients according to oestrogen receptor, progesterone receptor, EGF receptor and HER2 status. Ann Oncol. 2006;17(5):818–826. doi: 10.1093/annonc/mdl016. [DOI] [PubMed] [Google Scholar]
- 35.Massarweh S, Schiff R. Resistance to endocrine therapy in breast cancer: exploiting estrogen receptor/growth factor signaling crosstalk. Endocr Relat Cancer. 2006;13 Suppl 1:S15–S24. doi: 10.1677/erc.1.01273. [DOI] [PubMed] [Google Scholar]
- 36.Massarweh S, et al. Tamoxifen resistance in breast tumors is driven by growth factor receptor signaling with repression of classic estrogen receptor genomic function. Cancer Res. 2008;68(3):826–833. doi: 10.1158/0008-5472.CAN-07-2707. [DOI] [PubMed] [Google Scholar]
- 37.She QB, Solit DB, Ye Q, O'Reilly KE, Lobo J, Rosen N. The BAD protein integrates survival signaling by EGFR/MAPK and PI3K/Akt kinase pathways in PTENdeficient tumor cells. Cancer Cell. 2005;8(4):287–297. doi: 10.1016/j.ccr.2005.09.006. [DOI] [PMC free article] [PubMed] [Google Scholar]
- 38.Bokemeyer C, Bondarenko I, Hartmann JT, De Braud FG, Volovat C, Nippgen J, Stroh C, Celik I, Koralewski P. KRAS status and efficacy of first-line treatment of patients with metastatic colorectal cancer (mCRC) with FOLFOX with or without cetuximab: The OPUS experience. J Clin Oncol. 2008;26(May 20 suppl) abstr 4000. [Google Scholar]
- 39.Darwish S, Ludovini V, Pistola L, Bianconi F, Betti M, Chiari R, Sidoni A, Giuffrida D, Tofanetti FR, Flacco A, Crinò L. EGFR, KRAS, PIK3CA mutations and response to tyrosine kinase inhibitors (TKIs) in advanced NSCLC patients. J Clin Oncol. 2008;26(May 20 Suppl) abstr 22003. [Google Scholar]
- 40.Van Cutsem E, Lang I, D'haens G, Moiseyenko V, Zaluski J, Folprecht G, Tejpar S, Kisker O, Stroh C, Rougier P. KRAS status and efficacy in the first-line treatment of patients with metastatic colorectal cancer (mCRC) treated with FOLFIRI with or without cetuximab: The CRYSTAL experience. J Clin Oncol. 2008;26(May 20 suppl) abstr 2. [Google Scholar]
- 41.Chan SK, Hill ME, Gullick WJ. The role of the epidermal growth factor receptor in breast cancer. J Mammary Gland Biol Neoplasia. 2006;11(1):3–11. doi: 10.1007/s10911-006-9008-2. [DOI] [PubMed] [Google Scholar]
- 42.Emlet DR, et al. HER2 expression as a potential marker for response to therapy targeted to the EGFR. Br J Cancer. 2006;94(8):1144–1153. doi: 10.1038/sj.bjc.6603078. [DOI] [PMC free article] [PubMed] [Google Scholar]
- 43.Giltnane JM, et al. Quantitative measurement of epidermal growth factor receptor is a negative predictive factor for tamoxifen response in hormone receptor positive premenopausal breast cancer. J Clin Oncol. 2007;25(21):3007–3014. doi: 10.1200/JCO.2006.08.9938. [DOI] [PubMed] [Google Scholar]
- 44.Sorlie T, et al. Gene expression patterns of breast carcinomas distinguish tumor subclasses with clinical implications. Proc Natl Acad Sci U S A. 2001;98(19):10869–10874. doi: 10.1073/pnas.191367098. [DOI] [PMC free article] [PubMed] [Google Scholar]
- 45.Perou CM, et al. Molecular portraits of human breast tumours. Nature. 2000;406(6797):747–752. doi: 10.1038/35021093. [DOI] [PubMed] [Google Scholar]
- 46.Livasy CA, et al. Phenotypic evaluation of the basal-like subtype of invasive breast carcinoma. Mod Pathol. 2006;19(2):264–271. doi: 10.1038/modpathol.3800528. [DOI] [PubMed] [Google Scholar]
- 47.Nielsen TO, et al. Immunohistochemical and clinical characterization of the basal-like subtype of invasive breast carcinoma. Clin Cancer Res. 2004;10(16):5367–5374. doi: 10.1158/1078-0432.CCR-04-0220. [DOI] [PubMed] [Google Scholar]
- 48.van 't Veer LJ, et al. Gene expression profiling predicts clinical outcome of breast cancer. Nature. 2002;415(6871):530–536. doi: 10.1038/415530a. [DOI] [PubMed] [Google Scholar]
- 49.Shou J, et al. Mechanisms of tamoxifen resistance: increased estrogen receptor- HER2/neu cross-talk in ER/HER2-positive breast cancer. J Natl Cancer Inst. 2004;96(12):926–935. doi: 10.1093/jnci/djh166. [DOI] [PubMed] [Google Scholar]
- 50.Massarweh S, et al. Tamoxifen resistance in breast tumors is driven by growth factor receptor signaling with repression of classical estrogen receptor genomic function. Cancer Res. 2007 doi: 10.1158/0008-5472.CAN-07-2707. In press. [DOI] [PubMed] [Google Scholar]
- 51.Yarden Y, Sliwkowski MX. Untangling the ErbB signalling network. Nat Rev Mol Cell Biol. 2001;2(2):127–137. doi: 10.1038/35052073. [DOI] [PubMed] [Google Scholar]
- 52.Albain K, Elledge RM, Gradishar WJ, Hayes DF, Rowinsky E, Hudis C, Pusztai L, Tripathy D, Modi S, Rubi S. Open-label, phase II, multicenter trial of ZD1839 (‘Iressa’) in patients with advanced breast cancer; San Antonio Breast Cancer Symposium; San Antonio. 2002. [Google Scholar]
- 53.Osborne CK, Neven P, Dirix L, Mackey J, Robert J, Underhill C, Gutierrez C, Magill P, Hargreaves L. Randomized phase II study of gefitinib (Iressa) or placebo in combination with tamoxifen in patients with hormone receptor positive metastatic breast cancer. Breast Cancer Research and Treatment. 2007;106(S1):1–350. [Google Scholar]
- 54.Polychronis A, et al. Preoperative gefitinib versus gefitinib and anastrozole in postmenopausal patients with oestrogen-receptor positive and epidermal-growth-factor-receptor-positive primary breast cancer: a double-blind placebo-controlled phase II randomised trial. Lancet Oncol. 2005;6(6):383–391. doi: 10.1016/S1470-2045(05)70176-5. [DOI] [PubMed] [Google Scholar]
- 55.Carey LA, Rugo HS, Marcom PK, Irvin W, Ferraro M, Burrows E, He X, Perou CM, Winer EP on behalf of the Translational Breast Cancer Research Consortium. TBCRC 001: EGFR inhibition with cetuximab added to carboplatin in metastatic triplenegative (basal-like) breast cancer. J Clin Oncol. 2008;26 abstr 1009. [Google Scholar]
- 56.Bianco R, et al. Loss of PTEN/MMAC1/TEP in EGF receptor-expressing tumor cells counteracts the antitumor action of EGFR tyrosine kinase inhibitors. Oncogene. 2003;22(18):2812–2822. doi: 10.1038/sj.onc.1206388. [DOI] [PubMed] [Google Scholar]
- 57.Paez JG, et al. EGFR mutations in lung cancer: correlation with clinical response to gefitinib therapy. Science. 2004;304(5676):1497–1500. doi: 10.1126/science.1099314. [DOI] [PubMed] [Google Scholar]
- 58.Lynch TJ, et al. Activating mutations in the epidermal growth factor receptor underlying responsiveness of non-small-cell lung cancer to gefitinib. N Engl J Med. 2004;350(21):2129–2139. doi: 10.1056/NEJMoa040938. [DOI] [PubMed] [Google Scholar]