

Abstract
The aim of this study was to define novel mediators of tubule injury in diabetic kidney disease. For this, we used state-of-the-art proteomic methods combined with a label-free quantitative strategy to define protein expression differences in kidney tubules from transgenic OVE26 type 1 diabetic and control mice. The analysis was performed with diabetic samples that displayed a pro-fibrotic phenotype. We have identified 476 differentially expressed proteins. Bioinformatic analysis indicated several clusters of regulated proteins in relevant functional groups such as TGF-β signaling, tight junction maintenance, oxidative stress, and glucose metabolism. Mass spectrometry detected expression changes of four physiologically relevant proteins were confirmed by immunoblot analysis. Of these, the Grb2-related adaptor protein (GRAP) was up-regulated in kidney tubules from diabetic mice and fibrotic kidneys from diabetic patients, and subsequently confirmed as a novel component of TGF-β signaling in cultured human renal tubule cells. Thus, indicating a potential novel role for GRAP in TGF-β-induced tubule injury in diabetic kidney disease. Although we targeted a specific disease, this approach offers a robust, high-sensitivity methodology that can be applied to the discovery of novel mediators for any experimental or disease condition.
Introduction
Diabetic nephropathy (DN) is the leading cause of end-stage renal disease (ESRD) in the United States, and the number of diabetics with renal failure is expected to grow in the coming years [1, 2]. Although optimizing glycemic and blood pressure control and inhibition of the renin-angiotensin system can slow progression of DN, no treatment completely prevents progression to ESRD [3]. This emphasizes the importance of discovering novel regulatory events that may serve as therapeutic targets. Tubulointerstitial fibrosis (TIF) is manifest by pro-fibrotic activation of renal tubule cells and is a prominent feature of progressive DN [4]. Thus, discovery of novel mediators of TIF in DN will provide important insights into the development of improved diagnostic, prevention, and treatment strategies.
Proteomics technologies have played an integral role in the discovery of regulatory molecular events in disease (reviewed in [5, 6]). Conventional 2D-gel based methods have proven to be one of the most reliable quantitative proteomic approaches, but the overall sensitivity of protein identification is dramatically improved with state-of-the-art methods that couple two-dimensional capillary liquid chromatography and tandem mass spectrometry (2D-LC-MS/MS) analysis [7, 8]. This has lead to the development of a number of methods for effective quantitative assessment of LC-MS/MS data (reviewed in [9]).
Label-free methods have emerged as the quantitative approach of choice for LC-MS/MS analysis. Experiments demonstrating a linear correlation of inherent MS/MS values with peptide or protein concentration have established the framework for effective quantitative analysis [10, 11]. One such approach termed “spectral counting” uses the number of unique or total MS/MS spectra that match to each identified protein in a selected database [10]. Using this spectral counting premise, we have derived a protein abundance factor (PAF) [8, 12]. This value estimates the relative abundance of each identified protein by normalizing the number of non-redundant MS/MS spectra matching to the protein by its predicted molecular weight. Although PAF-based assessment has been successful in the development of statistical models based on large 2D-LC-MS/MS experimental datasets and has led to the discovery of novel regulatory protein-protein interactions [8, 13–15], this approach has not been routinely applied to quantitative assessment and comparison of proteins in disease versus control tissue.
In the present study we performed label-free quantitative LC-MS/MS analysis of tubule extracts from fibrotic kidneys of transgenic OVE26 type 1 diabetic mice to elucidate novel candidate regulators of tubule damage in DN. Overall, we identified 476 significantly differentially abundant proteins in samples from diabetic versus control mice. This list contains known mediators of diabetic kidney disease, biologically relevant proteins, as well as intriguing candidate proteins with uncharacterized roles in kidney biology or disease. One of these candidates, Grb2-Related Adaptor Protein (GRAP), was confirmed as a novel regulator of TGF-β signaling in renal tubule cells. This has important implications because of the prominent role TGF-β plays in kidney injury in chronic kidney disease.
Methods
Mice
All studies were performed with transgenic OVE26 type 1 diabetic and FVB background control strain mice (Jackson Laboratory, Bar Harbor, Maine). All animal procedures adhered to the guidelines of the National Institutes of Health Guide for the Care and Use of Laboratory Animals and were approved by the University of Louisville Institutional Animal Care and Use Committee. There was also internal review board approval for immunostaining of kidney biopsy sections obtained from diabetic and normal individuals.
Isolation of Kidney Tubule Cells
Kidney cortical tubular cells were separated from glomeruli as previously described [16]. Purity (~95%) was confirmed by light microscopy. Tissue was lysed using a 1:1 volume of buffer containing 10% glycerol, 50 mM Hepes, pH 8.0, 100 mM KCl, 2 mM EDTA, 0.1% NP-40, 2 mM DTT, 1X Sigma protease inhibitor cocktail, 10 mM NaF, and 0.25 mM NaVO4. Lysate was prepared by 5 minute sonication, incubation on ice for 1 hour, and centrifugation at 12,000 × g for 30 minutes. Protein concentration was estimated using the BCA method. Approximately 2 mg/ml was recovered for each sample.
2D-LC-MS/MS Analysis
2D-LC-MS/MS experiments were performed on renal tubule extracts from two control and two OVE26 diabetic mice. This relatively small animal group (n=2) was employed because immublot profiling indicated that this sample set has a comparative molecular phenotype of interest (Figure 1). A third comparative experiment was performed using pooled samples from each group. Tubule cell lysates (10 μg) were spiked with two different recombinant protein standards for spectral count normalization (Env (500 ng) and GP160/36 (300 ng) from Bioclone Inc.) and digested with modified trypsin (Promega) overnight at 37 °C using a previously described method [8]. Resulting peptides were loaded onto an analytical 2D capillary chromatography column packed with 3–4 cm of 5-μm strong cation exchange (SCX) resin (Phenomenex, Torrance, CA) followed by 2–3 cm of 5-μm C18 reversed-phase (RP) resin (Phenomenex). The biphasic column was attached to an analytical RP chromatography column (100 × 365 μm fused silica capillary with an integrated, laser pulled emitter tip packed with 10 cm of Synergi 4 μm RP80A (Phenomenex)). Peptides were eluted from SCX with seven step gradients of 5%, 10%, 15%, 30%, 50%, 70% and 100% of 500 mM ammonium acetate. Following each SCX elution step, peptides were ionized and eluted into a linear ion trap mass spectrometer according to the following linear HPLC gradient: 20 min: 0% B, 80 min: 40%B, 90 min: 60%B at a flow rate of 200 nl/min (mobile phase A: 5% acetonitrile/0.1% formic acid and mobile phase B: 80% acetonitrile/0.1% formic acid). Spectra were acquired with a LTQ ion trap mass spectrometer (Thermo Fisher Scientific, Waltham, MA). During LC-MS/MS analysis, the mass spectrometer performed data-dependent acquisition with a full MS scan between 300 and 2000 m/z followed by six MS/MS scans (35% collision energy) on the six most intense ions from the preceding MS scan. Data acquisition was performed using dynamic exclusion with a repeat count of a 1 and 3 min exclusion duration window.
Figure 1. Enhanced Pro-fibrotic signaling phenotype in renal tubules of OVE26 diabetic mice.

Panel of immunoblot analyses showing increased TGF-β, GSK3β, phospho-GSK3β, and C/EBPα and decreased β-catenin levels in renal tubule extracts from OVE26 diabetic mice as compared with samples from background control mice. This expression profile is indicative of a pro-fibrotic signaling phenotype in the diabetic tubule samples. Importantly, these cellular extracts were used for quantitative 2D-LC-MS/MS analysis.
Mass Spectral Data Interpretation
Database analysis was performed with Sequest Sorcerer (Sage-N Research, San Jose, CA). The acquired mass spectrometry data were searched against appropriate translated genome databases (RefSeq Mus musculus, 2007) using the SEQUEST algorithm assuming fixed modification of +57 on C and oxidation of methionine and allowing up to 2 missed tryptic cleavage sites. High-probability peptide and protein identifications were assigned from the SEQUEST results using cross correlation (Xcorr) scores cut-offs of 1.5, 2, and 2.5 for +1, +2 and +3 respective charge states and submitted to an in-house informatics platform for quantitative comparative analysis [17]. The abundance of each identified protein was determined by normalizing the number of unique spectral counts matching to the protein by its predicted molecular weight. This value has been termed a Protein Abundance Factor (PAF) [8, 12]. Comparative analysis across diabetic and control experiments was performed by normalizing each identified protein PAF by PAFs of equally loaded external viral recombinant protein standards described in the 2D-LC-MS/MS section above and in the below equation:
| Equation |
Student t-tests were performed to determine significantly different expression patterns between diabetic and control samples. Changes with p<0.05 were included in a differential expression list. Accession numbers from this list were submitted to informatics analysis using Ingenuity Pathways Knowledge Database to determine the interconnection of these candidates to canonical pathways and literature cited experimentation.
Immunoblot Analysis
Immunoblot experiments were performed with HK11 cells (gift from Dr. Lorraine Racusen, Johns Hopkins University) or renal tubule extracts from diabetic and control mice. Proteins were separated by 4–15% hetergenous SDS-PAGE and transferred to nitrocellulose membranes using the Biorad system. The primary antibodies included β-catenin (610153, BD Transduction Labs, Lexington, KY); TGF-β1 (sc146, Santa Cruz, Santa Cruz, CA); GSK3-α/β (9315, Cell Signaling, Danvers, MA); GSK3-β (SA-414, BioMol, Plymouth Meeting, PA); P-GSK3-β (9336S, Cell Signaling, Danvers, MA); GRAP (ab9703, Abcam, Cambridge, MA); GAPDH (mab374, Millipore, Billerica, MA) Actin (A5060, Sigma Aldrich, St. Louis, MO); and Fibronectin (sc8422, Santa Cruz). All primary antibodies were used at ~1 μg/ml in TTBS, 5% milk and appropriate secondary antibody at 1:4000 in TTBS, 5% milk. Membranes were probed with primary antibody overnight and secondary antibody for 1 hour. Following each step the membranes were washed 5 times for 5 minutes in distilled water. Staining was visualized with SuperSignal® chemiluminescent substrate (Pierce, Rockford, IL).
Immunohistochemistry (IHC)
IHC experiments were performed with human kidney biopsy section as previously described [16, 18]. Briefly, experiments used donkey anti-goat generated primary antibody at the following dilution: 1:100 anti-GRAP (Abcam, Cambridge, MA). Kidney sections were blocked, probed with primary antibody, probed with secondary antibody, and treated with ABC reagent using the M.O.M. Peroxidase Kit (PK-2200 from Vector Laboratories Inc., Burlingame, CA) according to the manufacturer’s protocol. For negative controls the primary antibody was replaced with M.O.M antibody diluent from M.O.M. Peroxidase Kit.
Plasmids and Transfections
pCMV-GRAP and pCMV control vectors were purchased from Origene, Rockville, MD. Transfections for the confocal and immunoblot experiments were performed at a ratio of 8:2 (μl reagent (Fugene HD, Roche, Indianapolis, IN):μg DNA) overnight in OPTI-MEM low serum medium (0.5% FBS) with and without 10 ng/ml recombinant TGF-β1 (R&D Systems, Minneapolis, MN). HK11 renal proximal tubule cells were grown in DMEM/F12 supplemented with 100 U/mL penicillin/streptomyocin and 5% fetal bovine serum at 37°C and 5% CO2.
Luciferase Assays
SMAD (100 ng/well in 24 well plate) luciferase reporter assays were performed in the presence or absence of pCMV-GRAP (100 ng) or pCMV (100 ng) vector alone with and without 400 pM recombinant TGF-β (R&D Systems). HK11 cells were transfected with a multiple repeat SMAD response element (AGCCAGACA) as a mixture of inducible SMAD-responsive firefly luciferase construct and constitutively expressing renilla luciferase construct (40:1 ratio) using Fugene HD at an optimized 4:2 μl/μg HD/DNA ratio. Cells were incubated at 37°C (5% CO2) for 48 hours then harvested by passive lysis extraction for 30 minutes at room temperature on a shaker. Approximately 20% of the lysate was loaded into designated wells of a 96 well plate for measurement in the Perkin Elmer Victor3 luminometer. Each well was injected with 20 μl of luciferase substrate and the luminiscience was measured immediately. Then the wells were injected with quenching reagent and renilla substrate and measured. Acquired data were expressed as a ratio of firefly luminescence/renilla luminescence and normalized to control sample.
Confocal Microscopy
HK11 renal proximal tubule cells were seeded at ~2 × 10⁴ cells/chamber overnight then transfected using Fugene HD at an optimized 4:2 μl/μg HD/DNA ratio for 18–24 hours with pCMV-GRAP-eGFP or pCMV. Cells were fixed in 4% paraformaldehyde-PBS pH 7.4 for 30 minutes at 4°C and then washed 3 times in 1X PBS. This was followed by blocking in 0.5% BSA and then washing in 1X PBS 3 times. Lastly, the cells were permeabilized by incubating with 0.1% Triton X-100/0.5%BSA in PBS for 15 minutes. Cells were then immunostained using 1:250 dilution of anti-fibronectin overnight. Confocal images were acquired using a Zeiss axiovert fixed microscope using previously described settings [19].
Results
Quantitative Analysis of Kidney Tubule Cell Extracts
Here we performed ion trap-based 2D-LC-MS/MS combined with a label-free quantitative strategy as a means to globally compare protein abundance profiles in a diabetic kidney tubule sample set with defined fibrotic signaling features (Fig. 1). A panel of immunoblot analyses was performed for the pro-fibrotic cytokine TGF-β and TGF-β related signaling events. TGF-β abundance was enhanced in the diabetic tubules. As injury involving loss of epithelial cell-cell contact promotes tissue fibrosis, we assessed expression of β-catenin, an important facilitator of tight junction integrity and transcription of a number of renal fibrosis-related proteins [23, 24]. β-catenin was decreased in the diabetic tubule cell lysates. We also recently reported that the tight junction protein E-cadherin showed the same expression pattern in this disease sample set [16]. The expression of glycogen synthase kinase 3 (GSK3)-β, a central regulator of β-catenin and TGF-β signaling [25, 26] was also preferentially expressed and phosphorylated in the diabetic tubule extracts. Lastly, abundance of C/EBPα was greater in the diabetic tubule samples. This is consistent with a recent report implicating C/EBP proteins in the progression of renal fibrosis [22].
Lists of differentially abundant proteins were generated from high stringency spectral mapping and scoring filters using a previously described informatic platform. Overall, 476 significantly differentially expressed proteins were identified (supplemental data). Specific criteria used to establish this list are described in the Methods section. An abbreviated list of representative proteins with previously reported connections to diabetes, kidney disease or perturbation of carbohydrate metabolism and lipid levels are shown in Tables 1 and 2. Expression differences for the key metabolic enzymes transketolase (TKT), isocitrate dehydrogenase 3 (NAD+)-γ (IDH3) and the anti-oxidative stress protein DJ-1 were validated by immunoblot analysis (Fig. 2).
Table 1.
Listed are a subset of down-regulated proteins in OVE26 type 1 diabetic mouse tubules. The proteins were selected from Ingenuity Analysis as being related to diabetes, obesity, carbohydrate and/or fatty acid metabolism or oxidative stress.
| Ref Seq Accession | Protein (Acronym) | Fold decrease Diabetic* | Ontology (top findings IPKB) | Citation |
|---|---|---|---|---|
| NP_031752 | cannabinoid receptor 1 (CNR1) | ∞ | NIDDM, IDDM | [48] |
| NP_038523 | carnitine palmitoyltransferase 1A (CPT1A) | 3.3 | IDDM | [49, 50] |
| NP_034422 | Glucokinase (GCK) | ∞ | MODY, NIDDM | [51–56] |
| NP_034404 | glycerol-3-phosphate dehydrogenase 2 (GPD2) | 4.95 | NIDDM | [57] |
| NP_038848 | hexokinase 2 (HK2) | 5.28 | Experimentally-induced diabetes, regulates D-glucose, regulated by glucose-6-phosphate | [58, 59] |
| NP_001074 681 | insulin receptor substrate 2 (IRS2) | 9.64 | Mediates effects of insulin | [60–65] |
| NP_035348 | protein tyrosine phosphatase, receptor type, S (PTPRS) | 2.87 | Regulates D-glucose | [66] |
| NP_038659 | pyruvate kinase (PKLR) | 6.15 | Glucose metabolism | [67] |
| NP_112445 | Interleukin 6 (IL6) | ∞ | Immune-mediated kidney disease | [68] |
| NP_032349 | isocitrate dehydrogenase 3 (IDH3) gamma | 9.76 | Tricarboxylic acid cycle | [69] |
| NP_035777 | tuberous sclerosis 2 (TSC2) | 3.64 | Diabetes, energy metabolism regulation | [70] |
| NP_653119 | CDK5 regulatory subunit associated protein 1-like 1 (CDKAL1) | ∞ | NIDDM | [71] |
| NP_573512 | peroxisome proliferator-activated receptor gamma coactivator 1 beta (PPARGC1B) | ∞ | Downregulated in T2DM, induced by insulin | [72] |
| NP_065594 | DJ-1 (Park 7) | 3.35 | Oxidative stress response | [42] |
| NP_034916 | transformed mouse 3T3 cell double minute2 (MDM2) | 1.92 | TGF-β Signaling | [73]. |
| NP_031752 | cannabinoid receptor 1 (CNR1) | ∞ | NIDDM, IDDM | [48] |
- ∞ indicates no peptides detected for this protein in diabetic mouse tubule lysates. Non-insulin-dependent diabetes mellitus (NIDDM). Insulin dependent diabetes mellitus (IDDM). maturity-onset diabetes of the young (MODY). Bold highlight indicates further validation was confirmed by immunoblot.
Table 2.
Listed are a subset of upregulated proteins in OVE26 type 1 diabetic mouse tubules. The proteins were selected from Ingenuity Analysis as being related to diabetes, metabolism or oxidative stress.
| RefSeq Accession | Protein | Fold increase Diabetic* | Ontology (top findings IPKB) | Citation |
|---|---|---|---|---|
| NP_033414 | Transketolase (TKT) | 1.7 | Regulates and regulated by D-glucose, metabolic process | [74, 75] |
| NP_032416 | Interferon regulatory factor 1 (IRF1) | ∞ | Experimentally-induced diabetes | [76, 77] |
| NP_034626 | Inhibitor of DNA binding 2 (ID2) | ∞ | Regulated by TGFβ1 | [78, 79] |
| NP_033506 | upstream stimulatory factor 1 (USF1) | ∞ | Regulated by TGFβ1, D- glucose, Insulin | [80, 81] |
| NP_035790 | Thioredoxin (TXN) | ∞ | Diabetes, oxidative stress response | [82] |
- ∞ indicates no peptides detected for this protein in FVB control mouse tubule lysates. Bold highlight indicates further validation was confirmed by immunoblot.
Figure 2. Validation of selected LC-MS/MS results.

A) Quantitative LC-MS/MS differences for two key metabolic enzymes transketolase (TKT) and isocitrate dehydrogenase 3 (NAD+)-γ (IDH3) and the oxidative stress response protein DJ-1. B) Immunoblot validation. C) Densitometry shows agreement with LC-MS/MS abundance differences (* indicates p<0.05 for TKT, IDH3 or DJ-1 normalized to GAPDH or Actin loading control in diabetic tubule extracts versus control tubule extracts).
Accession numbers for the 476 regulated proteins were also submitted to bioinformatic analysis using Ingenuity Pathways Knowledge Base (IPKB). IPKB is a curated literature database useful for identifying interconnected proteins and to explore biological function and characterize a dataset ontologically. Interestingly, we found that a large contingent of the dysregulated proteins mapped to the TGF-β signaling pathway (Fig. 3). Green highlight indicates decreased enrichment in the diabetic samples while orange is increased. Proteins were mapped back to canonical and non-canonical TGF-β signaling pathways.
Figure 3. Ingenuity Pathways Knowledge Base bioinformatic analysis shows integration of candidate proteins into canonical TGF-β and BMP signaling pathways.
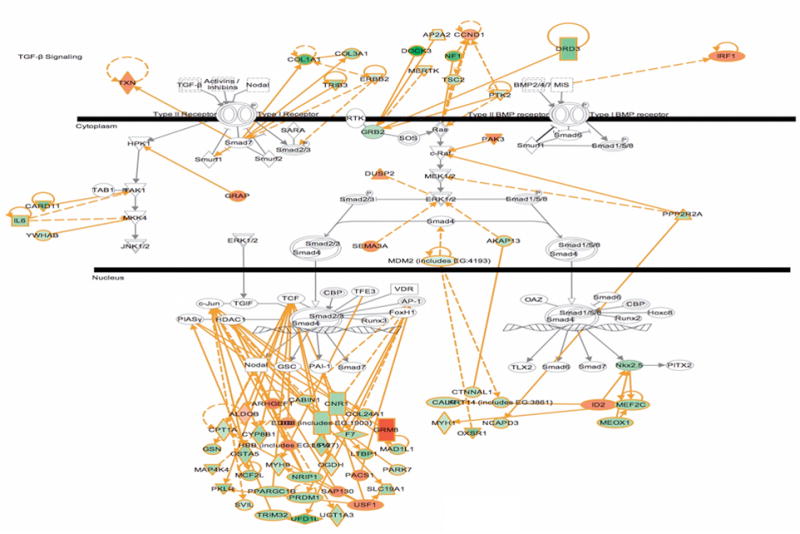
Highlighted in green indicates down-regulated and orange indicates up-regulated in OVE26 diabetic mouse tubules.
Identification of the Grb2-Related Adaptor Protein (GRAP) as a Novel Regulator of TGF-β Activity
GRAP is a low-abundant signaling protein that was enhanced in diabetic tubule samples and predicted as a novel component of the TGF-β signaling pathway from our bioinformatic analysis shown in Fig. 3. GRAP is an adaptor protein with structural similarity to a number of proteins that mediate growth-factor signaling in lymphocytes, but has not previously been implicated in TGF-β activity, or kidney biology or disease [27, 28]. Enhanced diabetic kidney tubule expression of GRAP was determined by mass spectrometry (Fig. 4A) and validated by immunoblot analysis (Fig. 4B) of OVE26 tubule cell lysates. Enhanced renal tubule expression of GRAP also correlates with renal fibrosis in patients with DN (Fig. 4C). Fig. 5A shows a time dependent induction of GRAP expression in HK11 cells by physiologically relevant amounts of TGF-β.
Figure 4. Grb2-related adaptor protein (GRAP) expression is elevated in renal tubules from type 1 transgenic diabetic mice and diabetic patients with renal fibrosis.

A) Quantitative 2D-LC-MS/MS analysis indicates that GRAP is enhanced in renal tubules from OVE26 type 1 diabetic mice, as compared with samples from control mice B) Immunoblot analysis confirms that the 25 kDa band corresponding to GRAP is increased in diabetic tubule extracts as compared to control, lower panel B shows densitometry where * indicates p<0.05 for GRAP normalized to GAPDH loading control in diabetic tubule extracts versus control tubule extracts. C) Representative immunohistochemistry (IHC) shows increased cortical tubule expression of GRAP in kidney sections from human diabetic patients that have tubulointerstitial fibrosis, as indicated by trichrome staining. In total, biopsy sections were collected from 2 diabetic and 3 normal patients. Both diabetic sections exhibited increased GRAP tubule immunostaining correlated with increased trichrome staining while 2 normal sections showed low basal GRAP levels and normal trichrome staining, one normal section exhibited increased GRAP immunostaining and increased trichrome staining.
Figure 5. GRAP is induced by TGF-β and potentiates the TGF-β induced SMAD response in cultured human proximal tubule HK11 cells.
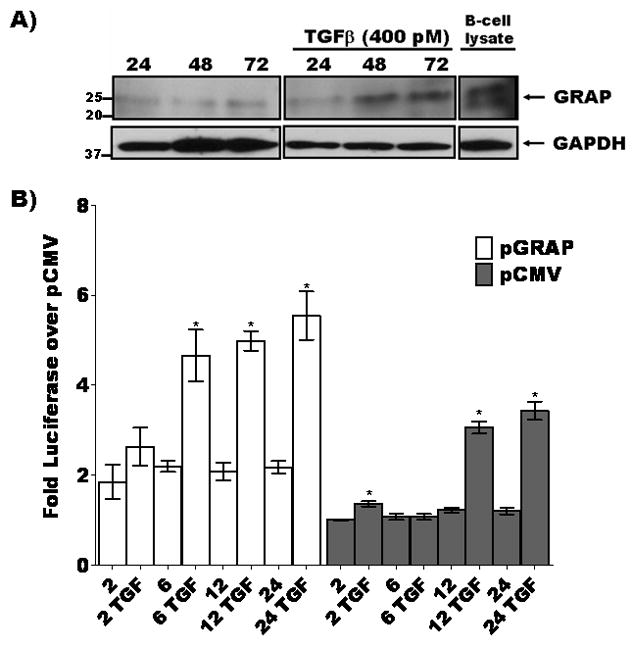
A) TGF-β induces expression of GRAP in cultured human proximal tubule cells. HK11 cells were treated with 400 pM TGF-β for 24, 48 and 72 hours cells harvested and lysates were fractionated by 4–15% gradient SDS-PAGE and immunoblotted for GRAP. GRAP levels increased at 24 hr post TGF-β treatment compared to unstimulated condition. B) SMAD-Luciferase reporter and either pCMV control vector (gray bars) or pCMV-GRAP (white bars) were transfected into HK11 cells and incubated with or without 400 pM TGF-β over a 2–24 hour time course then lysed and luciferase activity was measured as a function of TGF-β activity (p<0.05 indicated by * for paired comparison to 2 hour untreated controls either pGRAP or pCMV transfected).
In addition to TGF-β induction of GRAP expression we were interested in the possibility of GRAP to act on downstream components of the TGF-β transduction pathway. One well characterized function of SMAD proteins is to relay the proximal plasma membrane stimulation of TGF-β receptors to the nucleus and drive the transcriptional response of this cytokine [29]. Fig. 5B shows that ectopic expression of GRAP increased SMAD-directed luciferase activity and the addition of TGF-β at different time points increased the response by two-fold above TGF-β alone in control vector transfected HK11 cells.
To investigate the potential role of GRAP in TGF-β pro-fibrotic processes we ectopically expressed GRAP into HK11 cells with or without TGF-β treatment and then probed for fibronectin expression (Fig. 6). The immunoblot results in Fig. 6A show that GRAP expression induced low levels of fibronectin alone but robustly increased fibronectin when cells were treated with TGF-β. This is consistent with the effects of GRAP expression on TGF-β-directed transcription shown in Fig 5B. Confocal images in Fig. 6B indicate that ectopically expressed GFP-GRAP localized to the nucleus in HK11 cells and promoted the induction and extraceullar deposition of fibronectin.
Figure 6. GRAP promotes the expression of the extracellular matrix protein fibronectin in cultured human proximal tubule HK11 cells.

A) HK11 cells were transfected with pGRAP (lanes 3 and 4) or pCMV control vector (lane 5) or mock transfected (lane 1 and 2). Following overnight transfection, cells representing lanes 2 and 4 were incubated with recombinant TGF-β for 20 hours. The other cells were untreated. Cell lysates were prepared, separated by 4–15% gradient SDS-PAGE, and immunoblotted for fibronectin and GAPDH as a loading control. pGRAP potentiated TGFβ induced accumulation of fibronectin. B) HK11 cells transfected with pGRAP-GFP show that GRAP localizes to the nucleus and induces secretion of fibronectin and potentiates the effects of TGFβ.
Discussion
Diabetic nephropathy (DN) has become a fast growing public health concern in the Western World because of a dramatic increase in the prevalence of diabetes over the past 10 years [1, 30]. In general, tubulointerstitial fibrosis (TIF) is a morphologic hallmark of progressive DN [31, 32]. TIF correlates with the degree of renal dysfunction in DN and is likely a final common pathway leading to end-stage renal disease and the need for dialysis or transplantation [4, 20]. Thus, a better understanding of the molecular mechanisms involved in the development and progression of TIF in DN is necessary to improve the diagnosis, prevention, and treatment of this condition. The present study utilized state-of-the-art, high-sensitivity quantitative mass spectrometry-based methodology to define proteins that contribute to the progressive TIF that develops in OVE26 mice, a spontaneous model of type 1 diabetes and DN [16, 33].
Conventional approaches to quantitative proteomics in kidney biology or disease have relied heavily upon differential two dimensional (2D)-gel or DIGE analysis of whole kidney lysate [34]. Although this approach has provided important information pertaining to renal protein modulations in diabetes, the sensitivity of proteome characterization has been dramatically improved by the advent of an approach that couples 2D-liquid chromatography (LC) with tandem mass spectrometry (MS/MS) analysis [7, 8]. A recent study used 2D-DIGE to detect renal protein expression changes in alloxan-induced type I diabetic mice [35]. The effectiveness of the quantitative assessment was demonstrated by the detection of expression changes that were reversed by insulin treatment. However, low sensitivity is indicated by identification of only 15 differentially expressed proteins. However, they did not mention how many total proteins were identified. Our group has previously reported the identification of up to 54 unique kidney proteins from 2D gels [18]. Of these, 30 were differentially expressed in whole kidney extracts from 4 month old OVE26 mice compared with age-matched controls. In comparison, 2,000–3,000 high-probability kidney proteins have been reported with 2D-LC-MS/MS analysis [36, 37]. However, a drawback has been the inability to effectively define quantitative differences while also maintaining maximum sensitivity with this approach. Tilton et al. used a combination of 2D-gel and LC-MS/MS analysis to assess changes in the renal cortical proteome in 3 month old type 2 diabetic db/db mice [38]. They reported expression differences for 147 unique proteins. Here we devised a method for quantitative assessment of kidney samples directly analyzed by 2D-LC-MS/MS. This allowed the identification of 476 significantly differentially expressed proteins of a total of ~9000 total identifications in cortical tubules isolated from 6 month old OVE26 diabetic and control mice. This suggests that 2D-LC-MS/MS analysis was capable of detecting disease-induced perturbations that might have been overlooked by previous gel-based studies.
A select list of 15 down-regulated and 5 up-regulated proteins with previously reported connections to diabetes, renal biology or disease, and perturbation of carbohydrate metabolism and lipid levels are included in Tables 1 and 2. Of these, expression differences for the key metabolic enzymes transketolase (TKT) and isocitrate dehydrogenase 3 (NAD+)-γ (IDH3) and the anti-oxidative stress protein Park7 (DJ-1) were validated with immunoblot experiments. Our findings indicate that TKT expression is approximately 1.7 fold higher in the diabetic mouse tubule cells. Previous work from human derived cell cultures showed that thiamine and benfotiamine induction of TKT activity decreases some of the adverse effects of hyperglycemia [39]. Variation in TKT expression may function as a protective cellular response to hyperglycemia and after long term exposure the levels of TKT may remain high as a counter to increased glycolytic products. We detected decreased levels of IDH3 in the diabetic tissue. IDH3 is the rate-limiting enzyme in the TCA cycle and its altered expression may be an indication of genetic dysregulation of key metabolic pathways as a consequence of the high glucose levels of diabetes. Simultaneously, depletion of TCA proteins such as IDH3 with increased TKT will continue to exacerbate reduced consumption of glycolytic products and lead to increased production of advanced glycated end-products (AGE) and reactive oxygen species (ROS). AGEs and oxidative stress have been shown to activate a number of cellular and molecular processes that promote TIF in DN [40, 41]. Lastly, we found that DJ-1 expression levels were lower in the diabetic tubules. DJ-1 has been shown to regulate ROS levels by stabilizing the expression of the oxidoreductase NQ01 [42]. Perhaps reduced DJ-1 contributes to enhanced ROS production and oxidative stress related tubule injury in DN.
A well established role for TGF-β in the pathogenesis of diabetic induced kidney disease [43] and the pro-TGF-β expression profile of our sample set led us to focus on potential involvement of proteins dysregulated in the OVE26 model in TGF-β signaling. A targeted bioinformatic analysis using Ingenuity Pathway Software indicated that 16% of the 476 modulated proteins have primary or secondary connections with TGF-β signaling and transcription. We were especially intrigued that two related adaptor proteins found in this screen (growth factor receptor-bound protein 2 (GRB2, p<0.08 by qMS/MS data not shown) and GRB2-Related Adaptor Protein (GRAP)) have been implicated as upstream mediators of TGF-β and are inversely regulated in the OVE26 tubules. These adaptor proteins belong to a family of SH2-SH3 proteins that participate in relaying signal transduction events from the plasma membrane by interaction with ligand activated receptor tyrosine kinases, such as that of TGF-β and other cytokine receptors [44, 45]. However, GRAP has been primarily described as a hematopoietic signaling adaptor responsible for coupling T-cell receptors to intracellular signaling cascades, but no role in TGF-β signaling or renal biology has been reported [46].
We further investigated a role for GRAP in TGF-β activity in cultured renal tubule (HK11) cells. Our findings indicate that GRAP is induced by TGF-β and that GRAP may play a synergistic feedback role in inducing TGF-β directed transcriptional and fibrotic activity. Since enhanced expression of GRAP also correlates with renal TIF in human diabetes, it is reasonable to postulate that GRAP could be potentiating and exacerbating the pro-fibrotic signaling effects of TGF-β in diabetic kidney disease (Fig. 7).
Figure 7. Model of GRAP regulation of TGF-β-induced tubulointerstitial fibrosis in diabetic nephropathy (DN).

Sustained diabetes can lead to renal tubule injury and concurrent TGF-β upregulation [47]. This results in exacerbation (striped arrows) of TGF-β-induced accumulation of extracellular matrix in the tubule interstitial space. Our data supports a positive feedback model were TGF-β activates increased expression of Grb2-related adaptor protein (GRAP) which enhances TGF-β SMAD driven transcription (black arrow) leading to elevated levels of fibronectin in renal proximal tubule cells.
Supplementary Material
Acknowledgments
This study was supported by funding from the office of Science Financial Assistance Programs, US Department of Energy. D.W.P. is supported by a National Institutes of Health Grant DK176743. This study was also partly supported by funding from an NIEHS award P30ES014443 (D.W.P.) from the University of Louisville Center for Environmental Genomics and Integrative Biology.
Footnotes
Publisher's Disclaimer: This is a PDF file of an unedited manuscript that has been accepted for publication. As a service to our customers we are providing this early version of the manuscript. The manuscript will undergo copyediting, typesetting, and review of the resulting proof before it is published in its final citable form. Please note that during the production process errors may be discovered which could affect the content, and all legal disclaimers that apply to the journal pertain.
References
- 1.Molitch ME, et al. Nephropathy in diabetes. Diabetes Care. 2004;27(Suppl 1):S79–83. doi: 10.2337/diacare.27.2007.s79. [DOI] [PubMed] [Google Scholar]
- 2.Xue JL, et al. Forecast of the number of patients with end-stage renal disease in the United States to the year 2010. J Am Soc Nephrol. 2001;12(12):2753–8. doi: 10.1681/ASN.V12122753. [DOI] [PubMed] [Google Scholar]
- 3.Lewis EJ, et al. Renoprotective effect of the angiotensin-receptor antagonist irbesartan in patients with nephropathy due to type 2 diabetes. N Engl J Med. 2001;345(12):851–60. doi: 10.1056/NEJMoa011303. [DOI] [PubMed] [Google Scholar]
- 4.Nath KA. The tubulointerstitium in progressive renal disease. Kidney Int. 1998;54(3):992–4. doi: 10.1046/j.1523-1755.1998.00079.x. [DOI] [PubMed] [Google Scholar]
- 5.Cravatt BF, Simon GM, Yates JR., 3rd The biological impact of mass-spectrometry-based proteomics. Nature. 2007;450(7172):991–1000. doi: 10.1038/nature06525. [DOI] [PubMed] [Google Scholar]
- 6.Powell DW, Merchant ML, Link AJ. Discovery of regulatory molecular events and biomarkers using 2D capillary chromatography and mass spectrometry. Expert Rev Proteomics. 2006;3(1):63–74. doi: 10.1586/14789450.3.1.63. [DOI] [PubMed] [Google Scholar]
- 7.Link AJ, et al. Direct analysis of protein complexes using mass spectrometry. Nat Biotechnol. 1999;17(7):676–82. doi: 10.1038/10890. [DOI] [PubMed] [Google Scholar]
- 8.Powell DW, et al. Cluster analysis of mass spectrometry data reveals a novel component of SAGA. Mol Cell Biol. 2004;24(16):7249–59. doi: 10.1128/MCB.24.16.7249-7259.2004. [DOI] [PMC free article] [PubMed] [Google Scholar]
- 9.Nesvizhskii AI, Vitek O, Aebersold R. Analysis and validation of proteomic data generated by tandem mass spectrometry. Nat Methods. 2007;4(10):787–97. doi: 10.1038/nmeth1088. [DOI] [PubMed] [Google Scholar]
- 10.Liu H, Sadygov RG, Yates JR., 3rd A model for random sampling and estimation of relative protein abundance in shotgun proteomics. Anal Chem. 2004;76(14):4193–201. doi: 10.1021/ac0498563. [DOI] [PubMed] [Google Scholar]
- 11.Old WM, et al. Comparison of label-free methods for quantifying human proteins by shotgun proteomics. Mol Cell Proteomics. 2005;4(10):1487–502. doi: 10.1074/mcp.M500084-MCP200. [DOI] [PubMed] [Google Scholar]
- 12.Cummins TD, Powell DW. Use of quantitative mass spectrometry analysis in kidney research. Semin Nephrol. 2007;27(6):574–83. doi: 10.1016/j.semnephrol.2007.09.008. [DOI] [PubMed] [Google Scholar]
- 13.Fleischer TC, et al. Systematic identification and functional screens of uncharacterized proteins associated with eukaryotic ribosomal complexes. Genes Dev. 2006;20(10):1294–307. doi: 10.1101/gad.1422006. [DOI] [PMC free article] [PubMed] [Google Scholar]
- 14.Burg JS, et al. Insig regulates HMG-CoA reductase by controlling enzyme phosphorylation in fission yeast. Cell Metab. 2008;8(6):522–31. doi: 10.1016/j.cmet.2008.09.004. [DOI] [PMC free article] [PubMed] [Google Scholar]
- 15.Hughes AL, et al. Dap1/PGRMC1 binds and regulates cytochrome P450 enzymes. Cell Metab. 2007;5(2):143–9. doi: 10.1016/j.cmet.2006.12.009. [DOI] [PubMed] [Google Scholar]
- 16.Powell DW, et al. Renal Tubulointerstitial Fibrosis in OVE26 Type 1 Diabetic Mice. Nephron Exp Nephrol. 2008;111(1):e11–e19. doi: 10.1159/000178763. [DOI] [PubMed] [Google Scholar]
- 17.McAfee KJ, et al. Analyzing proteomes and protein function using graphical comparative analysis of tandem mass spectrometry results. Mol Cell Proteomics. 2006;5(8):1497–513. doi: 10.1074/mcp.T500027-MCP200. [DOI] [PubMed] [Google Scholar]
- 18.Thongboonkerd V, et al. Alterations in the renal elastin-elastase system in type 1 diabetic nephropathy identified by proteomic analysis. J Am Soc Nephrol. 2004;15(3):650–62. doi: 10.1097/01.asn.0000115334.65095.9b. [DOI] [PubMed] [Google Scholar]
- 19.Khundmiri SJ, et al. Parathyroid hormone regulation of NA+, K+-ATPase requires the PDZ 1 domain of sodium hydrogen exchanger regulatory factor-1 in opossum kidney cells. J Am Soc Nephrol. 2005;16(9):2598–607. doi: 10.1681/ASN.2004121049. [DOI] [PubMed] [Google Scholar]
- 20.Gilbert RE, Cooper ME. The tubulointerstitium in progressive diabetic kidney disease: more than an aftermath of glomerular injury? Kidney Int. 1999;56(5):1627–37. doi: 10.1046/j.1523-1755.1999.00721.x. [DOI] [PubMed] [Google Scholar]
- 21.Nath KA. Tubulointerstitial changes as a major determinant in the progression of renal damage. Am J Kidney Dis. 1992;20(1):1–17. doi: 10.1016/s0272-6386(12)80312-x. [DOI] [PubMed] [Google Scholar]
- 22.Takeji M, et al. CCAAT/Enhancer-binding protein delta contributes to myofibroblast transdifferentiation and renal disease progression. J Am Soc Nephrol. 2004;15(9):2383–90. doi: 10.1097/01.ASN.0000136426.01160.2F. [DOI] [PubMed] [Google Scholar]
- 23.Gradl D, Kuhl M, Wedlich D. The Wnt/Wg signal transducer beta-catenin controls fibronectin expression. Mol Cell Biol. 1999;19(8):5576–87. doi: 10.1128/mcb.19.8.5576. [DOI] [PMC free article] [PubMed] [Google Scholar]
- 24.Masszi A, et al. Integrity of cell-cell contacts is a critical regulator of TGF-beta 1-induced epithelial-to-myofibroblast transition: role for beta-catenin. Am J Pathol. 2004;165(6):1955–67. doi: 10.1016/s0002-9440(10)63247-6. [DOI] [PMC free article] [PubMed] [Google Scholar]
- 25.Asuni AA, et al. GSK3alpha exhibits beta-catenin and tau directed kinase activities that are modulated by Wnt. Eur J Neurosci. 2006;24(12):3387–92. doi: 10.1111/j.1460-9568.2006.05243.x. [DOI] [PubMed] [Google Scholar]
- 26.Liang MH, Chuang DM. Differential roles of glycogen synthase kinase-3 isoforms in the regulation of transcriptional activation. J Biol Chem. 2006;281(41):30479–84. doi: 10.1074/jbc.M607468200. [DOI] [PubMed] [Google Scholar]
- 27.Horejsi V, Zhang W, Schraven B. Transmembrane adaptor proteins: organizers of immunoreceptor signalling. Nat Rev Immunol. 2004;4(8):603–16. doi: 10.1038/nri1414. [DOI] [PubMed] [Google Scholar]
- 28.Janssen E, Zhang W. Adaptor proteins in lymphocyte activation. Curr Opin Immunol. 2003;15(3):269–76. doi: 10.1016/s0952-7915(03)00044-x. [DOI] [PubMed] [Google Scholar]
- 29.Feng XH, Derynck R. Specificity and versatility in tgf-beta signaling through Smads. Annu Rev Cell Dev Biol. 2005;21:659–93. doi: 10.1146/annurev.cellbio.21.022404.142018. [DOI] [PubMed] [Google Scholar]
- 30.Hsu CY, et al. The incidence of end-stage renal disease is increasing faster than the prevalence of chronic renal insufficiency. Ann Intern Med. 2004;141(2):95–101. doi: 10.7326/0003-4819-141-2-200407200-00007. [DOI] [PubMed] [Google Scholar]
- 31.Caramori ML, Mauer M. Diabetes and nephropathy. Curr Opin Nephrol Hypertens. 2003;12(3):273–82. doi: 10.1097/00041552-200305000-00008. [DOI] [PubMed] [Google Scholar]
- 32.Ziyadeh FN, Sharma K. Overview: combating diabetic nephropathy. J Am Soc Nephrol. 2003;14(5):1355–7. doi: 10.1097/01.asn.0000065608.37756.58. [DOI] [PubMed] [Google Scholar]
- 33.Zheng S, et al. Development of late-stage diabetic nephropathy in OVE26 diabetic mice. Diabetes. 2004;53(12):3248–57. doi: 10.2337/diabetes.53.12.3248. [DOI] [PubMed] [Google Scholar]
- 34.Kieffer P, et al. Quantitative changes in protein expression of cadmium-exposed poplar plants. Proteomics. 2008;8(12):2514–2530. doi: 10.1002/pmic.200701110. [DOI] [PubMed] [Google Scholar]
- 35.Diao WF, et al. Serum, liver, and kidney proteomic analysis for the alloxan-induced type I diabetic mice after insulin gene transfer of naked plasmid through electroporation. Proteomics. 2006;6(21):5837–45. doi: 10.1002/pmic.200500697. [DOI] [PubMed] [Google Scholar]
- 36.Kislinger T, et al. Global survey of organ and organelle protein expression in mouse: combined proteomic and transcriptomic profiling. Cell. 2006;125(1):173–86. doi: 10.1016/j.cell.2006.01.044. [DOI] [PubMed] [Google Scholar]
- 37.Zhao Y, et al. Comprehensive analysis of the mouse renal cortex using two-dimensional HPLC - tandem mass spectrometry. Proteome Sci. 2008;6:15. doi: 10.1186/1477-5956-6-15. [DOI] [PMC free article] [PubMed] [Google Scholar]
- 38.Tilton RG, et al. Diabetes-induced changes in the renal cortical proteome assessed with two-dimensional gel electrophoresis and mass spectrometry. Proteomics. 2007;7(10):1729–42. doi: 10.1002/pmic.200700017. [DOI] [PubMed] [Google Scholar]
- 39.Schmid U, et al. Benfotiamine exhibits direct antioxidative capacity and prevents induction of DNA damage in vitro. Diabetes Metab Res Rev. 2008 doi: 10.1002/dmrr.860. [DOI] [PubMed] [Google Scholar]
- 40.Li JH, et al. Advanced glycation end products induce tubular epithelial-myofibroblast transition through the RAGE-ERK1/2 MAP kinase signaling pathway. Am J Pathol. 2004;164(4):1389–97. doi: 10.1016/S0002-9440(10)63225-7. [DOI] [PMC free article] [PubMed] [Google Scholar]
- 41.Prabhakar S, et al. Diabetic nephropathy is associated with oxidative stress and decreased renal nitric oxide production. J Am Soc Nephrol. 2007;18(11):2945–52. doi: 10.1681/ASN.2006080895. [DOI] [PubMed] [Google Scholar]
- 42.Clements CM, et al. DJ-1, a cancer- and Parkinson’s disease-associated protein, stabilizes the antioxidant transcriptional master regulator Nrf2. Proc Natl Acad Sci U S A. 2006;103(41):15091–6. doi: 10.1073/pnas.0607260103. [DOI] [PMC free article] [PubMed] [Google Scholar]
- 43.Bottinger EP, Bitzer M. TGF-beta signaling in renal disease. J Am Soc Nephrol. 2002;13(10):2600–10. doi: 10.1097/01.asn.0000033611.79556.ae. [DOI] [PubMed] [Google Scholar]
- 44.Buday L. Membrane-targeting of signalling molecules by SH2/SH3 domain-containing adaptor proteins. Biochim Biophys Acta. 1999;1422(2):187–204. doi: 10.1016/s0304-4157(99)00005-2. [DOI] [PubMed] [Google Scholar]
- 45.Feng GS, et al. Grap is a novel SH3-SH2-SH3 adaptor protein that couples tyrosine kinases to the Ras pathway. J Biol Chem. 1996;271(21):12129–32. doi: 10.1074/jbc.271.21.12129. [DOI] [PubMed] [Google Scholar]
- 46.Trub T, et al. The role of a lymphoid-restricted, Grb2-like SH3-SH2-SH3 protein in T cell receptor signaling. J Biol Chem. 1997;272(2):894–902. doi: 10.1074/jbc.272.2.894. [DOI] [PubMed] [Google Scholar]
- 47.Ziyadeh FN. Mediators of diabetic renal disease: the case for tgf-Beta as the major mediator. J Am Soc Nephrol. 2004;15(Suppl 1):S55–7. doi: 10.1097/01.asn.0000093460.24823.5b. [DOI] [PubMed] [Google Scholar]
- 48.Ginsburg BC, Lamb RJ. Cannabinoid effects on behaviors maintained by ethanol or food: a within-subjects comparison. Behav Pharmacol. 2006;17(3):249–57. doi: 10.1097/00008877-200605000-00006. [DOI] [PubMed] [Google Scholar]
- 49.Begriche K, et al. Mitochondrial dysfunction in NASH: causes, consequences and possible means to prevent it. Mitochondrion. 2006;6(1):1–28. doi: 10.1016/j.mito.2005.10.004. [DOI] [PubMed] [Google Scholar]
- 50.Obici S, et al. Inhibition of hypothalamic carnitine palmitoyltransferase-1 decreases food intake and glucose production. Nat Med. 2003;9(6):756–61. doi: 10.1038/nm873. [DOI] [PubMed] [Google Scholar]
- 51.Ishihara H, et al. Inhibition of pancreatic beta-cell glucokinase by antisense RNA expression in transgenic mice: mouse strain-dependent alteration of glucose tolerance. FEBS Lett. 1995;371(3):329–32. doi: 10.1016/0014-5793(95)00932-y. [DOI] [PubMed] [Google Scholar]
- 52.Lehto M, et al. High frequency of mutations in MODY and mitochondrial genes in Scandinavian patients with familial early-onset diabetes. Diabetologia. 1999;42(9):1131–7. doi: 10.1007/s001250051281. [DOI] [PubMed] [Google Scholar]
- 53.Massa O, et al. High prevalence of glucokinase mutations in Italian children with MODY. Influence on glucose tolerance, first-phase insulin response, insulin sensitivity and BMI. Diabetes Study Group of the Italian Society of Paediatric Endocrinology and Diabetes (SIEDP) Diabetologia. 2001;44(7):898–905. doi: 10.1007/s001250100530. [DOI] [PubMed] [Google Scholar]
- 54.Postic C, et al. Dual roles for glucokinase in glucose homeostasis as determined by liver and pancreatic beta cell-specific gene knock-outs using Cre recombinase. J Biol Chem. 1999;274(1):305–15. doi: 10.1074/jbc.274.1.305. [DOI] [PubMed] [Google Scholar]
- 55.Rossetti L, et al. Abnormal regulation of HGP by hyperglycemia in mice with a disrupted glucokinase allele. Am J Physiol. 1997;273(4 Pt 1):E743–50. doi: 10.1152/ajpendo.1997.273.4.E743. [DOI] [PubMed] [Google Scholar]
- 56.Velho G, et al. Identification of 14 new glucokinase mutations and description of the clinical profile of 42 MODY-2 families. Diabetologia. 1997;40(2):217–24. doi: 10.1007/s001250050666. [DOI] [PubMed] [Google Scholar]
- 57.Brown LJ, et al. Lethal hypoglycemic ketosis and glyceroluria in mice lacking both the mitochondrial and the cytosolic glycerol phosphate dehydrogenases. J Biol Chem. 2002;277(36):32899–904. doi: 10.1074/jbc.M202409200. [DOI] [PubMed] [Google Scholar]
- 58.Heikkinen S, et al. Hexokinase II-deficient mice. Prenatal death of homozygotes without disturbances in glucose tolerance in heterozygotes. J Biol Chem. 1999;274(32):22517–23. doi: 10.1074/jbc.274.32.22517. [DOI] [PubMed] [Google Scholar]
- 59.Malkki M, Laakso M, Deeb SS. The human hexokinase II gene promoter: functional characterization and detection of variants among patients with NIDDM. Diabetologia. 1997;40(12):1461–9. doi: 10.1007/s001250050850. [DOI] [PubMed] [Google Scholar]
- 60.Almind K, et al. Search for variants of the gene-promoter and the potential phosphotyrosine encoding sequence of the insulin receptor substrate-2 gene: evaluation of their relation with alterations in insulin secretion and insulin sensitivity. Diabetologia. 1999;42(10):1244–9. doi: 10.1007/s001250051299. [DOI] [PubMed] [Google Scholar]
- 61.Dong X, et al. Irs1 and Irs2 signaling is essential for hepatic glucose homeostasis and systemic growth. J Clin Invest. 2006;116(1):101–14. doi: 10.1172/JCI25735. [DOI] [PMC free article] [PubMed] [Google Scholar]
- 62.Kubota T, et al. Lack of insulin receptor substrate-2 causes progressive neointima formation in response to vessel injury. Circulation. 2003;107(24):3073–80. doi: 10.1161/01.CIR.0000070937.52035.25. [DOI] [PubMed] [Google Scholar]
- 63.Kushner JA, et al. Pdx1 restores beta cell function in Irs2 knockout mice. J Clin Invest. 2002;109(9):1193–201. doi: 10.1172/JCI14439. [DOI] [PMC free article] [PubMed] [Google Scholar]
- 64.Suzuki R, et al. Both insulin signaling defects in the liver and obesity contribute to insulin resistance and cause diabetes in Irs2(−/−) mice. J Biol Chem. 2004;279(24):25039–49. doi: 10.1074/jbc.M311956200. [DOI] [PubMed] [Google Scholar]
- 65.Uchida T, et al. Deletion of Cdkn1b ameliorates hyperglycemia by maintaining compensatory hyperinsulinemia in diabetic mice. Nat Med. 2005;11(2):175–82. doi: 10.1038/nm1187. [DOI] [PubMed] [Google Scholar]
- 66.Batt J, et al. Pituitary, pancreatic and gut neuroendocrine defects in protein tyrosine phosphatase-sigma-deficient mice. Mol Endocrinol. 2002;16(1):155–69. doi: 10.1210/mend.16.1.0756. [DOI] [PubMed] [Google Scholar]
- 67.Brand IA, Heinickel A. Key enzymes of carbohydrate metabolism as targets of the 11.5-kDa Zn(2+)-binding protein (parathymosin) J Biol Chem. 1991;266(31):20984–9. [PubMed] [Google Scholar]
- 68.Wallenius V, et al. Interleukin-6-deficient mice develop mature-onset obesity. Nat Med. 2002;8(1):75–9. doi: 10.1038/nm0102-75. [DOI] [PubMed] [Google Scholar]
- 69.Jin F, et al. Suppression of tumorigenicity by the wild-type tuberous sclerosis 2 (Tsc2) gene and its C-terminal region. Proc Natl Acad Sci U S A. 1996;93(17):9154–9. doi: 10.1073/pnas.93.17.9154. [DOI] [PMC free article] [PubMed] [Google Scholar]
- 70.Frayling TM. Genome-wide association studies provide new insights into type 2 diabetes aetiology. Nat Rev Genet. 2007;8(9):657–62. doi: 10.1038/nrg2178. [DOI] [PubMed] [Google Scholar]
- 71.Lau P, et al. The orphan nuclear receptor, RORalpha, regulates gene expression that controls lipid metabolism: staggerer (SG/SG) mice are resistant to diet-induced obesity. J Biol Chem. 2008;283(26):18411–21. doi: 10.1074/jbc.M710526200. [DOI] [PubMed] [Google Scholar]
- 72.Qiu LQ, Sinniah R, Hsu SI. Coupled induction of iNOS and p53 upregulation in renal resident cells may be linked with apoptotic activity in the pathogenesis of progressive IgA nephropathy. J Am Soc Nephrol. 2004;15(8):2066–78. doi: 10.1097/01.ASN.0000133532.99109.3D. [DOI] [PubMed] [Google Scholar]
- 73.Bublitz C, Steavenson S. The pentose phosphate pathway in the endoplasmic reticulum. J Biol Chem. 1988;263(26):12849–53. [PubMed] [Google Scholar]
- 74.Xu ZP, Wawrousek EF, Piatigorsky J. Transketolase haploinsufficiency reduces adipose tissue and female fertility in mice. Mol Cell Biol. 2002;22(17):6142–7. doi: 10.1128/MCB.22.17.6142-6147.2002. [DOI] [PMC free article] [PubMed] [Google Scholar]
- 75.Gysemans CA, et al. Dual role of interferon-gamma signalling pathway in sensitivity of pancreatic beta cells to immune destruction. Diabetologia. 2001;44(5):567–74. doi: 10.1007/s001250051662. [DOI] [PubMed] [Google Scholar]
- 76.Suk K, et al. IFN-gamma/TNF-alpha synergism as the final effector in autoimmune diabetes: a key role for STAT1/IFN regulatory factor-1 pathway in pancreatic beta cell death. J Immunol. 2001;166(7):4481–9. doi: 10.4049/jimmunol.166.7.4481. [DOI] [PubMed] [Google Scholar]
- 77.Russell RG, et al. Id2 drives differentiation and suppresses tumor formation in the intestinal epithelium. Cancer Res. 2004;64(20):7220–5. doi: 10.1158/0008-5472.CAN-04-2095. [DOI] [PubMed] [Google Scholar]
- 78.Simbulan-Rosenthal CM, et al. Id2 protein is selectively upregulated by UVB in primary, but not in immortalized human keratinocytes and inhibits differentiation. Oncogene. 2005;24(35):5443–58. doi: 10.1038/sj.onc.1208709. [DOI] [PubMed] [Google Scholar]
- 79.Bidder M, et al. Osteopontin transcription in aortic vascular smooth muscle cells is controlled by glucose-regulated upstream stimulatory factor and activator protein-1 activities. J Biol Chem. 2002;277(46):44485–96. doi: 10.1074/jbc.M206235200. [DOI] [PubMed] [Google Scholar]
- 80.Shoulders CC. USF1 on trial. Nat Genet. 2004;36(4):322–3. doi: 10.1038/ng0404-322. [DOI] [PubMed] [Google Scholar]
- 81.Powis G, Montfort WR. Properties and biological activities of thioredoxins. Annu Rev Pharmacol Toxicol. 2001;41:261–95. doi: 10.1146/annurev.pharmtox.41.1.261. [DOI] [PubMed] [Google Scholar]
- 82.Soundar S, O’hagan M, Fomulu KS, Colman RF. Identification of Mn2+-binding aspartates from alpha, beta, and gamma subunits of human NAD-dependent isocitrate dehydrogenase. J Biol Chem. 281(30):21073–81. doi: 10.1074/jbc.M602956200. [DOI] [PubMed] [Google Scholar]
Associated Data
This section collects any data citations, data availability statements, or supplementary materials included in this article.