Abstract
The cellular microenvironment is an increasingly discussed topic in cell biology as it has been implicated in the progression of cancer and the maintenance of stem cells. The microenvironment of a cell is an organized combination of extracellular matrix (ECM), cells, and interstitial fluid that influence cellular phenotype through physical, mechanical, and biochemical mechanisms. Screening can be used to map combinations of cells and microenvironments to phenotypic outcomes in a way that can help develop more predictive in vitro models and to better understand phenotypic mechanisms from a systems biology perspective. This paper examines microenvironmental screening in terms of outcomes and benefits, key elements of the screening process, challenges for implementation, and a possible role for microfluidics as the screening platform. To assess microfluidics for use in microenvironmental screening, examples and categories of micro-scale and microfluidic technology are highlighted. Microfluidic technology shows promise for simultaneous control of multiple parameters of the microenvironment and can provide a base for scaling advanced cell-based experiments into automated high-throughput formats.
Index Terms: Cell biology, cell culture, challenges, extracellular matrix, in vitro models, microchannel, microenvironments, microfluidics, multitiered high-throughput screening, optimization, parameter space, phenotypes, platforms, soluble factors, stem cells
I. INTRODUCTION
The goal of this paper is to show the potential for the use of microfluidics in cell biology for screening parameters of the cellular microenvironment and to review the relevant capabilities of this micro-scale technology. However, we first discuss some of the facets and challenges associated with screening the microenvironment, separate from the use of microfluidic technology. This is because technological challenges related to microenvironmental screening go beyond the ability to engineer the microenvironment of cells alone. Further, microenvironmental screening is a developing area of biology and warrants some definition. Thus, we first ask the following questions to help provide an appropriate context for the rest of the review.
Why screen parameters of the microenvironment? (How can it help the study of cell biology?)
What lessons can be learned for microenvironmental screening from other, more developed, types of screening?
What technological challenges will we face as we try to screen the microenvironment? (If experimental sizes grow exponentially with the number of screening parameters, the availability of limited resources can become an issue.)
Each question could be the subject of a paper unto itself; however, some basic discussions of them is important in order to fully define the technological challenges facing microenvironmental screening and any role for microfluidics. One major challenge addressed by microfluidics and reviewed here is the ability to create a diverse range of environments composed of a wide variety of environmental parameters. We begin now by describing a role for screening the cellular microenvironment.
II. WHY SCREEN MICROENVIRONMENT?
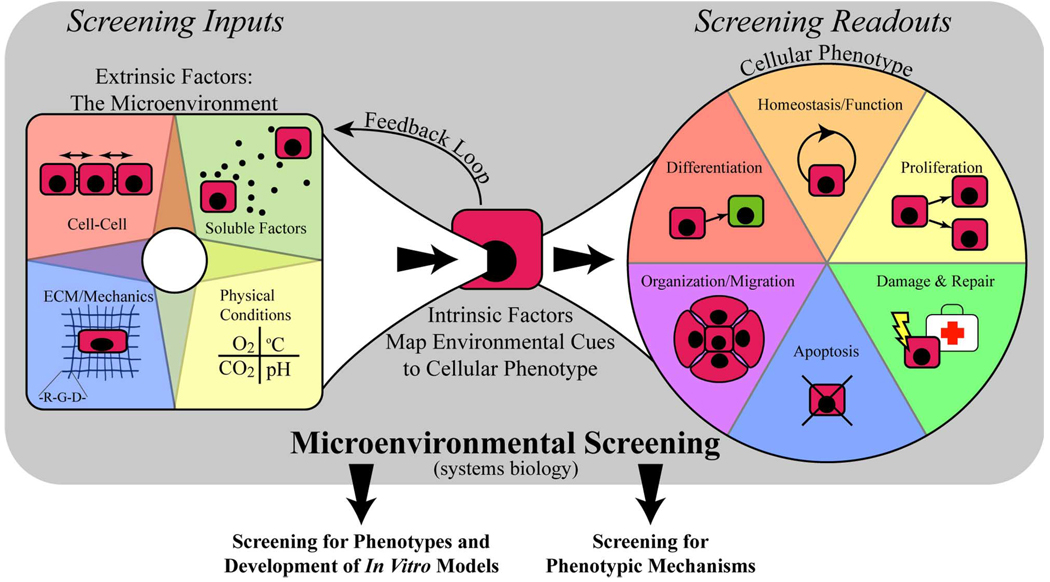
The microenvironment is an important concept in cell biology and is often referenced in the study of stem cells, development, and cancer. The natural microenvironment of stem cells is typically referred to as the stem cell niche and has been suggested to play an important role in regulating stem cell behavior [1]–[5]. The tumor microenvironment is also suggested as an important and even necessary component to the progression of some types of cancer [6]–[9]. Cues of the microenvironment are integrated by the cell and affect cellular phenotype (i.e., gene expression and cell behavior), while at the same time the cell can also affect its microenvironment (see feedback loop of Fig. 1). The balance and interplay between the microenvironment and cellular phenotype is therefore an important and complex problem in cell biology. Screening can be used to study cellular response to the microenvironment by helping to create a map between environmental conditions and cellular phenotype.
Fig. 1.
Microenvironmental screening and some of its applications. Microenvironmental screening can help to understand how intrinsic factors of the cell integrate environmental cues to produce various phenotypes, taking a systems biology approach that considers the many cues as a whole. The contextual information gained using the systems biology approach can be used to: 1) search for appropriate conditions that produce desired phenotypes or 2) go a step further to examine the mechanisms by which those phenotypes are produced.
It could be argued that there are two types of applications of microenvironmental screening. Some applications search for ways to produce phenotypes of interest, others go a step further and attempt to identify the mechanisms responsible for the produced phenotypes. Throughout the rest of this paper, the first application is referred to as micronenvironmental screening for phenotype while the other is referred to as screening for phenotypic mechanism.
There are uses for both types of applications. An analogy to screening for phenotype might be the optimization of a manufacturing process. For example, it might be beneficial to develop optimal conditions for stem cell self-renewal in order to expand cell resources for use in cell-based therapies. However, using the same stem cell analogy, others might be interested in the mechanism of how the microenvironment might promote self-renewal of stem cells for insight into development and disease.
A good example of both types of applications is contained in a study performed by Prudhomme et al. [10]. In this study, there are five parameters consisting of two soluble factors, two components of the ECM, and the variable of time. Readouts are taken at three different time points using all possible combinations of soluble factors and ECM components. Therefore, there are 2×2×2×2×3=48 experimental conditions. In the first set of experiments, one readout was used to characterize the state of cellular differentiation, the desired outcome being an indication of what combinations of factors support the stem cell phenotype of self-renewal versus differentiation. In a second set of experiments using the same experimental conditions, 31 different readouts of cell signaling (phospho-protein levels measured via quantitative western blotting) were used to obtain an additional 1488 data points or cue-signal relationships. When the two sets of data were combined for multivariate analysis, the authors were able to identify biochemical mechanisms that correlate with particular cellular phenotypes in a data-driven manner. The study employed a systems biology approach to first correlate microenvironmental cues with a particular cellular phenotype (screening for phenotype) and subsequently expanded the scope of the study to gain insight into the associated biochemical mechanisms (screening for phenotypic mechanism).
Microenvironmental screening applications can impact cell biology in multiple ways. For example, the application of screening for phenotype could be used to develop in vitro models that more effectively represent in vivo phenotypes of interest, such as models to assess hERG channel blockage for drug discovery [11] or other important cell-based models for therapy development [12]. Screening for a phenotypic mechanism can also impact efforts to model cellular processes, providing data for validation and model building. Further, there is a trend in cell biology to promote more quantitative definitions and explanations of biology that could be facilitated by microenvironmental screening. This trend is apparent in the reprinting of a piece written by Lazebnik that highlights, through the use of interesting engineering analogies, how hard it is to progress our understanding of cell biology without appropriate quantitation [13]. Quantitatively mapping the inputs of microenvironmental conditions to the outputs of cellular phenotype is likely an important place to start.
Another area of impact for microenvironmental screening is the identification of biochemical targets for therapy development. It can be difficult to identify the biochemical mechanisms by which in vivo environmental conditions contribute to disease; yet, if these mechanisms could be uncovered, more targets for therapies could be pursued. An example where understanding of the microenvironment has impacted therapy development is illustrated by angiogenesis (i.e., the recruitment of blood vessels) as it relates to tumor microenvironments. It is thought that the recruitment of blood vessels is necessary for significant tumor growth; otherwise, there would be insufficient nutrient supply and waste removal [14]. The hypothesis is supported by observations that tumors are often hypoxic and densely populated by neovasculature. Further, angiogenesis is regulated by many factors in the microenvironment including the ECM and other supporting cells [14], [15]. Study of the tumor microenvironment and angiogenesis has led to the identification of pro- and anti-angiogenic mechanisms, which in turn have spurred development of many potential cancer therapies as well as other therapies related to altering the recruitment of blood vessels [14]. Similar microenvironmental screening approaches, in other contexts, could help to interrogate biochemical processes (e.g., gradients or stromal interactions) and identify mechanisms that can be influenced by new therapies.
Although screening is not new to biology, there are relatively fewexamples of microenvironmental screening [16], [17]. Other types of screening are typically aimed at observing the effect of a large number of parameters one-at-a-time (e.g., the use of chemical libraries on particular cell phenotypes in drug screening) or look at the influence of one parameter on many different readouts (e.g., micro-arrays for gene expression). Fewer screening approaches are aimed at observing the simultaneous effects of multiple parameters related to the microenvironment such as soluble factors, ECM composition, and cell–cell contact. Thus, the role of microenvironmental screening proposed here is not to be viewed as a substitute for other types of biological screening or therapy development. Instead, it should be viewed as a way to improve and expand upon current methods by helping to link the conditions of the cellular microenvironment to cellular phenotype (Fig. 1). Still, there are lessons to learn from drawing analogies to other, more developed, modes of screening, such as screening for drug discovery.
III. ANALOGIES BETWEEN MICROENVIRONMENTAL SCREENING AND SCREENING FOR DRUG DISCOVERY
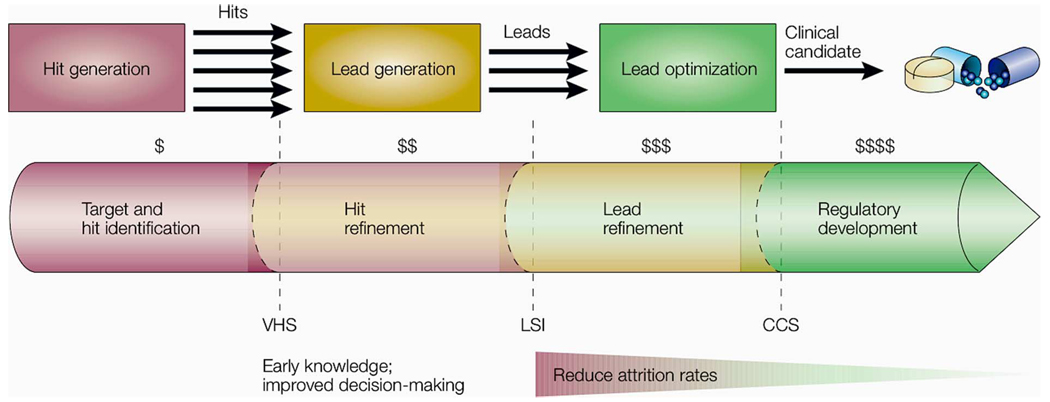
Of the many phases of drug discovery, the simplest analogies can be drawn to small-molecule screening. Fig. 2 is used to help illustrate what is meant by small-molecule screening. Typically, a panel/library of drugs is tested for interaction with proteins from potentially important signaling pathways in a binding assay [18]. Other assays (not shown) at each stage work toward the identification of drugs that exhibit a chosen set of key properties important for later success. The process continues downstream, with a similar goal of pursuing only the most promising candidates. However, at each step it is possible that molecules with therapeutic potential are mistakenly removed from the process in the interest of limiting cost and, ideally, quickly identifying therapeutic drugs. The cost of testing candidates goes up rapidly as the process moves forward making late-stage testing particularly costly [19] (see Fig. 2). Costly late-stage testing is reduced if early stages of screening result in high attrition rates compared to later stages.
Fig. 2.
Drug discovery: Stage-by-stage quality assessment to reduce costly late-stage attrition. (Hits and leads refer to candidate molecules/structures for drugs. Hits are compounds that show specificity and activity. Leads are hits, or types of hits, that show specificity and activity in a “biochemically relevant” screen.) Typical important milestones are: validated hist series (VHS), lead series identified (LSI), and clinical candidate selection (CCS), which ensure that only drug candidates with an appropriately high-potential profile are advanced to the next phase [19]. (Figure and caption reprinted with permission from Macmillan Publishers, Nature Reviews Drug Discovery, 2003.) As depicted, the earlier a poor lead can be discarded, the more money is saved. The testing methods and set of decisions to cull leads along the way defines this particular heuristic method of drug discovery.
The process is not a perfect one (i.e., it does not always identify all the possibly therapeutic drugs within a chemical library during a screen) [20]. Instead, it might be termed a heuristic approach to drug discovery. The term heuristic is borrowed here from computational methods and refers to a method of determining how and where to move through a complex search space. In this case, the search space is all the possible molecules that could have therapeutic benefit. The methods and criteria used for identifying candidates define the heuristic approach. The challenge is finding the “right” heuristic or, in other words, identifying the “right” environments and criteria for choosing candidates at each step.
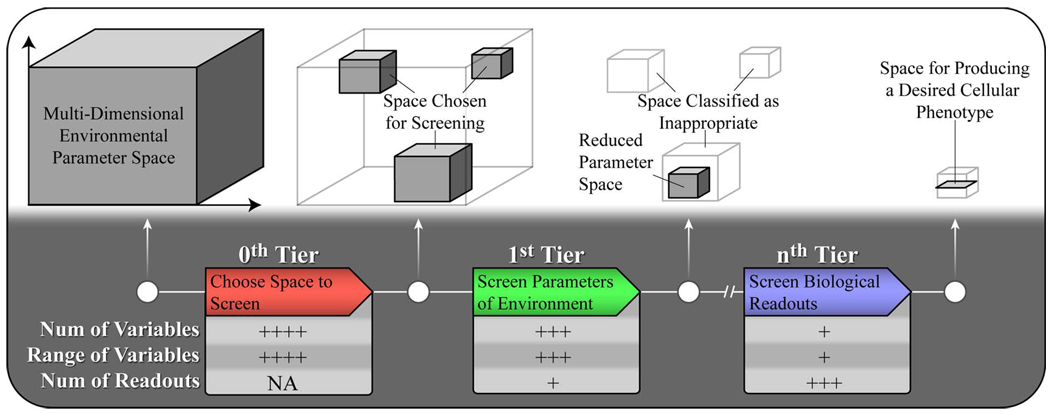
Analogies to drug discovery (Fig. 2) suggest ways to optimize microenvironmental screening (Fig. 3) and can play a role in technology and method development. As mentioned previously, late-stage testing in drug discovery can be costly, and high attrition rates early in the screening process help to mitigate those costs. This is accomplished through a multitiered screening process organized in a way that places highly selective readouts at the beginning (as depicted in Fig. 2 with dollar signs and the shaded triangle). This is in contrast to a single-tier system that performs all experimentation in a single stage. Breaking small-molecule screening into tiers gives multiple chances to filter out unpromising parameters to streamline the next step in the search process.
Fig. 3.
Multitiered approach to screening the microenvironment. The bottom half of the figure describes the process of screening and filtering environmental parameters as one moves to the right. The 0th tier represents the decision process of choosing an initial screening space. The first tier is focused on reducing the large number of environmental variables using only a few biological readouts. The process comes to an end with the nth tier, which in this case is meant to represent the last tier in a screen for phenotype. In the nth tier the original screening space has been filtered to a small sub space that is examined using a diverse set of biological readouts to thoroughly characterize the model phenotype. The upper half illustrates visually the reduction of the environmental screening space throughout this process. Similar to drug discovery, it is hoped that the attrition rate of screening space reduces with each tier to maximize the benefits of a multitiered design and mitigate the loss of important variables.
Similarly, a multitiered approach could be employed in microenvironmental screening. In the Prudhomme example discussed previously, they were fortunate to have a single readout (Oct-4 expression) to infer the differentiated state of their cells (the phenotype of interest). This may not always be the case. If multiple characteristics were needed to classify the cells for the purpose of selecting a specific phenotype, it might be more efficient, depending on the necessary readouts, to first screen for the most selective/unique characteristic first, and so on. (See Challenge 1 of Section IV and Table II for further discussion and example calculations regarding the benefits of the multtiered approach.)
TABLE II.
Multitier Structure Can Reduce Total Number of Datapoints by Varying Number of Inputs and Outputs at Each Tier but Results in More Experiments Overall. See Example Calculations Using (1)
| Values per | Culture | ||||
|---|---|---|---|---|---|
| Param’s | Param | Outputs | Expts | Datapoints | |
| Single Tier | |||||
| Tier 1 | 5 | 3 | 15 | 243 | 3645 |
| Multi-Tier | |||||
| Tier 1 | 5 | 3 | 2 | 243 | 486 |
| Tier 2 | 2 | 3 | 5 | 9 | 45 |
| Tier 3 | 1 | 3 | 15 | 3 | 45 |
| Total | 255 | 576 | |||
To begin another analogy, the drug discovery industry has also found that an appropriate level of diversity in the drug libraries used for initial testing is important to the success of a screen. If diversity is too wide, random, or redundant, efficiency is reduced; and if the panel is too narrow, the chance of success is reduced [19]. One way the drug industry selectively narrows diversity is through the development of sublibraries, matching drug motifs with target proteins. The development of sublibraries is often based on computational modeling of specific protein classes such as G-protein-coupled receptors, ion channels, kinases, and proteases [21] and could be considered an example of biomimicry (i.e., a process of developing experiments and models using the in vivo system as a guide). Further, as chemical diversity is somewhat subjective, the method of evaluating diversity is also important [22].
We can apply the concept of “appropriate diversity” to cell biology and screening the microenvironment as well. A diverse range of parameters should be considered, yet the range of possibilities might be narrowed by employing a biomimetic approach. For example, it has been shown that some cells behave quite differently in terms of adhesion and even migration on 2-D substrates as compared to when they are cultured in 3-D matrices [23]–[25]. Thus, screening limited to culture on a 2-D substrate might be prone to artifacts, whereas if 2-D and 3-D methods were employed, associated artifacts of either constructs might be identified and an appropriate choice between 2-D and 3-D can be made. Moreover, the in vivo system of interest can be used to suggest which choice might be appropriate. For example, endothelial cells typically form tubes in vivo, yet it is rare to see endothelial tissues form tubes on a planar adherent substrate [26]. In this way, use of an appropriately diverse range of environments is important to the development of in vitro models and directly impacts their subsequent relevancy and utility. The concept of choosing an appropriately diverse screening space is illustrated in Fig. 3 as the 0th tier.
Fig. 3 summarizes the overall structure of microenvironmental screening and some of its characteristics. It is expected that initial stages of screening the microenvironment will involve a large number and wide range of environmental parameters along with a simplified or small set of biological readouts. As the number and range of environmental parameters reduces with each stage of screening, the number and rigor of each biological readout is expected to increase. If the end goal of screening is a set of environmental conditions for a particular in vitro model, the final step (i.e., the nth tier) in the process would likely be to compare a restricted set of environmental parameters to an appropriate standard using a diverse set of biological readouts. The diverse comparison of biological readouts to a known standard is suggested as a means to validate the model and, depending on its intended use, validation results could be a way to estimate the predictive power of the model. However, results from previous tiers can also support validation and estimation of predictive power.
With the idea of microenvironmental screening better defined, we now examine the associated technological challenges and highlight some types of technology and methods that can help address those challenges.
IV. THE NEED FOR INCREASED THROUGHPUT AND MICRO-SCALE TECHNOLOGY
As the size of the experimental parameter space increases for screening the microenvironment, it becomes difficult to justify the use of macro-scale in vitro methods in lieu of micro-scale alternatives. A reason for this is due to the exponential increase in the number of experimental conditions as one tries to explain more and more biological interactions [see (1)]. The exponential increase in the number of experiments creates multiple challenges that must be addressed by the technology used for screening. Exponentially growing problems are costly to solve in terms of resources and time. For perspective, consider a computational problem of size n = 100 where the complexity (or number of calculations needed for a solution) is considered to increase as 2n It would take a modern computer more time than the current age of the universe to solve it. Similarly, the amount of resources needed to explore the nature of interdependent and dynamic cellular mechanisms can be costly. Macro-scale methods (e.g., Petri dishes and six-well plates) generally use more resources and are slower per experiment than high-throughput micro-scale methods. The analog of moving from macro-scale techniques to high-throughput micro-scale techniques in the computing world would be to use a faster computer and a less memory intensive algorithm; however, despite the linear benefits of increased computational power, the exponential nature of the problem still exists.
The following hypothetical biology experiments help to illustrate the meaning of (1) and the exponential increase in complexity.
A. Complexity Analysis and Illustrative Examples
P, V, and O are used in the examples to represent the input parameters, possible values of those parameters, and outputs of a set of hypothetical experiments to illustrate the complexity of a systems biology approach to screening the microenvironment. Different questions in cell biology require different levels of complexity, and the complexity is a function of the number of Vs and Os.
1) Level 1 Hypothesis
Does the presence of fibroblast growth factor 2 (FGF-2) at a concentration of 1 nM increase proliferation of mesenchymal stem cells (MSCs) when all other parameters are held constant (i.e., cultured on polystyrene coated with fibronectin at 5% CO2, etc.)? Excluding controls, one experiment with one readout must be performed resulting in1×1 = 1 data point per replicate
 |
2) Level 2 Hypothesis
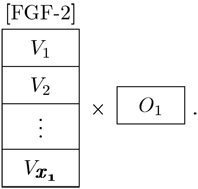
What is the dose response of MSCs to FGF-2 in terms of proliferation? There are now multiple possible values for the FGF-2 concentration, [FGF-2], and a single output
 |
3) Level 3 Hypothesis
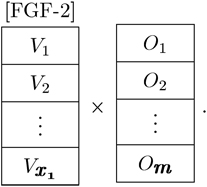
What is the dose response of MSCs to FGF-2 in terms of expression and behavior? There are now multiple possible values for the given parameter and multiple outputs
 |
4) Level 4 Hypothesis
What is the influence of FGF-2 on MSCs in various contexts (i.e., From a systems biology point of view, what is the effect of FGF-2 with different combinations of parameters and types of parameters such as other soluble factors, extracellular matrix (ECM), the presence of other cell types, etc.?)? The study is expanded to include multiple parameters and outputs. Each new parameter adds a new dimension to the study, and if all the parameters of the microenvironment were examined, the number of necessary experiments would become unmanageable
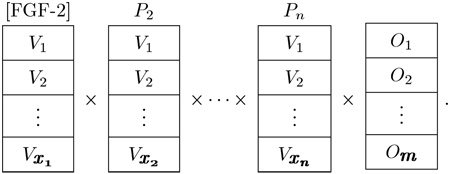 |
The final steps in searching this hypothetical parameter space would be to observe the temporal dynamics of the system, adding time as a variable, and to perform the necessary replicates.
The size of the experimental space can be put into the form of an equation. As suggested with subscripts in the previous figures, if there are n parameters, m outputs, and xj is the number of possible values of parameter Pj, then the total number of data points per replicate in the experiment is given by
| (1) |
Equation (1) is not actually the form of an exponential; however, if the number of possible values of each parameter is the same, the equation does simplify to an exponential form. Although such an assumption does not always apply, the term exponential is used to help illustrate the notion of a roughly exponentially expanding parameter space instead of as a rigorous description of the problem.
B. Challenges
Four main challenges pertinent to a choice of an in vitro platform for microenvironmental screening arise as we increase in the level of complexity. First is the volume of resources required to perform the large number of screening experiments. Second and third are the ability to collect and analyze the increasing amounts of data. The fourth is the ability to physically integrate the diverse range of parameters necessary for screening the microenvironment. Although data analysis is an important challenge facing systems-based cell biology and is a major focus of informatics research, it is primarily the other three challenges that currently limit the use of macro-scale methods for microenvironmental screening.
1) Challenge 1—Volume of Resources
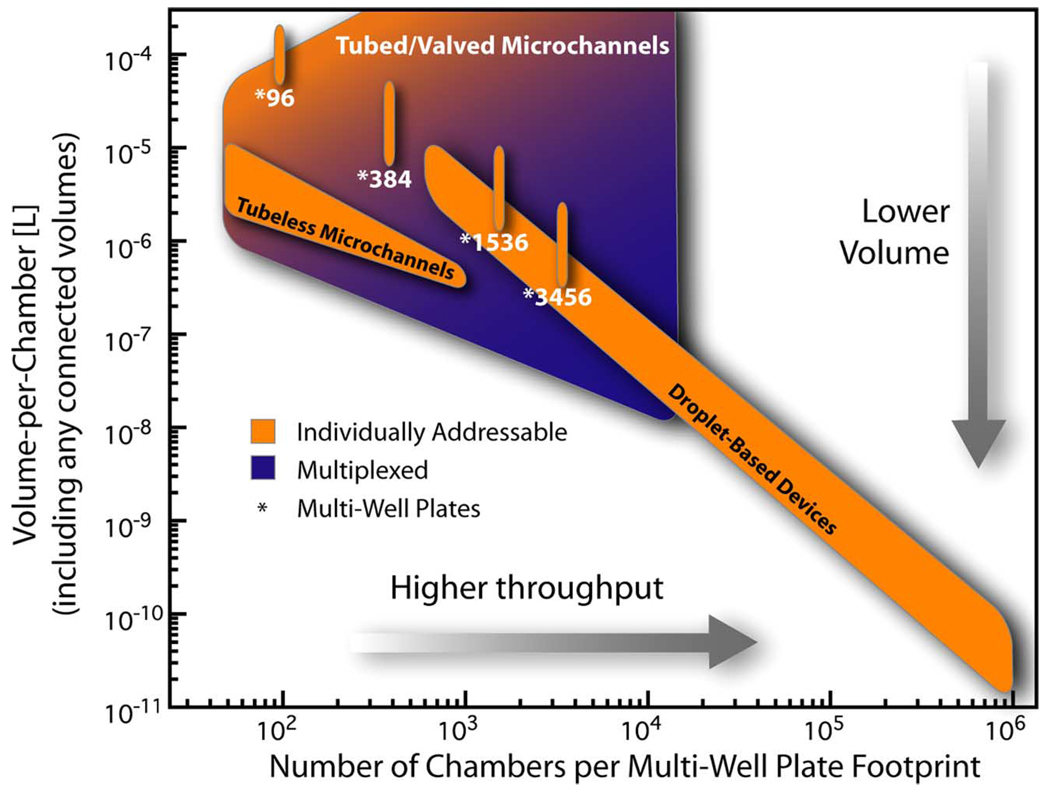
As the number of experimental conditions goes up, so do the required amounts of limited resources. Macro-scale technology typically uses mL’s of reagents, millions of cells, and minutes of labor per datapoint. One way to mitigate these costs is to move the experiment to the micro scale. If the same data can be obtained on the micro scale, volumes often go from mL’s to µL’s, cell numbers can go from millions to thousands, and labor times could possibly go from minutes to seconds per datapoint (Fig. 4 and Table I). Each order of magnitude savings in these areas can have a similar effect on the monetary cost of each datapoint, which is then multiplied by the number of datapoints and replicates. The result is a potential cost savings that can facilitate more extensive and comprehensive studies of cell biology and is a notion that is supported by trends in drug discovery. In drug discovery, miniaturization and automation have reduced the fluid-volumes needed per assay while increasing rates of compound screening and reducing man power requirements [21]. For these reasons, there is a significant motivation to use micro-scale technology for screening the microenvironment. This assumes that the cost of the micro-scale technology does not rise accordingly to cancel the savings.
Fig. 4.
Plot of approximate volumes-per-chamber across a range of spatial densities using different types of devices. The figure shows ranges of operation for traditional multi-well plates, tubeless microchannels, tubed/valved microchannels, and droplet-based devices (see Section X for descriptions and references). Tubeless microchannels can offer a reduction in volume-per-assay compared to multi-well formats of similar density but can still preserve the ability to individually address an assay compared to tubed/valved devices that use the same volume. Volume-per-assay increases for tubed/valved microchannels when implemented to individually address chambers due to increases in dead volumes, routing, tubing, or numbers of connected reservoirs, whereas multiplexing of fluid sources decreases the average volume-per-assay. Droplet-based fluidics typically deals with volumes below a few microliters and has the potential to manipulate picoliter volumes at high densities.
TABLE I.
Fluid Volumes and Typical Cell Numbers Per Well for Standard Multiwell Plate Formats
The multitiered approach is also important in addressing the challenge of limited resources. More specifically, a multitiered process can reduce costs (e.g., the time, money, or complexity) related to the readouts (or outputs) of a screening process, as opposed to the costs of controlling the microenvironment and culturing cells. The cost of readouts can be reduced by initially using cheaper readouts that are adequate for suggesting which parameters and parameter values should and should not be pursued in subsequent stages. Later stage testing can involve more expensive readouts that provide a better characterization of phenotypic outcomes and mechanisms for a reduced parameter space. Having multiple tiers also increases the number of total experiments compared to a single-tiered approach which uses a full compliment of readouts in the first and only stage of testing. Example calculations in Table II help to illustrate these points. Thus, the process of microenvironmental screening can be adjusted depending on which resources are most limiting.
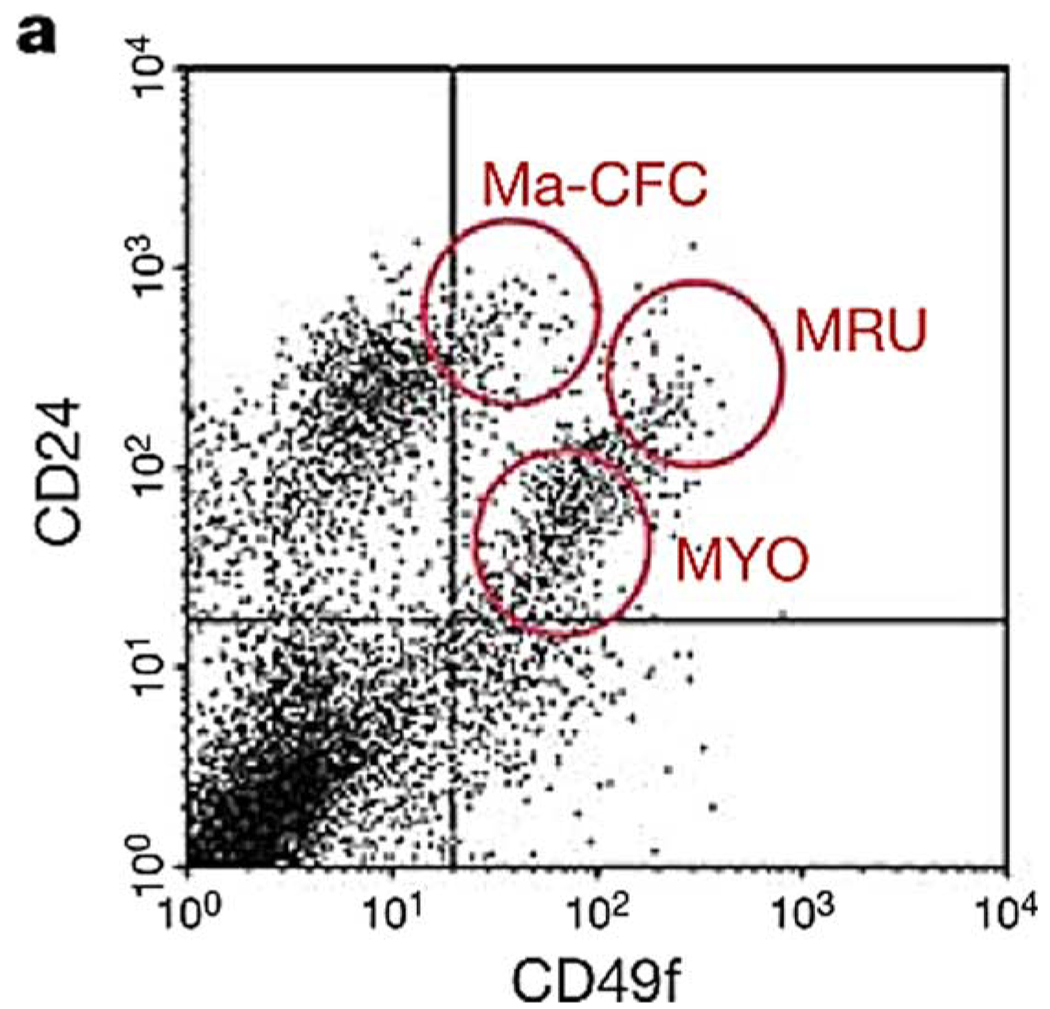
Stem cell research is acutely affected by Challenge 1 due to the nature of stem cells. In general, stem and progenitor cells are rare populations that can be difficult to isolate [1]–[4], [29], [30]. For example, it is estimated that ~1400 mammary progenitors or mammary repopulating units (MRU’s) exist in a suspension of dissociated cells from a single mammary gland of an FVB mouse where the gland consists of ~2 million total viable cells. Sorting procedures to isolate the MRU’s both reduce yield and increase the relative frequency of MRU’s in the suspension. Thus, from a single gland, only hundreds of MRU’s can be expected (see Fig. 5) [31], [32]. Even in the case of human embryonic stem cells (hESCs) which can continue to self-renew, yields of clonal populations are still quite low. Typically, < 1% of hESCs initially seeded into culture will produce another population of identical stem cells [33]. Further, thousands to millions of cells would be needed for culture and subsequent study in macroculture. However, on the micro scale, various cell types have been cultured in numbers ranging from 1 cell to thousands [34], [35]. Also, ethical concerns encourage very judicious usage of resources such as any primary cell type taken from animals or humans. Thus, the micro scale can likely enable new discoveries related to cell sources that exist in limiting quantities.
Fig. 5.
Example of sorting protocol to obtain progenitor cells or mammary repopulating units (MRU’s) from the mammary gland of a mouse. CD24 and CD49f are used, along with various lineage markers are used in FAC sorting to obtain the above plot. Only cells in the MRU identified region are suggested as being highly enriched for cells that can reconstitute an entire gland from a single cell. Additionally, Ma-CFCs = mammary colony-forming cells and MRUs = mammary repopulating units [32]. (Figure reprinted with permission from Macmillan Publishers, Nature, 2006.)
This first challenge is also a major reason to move to a high-throughput format for cell studies, which does not necessarily go hand in hand with micro-scale techniques. High throughput is used here to mean that many experiments are processed either at once in parallel (parallel high throughput) or in an approach similar to an assembly line (continuous high throughput) to reduce the average time per experiment. The expedition and increased coordination of experiments through the use of high-throughput methods helps to address time constraints of cell biology and micro-scale technology, such as the possible effects of evaporation, depletion of soluble factors, and buildup of waste products in small volumes [36]–[40]. Human error is also a significant consideration when experiments increase in size and especially when treatment groups are randomized for location. Automation of high-throughput practices can help to manage the complexity of such studies. Micro-scale technology for cell biology has produced a wide variety of functionalities in terms of manipulating the microenvironment but does not always translate to high-throughput formats, not to mention the ability to integrate with existing technology for assay automation.
2) Challenge 2—Data Collection
Assuming one can perform multidimensional studies, a technique must exist to gather the desired information from the cells or surrounding media. Challenge 2 has issues similar to those discussed in Challenge 1 but also has additional issues related to the use of measurement technology with micro-scale or high-throughput methods. Some macro-scale readouts can consume considerable amounts of time and money (e.g., western blots) and may not be appropriate for studies involving thousands of experimental conditions. However, if experiments move to the micro scale, reduced sample volumes and cell numbers may make it increasingly difficult to obtain significant signal-to-noise ratios or interface with detection devices (e.g., typical flow cytometers have difficulty with volumes approaching a few µL). Assuming a current technology can handle micro-scale volumes, the technology may still not be amenable to automation or increased-throughput. Thus, creating or adapting current biological readouts for screening large parameter spaces will be an important challenge to increasingly complex experimental designs.
One simplification that can be made to alleviate the constraints of data collection is the use of indirect correlative readouts that facilitate high-throughput screening. If an indirect readout can be shown to correlate with a characteristic of interest and is much easier to implement in a high-throughput scheme, it may be advantageous to replace the direct measurement with an indirect measurement. Indirect readouts can be used in the early stages of multitiered screening when there are many experimental conditions. More direct measurements can be used in late-stage experimentation and can be used to confirm results of indirect readouts from earlier stages. Some indirect readouts may be so abstract that a more appropriate term for them would be signatures, having little relationship to any mechanistic understanding of the system. It could be argued that some cell-surface marker profiles for identifying phenotype fit this definition.
An example of a signature can be seen in the previously mentioned study by Stingl et al. where cell-surface markers and fluorescence-activated cell sorting (FACS) were used to identify mammary progenitor cells. The FACS plot (Fig. 5) shows multiple cell distributions, and although some distributions can be reasoned according to our current knowledge of the markers and their associated phenotypes, the small subpopulation representing the progenitor cells (labeled MRU’s) is not obviously different than cells nearby on the plot. However, it has been shown that it is possible to use a single cell from MRU subpopulation to reconstitute an entire mammary gland [31], [32] allowing the intensity signature of the markers to be used as an indirect readout for “stemness” of epithelial cells in the mammary gland of mice.
Other signatures might include observations such as cell size (indicated by forward scatter in flow cytometry) [41] or cell morphology and organization [42]–[44]. Yet, if the readouts are easy to obtain and have been shown to correlate with biologically interesting behaviors or properties, the signatures could show promise in microenvironmental screening and for miniaturization. Methods of detection for high-throughput readouts are often measures of intensity, absorbance, resistance, or capacitance. Electronic measurements such as these aid speed and accuracy (e.g., platereaders for fluorescence, absorbance, and radiation, as well as flow cytometry using the fluorescent or electrical properties of cells).
3) Challenge 3—Data Analysis
Last in the work flow of large-scale experiments is data analysis, which is sometimes overlooked as a challenge to cell biology. The cyclical process of developing and testing hypotheses is often driven by data analysis and interpretation. For relatively small studies with few variables, humans can identify trends, correlations, and attribute context dependent relationships to current theories in biology. Typical tools to do this are the basic plot or table. With the aid of basic metrics and standard statistical methods, the extent of those relationships can typically be quantified. However, as the data becomes more multidimensional, display and interpretation of the data becomes less straightforward, hampering the development of new hypotheses [45], [46].
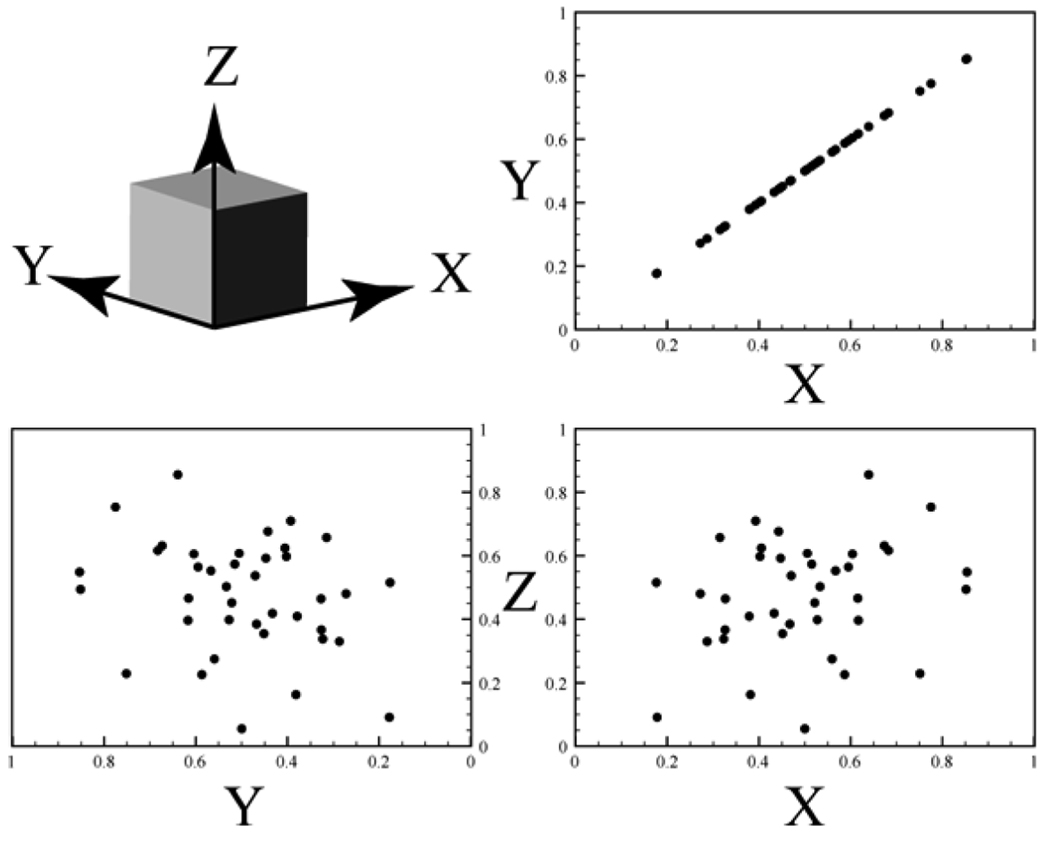
Part of the difficulty is due to complex context-dependent relationships that allow a single environmental cue to cause different behaviors in different contexts and the difficulties related to statistics of large data sets [46]. In many cases, a significant portion of the parameters has little effect on a system and makes interpretation more difficult. In these cases, methods such as partial-least squares analysis or principle component analysis can be useful for identifying only the most relevant parameters of a system, simplifying a multidimensional parameter space (see Fig. 6) [10], [47]–[50]. However, training in such statistical methods is less common compared to training in the analysis of one or two parameters.
Fig. 6.
Generic example of parameter reduction. In this case, it can be seen that information about parameter Z provides no benefit in describing any relationships between parameters. Instead, any significant behavior of the data can be completely described by X and Y. Thus, the system can be reduced from a 3-D parameter space to a 2-D space. Similarly, partial least squares regression or principle component analysis are used to describe multidimensional data with only the parameters that contribute the most to system behavior. Information similar to this might be used for the basic process of candidate identification or, with additional analysis, development of behavioral models.
4) Challenge 4—Integration of Diverse Microenvironmental Components
As more variables are added to an experiment, it can become more difficult to flexibly and simultaneously control them all (Fig. 1 and Fig. 3). It might be considered even more challenging when the variables are quite dissimilar, such as soluble factors and mechanical stimuli. Tools from different disciplines such as chemistry, biology, mechanical engineering, and physics will likely be required to successfully engineer the multidimensional microenvironment.
Further, an integrating platform will also be needed to bring the functionalities together for a single purpose. Functionalities that the platform will likely need to support include: treatments, washing, patterning of cells and proteins, gradients of soluble and insoluble factors, maintenance of cells within artificial 3-D matrices, and the ability interface/integrate with detection devices. Moreover, due to limited resources, the technologies and integrating platform will likely need to function on the micro scale and be amenable to high-throughput experimentation.
V. SUMMARY OF CHALLENGES AND MOTIVATION FOR USE OF MICROFLUIDICS
The four challenges highlighted above argue for: 1) a multitiered and micro-scale approach to screening due to limited resources and a resource intensive endeavor; 2) high-throughput methods to address experimental complexity and the time constraints of biology, especially on the micro scale; 3) the ability to integrate with automation in order to coordinate increasingly large and complex experiments more efficiently and accurately; and 4) the ability to integrate and control a diverse range of functionalities and elements of the microenvironment. Thus, a technology aimed at general screening of the cellular microenvironment should facilitate functions beyond those which are needed to engineer the microenvironment and instead facilitate the entire screening process.
Microfluidics is a micro-scale technology that has been used to integrate techniques and methods from a wide variety of disciplines for the purpose of engineering the microenvironment of cells (i.e., micro-scale cell culture), sample detection, increasing throughput, integrating with automation, and interfacing with a range of other technologies. For these reasons, microfluidics is considered here for use as an underlying platform for microenvironmental screening.
There have been many reviews of microfluidics related to its fundamentals and use in cell culture and biochemistry [17], [40], [51]–[59]. The following sections give a brief review of microfluidics from the point of view of microenvironmental screening. Microfluidic examples are provided that illustrate control of soluble factor signaling, integration of methods to control ECM composition, and ways to modulate cell–cell contact. There is also a discussion of microfluidic platforms that is aimed at bringing functionalities together for automated high-throughput multidimensional studies of cell biology. Finally, areas of immediate need or deficit in microfluidics will be highlighted.
VI. BASICS OF MICROFLUIDICS AND MICROFLUIDIC CELL CULTURE
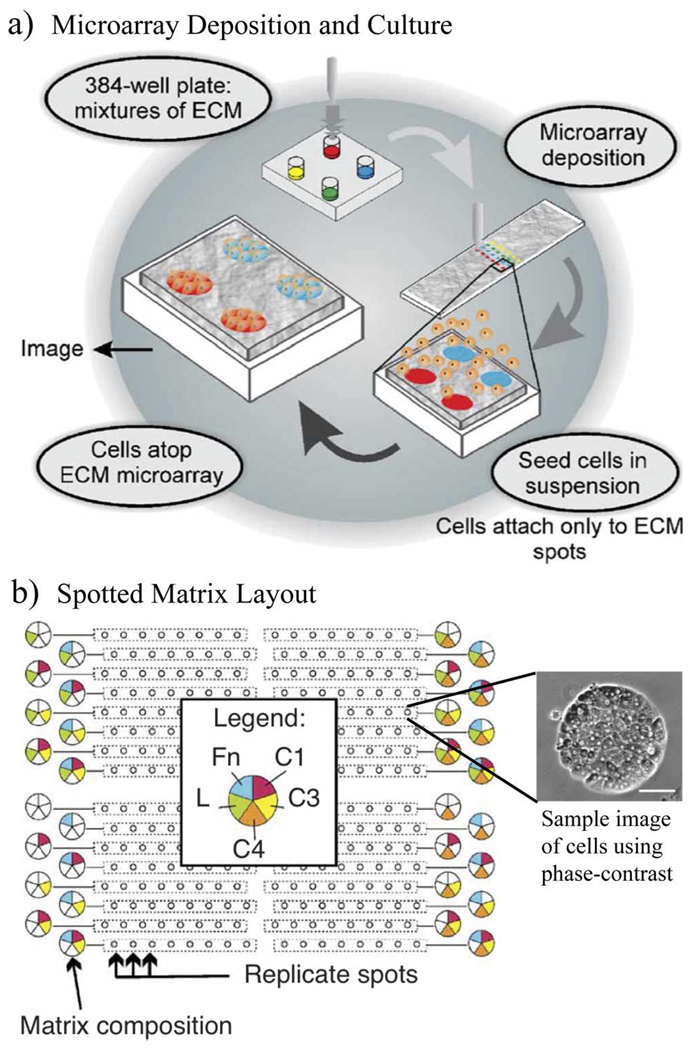
One might argue that the most basic microfluidic technique for micro-scale cell culture is that of micro-arrays. In the case of micro-arrays, very small regions are partitioned on a surface via the use of pipettes, dip-pens, printers, stamps, lithography, or other dispensing/patterning technologies. Each region typically represents an individual assay and can be treated individually or submerged within a communal medium. This technique has already been used to screen for the effects of panels of ECM compositions, ECM/growth factor (GF) combinations, biomaterials, and transfections (Fig. 7) [60]–[67]. The referenced examples are some of the first experiments to show the benefits of micro-scale screening of the microenvironment. Obvious benefits of micro-arrays are low volume usage, simple implementation, and the ability to automate experiments. They are also a natural progression from assays performed in 384 and 1536 well plates. However, there is little additional functionality in the control of other environmental parameters compared to macro-scale analogs. One advantage of micro-arrays relative to micro-wells is the ability to pattern cells, which can be used to modulate soluble factor signaling and cell–cell contact when cultured within a single volume of media [64], [68], [69].
Fig. 7.
Example of using microarray dispensing to screen for effects of ECM composition. Phase contrast image scale bar is 50 µm. (a) Summary of experimental methods. (b) Layout of experimental parameters and example image of cells on a culture spot. Fn = Fibronectin, L = Laminin, C1 = Collagen I, C3 = Collagen III, C4 = Collagen IV [61]. (Figures reprinted with permission from Macmillan Publishers, Nature, 2005.)
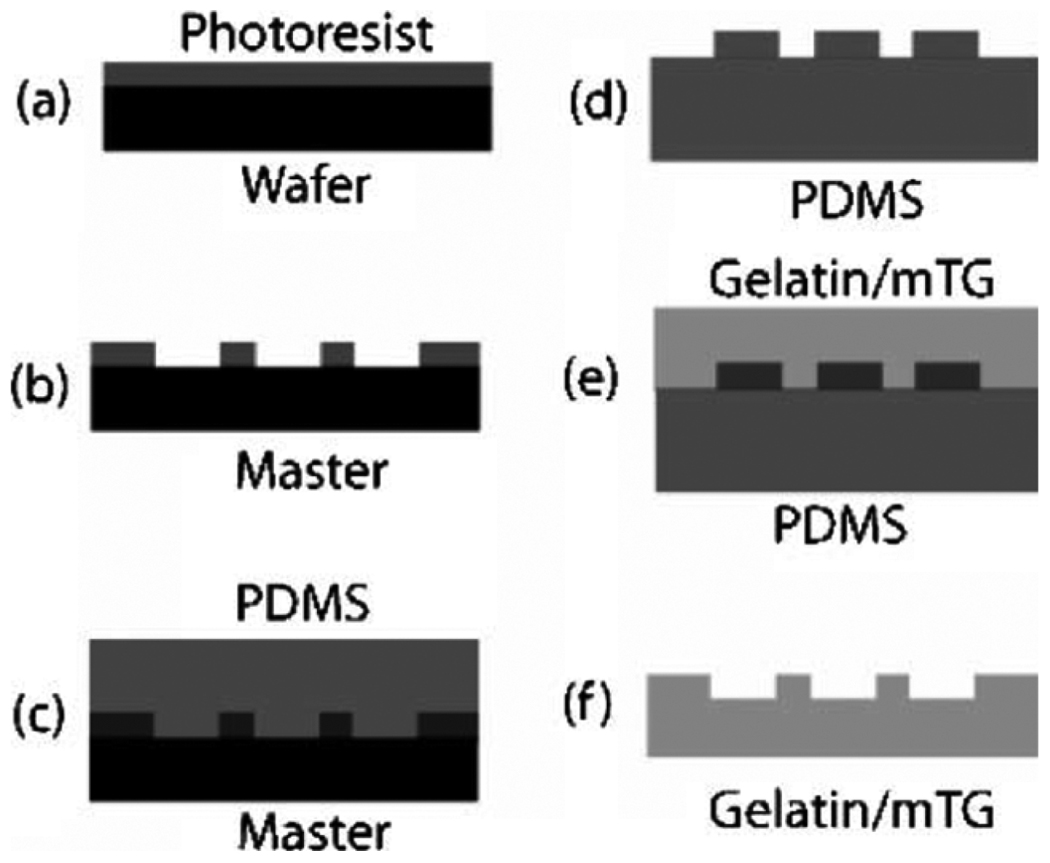
Beyond the deposition and patterning of small volumes, a more traditional view of microfluidics is the use of micro-fabrication techniques to produce fluidic components such as channels, chambers, pumps, valves, and mixers. Likely, the most common technique for creating microfluidic devices is the use of photolithography to create a mold from which devices are formed using poly-dimethylsiloxane (PDMS) [see Fig. 8(a)–(d)]. This technique allows precise definition of micron-scale features in a device that is largely well suited for cell culture with the possible caveat of absorption of small lipophilic molecules [52], [70]–[72]. The PDMS devices themselves can then be used as molds for other materials such as gelatin in a process called soft lithography [shown in Fig. 8(d)–(f)].
Fig. 8.
Schematic of PDMS device/mold fabrication from a mold created using (a)–(c) photolithography and (d)–(f) subsequent manufacture of a gelatin device from a PDMS mold using soft lithography. Photoresist is typically spin coated onto a (a) silicon wafer. (b) The photoresist is exposed to UV through a photomask, and unpolymerized photoresist is removed in a developing solvent to produce a master. PDMS is then cured on (c) this master and used as (d) a mold for gelatin. The gelatin and enzyme solution is then poured over (e) the reusable, flexible PDMS mold and the polymerized device is then (f) pulled off the mold [73]. (Figure reproduced by the permission of The Royal Society of Chemistry, 2006.)
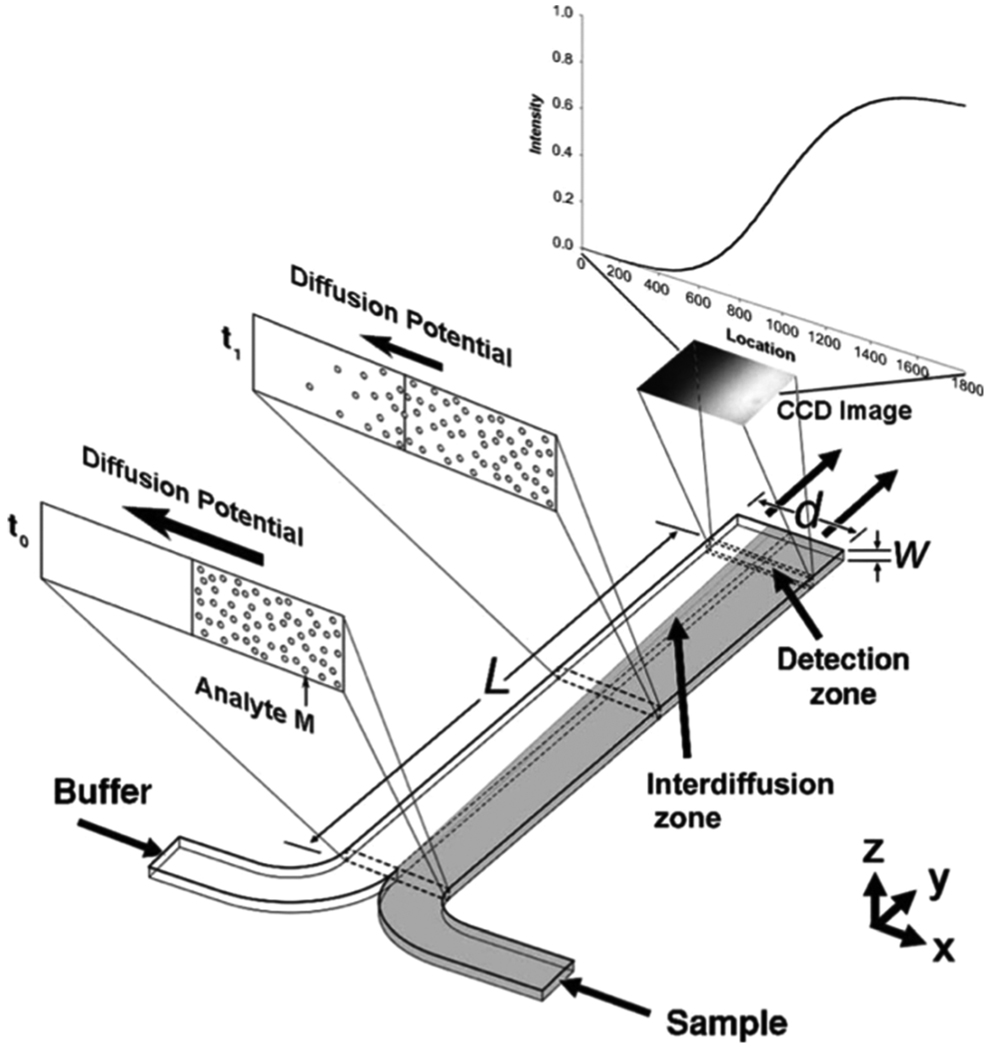
Fluid behavior is different on the micro scale versus the macro scale. This is because there is a new balance of physical forces. On the micro scale, surface tension can dominate gravity and viscosity can dominate inertia. The dominance of viscosity causes flow to be laminar, following predictable streamlines. In fact, two separate laminar flows can be brought together into one with almost no convective mixing to flow side-by-side. Instead, diffusion will be the source of mixing between the streams as shown in Fig. 9.
Fig. 9.
Example of a microfluidic device that uses laminar flow to produce side-by-side flow of two different streams and depicts the diffusion of an analyte from one stream to the other [74]. (Figure reproduced by permission of IEEE, 2004.)
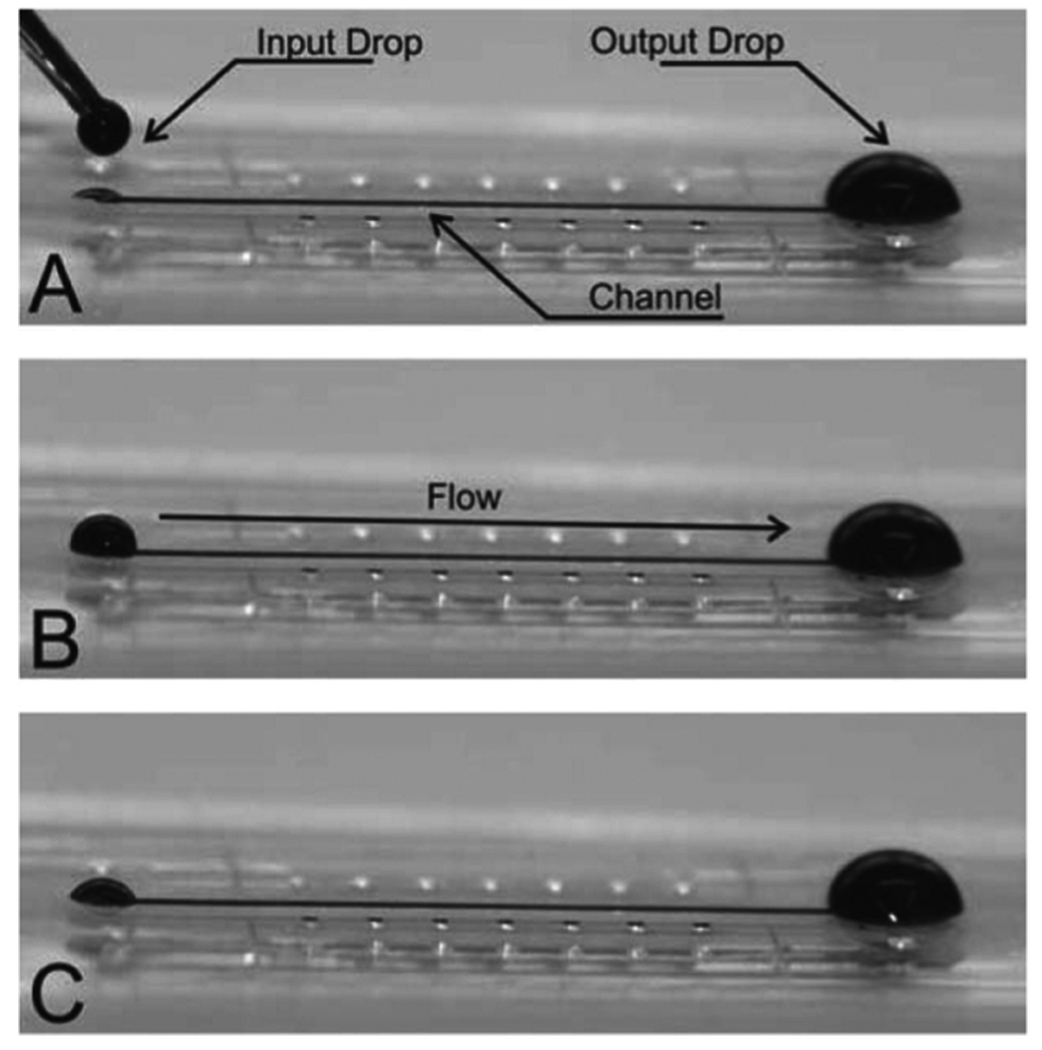
An example of surface tension on the microscale is its use for pumping fluid through channels as shown in Fig. 10. According to the Young–Laplace equation, droplets with smaller radii of curvature have a higher internal pressure than those of larger curvature of the same fluid. The resulting pressure difference is adequate to move microliters in ~1 s, even when working against gravity, and has been referred to as passive-pumping [75]–[77]. Similarly, capillary forces can play a significant role in micro-device behavior.
Fig. 10.
Depiction of passive-pumping and the increased role of surface-tension on the micro scale. The pressure from surface tension in the small drop on the left is greater than on the right, driving the dispensed volume to the right [75]. (Figure reproduced by the permission of The Royal Society of Chemistry, 2007.)
Micro-scale fabrication techniques and properties of fluids and diffusion are leveraged to create functionalities such as pumps, valves, conduits, and mixers for various aims in chemistry and biology. Specifically, we will be interested in microfluidic techniques to: 1) control soluble factor signaling; 2) integrate chemically and mechanically modified ECMs; and 3) study the effects of cell–cell contact as these basic functionalities form the core of modulating the cellular microenvironment.
VII. SCREENING SOLUBLE FACTOR ENVIRONMENT
There are multiple ways in which the soluble factor environment can be screened, including using different types of soluble factors, concentrations, gradients, cell patterns, and also by changing the effective culture volume (or ECV) of the system.
The ability to screen different types and concentrations of soluble factors depends heavily on the functions of treating and washing the cell culture volume. In some cases, microchannels can be washed more efficiently and accurately compared to standard microwells and is highlighted in previous work [78]. The increased ability to treat and wash the cell culture volume stems from the fact that fluid in microchannels is replaced (i.e., there is an input and output for flow), whereas in a typical well, fluid is added or removed.
The process of treatment or washing involves one fluid that is initially in the culture device at concentration Cold, and another fluid that is being introduced to the channel at concentration Cnew. The ability to wash or treat a channel can be measured using the ratio ϕ, which is given by (2). Cactual is the final concentration after washing or treatment. A value of 100% means that washing or treatment was completely successful in replacing the old fluid with the new such that Cactual = Cnew
| (2) |
The act of replacing a volume of fluid in a microchannel was characterized and found to follow (3). The equation for a single treatment or wash is in terms of the volume of the channel, Vchan; the input volume, Vinput; and the cross sectional geometry of the channel, summarized using ζ (see [78] for other assumptions in the derivation of this equation). ζ for rectangular cross sections is between 0.17 and 0.33, which represents a square cross-section and an infinitely wide (or tall) channel, respectively. Equation (3) was then used to estimate concentration errors arising in microchannels for a given error in the dispensing of fluid volume and compared to treatments in standard wells. Findings indicate that microchannels could be employed to achieve errors many times less than standard wells providing more effective washing and treatments for volumes typical of high-throughput screening
| (3) |
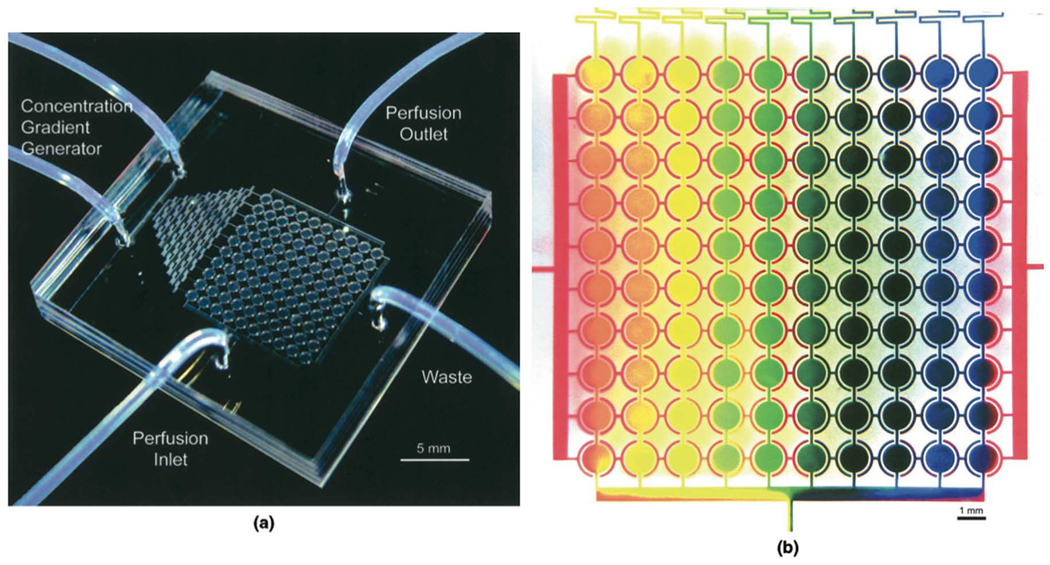
Further, microchannels can facilitate the simultaneous mixing and routing of fluid within a device to simplify screening of multiple concentrations. Fig. 11 shows one such microfluidic device developed by Hung et al. [79], [80]. The device employs the use of a gradient generator to produce various treatment concentrations for cells, as illustrated using dye to produce colors ranging from red to blue.
Fig. 11.
Example of simultaneous dilution and delivery of reagents to screen multiple concentrations. (a) Picture of device. (b) Gradient generator is used to provide the circular culture chambers with a range of reagent concentrations [80]. (Figure reproduced by permission of Wiley, 2004.)
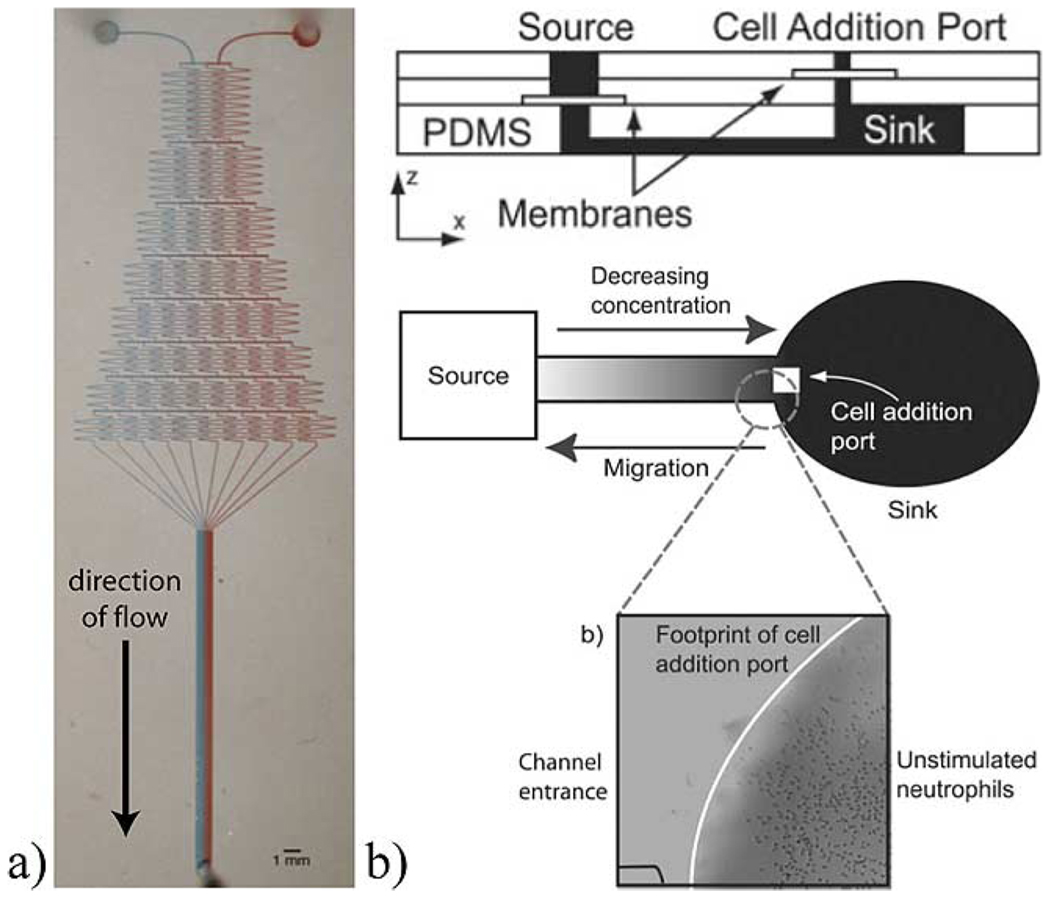
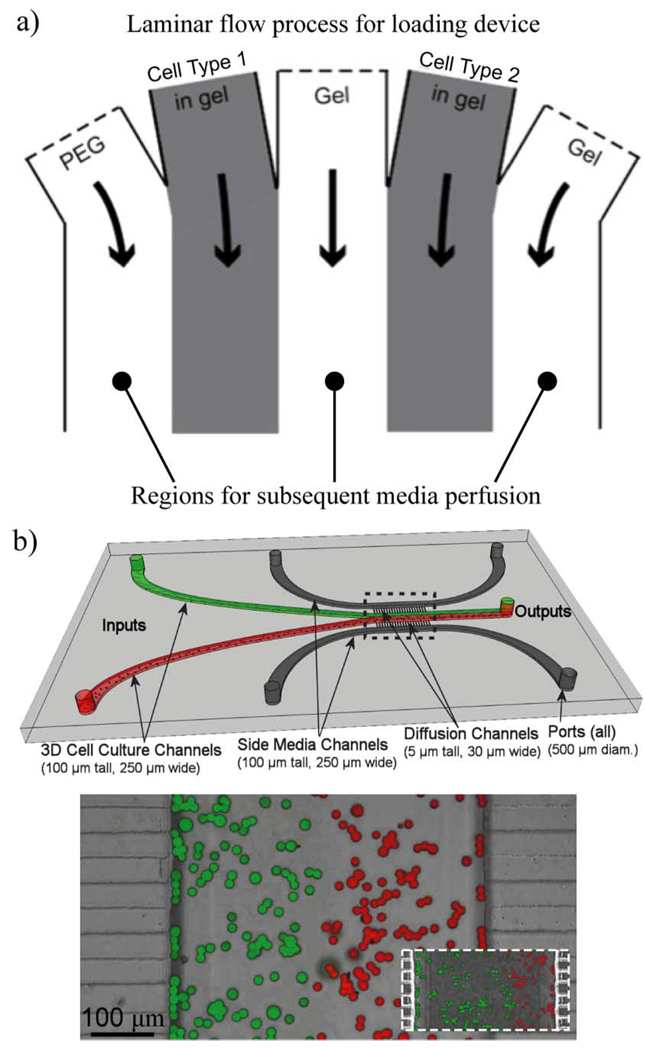
Gradients can also be applied within cell culture chambers to study the effects of local concentration gradients and are reviewed extensively by Keenan and Folch in [81]. Gradients can typically be categorized into being flow-based or nonflow-based, static or dynamic, and 2-D or 3-D. Examples of flow-and nonflow-based gradient generators are shown in Fig. 12. Dynamic gradients are tunable, giving temporal (or on-the-fly) control over the gradient profile, an example of which was developed by Keenan et al. using microfluidic “jets” [82]. Fig. 13 shows examples from Puccinelli et al. and Wong et al. of microfluidic devices that can be used to develop gradients for either 2-D or 3-D cell culture [83], [84]. Laminar flow is used in these examples to create patterned regions of cells/gels for subsequent culture.
Fig. 12.
Examples of microfluidic gradient generators. (a) Flow-based dynamic gradient generator. Microchannels are used to mix streams in varying dilutions and brought together with laminar flow to form a gradient across the channel width [85]. (Reproduced by permission of the MRS Bulletin, 2005, characterized in [86].) (b) Gradient generator without flow. A concentration source and sink are connected via a microchannel using polyester membranes to facilitate cell loading and eliminate transient flow that could disturb the concentration profile [87]. (Figure reproduced by permission of The Royal Society of Chemistry, 2006.)
Fig. 13.
Microfluidic devices for 2-D or 3-D co-culture and transverse gradient generation. (a) Wong et al. show a device used for partitioning a mirofluidic channel using gels to enable tunable 3-D cell culture. Separation is achieved with laminar flow using a syringe pump. (Reprinted from [83] with permission from Elsevier, 2008.) (b) Puccinelli et al. achieve patterned 3-D culture using passive pumping. The red and green halves of the culture channel represent the separation of the two cell types via laminar flow. The outer media channels allow access to each cellular compartment via diffusion through the small diffusion channels and enable gradient generation. The pictures at the bottom demonstrate the ability to visualize the separation of the cell types despite the close contact between streams with the insert showing how pressure can be used to vary the widths of each region [84]. (Figures and captions adapted and reproduced by permission of The Royal Society of Chemistry, 2008.)
The devices of Fig. 13 also highlight an important aspect of soluble factor control in three dimensions. As perfusion through 3-D matrices is often quite difficult, nutrient and waste exchange with the supporting media is typically limited to the boundaries of the ECM and is controlled by diffusion [see side channels of Fig. 13(b)].
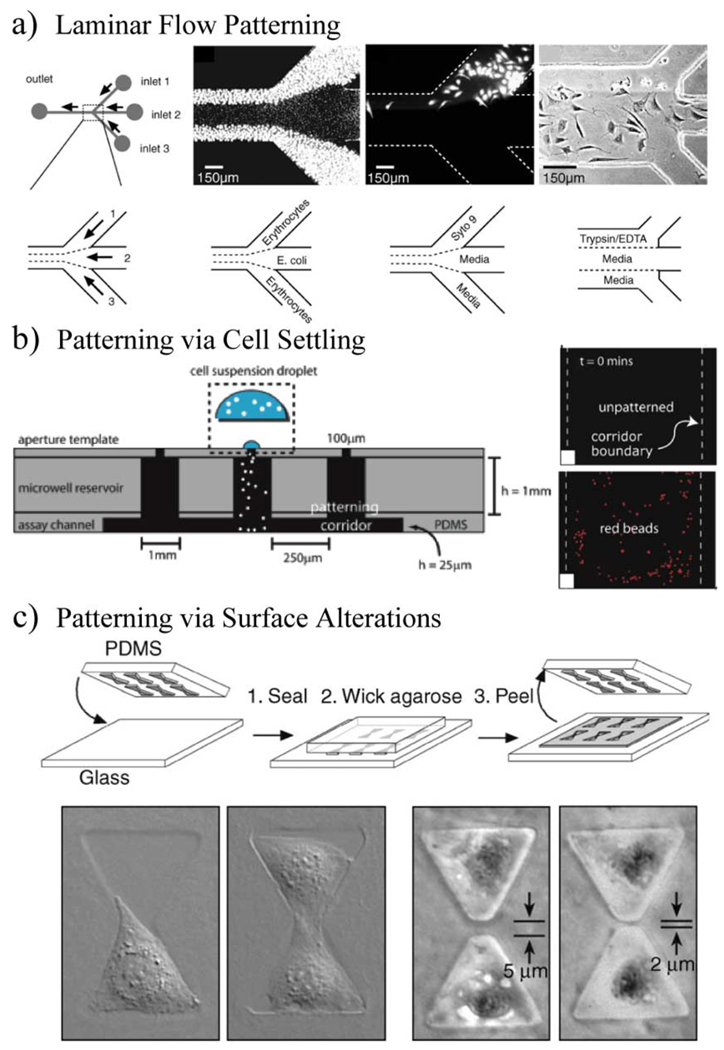
The devices of Fig. 13 are also intended for culturing more than one cell type in close proximity, which is also called co-culture. Co-culture is used to as away to study soluble factor effects resulting from the interaction of multiple cell types. One way to modulate the co-culture interaction is by varying the spacing between the cell types through cell patterning. Micro-scale patterning of cells can be accomplished via surface alterations, laminar flow, cell settling, or even via mechanical means, as shown in Fig. 14. Different ways to micro-pattern cells were recently reviewed by Nakanishi et al. [88] and also discussed in [69], [77] and [89]–[94].
Fig. 14.
Examples of cell patterning in microfluidics. (a) Patterning of cells using laminar flow. (Reprinted from [92] with permission from Elsevier, 1999.) (b) Patterning of cells via cell settling and the use of a patterning template [89]. (Figures adapted and reproduced by permission of The Royal Society of Chemistry, 2007.) (c) Patterning of cells via alteration of a substrate to define where cells adhere [85]. (Figure reproduced by permission of the MRS Bulletin, 2005, discussed in [95].)
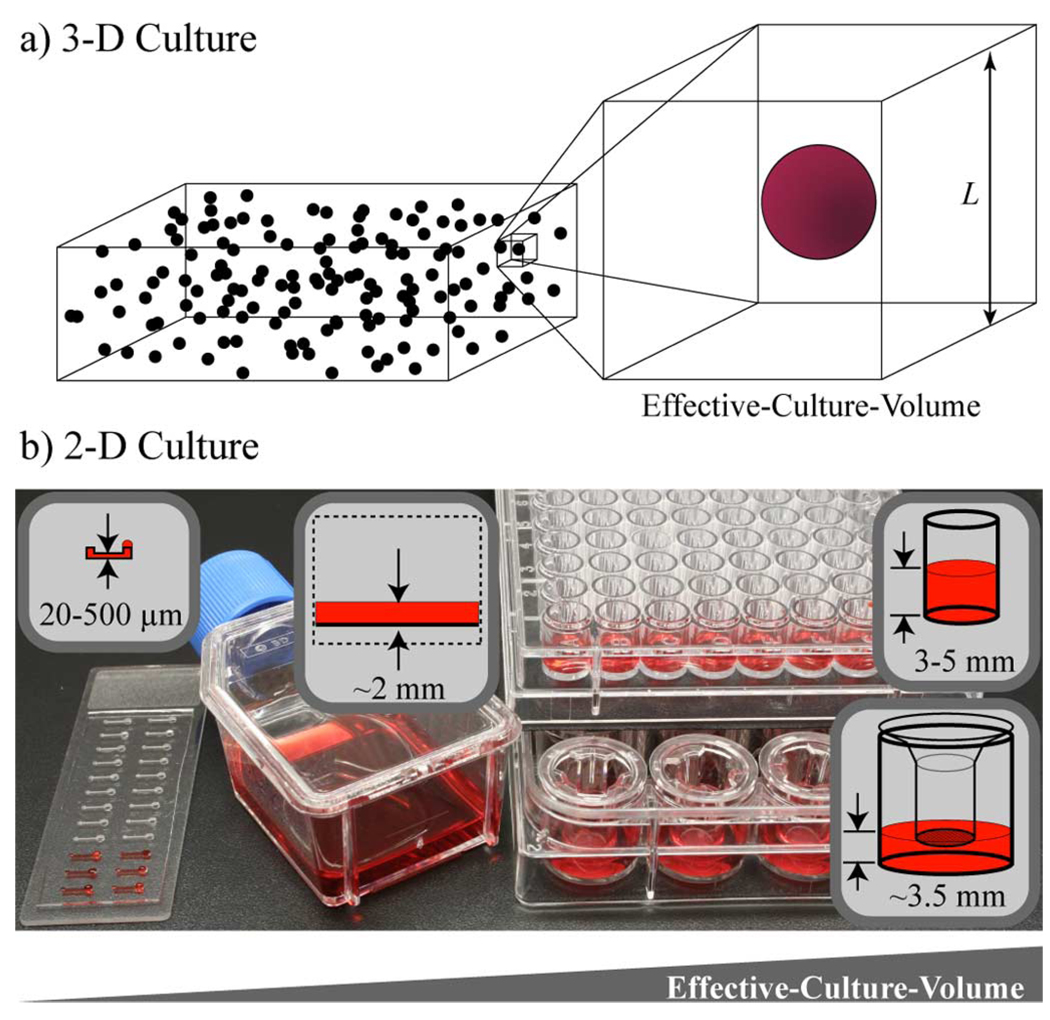
A last method of altering soluble factor signaling highlighted here is the use of different effective culture volumes (ECVs) or average culture-volume-per-cell [see (4)]. The concept of ECV has been previously discussed by Walker et al. in their review of microenvironmental design considerations for cellular-scale studies [40] and is illustrated here in Fig. 15 for 2-D and 3-D culture. The ECV of an experiment is a measure of how much influence cells can have on their soluble factor environment and is part of the feedback loop between the cell and microenvironment shown in Fig. 1. The smaller the ECV, the more effect cells can have on the accumulation and depletion of concentrations.
Fig. 15.
Effective culture volume (ECV) in 2-D and 3-D culture. (a) Schematic representation of cells uniformly seeded in 3-D culture and the associated ECV. L is roughly the average spacing between cells. (b) Example of different 2-D culture devices and their associate ECVs. The microchannel, tissue-culture flask, co-culture transwell, and 96-well plate in the photo are put in order of increasing ECV. If, in each case, the cells are plated at the same surface density upon the culture substrate (i.e., cells/mm2), then ECV is proportional to the fluid height over the cells.
ECV is mentioned here because it is a parameter of culture that is easily controlled and can provide another way to screen the soluble factor component of the microenvironment. The concept of ECV can also be abstracted to flow experiments. If nonrecirculating flow is used to constantly replace the culture media, the ECV can become very large, reducing the overall effect the cells have on soluble factor concentrations. Considerations of flow and soluble factor concentrations have been treated extensively in the area of bioreactors and are discussed in a modeling review by Mehta and Linderman [96]. The use of ECV as a screening variable in static culture is supported by previous experiments by Knauer et al. [38] (EGF depletion in macro-scale culture) and by Yu et al. [39] (effects on proliferation in micro-scale culture)
| (4) |
VIII. SCREENING FOR EFFECTS OF CELL–CELL CONTACT
Effects of cell–cell contact are often hard to distinguish from those of soluble factors as it requires decoupling the two modes of communication. Difficulty increases when cell–cell contact is involved in a cascade of events that influences soluble factor signaling.
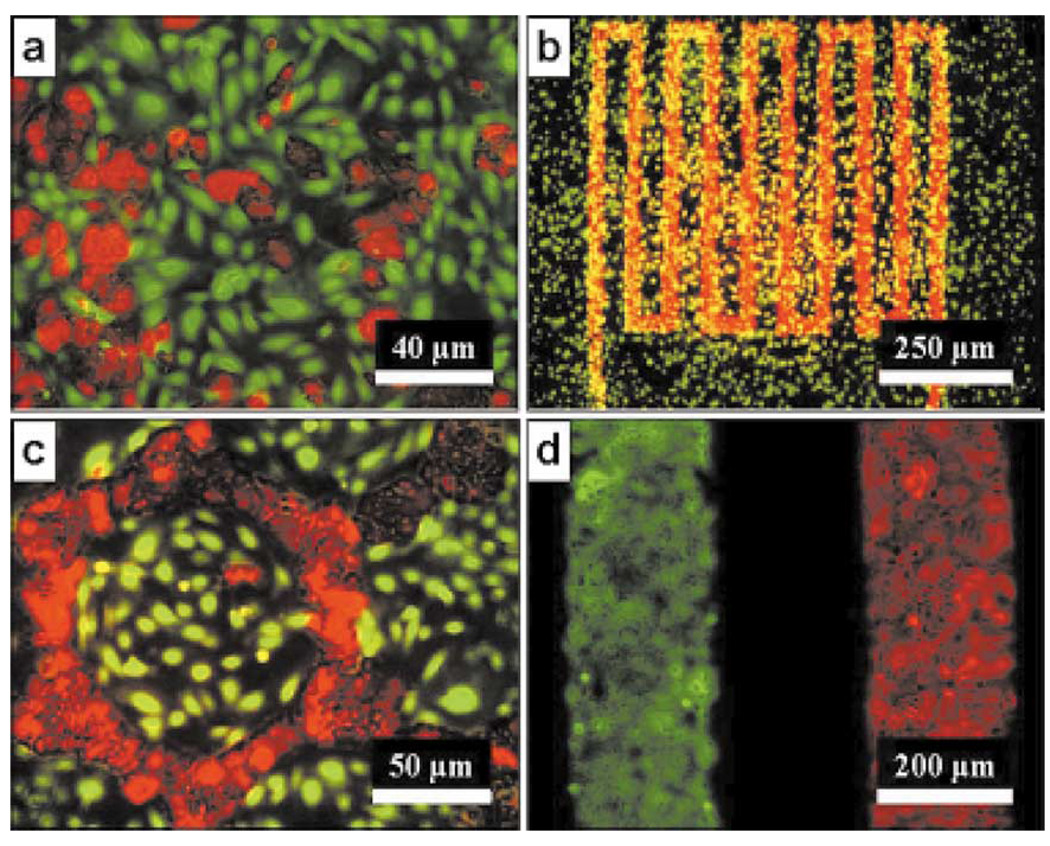
One way to investigate the role of cell–cell contact is to randomly seed cells at different ratios. However, other, more refined, methods have been developed such as the patterning of cell types in different configurations at the same ratio to more predictably alter soluble factor signaling relative to signaling via cell–cell contact as shown in Fig. 16 [97]. The different configurations allow for different lengths of contact between the cell types and different diffusion lengths for soluble factors. The same idea was used by Nelson et al. but on the scale of single cells, as shown in Fig. 14(c). In this example, the authors also included a protocol to chemically inhibit soluble factor signaling as an additional test of the proposed hypothesis. It would be realistic to perform a similar experiment where microchannel flow is used to modify soluble factor signaling instead of a chemical.
Fig. 16.
Examples of cell patterning via preferential adhesion to study homo and heterotypic cell interactions. Hepatocytes are dyed red while fibroblasts are dyed green for visualizing the cell patterns [69]. (Figure reprinted, with permission, from the Annual Review of Biomedical Engineering, vol. 2, 2002.)
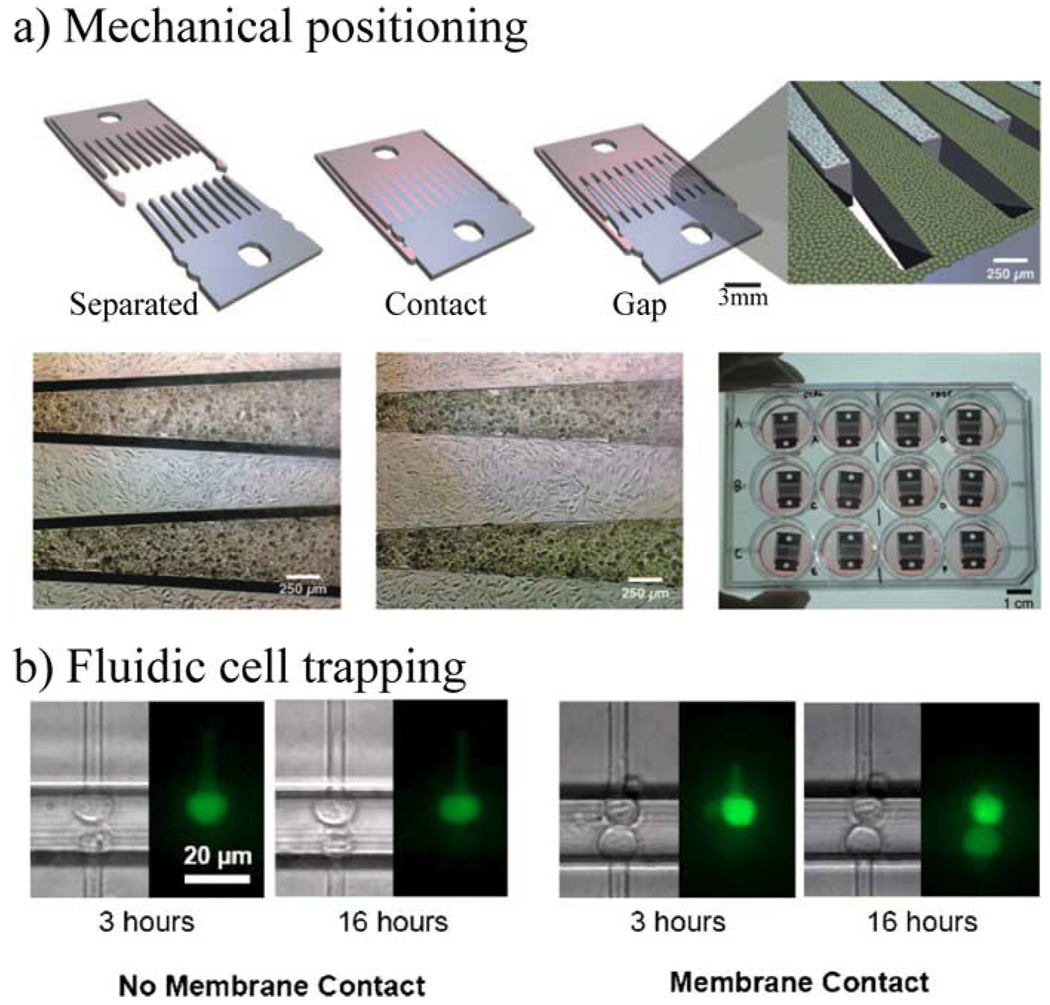
Other examples of controlling cell–cell contact involved micromechanical techniques or microchannels, as shown in Fig. 17 [91], [98]. In the first example, cells are seeded on separate surfaces such that they can be cultured: 1) separately; 2) in close proximity; or 3) in contact along a predefined border between cell types. The authors were able to suggest a distance at which soluble factor signaling is not sufficient for the provided cellular interaction; furthermore, they propose that a period of cell–cell contact followed by culture in close proximity give additional benefits. The second example, Fig. 17(b), uses flow to trap cells in proximity to one another. The traps are located such that the membranes of cells across from each other in the channel touch to allow the transfer of dye.
Fig. 17.
Examples of micro-scale control of cell–cell contact. (a) Micro-mechanical positioning is used to interleave cells and control cell separations with micrometer accuracy. The depicted device has three positions: fully separated, in contact, and with a small gap [91] (copyright 2007 National Academy of Sciences, USA). (b) Microchannels and fluid flow are used here to trap cells at docking sites. The docking sites can be positioned to allow cells across from one another to be in contact. The fluorescence image shows diffusion-based transfer of dye between cells only if there is membrane contact. (Reprinted with permission from [98], American Institute of Physics, 2005.)
IX. SCREENING PARAMETER OF ECM COMPOSITION
Controlling the mechanical and chemical composition of ECM for screening is generally a consideration for the area of biochemistry; however, in order to screen the effects of ECM using microfluidics, ways to integrate both 2-D and 3-D artificial ECMs into microfluidic devices will be needed. The 2-D ECMs are considered here to be ECM components that are adsorbed or chemically linked to a surface or substrate that cannot be significantly penetrated by cells. The 3-D ECMs would be layers or bulk distributions of ECM components that completely encapsulate cells or allow significant cell penetration.
One technology that could be integrated into screening ECM composition is the ability to create surface density gradients of 2-D ECMs [99]–[105]. There are also methods for temporarily or permanently immobilizing soluble factors on surfaces or within ECMS to create “hybrid” environments of soluble and insoluble factors [106]–[110]. The immobilization of “soluble” factors may mimic in some ways the in vivo sequestration and release of soluble factors by the ECM and could be an interesting way to simultaneously modulate soluble factor signaling and ECM composition for screening.
The first steps in screening the effects of ECM have been taken using micro-arrays, which were discussed at the beginning of Section VI[60]–[67]. Some of the referenced micro-array examples have already begun to incorporate the added dimension of soluble factors into ECM screening while others focus on the presentation of factors on “inert” backgrounds [111]–[113].
One way ECM can be integrated into microfluidic devices is through the use of laminar flow as shown in Fig. 13. In the depicted examples, it was important to roughly match the viscosities of the different fluids to facilitate even patterning. It was also important to have a way to polymerize the gels after flow. If cells are to be suspended in the gels prior to flow, the gelation or cross-linking method and precursor materials must be amenable to cells for at least a short period of time for introduction into the device. Laminar flow can also be utilized to adsorb gradients of ECM to the surfaces of channels [101].
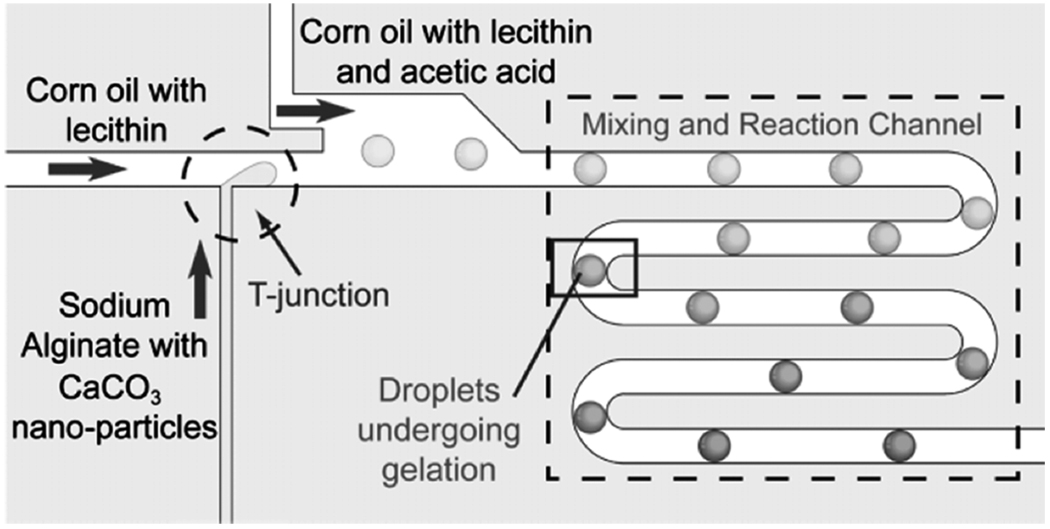
Another way to incorporate cells and ECM into microfluidic devices is to have the cells encapsulated in micro-hydrogel “beads” or spots [114]–[116] (see Fig. 18). Micro-hydrogels containing cells could be cultured using microfluidics to control nutrient supply, treatments, and even analysis. The previously discussed methods of cell settling and laminar flow could be used with hydrogel beads to pattern their location. Further, basic channel design (e.g., the use of filters and gratings) could keep compartments of micro-hydrogels separated but in fluidic contact for co-culture.
Fig. 18.
Schematic view of micro device for production of alginate hydrogel microbeads. Droplets of Na-alginate containing CaCO3 nanoparticles are formed at the T-junction. For cell encapsulation, cells are added to the Na-alginate solution before introducing it into the device. Downstream of the T-junction, a stream of “acidic oil” merges with the main stream. This pH reduction releases Ca 2+, which reacts with Na-alginate to form Ca-alginate gel downstream [114]. (Figure and caption reproduced with permission. Copyright Wiley-VCH Verlag GmbH and Company, KGaA, 2007.)
Instead of integrating artificial ECMs within microfluidics, another option is to apply microfluidics upon ECMs, as performed by Wu et al. [117], or to build microfluidic devices from ECM materials, such as done by Paguirigan et al. [73] (see Fig. 8). In the latter case, channels were formed in gelatin using PDMS molds and used for micro-scale culture.
X. MICROFLUIDICS AND HIGH-THROUGHPUT CULTURE
Having discussed micro-scale and microfluidic capabilities with respect to parameters of the cellular microenvironment, we now examine the integration of those functionalities and their translation into a high-throughput format for the purpose of screening. Instead of looking at particular examples of integrating functionalities, we will look at existing “platforms” for microfluidics. The term platform is meant here to refer to “ways” of doing microfluidics. Platforms tend to centralize efforts in the field, bringing together developments from multiple researchers towards the goal of simultaneously integrating multiple functionalities and will likely be important in realizing the goal of screening the microenvironment. Microfluidic platforms mentioned here include: micro-arrays, droplet-fluidics, valve-based fluidics, electrowetting on dielectric (EWOD), and passive-pumping-based fluidics (sometimes called tubeless fluidics).
A. Micro-Arrays
Micro-arrays refer to the use of dispensing/patterning methods (e.g., dip-pen, piezo, pipette, stamp, and lithography) to create individualized regions of chemicals, proteins, and/or cells on a surface. Experiments based on these technologies facilitate combinatorial experiments in a small footprint with examples described in the previously mentioned figures and references (Fig. 7 and Fig. 16) [60]–[67], [69], [88], [92], [94], [97].
B. Droplet Fluidics
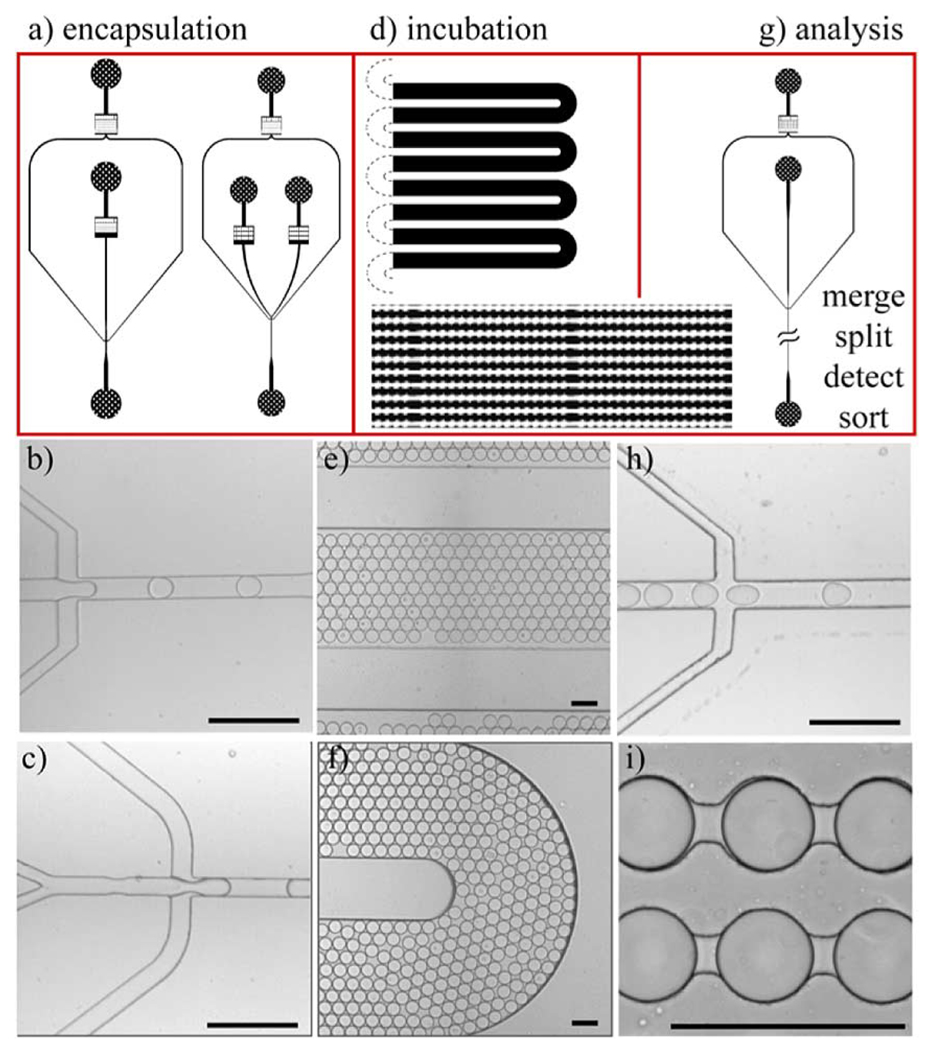
Droplet fluidics is meant here as the use of multiple fluid phases to isolate and partition droplets; the individual droplets then become the focus of experimentation. Droplet fluidic systems are now being developed with functionalities separated into modules or stages that can be assembled into different configurations. Fig. 19 shows droplet fluidic modules for encapsulation, incubation, and analysis [34]. The technology is examined further in [58], [118].
Fig. 19.
Modular design of the microfluidic components. The individual components can be flexibly combined to meet specific experimental requirements and are connected by means of external tubing. Schematics and micrographs showing design of (a)–(c) encapsulation chips with single or double aqueous inlet, (d)–(f) incubation chips, and (g–h) interface to analysis (merging, splitting, detection, sorting) chips. Schematics: (a) single-inlet (left) and double-inlet (right) encapsulation, (d) top: serpentine incubation channel, bottom left: close-up of the serpentine incubation channel, bottom right: incubation channel for time-resolved studies, (g) reinjection for further drop handling. Micrographs: (b) single-inlet encapsulation, (c) double-inlet encapsulation, (e), (f) serpentine incubation channel, (h) reinjection for further drop handling, and (i) incubation channel for time-resolved studies from schematic shown in lower right part of (d). All scale bars are 100 µm. [34]. (Figure and caption reproduced by permission of The Royal Society of Chemistry, 2008.)
C. Valve-Based Fluidics
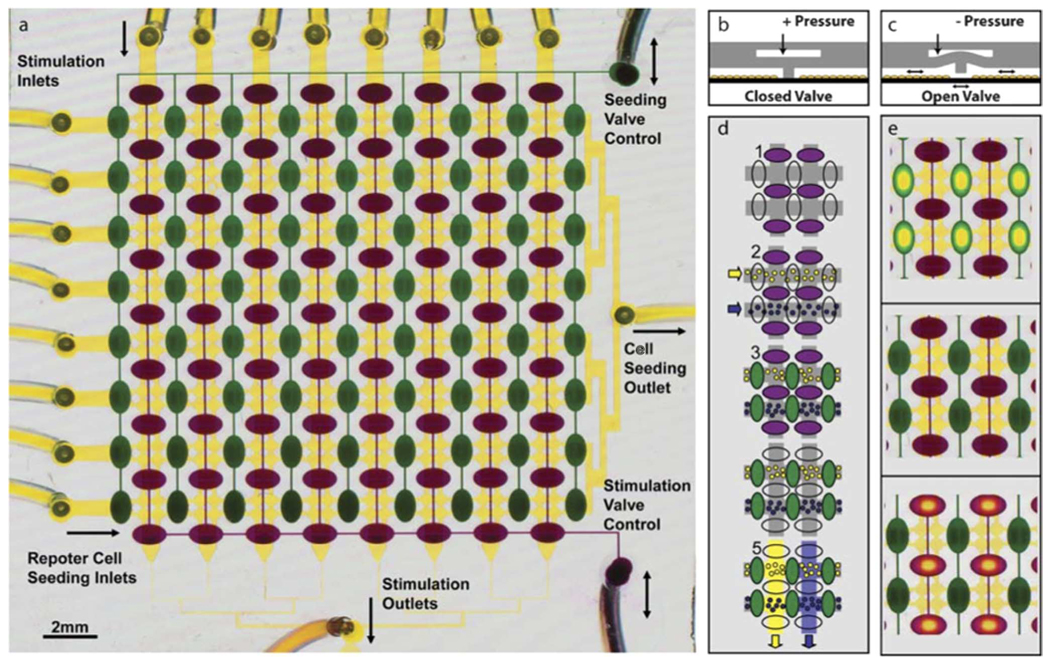
A prominent example of valve-based fluidics is this example from King et al., shown in Fig. 20. Coordinated pneumatic actuation of elastomeric valves within devices such as this are used to route reagents and cells to perform parallel culture experiments. Other examples are discussed in [119]–[121].
Fig. 20.
Example of a valved microfluidic device for cell culture and treatment. (a) Layer 1 (yellow) consists of a 16 × 16 array of circular “cell visualization chambers” (50-mm height and 420-mm diameter). Each 2 × 2 subarray in layer 1 is isolated from the others by two sets of reversible PDMS barriers. These barriers are controlled by two valve control manifolds (green and purple) in layer 2. Cell lines are drawn from separate inlets (left) through a common outlet (right) to seed the device with rows of different reporters. Similarly, each stimulus is drawn from separate inlets (top) through a common stimulation outlet (bottom). Layer 2 seeding valves (green) are dead-end channels controlled by the pressure in a single inlet (top right) and stimulation valves (purple) are controlled by a single control line (bottom right). (b) Cross-sectional schematic of the reversible barriers. At rest or when positive pressure is applied to the control line, valves are closed. (c) When negative pressure is applied to the control line, the reversible barrier is elevated allowing fluidic communication. (d) Schematic of a typical experiment. 1) Devices are placed in “seeding configuration” with seeding valves open and stimulation valves closed. 2) Reporter cell lines are introduced from the left. 3) The array is placed in neutral configuration by closing seeding valves, and cells are allowed to attach. 4) Devices are then placed in “stimulation configuration” by opening stimulation valves and closing seeding valves. 5) Stimuli are drawn through each column of the array to stimulate each cell line with each stimulus and create a matrix of 64 stimulus response experiments, each with four cell chambers or “replicates”. (e) Images of the dye-filled device in each of the three configurations seeding (top), neutral (middle), stimulation (bottom). Open valves appear to have yellow centers when the floor and ceiling of the layer 2 control channel meet. Since the dye is squeezed away from that area, the color is dominated by the yellow dye in the underlying layer 1. [16]. (Figure and caption reproduced by permission of The Royal Society of Chemistry, 2007.)
D. EWOD
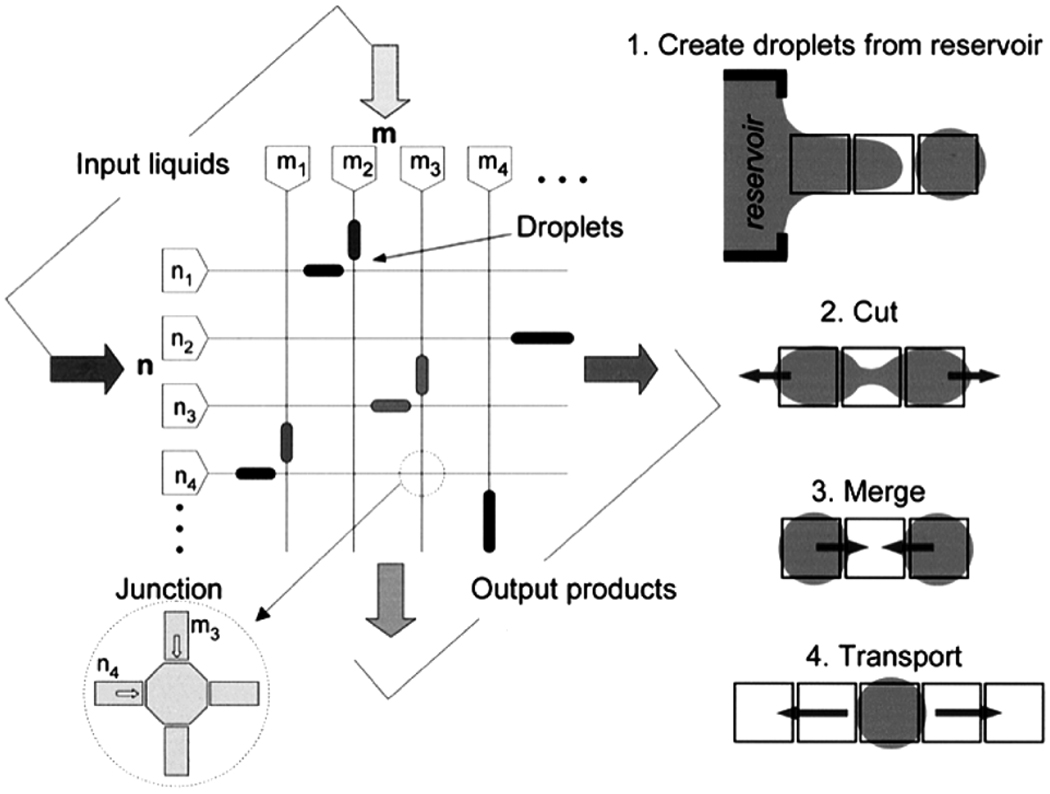
EWOD uses the change in wettability of a dielectric surface under the action of a potential to drive the motion of drops. The motion of the drops can be used to perform the basic functions of sampling from a reservoir, cutting/splitting droplets, merging droplets, and droplet transport (Fig. 21). These functions can be used together to perform operations such as such as mixing and dilution [122]. The layout of the device in the figure is used to suggest the combinatorial potential of the platform. Another resource for details on EWOD devices is [123].
Fig. 21.
Schematic representation of an EWOD device and schematics of what are considered to be the four basic types of operations of the platform [122]. (Figure reproduced by permission of IEEE, 2003.)
E. Passive-Pumping-Based Fluidics
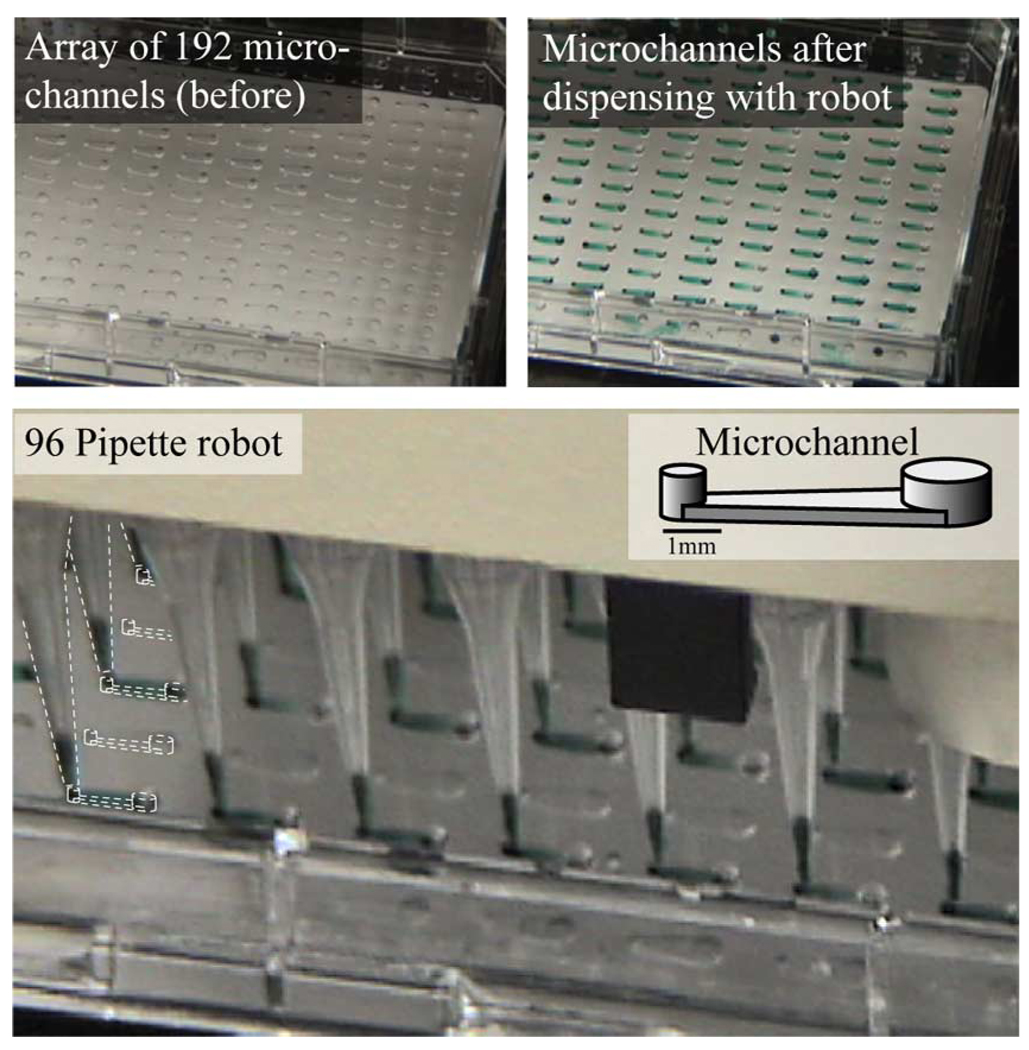
Passive-pumping has been discussed earlier as an example of how surface tension can play an important role in microscale devices. The platform is typically without external tubes (i.e., tubeless), consisting of microchannels with ports to interface with various dispensing technologies, including a manual pipette. Various combinations of dispensing and aspirating can be used to treat, wash, mix, and route samples for cell culture assays [77]. The platform can be used for low-throughput manual studies but can also be scaled up to integrate with existing dispensing technology such as multi-pipette robots for automating high-throughput experiments (see Fig. 22).
Fig. 22.
Tubeless microchannel arrays interfaced with standard screening automation via passive-pumping. The microchannel array ports are arranged to interface with standard pipetting automation. A 96 pipette robot is used here to flow green dye into an array of channels filled with water. The 192 channels in the array are treated in two separate passes by the robot in a total of about 10–15 s. Aspirations can also be performed at microchannel ports. Background images courtesy of I. Meyvantsson.
XI. CONCLUSION AND FUTURE CHALLENGES FOR MICROFLUIDICS
Functionalities important for screening the microenvironment include: 1) the control of soluble factor signaling; 2) the integration of chemically and mechanically modified ECMs; and 3) the modulation of cell–cell contact, as these basic functionalities form the core of modulating the cellular microenvironment. By incorporating these abilities into the platforms such as micro-arrays, droplet fluidics, valve-based fluidics, EWOD, and passive-pumping-based fluidics the existing capabilities of the platforms can be leveraged to bring together microenvironmental control with automated and high-throughput techniques to perform multidimensional studies of cell biology. The development of these platforms for microenvironmental screening will require overcoming some existing challenges in microfluidics.
Cell biology in microfluidics is primarily accomplished using devices made from polydimethylsiloxane (PDMS). The material is unique in that it is easy to work with and has characteristics beneficial to cell culture assays such as high optical quality and gas permeability. However, PDMS is also known to absorb small lipophilic molecules. Absorption can be fast and significant [70]. Methods to address this would aid understanding of its relevance to cell biology and could dramatically affect the use of microfluidics in all of biology.
Micro-scale culture is also fundamentally different than macro-scale culture. The ECV of micro culture is significantly reduced compared to typical macro culture and has already been discussed. The increased surface-to-volume ratios of micro-scale assays also make them more susceptible to adsorptive depletion of soluble factors and can affect the use of macro-scale protocols in micro-scale assays [124], [125]. Fundamental differences such as these make it important to validate micro-scale biological assays and is treated more thoroughly in recent works [126]–[128].
Microfluidics is also in need of more simple and modular device designs, such as the droplet fluidic modules of Fig. 19. A greater variety of simple and modular designs will help microfluidics make the difficult transition into biology labs through increased accessibility and robustness and can facilitate integration into high-throughput screening applications.
Finally, this review has focused somewhat on modulation of soluble factors and, in particular, the concept of ECV. The parameter of ECV is well suited for inclusion in microenvironmental screening because it is easy to control and plays an important role in affecting cell behavior.
ACKNOWLEDGMENT
This work was supported in part by the Army Breast Cancer Research Program under Grant W81XWH-04-1-0572 and in part by the National Institutes of Health under Grant K25 CA104162. The work of J. W. Warrick was supported by the National Library of Medicine under Grant 5T15LM007359. The work of W. L. Murphy was supported by a National Science Foundation CAREER Award and by the National Institutes of Health under Grant R03AR052893.
The authors would like to thank E. Berthier for helpful discussions.
Biographies
Jay W. Warrick received the B.A. degree in physics and the B.S. degree in mechanical engineering from Lawrence University, Appleton, WI, and Washington University, St. Louis, MO, respectively, in 2002. He is currently a graduate student in the laboratory of Professor David Beebe in the Department of Biomedical Engineering at the University of Wisconsin, Madison, WI.
He is currently supported by a traineeship in the Computation and Informatics in Medicine and Biology training program sponsored by the National Library of Medicine, which he was awarded in 2006. His research interests center on the development of tools for cell biologists to interrogate the role of the cellular microenvironment on cellular phenotype. Specifically, Jay is currently focused on designing and implementing microfluidic devices to advance the study of autocrine and paracrine soluble factor signaling. Other areas of interest include the development of software and algorithms for databasing and analyzing images and other data collected from arrays of microdevices.

William L. Murphy received the B.S. degree in physics from Illinois Wesleyan University, Bloomington, IL, in 1998, and the Ph.D. degree in biomedical engineering from the University of Michigan, Ann Arbor, in 2002.
From 2002 to 2004, he was a NIH National Research Service Award Postdoctoral Fellow in the Department of Chemistry at the University of Chicago, Chicago, IL. In August 2004, he joined the faculty of the University of Wisconsin in the Departments of Biomedical Engineering and Pharmacology as a member of the Stem Cell and Regenerative Medicine Center. His research interests focus on using natural mechanisms to build biomaterials with unique properties, including cell-instructive materials and bio-responsive materials. A particular focus of his research is on synthesizing smart materials using bioinspired, noncovalent interactions, including protein–mineral, protein–peptide, and protein–protein interactions. His group is exploring several applications of these materials, including stem cell culture, tissue engineering, protein/gene delivery, and intelligent biosensing.

David J. Beebe (S’89–M’90) is a Professor in the Department of Biomedical Engineering at the University of Wisconsin-Madison. He is also a member of the UW Comprehensive Cancer Center, Stem Cell Program, Materials Science Program, Biotechnology Training Program, Genomic Sciences Training Program and serves on the steering committee of the Stem Cell Training Program.
Dr. Beebe is the recipient of the IEEE EMBS Early Career Achievement Award, the Lab on a Chip, Royal Society of Chemistry/Corning, Pioneers of Miniaturization Prize, the Romnes Award at UW-Madison and is a Fellow of the American Institute for Medical and Biological Engineering. He has also served as an Associate Editor for IEEE/ASME JOURNAL OF MICROELECTROMECHANICAL SYSTEMS, the Journal of Biomechanical Engineering, Lab on a Chip, and is currently Scientific Editor of Integrative Biology. Past research topics have included development of nontraditional autonomous micro fluidic devices and systems, and the study of cell and embryo development in microenvironments.

REFERENCES
- 1.Scadden D. The stem-cell niche as an entity of action. Nature. 2006;vol. 441:1075–1079. doi: 10.1038/nature04957. [DOI] [PubMed] [Google Scholar]
- 2.Fuchs E, Tumbar T, Guasch G. Socializing with the neighbors: Stem cells and their niche. Cell. 2004;vol. 116:769–778. doi: 10.1016/s0092-8674(04)00255-7. [DOI] [PubMed] [Google Scholar]
- 3.Li ZX, Li LH. Understanding hematopoietic stem-cell microenvironments. Trends in Biochem. Sci. 2006 Oct;vol. 31(no 10):589–595. doi: 10.1016/j.tibs.2006.08.001. [DOI] [PubMed] [Google Scholar]
- 4.Moore KA, Lemischka IR. Stem-cells and their niches. Science. 2006 Mar;vol. 311(no 5769):1880–1885. doi: 10.1126/science.1110542. [DOI] [PubMed] [Google Scholar]
- 5.Harrison SMW, Harrison DA. Contrasting mechanisms of stem cell maintenance in drosophila. Seminars in Cell Devel. Biol. 2006 Aug;vol. 17(no 4):518–533. doi: 10.1016/j.semcdb.2006.07.004. [DOI] [PubMed] [Google Scholar]
- 6.Hay ED. An overview of epithelio-mesenchymal transformation. Acta Anatomica. 1995;vol. 154(no 1):8–20. doi: 10.1159/000147748. [DOI] [PubMed] [Google Scholar]
- 7.Chung LWK, Baseman A, Assikis V, Zhau HE. Molecular insights into prostate cancer progression: The missing link of tumor microenvironment. J. Urology. 2005;vol. 173(no 1):10–20. doi: 10.1097/01.ju.0000141582.15218.10. [DOI] [PubMed] [Google Scholar]
- 8.Liao YP, Schaue D, McBride WH. Modification of the tumor microenvironment to enhance immunity. Frontiers Biosci. 2007;vol. 12:3576–3600. doi: 10.2741/2336. [DOI] [PubMed] [Google Scholar]
- 9.Mueller MM, Fusenig NE. Tumor-stroma interactions directing phenotype and progression of epithelial skin tumor cells. Differentiation. 2002;vol. 70(no 9–10):486–497. doi: 10.1046/j.1432-0436.2002.700903.x. [DOI] [PubMed] [Google Scholar]
- 10.Prudhomme W, Daley GQ, Zandstra P, Lauffenburger DA. Multivariate proteomic analysis of murine embryonic stem cell self-renewal versus differentiation signaling. Proc. Nat. Acad. Sci. USA. 2004;vol. 101(no 9):2900–2905. doi: 10.1073/pnas.0308768101. [DOI] [PMC free article] [PubMed] [Google Scholar]
- 11.Guidance for Industry s7b Nonclinical Evaluation of the Potential for Delayed Ventricular Repolarization (qt Interval Prolongation) by Human Pharmaceuticals FDA and the Expert Working Group (Safety) of the International Conference on Harmonisation of Technical Requirements for Registration of Pharmaceuticals for Human Use (ICH) [Online]. Available: http://www.fda.gov/cder/Guidance/6885fnl.htm.
- 12.Griffith LG, Swartz MA. Capturing complex 3D tissue physiology in vitro. Nature Rev. Molecular Cell Biol. 2006;vol. 7(no 3):211–224. doi: 10.1038/nrm1858. [DOI] [PubMed] [Google Scholar]
- 13.Lazebnik Y. Can a biologist fix a radio?-or, What I learned while studying apoptosis. Cancer Cell. 2002;vol. 2(no 3):179–182. doi: 10.1016/s1535-6108(02)00133-2. [DOI] [PubMed] [Google Scholar]
- 14.Folkman J. Is angiogenesis an organizing principle in biology and medicine? J. Pediatric Surgery. 2007;vol. 42(no 1):1–11. doi: 10.1016/j.jpedsurg.2006.09.048. [DOI] [PubMed] [Google Scholar]
- 15.Nyberg P, Salo T, Kalluri R. Tumor microenvironment and angiogenesis. Front Biosci. 2008;vol. 13:6537–6553. doi: 10.2741/3173. [DOI] [PubMed] [Google Scholar]
- 16.King KR, Wang S, Irimia D, Jayaraman A, Toner M, Yarmush ML. A high-throughput microfluidic real-time gene expression living cell array. Lab on a Chip. 2007;vol. 7:77–85. doi: 10.1039/b612516f. [DOI] [PMC free article] [PubMed] [Google Scholar]
- 17.Breslauer DN, Lee PJ, Lee LP. Microfluidics-based systems biology. Molecular Biosyst. 2006;vol. 2(no 2):97–112. doi: 10.1039/b515632g. [DOI] [PubMed] [Google Scholar]
- 18.Eckstein J. Isoa/Arf Drug Development Tutorial. [Online]. Available: http://www.alzforum.org/drg/tut/ISOATutorial.pdf.
- 19.Bleicher K, Bohm H, Muller K, Alanine A. Hit and lead generation: Beyond high-throughput screening. Nature Rev. Drug Discovery. 2003;vol. 2:369–378. doi: 10.1038/nrd1086. [DOI] [PubMed] [Google Scholar]
- 20.Sams-Dodd F. Target-based drug discovery: Is something wrong? Drug Discovery Today. 2005;vol. 10:139–147. doi: 10.1016/S1359-6446(04)03316-1. [DOI] [PubMed] [Google Scholar]
- 21.Houston JG, Banks MN, Binnie A, Brenner S, O’Connell J, Petrillo EW. Case study: Impact of technology investment on lead discovery at Bristol-Myers Squibb, 1998–2006. Drug Discovery Today. 2008;vol. 13(no 1–2):44–51. doi: 10.1016/j.drudis.2007.11.004. [DOI] [PubMed] [Google Scholar]
- 22.Xie X-Q, Chen J-Z. Data mining a small molecule drug screening representative subset from nih pubchem. J. Chemical Info. Modeling. 2008;vol. 48:465–475. doi: 10.1021/ci700193u. [DOI] [PubMed] [Google Scholar]
- 23.Cukierman E, Pankov R, Stevens DR, Yamada KM. Taking cell-matrix adhesions to the third dimension. Science. 2001;vol. 294(no 5547):1708–1712. doi: 10.1126/science.1064829. [DOI] [PubMed] [Google Scholar]
- 24.Cukierman E, Pankov R, Yamada KM. Cell interactions with three-dimensional matrices. Current Opinion Cell Biol. 2002;vol. 14(no 5):633–639. doi: 10.1016/s0955-0674(02)00364-2. [DOI] [PubMed] [Google Scholar]
- 25.Larsen M, Artym VV, Green JA, Yamada KM. The matrix reorganized: Extracellular matrix remodeling and integrin signaling. Current Opinion Cell Biol. 2006;vol. 18(no 5):463–471. doi: 10.1016/j.ceb.2006.08.009. [DOI] [PubMed] [Google Scholar]
- 26.Friis T, Hansen AB, Houen G, Engel AM. Influence of angiogenesis inhibitors on endothelial cell morphology in vitro. APMIS. 2006 Mar;vol. 114(no 3):211–224. doi: 10.1111/j.1600-0463.2006.apm_189.x. [DOI] [PubMed] [Google Scholar]
- 27.Larson B, Worzella T. Perform multiplexed cell-based assays on automated platforms. Cell Notes. 2008;vol. 12:13–16. [Google Scholar]
- 28.Kornienko O, Lacson R, Kunapuli P, Schneeweis J, Hoffman I, Smith T, Alberts M, Inglese J, Strulovici B. Miniaturization of whole live cell-based GPCR assays using microdispensing and detection systems. J. Biomolelcular Screening. 2004;vol. 9(no 3):186–195. doi: 10.1177/1087057103260070. [DOI] [PubMed] [Google Scholar]
- 29.Hines M, Nielsen L, Cooper-White J. The hematopoietic stem cell niche: What are we trying to replicate? J. Chemical Technol. Biotechnol. 2008;vol. 83:421–443. [Google Scholar]
- 30.Thomson JA, Itskovitz-Eldor J, Shapiro SS, Waknitz MA, Swiergiel JJ, Marshall VS, Jones JM. Embryonic stem cell lines derived from human blastocysts. Science. 1998 Nov;vol. 282(no 5391):1145–1147. doi: 10.1126/science.282.5391.1145. [DOI] [PubMed] [Google Scholar]
- 31.Shackleton M, Vaillant F, Simpson KJ, Stingl J, Smyth GK, Asselin-Labat ML, Wu L, Lindeman GJ, Visvader JE. Generation of a functional mammary gland from a single stem cell. Nature. 2006;vol. 439(no 7072):84–88. doi: 10.1038/nature04372. [DOI] [PubMed] [Google Scholar]
- 32.Stingl J, Eirew P, Ricketson I, Shackleton M, Vaillant F, Choi D, Li HYI, Eaves CJ. Purification and unique properties of mammary epithelial stem cells. Nature. 2006;vol. 439(no 7079):993–997. doi: 10.1038/nature04496. [DOI] [PubMed] [Google Scholar]
- 33.Ludwig TE, Levenstein ME, Jones JM, Berggren WT, Mitchen ER, Frane JL, Crandall LJ, Daigh CA, Conard KR, Piekarczyk MS, Llanas RA, Thomson JA. Derivation of human embryonic stem cells in defined conditions. Nature Biotechnol. 2006;vol. 24(no 2):185–187. doi: 10.1038/nbt1177. [DOI] [PubMed] [Google Scholar]
- 34.Köster S, Angile FE, Duan H, Agresti JJ, Wintner A, Schmitz C, Rowat AC, Merten CA, Pisignano D, Griffiths AD, Weitz DA. Drop-based microfluidic devices for encapsulation of single cells. Lab on a Chip. 2008;vol. 8(no 7):1110–1115. doi: 10.1039/b802941e. [DOI] [PubMed] [Google Scholar]
- 35.Ochsner M, Dusseiller MR, Grandin HM, Luna-Morris S, Textor M, Vogel V, Smith ML. Micro-well arrays for 3D shape control and high resolution analysis of single cells. Lab on a Chip. 2007;vol. 7:1074–1077. doi: 10.1039/b704449f. [DOI] [PubMed] [Google Scholar]
- 36.Berthier E, Warrick JW, Yu H, Beebe DJ. Managing evaporation for more robust microscale assays Part 1. Volume loss in high throughput assays. Lab on a Chip. 2008 Jun;vol. 8:852–859. doi: 10.1039/b717422e. [DOI] [PMC free article] [PubMed] [Google Scholar]
- 37.Berthier E, Warrick JW, Yu H, Beebe DJ. Managing evaporation for more robust microscale assays Part 2. Characterization of convection and diffusion for cell biology. Lab on a Chip. 2008 Jun;vol. 8:860–864. doi: 10.1039/b717423c. [DOI] [PMC free article] [PubMed] [Google Scholar]
- 38.Knauer DJ, Wiley HS, Cunningham DD. Relationship between epidermal growth-factor receptor occupancy and mitogenic response – quantitative-analysis using a steady-state model system. J. Biological Chemistry. 1984;vol. 259:5623–5631. [PubMed] [Google Scholar]
- 39.Yu H, Meyvantsson I, Shkel IA, Beebe DJ. Diffusion dependent cell behavior in microenvironments. Lab on a Chip. 2005;vol. 5(no 10):1089–1095. doi: 10.1039/b504403k. [DOI] [PubMed] [Google Scholar]
- 40.Walker GM, Zeringue HC, Beebe DJ. Microenvironment design considerations for cellular scale studies. Lab on a Chip. 2004;vol. 4(no 2):91–97. doi: 10.1039/b311214d. [DOI] [PubMed] [Google Scholar]
- 41.Gajkowska A, Oldak T, Jastrzewska M, Machaj E, Walewski J, Kraszewska E, Pojda Z. Flow cytometric enumeration of cd34(+) hematopoietic stem and progenitor cells in leukapheresis product and bone marrow for clinical transplantation: A comparison of three methods. Folia Histochemica Et Cytobiologica. 2006;vol. 44:53–60. [PubMed] [Google Scholar]
- 42.Giuliano KA, Johnston PA, Gough A, Taylor DL. Systems Cell Biology Based on High-Content Screening. vol. 414. Amsterdam, The Netherlands: Elsevier; 2006. [DOI] [PubMed] [Google Scholar]
- 43.Parvin B, Yang Q, Fontenay G, Barcellos-Hoff M. Biosig: An imaging bioinformatic system for studying phenomics. Computer. 2002;vol. 35 doi: 10.1109/TSMCB.2003.816929. 65−. [DOI] [PubMed] [Google Scholar]
- 44.Parvin B, Yang Q, Fontenay G, Barcellos-Hoff M. Biosig: An imaging bioinformatics system for phenotypic analysis. IEEE Trans. Syst., Man, Cybern. Part B-Cybern. 2003 Aug;vol. 33(no 4):814–824. doi: 10.1109/TSMCB.2003.816929. [DOI] [PubMed] [Google Scholar]
- 45.Carpenter PA, Shah P. A model of the perceptual and conceptual processes in graph comprehension. J. Experimental Psychol. —Applied. 1998 Jun;vol. 4(no 2):75–100. [Google Scholar]
- 46.Wang Y, Miller DJ, Clarke R. Approaches to working in high-dimensional data spaces: Gene expression microarrays. Brit. J. Cancer. 2008;vol. 98:1023–1028. doi: 10.1038/sj.bjc.6604207. [DOI] [PMC free article] [PubMed] [Google Scholar]
- 47.Janes K, Kelly J, Gaudet S, Albeck J, Sorger P, Lauffenburger D. Cue-signal-response analysis of tnf-induced apoptosis by partial least squares regression of dynamic multivariate data. J. Computational Biol. 2004;vol. 11:544–561. doi: 10.1089/cmb.2004.11.544. [DOI] [PubMed] [Google Scholar]
- 48.Kumar N, Wolf-Yadlin A, White FM, Lauffenburger DA. Modeling her2 effects on cell behavior from mass spectrometry phosphotyrosine data. PLoS Computational Biol. 2007;vol. 3(no 1):e4. doi: 10.1371/journal.pcbi.0030004. [DOI] [PMC free article] [PubMed] [Google Scholar]
- 49.Miller-Jensen K, Janes KA, Brugge JS, Lauffenburger DA. Common effector processing mediates cell-specific responses to stimuli. Nature. 2007;vol. 448(no 7153):604–608. doi: 10.1038/nature06001. [DOI] [PubMed] [Google Scholar]
- 50.Wolf-Yadlin A, Kumar N, Zhang Y, Hautaniemi S, Zaman M, Kim H-D, Grantcharova V, Lauffen-burger DA, White FM. Effects of her2 overexpression on cell signaling networks governing proliferation and migration. Molecular Syst. Biol. 2006;vol. 2:54. doi: 10.1038/msb4100094. [DOI] [PMC free article] [PubMed] [Google Scholar]
- 51.Beebe DJ, Mensing GA, Walker GM. Physics and applications of microfluidics in biology. Annu. Rev. Biomed. Eng. 2002;vol. 4:261–286. doi: 10.1146/annurev.bioeng.4.112601.125916. [DOI] [PubMed] [Google Scholar]
- 52.Duffy DC, McDonald JC, Schueller OJA, Whitesides GM. Rapid prototyping of microfluidic systems in poly(dimethylsiloxane) Anal. Chemistry. 1998;vol. 70(no 23):4974–4984. doi: 10.1021/ac980656z. [DOI] [PubMed] [Google Scholar]
- 53.Hu G, Quaranta V, Li D. Modeling of effects of nutrient gradients on cell proliferation in microfluidic bioreactor. Biotechnol. Progress. 2007;vol. 23:1347–1354. doi: 10.1021/bp070234n. [DOI] [PubMed] [Google Scholar]
- 54.Meyvantsson I, Beebe DJ. Cell culture models in microfluidic systems. Annu. Rev. Anal. Chemistry. 2008 Jul;vol. 1 doi: 10.1146/annurev.anchem.1.031207.113042. [DOI] [PubMed] [Google Scholar]
- 55.Ng JMK, Gitlin I, Stroock AD, Whitesides GM. Components for integrated poly(dimethylsiloxane) microfluidic systems. Electrophoresis. 2002;vol. 23(no 20):3461–3473. doi: 10.1002/1522-2683(200210)23:20<3461::AID-ELPS3461>3.0.CO;2-8. [DOI] [PubMed] [Google Scholar]
- 56.Puccinelli J, Beebe DJ. In: Microfluidics for Biological Applications. Tian WC, Finehout EJ, editors. New York: Springer; 2008. [Google Scholar]
- 57.Sia SK, Whitesides GM. Microfluidic devices fabricated in poly(dimethylsiloxane) for biological studies. Electrophoresis. 2003 Nov;vol. 24(no 21):3563–3576. doi: 10.1002/elps.200305584. [DOI] [PubMed] [Google Scholar]
- 58.Teh S-Y, Lin R, Hung L-H, Lee AP. Droplet microfluidics. Lab on a Chip. 2008;vol. 8:198–220. doi: 10.1039/b715524g. [DOI] [PubMed] [Google Scholar]
- 59.Weibel DB, Whitesides GM. Applications of microfluidics in chemical biology. Current Opinion Chem. Biol. 2006 Dec;vol. 10(no 6):584–591. doi: 10.1016/j.cbpa.2006.10.016. [DOI] [PubMed] [Google Scholar]
- 60.Anderson DG, Levenberg S, Langer R. Nanoliter-scale synthesis of arrayed biomaterials and application to human embryonic stem cells. Nature Biotechnol. 2004 Jul;vol. 22(no 7):863–866. doi: 10.1038/nbt981. [DOI] [PubMed] [Google Scholar]
- 61.Flaim CJ, Chien S, Bhatia SN. An extracellular matrix microarray for probing cellular differentiation. Nature Methods. 2005 Feb;vol. 2(no 2):119–125. doi: 10.1038/nmeth736. [DOI] [PubMed] [Google Scholar]
- 62.Jang JH, Schaffer DV. Microarraying the cellular microenvironment. Molecular Syst. Biol. 2006;vol. 2 doi: 10.1038/msb4100079. [DOI] [PMC free article] [PubMed] [Google Scholar]
- 63.Ziauddin J, Sabatini DM. Microarrays of cells expressing defined CDNAs. Nature. 2001 May;vol. 411(no 6833):107–110. doi: 10.1038/35075114. [DOI] [PubMed] [Google Scholar]
- 64.Soen Y, Mori A, Palmer TD, Brown PO. Exploring the regulation of human neural precursor cell differentiation using arrays of signaling microenvironments. Molecular Syst. Biol. 2006;vol. 2 doi: 10.1038/msb4100076. [DOI] [PMC free article] [PubMed] [Google Scholar]
- 65.Fukuda J, Khademhosseini A, Yeh J, Eng G, Cheng J, Farokhzad OC, Langer R. Micropatterned cell co-cultures using layer-by-layer deposition of extracellular matrix components. Biomaterials. 2006;vol. 27(no 8):1479–1486. doi: 10.1016/j.biomaterials.2005.09.015. [DOI] [PubMed] [Google Scholar]
- 66.Khademhosseini A, Ferreira L, Blumling Jr, Yeh J, Karp JM, Fukuda J, Langer R. Co-culture of human embryonic stem cells with murine embryonic fibroblasts on microwell-patterned substrates. Biomaterials. 2006;vol. 27(no 36):5968–5977. doi: 10.1016/j.biomaterials.2006.06.035. [DOI] [PubMed] [Google Scholar]
- 67.Wu RZ, Bailey SN, Sabatini DM. Cell-biological applications of transfected-cell microarrays. Trends Cell Biol. 2002;vol. 12(no 10):485–488. doi: 10.1016/s0962-8924(02)02354-1. [DOI] [PubMed] [Google Scholar]
- 68.Bhatia SN, Toner M, Tompkins RG, Yarmush ML. Selective adhesion of hepatocytes on patterned surfaces. Biochem. Eng. VIII. 1994;vol. 745:187–209. doi: 10.1111/j.1749-6632.1994.tb44373.x. [DOI] [PubMed] [Google Scholar]
- 69.Folch A, Toner M. Microengineering of cellular interactions. Annu. Rev. Biomed. Eng. 2000;vol. 2:227–256. doi: 10.1146/annurev.bioeng.2.1.227. [DOI] [PubMed] [Google Scholar]
- 70.Toepke MW, Beebe DJ. PDMs absorption of small molecules and consequences in microfluidic applications. Lab on a Chip. 2006 Dec;vol. 6(no 12):1484–1486. doi: 10.1039/b612140c. [DOI] [PubMed] [Google Scholar]
- 71.Xia YN, Whitesides GM. Soft lithography. Annu. Rev. Mater. Sci. 1998;vol. 28:153–184. [Google Scholar]
- 72.Lee JN, Park C, Whitesides GM. Solvent compatibility of poly(dimethylsiloxane)-based microfluidic devices. Analytical Chemistry. 2003;vol. 75(no 23):6544–6554. doi: 10.1021/ac0346712. [DOI] [PubMed] [Google Scholar]
- 73.Paguirigan A, Beebe DJ. Gelatin based microfluidic devices for cell culture. Lab on a Chip. 2006;vol. 6:407–413. doi: 10.1039/b517524k. [DOI] [PubMed] [Google Scholar]
- 74.Hatch A, Garcia E, Yager P. Diffusion-based analysis of molecular interactions in microfluidic devices. Proc. IEEE. 2004 Jan;vol. 92:126–139. [Google Scholar]
- 75.Berthier E, Beebe DJ. Flow rate analysis of a surface tension driven passive micropump. Lab on a Chip. 2007;vol. 7(no 11):1475–1478. doi: 10.1039/b707637a. [DOI] [PubMed] [Google Scholar]
- 76.Walker GM, Beebe DJ. A passive pumping method for microfluidic devices. Lab on a Chip. 2002;vol. 2(no 3):131–134. doi: 10.1039/b204381e. [DOI] [PubMed] [Google Scholar]
- 77.Meyvantsson I, Warrick JW, Hayes S, Skoien A, Beebe DJ. Automated cell culture in high density tubeless microfluidic device arrays. Lab on a Chip. 2008;vol. 8:717–724. doi: 10.1039/b715375a. no.DOI: 10.1039/b715375a. [DOI] [PubMed] [Google Scholar]
- 78.Warrick J, Meyvantsson I, Ju J, Beebe DJ. High-throughput microfluidics: Improved sample treatment and washing over standard wells. Lab on a Chip. 2007;vol. 7:316–321. doi: 10.1039/b613350a. [DOI] [PubMed] [Google Scholar]
- 79.Hung P, Lee P, Sabounchi P, Aghdam N, Lin R, Lee L. A novel high aspect ratio microfluidic design to provide a stable and uniform microenvironment for cell growth in a high throughput mammalian cell culture array. Lab on a Chip. 2005;vol. 5:44–48. doi: 10.1039/b410743h. [DOI] [PubMed] [Google Scholar]
- 80.Hung P, Lee P, Sabounchi P, Lin R, Lee L. Continuous perfusion microfluidic cell culture array for high-throughput cell-based assays. Biotechnol. Bioeng. 2005;vol. 89:1–8. doi: 10.1002/bit.20289. [DOI] [PubMed] [Google Scholar]
- 81.Keenan TM, Folch A. Biomolecular gradients in cell culture systems. Lab on a Chip. 2008;vol. 8:34–57. doi: 10.1039/b711887b. [DOI] [PMC free article] [PubMed] [Google Scholar]
- 82.Keenan TM, Hsu CH, Folch A. Microfluidic ”jets” for generating steady-state gradients of soluble molecules on open surfaces. Appl. Phys. Lett. 2006 Sep;vol. 89(no 11):114103. [Google Scholar]
- 83.Wong AP, Perez-Castillejos R, Love JC, Whitesides GM. Partitioning microfluidic channels with hydrogel to construct tunable 3-d cellular microenvironments. Biomater. 2008 Apr;vol. 29(no 12):1853–1861. doi: 10.1016/j.biomaterials.2007.12.044. [DOI] [PMC free article] [PubMed] [Google Scholar]
- 84.Puccinelli J, Beebe DJ. 3D Microfluidic Co-Culture Platform. unpublished. [Google Scholar]
- 85.Chen CS, Jiang XY, Whitesides GM. Microengineering the environment of mammalian cells in culture. MRS Bull. 2005 Mar;vol. 30(no 3):194–201. [Google Scholar]
- 86.Dertinger SKW, Chiu DT, Jeon NL, Whitesides GM. Generation of gradients having complex shapes using microfluidic networks. Anal. Chemistry. 2001;vol. 73(no 6):1240–1246. [Google Scholar]
- 87.Abhyankar VV, Lokuta MA, Huttenlocher A, Beebe DJ. Characterization of a membrane-based gradient generator for use in cell-signaling studies. Lab on a Chip. 2006 Mar;vol. 6(no 3):389–393. doi: 10.1039/b514133h. [DOI] [PubMed] [Google Scholar]
- 88.Nakanishi J, Takarada T, Yamaguchi K, Maeda M. Recent advances in cell micropatterning techniques for bioanalytical and biomedical sciences. Anal. Sci. 2008;vol. 24(no 1):67–72. doi: 10.2116/analsci.24.67. [DOI] [PubMed] [Google Scholar]
- 89.Abhyankar VV, Beebe DJ. Spatiotemporal micropatterning of cells on arbitrary substrates. Anal. Chemistry. 2007 Jun;vol. 79(no 11):4066–4073. doi: 10.1021/ac062371p. [DOI] [PubMed] [Google Scholar]
- 90.Bransky A, Korin N, Levenberg S. Experimental and theoretical study of selective protein deposition using focused micro laminar flows. Biomed. Microdevices. 2008;vol. 10(no 3):421–428. doi: 10.1007/s10544-007-9151-6. [DOI] [PubMed] [Google Scholar]
- 91.Hui EE, Bhatia SN. Micromechanical control of cell-cell interactions. Proc. Nat. Acad. Sci. USA. 2007;vol. 104:5722–5726. doi: 10.1073/pnas.0608660104. [DOI] [PMC free article] [PubMed] [Google Scholar]
- 92.Kane RS, Takayama S, Ostuni E, Ingber DE, Whitesides GM. Patterning proteins and cells using soft lithography. Biomaterials. 1999 Dec;vol. 20(no 23–24):2363–2376. doi: 10.1016/s0142-9612(99)00165-9. [DOI] [PubMed] [Google Scholar]
- 93.Khademhosseini A, Langer R, Borenstein J, Vacanti J. Microscale technologies for tissue engineering and biology. Proc. Nat. Acad. Sci. USA. 2006;vol. 103:2480–2487. doi: 10.1073/pnas.0507681102. [DOI] [PMC free article] [PubMed] [Google Scholar]
- 94.Pirone DM, Chen CS. Strategies for engineering the adhesive microenvironment. J. Mammary Gland Biology Neoplasia. 2004;vol. 9(no 4):405–417. doi: 10.1007/s10911-004-1410-z. [DOI] [PubMed] [Google Scholar]
- 95.Nelson CM, Chen CS. Cell-cell signaling by direct contact increases cell proliferation via a pi3k-dependent signal. FEBS Lett. 2002;vol. 514(no 2–3):238–242. doi: 10.1016/s0014-5793(02)02370-0. [DOI] [PubMed] [Google Scholar]
- 96.Mehta K, Linderman JJ. Model-based analysis and design of a microchannel reactor for tissue engineering. Biotechnol. Bioeng. 2006;vol. 94(no 3):596–609. doi: 10.1002/bit.20857. [DOI] [PubMed] [Google Scholar]
- 97.Bhatia SN, Balis UJ, Yarmush ML, Toner M. Effect of cell-cell interactions in preservation of cellular phenotype: Cocultivation of hepatocytes and nonparenchymal cells. FASEB J. 1999;vol. 13(no 14):1883–1900. doi: 10.1096/fasebj.13.14.1883. [DOI] [PubMed] [Google Scholar]
- 98.Lee P, Hung P, Shaw R, Jan L, Lee L. Microfluidic application- specific integrated device for monitoring direct cell-cell communication via gap junctions between individual cell pairs. Appl. Phys. Lett. 2005;vol. 86 [Google Scholar]
- 99.Terrill R, Balss K, Zhang Y, Bohn P. Dynamic monolayer gradients: Active spatiotemporal control of alkanethiol coatings on thin gold films. J. Amer. Chemical Soc. 2000;vol. 122:988–989. [Google Scholar]
- 100.Liedberg B, Tengvall P. Molecular gradients of omega-substituted alkanethiols on gold – preparation and characterization. Langmuir. 1995;vol. 11:3821–3827. [Google Scholar]
- 101.Jeon N, Dertinger S, Chiu D, Choi I, Stroock A, Whitesides G. Generation of solution and surface gradients using microfluidic systems. Langmuir. 2000;vol. 16:8311–8316. [Google Scholar]
- 102.Hypolite C, McLernon T, Adams D, Chapman K, Herbert C, Huang C, Distefano M, Hu W. Formation of microscale gradients of protein using heterobifunctional photolinkers. Bioconjugate Chemistry. 1997;vol. 8:658–663. doi: 10.1021/bc9701252. [DOI] [PubMed] [Google Scholar]
- 103.Herbert C, McLernon T, Hypolite C, Adams D, Pikus L, Huang C, Fields G, Letourneau P, Distefano M, Hu W. Micropatterning gradients and controlling surface densities of photoactivatable biomolecules on self-assembled monolayers of oligo(ethylene glycol) alkanethiolates. Chemistry Biol. 1997;vol. 4:731–737. doi: 10.1016/s1074-5521(97)90311-2. [DOI] [PubMed] [Google Scholar]
- 104.Dertinger S, Jiang X, Li Z, Murthy V, Whitesides G. Gradients of substrate-bound laminin orient axonal specification of neurons. Proc. Nat. Acad. Sci. USA. 2002;vol. 99:12542–12547. doi: 10.1073/pnas.192457199. [DOI] [PMC free article] [PubMed] [Google Scholar]
- 105.Balss K, Coleman B, Lansford C, Haasch R, Bohn P. Active spatiotemporal control of electrochemical reactions by coupling to in-plane potential gradients. J. Phys. Chemistry B. 2001;vol. 105:8970–8978. [Google Scholar]
- 106.Ito Y, Chen G, Imanishi Y. Micropatterned immobilization of epidermal growth factor to regulate cell function. Bioconjugate Chemistry. 1998;vol. 9:277–282. doi: 10.1021/bc970190b. [DOI] [PubMed] [Google Scholar]
- 107.Ito Y. Surface micropatterning to regulate cell functions. Biomaterials. 1999;vol. 20:2333–2342. doi: 10.1016/s0142-9612(99)00162-3. [DOI] [PubMed] [Google Scholar]
- 108.Chen G, Ito Y. Gradient micropattern immobilization of EGF to investigate the effect of artificial juxtacrine stimulation. Biomaterials. 2001;vol. 22:2453–2457. doi: 10.1016/s0142-9612(00)00432-4. [DOI] [PubMed] [Google Scholar]
- 109.Saltzman WM, Olbricht WL. Building drug delivery into tissue engineering. Nature Rev. Drug Discovery. 2002;vol. 1(no 3):177–186. doi: 10.1038/nrd744. [DOI] [PubMed] [Google Scholar]
- 110.Murphy WL, Mercurius KO, Koide S, Mrksich M. Substrates for cell adhesion prepared via active site-directed immobilization of a protein domain. Langmuir. 2004;vol. 20(no 4):1026–1030. doi: 10.1021/la035733m. [DOI] [PubMed] [Google Scholar]
- 111.Castner DG, Ratner BD. Biomedical surface science: Foundations to frontiers. Surface Sci. 2002;vol. 500(no 1–3):28–60. [Google Scholar]
- 112.Lee KY, Mooney DJ. Hydrogels for tissue engineering. Chem. Rev. 2001;vol. 101(no 7):1869–1879. doi: 10.1021/cr000108x. [DOI] [PubMed] [Google Scholar]
- 113.Lutolf MP, Hubbell JA. Synthetic biomaterials as instructive extracellular microenvironments for morphogenesis in tissue engineering. Nat. Biotechnol. 2005;vol. 23(no 1):47–55. doi: 10.1038/nbt1055. [DOI] [PubMed] [Google Scholar]
- 114.Tan WH, Takeuchi S. Monodisperse alginate hydrogel microbeads for cell encapsulation. Advanced Mater. 2007 Sep;vol. 19(no 18) 2696−+ [Google Scholar]
- 115.Jakobs E, Hanein Y. Micrometer scale gel patterns. Colloids Surfaces A-Physiochemical Eng. Aspects. 2006 Nov;vol. 290(no 1–3):33–40. [Google Scholar]
- 116.Koh WG, Pishko MV. Fabrication of cell-containing hydrogel microstructures inside microfluidic devices that can be used as cell-based biosensors. Anal. Bioanalytical Chemistry. 2006 Aug;vol. 385(no 8):1389–1397. doi: 10.1007/s00216-006-0571-6. [DOI] [PubMed] [Google Scholar]
- 117.Wu H, Huang B, Zare RN. Generation of complex, static solution gradients in microfluidic channels. J. Amer. Chemical Soc. 2006;vol. 128(no 13):4194–4195. doi: 10.1021/ja058530o. [DOI] [PubMed] [Google Scholar]
- 118.Clausell-Tormos J, Lieber D, Baret J-C, El-Harrak A, Miller OJ, Frenz L, Blouwolff J, Humphry KJ, Köster S, Duan H, Holtze C, Weitz DA, Griffiths AD, Merten CA. Droplet-based microfluidic platforms for the encapsulation and screening of mammalian cells and multicellular organisms. Chem Biol. 2008;vol. 15(no 5):427–437. doi: 10.1016/j.chembiol.2008.04.004. [DOI] [PubMed] [Google Scholar]
- 119.Gomez-Sjoberg R, Leyrat AA, Pirone DM, Chen CS, Quake SR. Versatile, fully automated, microfluidic cell culture system. Anal. Chemistry. 2007;vol. 79(no 22):8557–8563. doi: 10.1021/ac071311w. [DOI] [PubMed] [Google Scholar]
- 120.Nevill JT, Cooper R, Dueck M, Breslauer DN, Lee LP. Integrated microfluidic cell culture and lysis on a chip. Lab on a Chip. 2007;vol. 7(no 12):1689–1695. doi: 10.1039/b711874k. [DOI] [PubMed] [Google Scholar]
- 121.Melin J, Quake SR. Microfluidic large-scale integration: The evolution of design rules for biological automation. Annu. Rev. Biophys. Biomolecular Structure. 2007;vol. 36:213–231. doi: 10.1146/annurev.biophys.36.040306.132646. [DOI] [PubMed] [Google Scholar]
- 122.Cho SK, Moon HJ, Kim CJ. Creating, transporting, cutting, and merging liquid droplets by electrowetting-based actuation for digital microfluidic circuits. J. Microelectromechanical Syst. 2003 Feb;vol. 12(no 1):70–80. [Google Scholar]
- 123.Su F, Chakrabarty K, Fair RB. Microfluidics-based biochips: Technology issues, implementation platforms, and design-automation challenges. IEEE Trans. Computer-Aided Design Integrated Circuits Syst. 2006 Feb;vol. 25(no 2):211–223. [Google Scholar]
- 124.Lionello A, Josserand J, Jensen H, Girault HH. Protein adsorption in static microsystems: Effect of the surface to volume ratio. Lab on a Chip. 2005;vol. 5(no 3):254–260. doi: 10.1039/b411179f. [DOI] [PubMed] [Google Scholar]
- 125.Lionello A, Josserand J, Jensen H, Girault HH. Dynamic protein adsorption in microchannels by ”stop-flow” and continuous flow. Lab on a Chip. 2005;vol. 5(no 10):1096–1103. doi: 10.1039/b506009e. [DOI] [PubMed] [Google Scholar]
- 126.Paguirigan AL, Beebe DJ. Microfluidics meet biology: Bridging the gap by validation and application of microscale techniques for cell biological assays. BioEssays. 2008 Sep;vol. 30(no 9):811–821. doi: 10.1002/bies.20804. [DOI] [PMC free article] [PubMed] [Google Scholar]
- 127.Puccinelli J, Paguirigan A, Beebe DJ. Proc. μ-TAS. San Diego, CA: 2008. Biological validation of high-throughput microchannel culture. [Google Scholar]
- 128.Yin H, Pattrick N, Zhang X, Klauke N, Cordingley HC, Haswell SJ, Cooper JM. Quantitative comparison between microfluidic and microtiter plate formats for cell-based assays. Anal. Chemistry. 2008;vol. 80(no 1):179–185. doi: 10.1021/ac701958z. [DOI] [PubMed] [Google Scholar]


