Abstract
c-Abl is a non-receptor tyrosine kinase that participates in multiple signaling pathways linking the cell surface, cytoskeleton, and the nucleus. Recent in vitro studies have also linked c-Abl to amyloid-β-induced toxicity and tau phosphorylation. To further characterize a potential role of c-Abl in Alzheimer's disease (AD), we examined the expression and distribution of total and phosphorylated forms of c-Abl in the hippocampus of AD and control subjects. Laser scanning confocal microscopy was used to examine the colocalization of c-Abl with AD pathology. Our results demonstrate alterations in the presence and distribution of c-Abl and phosphorylated isoforms of c-Abl within the hippocampus during AD. Total unphosphorylated c-Abl was highest in non-demented control hippocampus. Activated isoforms of c-Abl were most abundant in AD hippocampus and co-localized with AD pathology, including granulovacuolar degeneration bodies. c-Abl interacts with phosphorylated tau in AD brain and may contribute to the formation of tau pathology. These studies demonstrate altered activation and distribution of c-Abl during AD, suggesting a role for c-Abl in Aβ signal transduction and generation of tau pathology in AD.
Keywords: Alzheimer's disease, amyloid-β, c-Abl, granulovacuolar degeneration bodies, tau
Introduction
The mammalian c-Abl gene was identified as the cellular homolog of v-Abl oncogene of the Abelson murine leukemia virus [1]. c-Abl is a ubiquitously expressed nonreceptor tyrosine kinase, which has two isoforms (Ia and Ib) as a result of alternative splicing of the first two exons [2]. The amino acid domains corresponding to the Ib isoform are used for reference in this study. c-Abl protein contains an SH3 domain, SH2 domain, and the catalytic kinase domain in the N-terminus, which are shared with the Src kinase family. However the C-terminus of c-Abl contains three nuclear localization signals and one nuclear export signal [3,4], a DNA-binding domain [5], and actin binding domains [6]. c-Abl kinase activity is tightly regulated by multiple signal transduction pathways, including growth factor, cell adhesion and oxidative stress pathways [7,8]. A conserved tyrosine residue in the c-Abl catalytic domain (Y412) is phosphorylated in oncogenic forms of c-Abl, such as Bcr-Abl and v-Abl [9,10], and associated with c-Abl activation [7,11]. Mutation of Y412 to phenylalanine causes a 90% reduction of c-Abl kinase activity [7]. The activity of c-Abl is also regulated by its subcellular distribution. Nuclear c-Abl regulates gene transcription in response to DNA damage and plays a role in cell cycle and cell fate decisions. Cytoplasmic c-Abl interacts with the actin cytoskeleton and modulates actin remodeling [12]. The subcellular localization of c-Abl is controlled by binding with 14-3-3 protein, which requires the phosphorylation of c-Abl at amino acid residue T735 [13].
Although the function of c-Abl has been well established in dividing cells, it has also been shown to function in the development and regeneration of the nervous system. During neurite outgrowth, c-Abl forms a complex with and activates cyclin dependent kinase 5 (cdk5) to regulate neuronal migration and neurite outgrowth [14]. In addition, Leyssen and colleagues reported that amyloid-β protein precursor (AβPP) induced axonal arborization in postmitotic neurons requires protein interaction with c-Abl via a conserved motif in the C-terminus of AβPP [15]. Moreover, c-Abl interacts directly with TrkA, NMDA, and EphB receptors, implicating c-Abl within multiple signaling pathways in the nervous system [12].
Alzheimer's disease (AD) is the leading cause of dementia in the elderly and neuropathologically characterized by accumulation of extracellular neuritic plaques and intra- and extracellular neurofibrillary tangles (NFT) within specific brain regions [16]. In AD, memory loss and cognitive impairment are accompanied by the degeneration of select neuronal populations in the hippocampus and cerebral cortex [17]. Recent studies suggest a role for c-Abl in AD pathogenesis. Alvarez et al. [18] reported that upon treatment of primary neurons with amyloid-β (Aβ) fibrils, c-Abl was activated and formed a protein complex with p73 prior to cell death. The neuronal cell death induced by Aβ fibrils was prevented by pharmacologic inhibition of c-Abl [18]. Recent studies have also suggested a role for c-Abl in NFT formation by direct phosphorylation of tau [19]. Moreover, c-Abl may also induce tau phosphorylation indirectly through activation of its downstream targets, cdk5 and GSK-3, which have been shown to phosphorylate tau [20]. However the localization and distribution of c-Abl in AD brain is unknown.
In the current study, we report the expression and distribution of c-Abl in the hippocampus of AD and age-matched control subjects. We observed that the immunoreactivity of non-phosphorylated total c-Abl was decreased in AD hippocampus compared to healthy control. However, one activated form of c-Abl phosphorylated on tyrosine residue 412 (Abl-pY412) was sequestered in granulovacuolar degeneration bodies (GVDs) in hippocampal pyramidal neurons of late-stage AD subjects. Another phosphorylated form of c-Abl on threonine residue 735 (Abl-pT735) co-localized with amyloid plaques, tangles, and GVDs. We also detected direct interactions between c-Abl and phosphorylated tau. These data support the hypothesis that c-Abl contributes to AD pathogenesis and provides a new therapeutic target.
Materials and Methods
Subjects
Frozen and paraffin tissues were obtained from the University of Pittsburgh Alzheimer's Disease Research Center (ADRC) Tissue Bank after approval by “The Committee for Oversight of Research Involving the Dead” (CORID) at the University of Pittsburgh School of Medicine, PA. A total of 10 subjects with clinical history of AD dementia and classified as Braak stage V-VI (late AD group), 10 subjects with no clinical history of dementia, but with AD pathology and classified as Braak stage II-IV (early AD group), and 10 age-matched subjects with no clinical history of a neurologic disease and no Aβ pathology and only rare tangles in the hippocampus (control group) were used in the study. Patient demographics are listed in Table 1. There were no statistically significant differences in the postmortem intervals between the subject groups, as determined by unpaired t-test. We also identified no gender effects to our data results as measured by the nonparametric Spearman correlation test. The diagnosis of AD was determined by the combined use of Consortium to Establish a Registry for AD (CERAD), the National Institute of Aging (NIA), and the Reagan Institute (RI) criteria [21,22].
Table 1.
Demographics of study subjects
| CASE # |
AGE | SEX | GROUP | PMI | BRAAK |
|---|---|---|---|---|---|
| 1 | 61 | M | HC | 15 hrs | 0 |
| 2 | 50 | M | HC | 18 hrs | Nd |
| 3 | 90 | M | HC | 4 hrs | Nd |
| 4 | 74 | M | HC | 3 hrs | Nd |
| 5 | 78 | F | HC | 6 hrs | Nd |
| 6 | 51 | F | HC | 5hrs | 0 |
| 7 | 51 | M | HC | 6 hrs | 0 |
| 8 | 57 | M | HC | 2 hrs | 1 |
| 9 | 68 | M | HC | 27 hrs | 2 |
| 10 | 70 | F | HC | 6 hrs | Nd |
| 11 | 85 | M | Early AD | 4 hrs | 3 |
| 12 | 87 | M | Early AD | 5 hrs | 4 |
| 13 | 86 | F | Early AD | 5 hrs | 2 |
| 14 | 83 | M | Early AD | 12 hrs | 3 |
| 15 | 85 | F | Early AD | 3 hrs | 4 |
| 16 | 56 | F | Early AD | 19 hrs | 2 |
| 17 | 66 | F | Early AD | 9 hrs | 2 |
| 18 | 71 | M | Early AD | 15 hrs | 2 |
| 19 | 72 | F | Early AD | 9 hrs | 2 |
| 20 | 76 | M | Early AD | 13 hrs | 3 |
| 21 | 78 | M | Late AD | 7 hrs | 5 |
| 22 | 82 | M | Late AD | 4 hrs | 6 |
| 23 | 56 | F | Late AD | 3 hrs | 5 |
| 24 | 79 | F | Late AD | 6 hrs | 6 |
| 25 | 76 | F | Late AD | 9.5 hrs | 6 |
| 26 | 57 | F | Late AD | 9 hrs | 6 |
| 27 | 58 | M | Late AD | 7 hrs | 6 |
| 28 | 69 | F | Late AD | 5 hrs | 5 |
| 29 | 70 | M | Late AD | 3 hrs | 6 |
| 30 | 71 | F | Late AD | 4.5 hrs | 6 |
Clinical data of human subjects from age-matched, non-neurologic disease controls, early AD (no dementia, with amyloid plaques and tangles) and late AD (clinical history of dementia, amyloid plaques and tangles, no Lewy bodies) as defined by Braak scoring criteria. PMI, postmortem interval; F, female; M, male. Nd: not determined. HC: non-neurologic disease control.
Western Blot analysis
Fresh frozen human hippocampus from control and early- and late-stage AD subjects were homogenized in 20% w/v Tris-Triton buffer (50 mM Tris at pH 7.4, 1% Triton X-100) containing protease (Sigma, St. Louis, MO) and phosphatase (Calbiochem, San Diego, CA) inhibitors. The homogenate was centrifuged at 5000 g to eliminate cell debris and the supernatant centrifuged at 100,000 g at 4°C. The supernatant was saved and called the soluble fraction. The pellet containing detergent insoluble and organelles was resuspended in Tris-Triton buffer and labeled the insoluble fraction. The protein concentrations of soluble and insoluble fractions were quantified using the BCA Protein Assay Kit (Pierce). 50 μg protein was loaded into each gel lane and separated by SDS-PAGE and transferred to nitrocellulose membrane. Nonspecific antigens were blocked with 5% dry milk in Tris-Triton buffer for 1 hour at room temperature, and incubated at 4°C overnight with primary antibodies at the following concentrations: total c-Abl antibody (554148; BD Pharmingen, San Diego, CA) 1:600 dilution; Abl-pY412 antibody (ab47315; Abcam, Cambridge, MA) 1:1000 dilution; Abl-pT735 antibody, (#2864; Cell Signaling, Danvers, MA) 1:1000 dilution. Immunoblots were then incubated with appropriate horseradish peroxidase-conjugated secondary antibody (Chemicon, Temecula, CA) and antigen visualized using enhanced chemiluminescence (ECL-Perkin Elmer Life Sciences Inc, Waltham, MA). Protein levels were quantified using NIH Image 1.63 and normalized for actin in both soluble and insoluble fractions.
Immunohistochemistry and Immunofluorescent Laser Scanning Confocal Microscopy (LSCM)
Tissue was immersion-fixed in 10% buffered formalin and embedded in paraffin. Human hippocampal tissue sections (8 μM) were heated to 60°C for 20 minutes prior to deparaffinization with three consecutive 10-minute incubations in 100% xylene. The tissue was then rehydrated and endogenous peroxidase activity blocked with 0.3% hydrogen peroxide for 30 minutes. To expose antigenic epitopes, tissue was steamed for 20 minutes in Target Retrieval Solution, High pH (Dako, Glostrup, Denmark). To avoid background due to endogenous biotin or biotin-binding proteins, lectins, or nonspecific binding proteins present in the section, an avidin/biotin blocking kit was used according to company specifications (Vector Laboratories, Burlingame, CA). Sections were incubated in SuperBlock (ScyTek Laboratories, Logan, UT) for 10 minutes to block nonspecific antibody binding sites. Sections were next incubated with appropriate primary antibodies at 4°C overnight. For light microscopy, antibodies included anti-total c-Abl (#2862; Cell Signaling) at 1:400 dilution, anti-Abl-pT735 (#2864; Cell Signaling) at 1:100 dilution, anti-Abl-pY412 (ab47315; Abcam) at 1:300 dilution, or anti-paired helical filaments (PHF) tau (clone AT8, Thermo Fisher Scientific, Rockford, IL) at 1:400 dilution. For each series of immunohistochemical staining, one no-primary antibody control slide was included to determine nonspecific immunoreactivity of the secondary antibody. A commercially available blocking peptide for Abl-pT735 was also utilized. For the blocking peptide, brain tissue was immunolabeled with antibody containing a 3-fold volume (>100 molar excess) of specific blocking peptide as per manufacturer guidelines. Proteins bound to specific antibodies were visualized with Nova-Red chromagen (Vector Laboratories), dehydrated, and mounted with permount (Thermo Fisher Scientific). Immunofluorescent staining was carried out as stated above except after primary antibody slides were incubated with goat anti-mouse or anti-rabbit secondary antibodies conjugated to Alexa Fluor-488 or −568 (Invitrogen, Carlsbad, CA, 1:300 dilution) and mounted with Prolong Gold Antifade Reagent (Invitrogen).
Quantification of immunohistochemistry and statistical analysis
The staining intensity of total c-Abl and phospho-c-Abl was determined by light microscopy with integrated software package (Simple PCI version 6.0). Images were taken from the same subfield of the CA3 and CA1 subfields as indicated in Supplemental Fig. 1A in each case and converted to 8-bit (gray and white). Preliminary data showed no significant difference of c-Abl immunoreactivity between different areas within same subfield of hippocampus (CA1 or CA3). In each section, the subfield of interest (pyramidal layer) was manually (digitally) outlined as indicated in Supplemental Fig. 1B, and its area was measured. A threshold was set and only objects with a staining level above this threshold were measured (Fig. S1B). Staining intensity was measured in the subfield region of interest (ROI) area occupied by the threshold object area (object area/ROI area) within the selected areas determined by the drawing tool. The object area/ROI area values were statistically compared with ANOVA (GraphPad Prism 4.0a). When p < 0.05 results were considered statistically significant and post-hoc analysis performed to compare each pair of groups.
Co-immunoprecipitation
Fresh frozen hippocampal tissue was homogenized at a 1:5 weight/volume ratio in RIPA-DOC buffer (50mM Tris at PH 7.4, 150mM NaCl, 1% Triton X-100, 1% sodium deoxycholate, 0.1% SDS, protease and phosphatase inhibitor cocktails) in a glass Telfon homogenizer. 200 μl total homogenate was used for each immunoprecipitation (IP). IP was performed using the MultiMACS Protein A/G Kit from Miltenyi Biotec (Auburn, CA), according to the manufacturer's protocols. Samples were separated by SDS-PAGE, transferred to nitrocellulose membrane (Bio-Rad, Hercules, CA), and incubated with appropriate primary antibodies at 4°C overnight. Primary antibodies included anti-total c-Abl (BD Pharmingen, 1:600 dilution), or anti-PHF-tau (clone AT8, Pierce, 1:800 dilution). Blots were then incubated with appropriate HRP-conjugated secondary antibodies and visualized using ECL detection kit (Perkin Elmer Life Sciences).
Results
Recent in vitro studies have linked c-Abl activation to Aβ-induced cell death and tau phosphorylation [18, 19]. To determine if c-Abl activation or altered subcellular distribution occur in vivo, we first examined the protein levels of c-Abl and two different activated phospho-c-Abl isoforms in healthy control, early- and late-stage AD subjects by immunoblot (see Methods for classification parameters). Abl-pY412 was detected in the insoluble fraction and exhibited significant difference across the three subject groups (Fig. 1A and B). The protein level of Abl-pY412 in the insoluble fraction was significantly decreased during early AD compared to healthy control (Fig. 1B), and it showed a trend for increased Abl-pY412 levels in late-stage AD although the difference was not statistically significant (Fig. 1B). Non-phosphorylated c-Abl (total c-Abl) and c-Abl phosphorylated at tyrosine residue 412 (Abl-pY412) were not detected in the soluble fractions of any subject (data not shown). The immunoreactive bands corresponding to c-Abl phosphorylated at threonine residue 735 (Abl-pT735) were absent or too weak to be quantified in the insoluble fraction (data not shown). We observed no significant differences between the level of total c-Abl or Abl-pT735 in the insoluble or soluble fractions in control and AD brain, respectively (Fig. 1A and B).
Fig. 1.
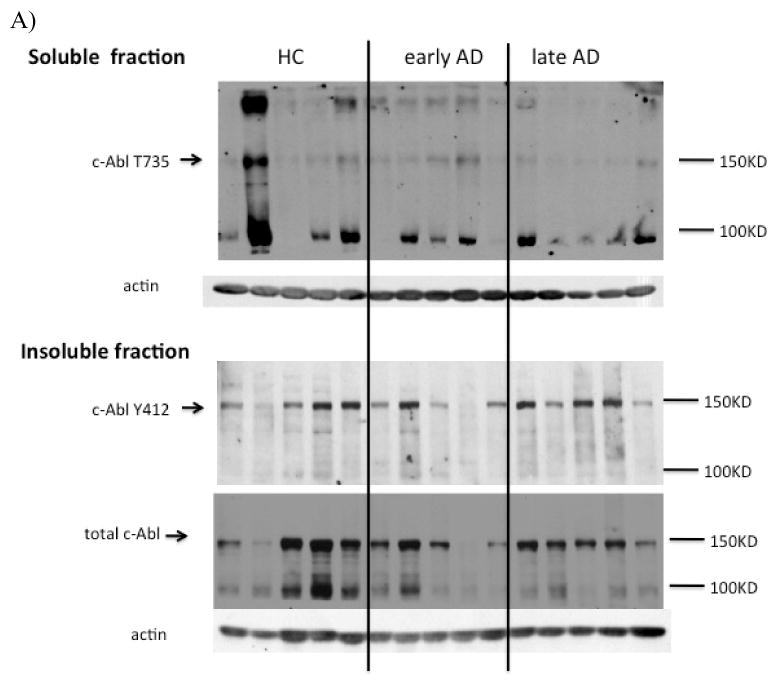
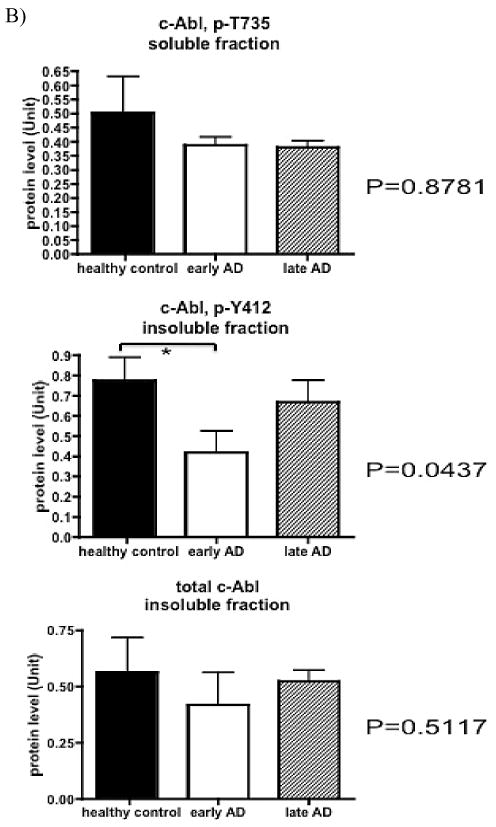
Fig. 1a. Western blot analysis for total and phospho-c-Abl isoforms in human hippocampus. Fresh frozen hippocampus from non-neurologic disease control and neuropathologically confirmed early- and late-stage AD cases were homogenized as described in Methods to generate soluble and insoluble fractions. A) Equal amounts of protein from each case were loaded in gel lanes and immunolabeled using antibodies specific to total or phospho-c-Abl. The blot was also probed with actin as a loading control for both soluble and insoluble fractions. Lane 1–5 represent control subjects, lanes 5-10 from early-stage AD subjects, and lane 11–15 are late-stage AD subjects. Top panel: soluble fraction; bottom panel: insoluble fraction.
Fig. 1b. B) Quantitative measurements of total and phospho-c-Abl in control and AD subjects, normalized by loading control. Protein level was shown as mean ± SE, n = 5 for each group. The highest protein level among all 15 cases was set to 1. Statistical analysis was performed by Kruskal-Wallis test (non-parametric one way ANOVA) across all subject groups (ANOVA P value indicated in the figure and considered significant when P < 0.05), followed by post-hoc test to compare each pair of groups (marked by * when p < 0.05 between the indicated groups).
c-Abl distribution in cells
Since immunoblot analysis requires the homogenization of tissue and inability to assess expression in specific cell types, we next examined the distribution of c-Abl and the two different activated forms of c-Abl in the hippocampus of control, early- and late-stage AD patients by immunohistochemistry. Tissues slides were not counterstained in order to better identify and interpret the observed staining patterns.
To detect c-Abl by immunohistochemistry, we first used an antibody against a sequence close to the C-terminus of human c-Abl that is distal to sites of protein phosphorylation. In all subjects, we observed c-Abl in the cytoplasm of pyramidal neurons throughout the hippocampus (Fig. 2). No staining was observed in dentate granule neurons. In healthy control and early-stage AD subjects, c-Abl was typically observed in punctate structures in the cell body of neurons (Fig. 2A-D). We also observed granular immunostaining in proximal and distal processes and in the white matter that most likely represent neuronal processes (Fig. 2F). In late AD, the staining pattern exhibited little difference in CA4 and CA3/CA2 within control or early AD. However, we observed decreased levels of diffuse cytoplasmic c-Abl immunoreactivity in CA1 neurons with increased granular staining in the cytoplasm and processes in late AD (Fig. 2F). We failed to detect c-Abl in amyloid plaques or cytoskeletal pathology in any AD case.
Fig. 2.
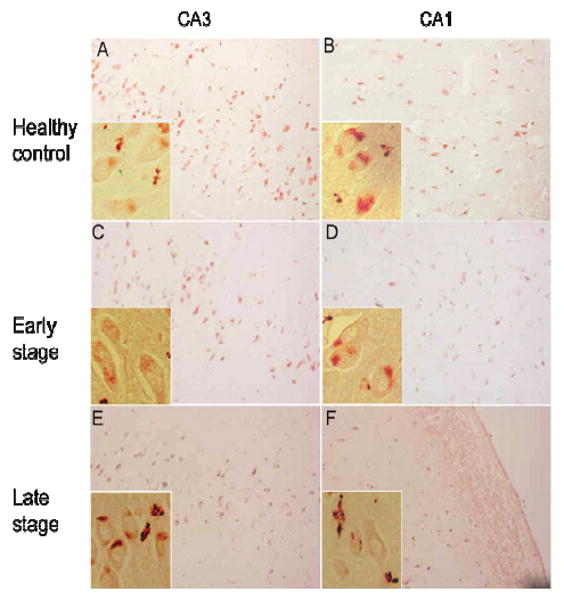
The subcellular distribution of c-Abl in control, early- and late AD hippocampus. The expression of total c-Abl in the CA3 (Left column) and CA1 (Right column) from healthy controls (A and B), early stage AD (C and D), and late stage AD (E and F) as determined using antibody specific to non-phosphorylated c-Abl (see Methods). Magnification for all panels is 200X, and inset magnification is 400X. (Colours are visible in the electronic version of the article at www.iospress.nl)
Abl-pY412 distribution
We next determined the distribution of activated c-Abl in control and AD hippocampi. Phosphorylation of tyrosine residue 412 (Abl-pY412) has been shown to be important for c-Abl activation [23,24]. Therefore, we investigated the presence and distribution of Abl-pY412 using phospho-specific antibody.
We detected Abl-pY412 in the cell body of hippocampal pyramidal neurons (represented in insets of Fig. 3). Interestingly, we observed granular staining of Abl-pY412 within neuronal cell bodies surrounded by clear vacuoles in late AD (indicated by arrows in Fig. 3E and F). The structures share morphological characteristics with GVDs that are most often detected in hippocampal pyramidal neurons in AD [25, 26]. In healthy control and early AD cases, Abl-pY412 was predominantly distributed in neuronal cell bodies (Fig. 3A-D). However Abl-pY412 was detected within GVD bodies throughout the hippocampus in late AD (Fig. 3E and F). No amyloid plaque or NFT pathology was immunolabeled using this anti-Abl-pY412 antibody. Low levels of nuclear immunoreactivity were observed throughout the hippocampus in all cases.
Fig. 3.
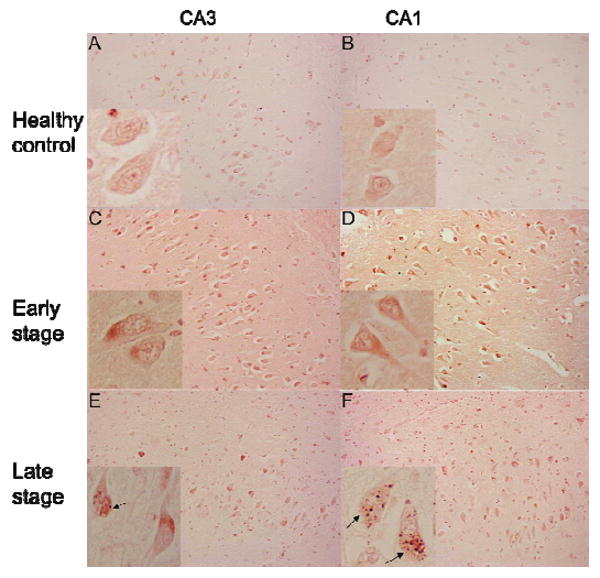
The distribution of Abl-pY412 in control, early AD and late AD hippocampus. Representative immunohistochemistry of Abl-pY412 in the CA3 (Left column) and CA1 (Right column), for healthy control (A and B), early stage AD (C and D), and late stage AD (E and F). Magnification for all panels is 200X, and inset magnification is 400X. Abl-pY412 was observed both a granular staining and GVDs in neuronal cell bodies as indicated by arrows (insets in E and F). (Colours are visible in the electronic version of the article at www.iospress.nl)
Abl-pT735 distribution
Phosphorylation of c-Abl on threonine residue 735 (T735) is required for binding to 14-3-3 protein and regulates c-Abl nuclear translocation [13]. Therefore, we determined the presence and distribution of Abl-pT735 in the hippocampus of AD and control subjects by immunohistochemistry. In healthy controls, Abl-pT735 showed very weak or absent immunoreactivity in hippocampal pyramidal neuron cell bodies (Fig. 4A and B). In early-stage AD, Abl-pT735 exhibited increased cytoplasmic immunoreactivity in CA1 and increased nuclear immunoreactivity in CA3 (Fig. 4C and D). However, in late-stage AD, Abl-pT735 displayed increased immunostaining in CA1 pyramidal neurons compared to healthy control and early-stage AD (Fig. 4F). In the CA1 and entorhinal cortex, amyloid plaques, and NFTs were immunoreactive for Abl-pT735 (Figs 4F and 5A). In addition, GVDs were also immunostained by Abl-pT735 antibodies in the CA1 and cortex (Fig. 5B). Interesting, we observed Hirano body immunoreactivity in some late-stage AD subjects, suggesting that c-Abl is sequestered in Hirano bodies during AD (Fig. 5C). We also observed nuclear immunoreactivity in some hippocampal neurons of all cases (Fig. 4A-E). Abl-pT735 immunoreactivity was completely eliminated by preincubation of the antibody with a specific blocking peptide (data not shown). We note that Abl-pT735 immunoreactivity in CA3, CA4 and dentate gyrus (DG) of late-stage AD hippocampus was reduced to levels observed in control subjects.
Fig. 4.
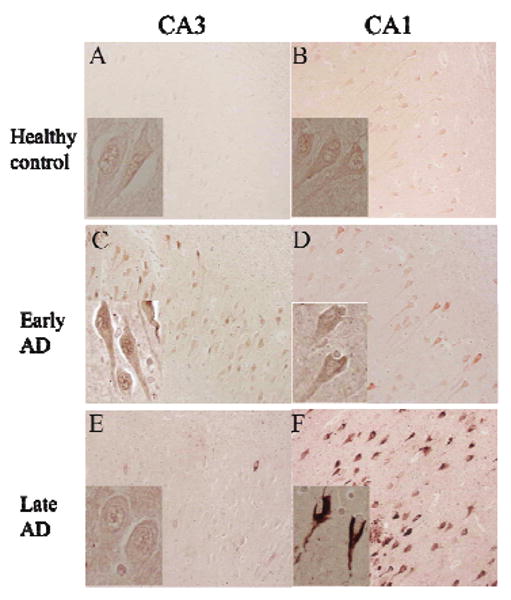
The distribution of Abl-pT735 in control, early AD, and late AD hippocampus. Immunohistochemistry of Abl-pT735 in the CA3 (Left column) and CA1 (Right column) of healthy controls (A and B), early stage AD (C and D), and late stage AD (E and F). Magnification for all panels is 200X and inset magnification is 400X. (Colours are visible in the electronic version of the article at www.iospress.nl)
Fig. 5.

Abl-pT735 immunolabels neuropathologic hallmarks of AD. A) Abl-pT735 immunostains plaques and NFTs (magnification: 200X). B) Abl-pT735 localizes to GVDs (magnification: 400X). C) Abl-pT735 localizes to Hirano bodies (magnification: 400X). (Colours are visible in the electronic version of the article at www.iospress.nl)
Quantification of c-Abl and phospho-c-Abl isoforms
The staining intensity of c-Abl, Abl-pY412, and Abl-pT735 was determined by light microscopy with an integrated software package (Simple PCI version 6.0, Hamamatsu Corporation) using images of pyramidal neurons from the same region of the CA3 and CA1 subfields in each case. The highest level of c-Abl in the CA1 and CA3 was detected in control hippocampus (Fig. 6A). c-Abl immunoreactivity increased in late AD but remained lower than control subjects (Fig. 6A). c-Abl levels in the CA3 exhibited a statistically significant decrease across all three subject groups (Fig. 6A). However levels of Abl-pY412 were significantly higher in the CA1 of early AD than control or late AD subjects (Fig. 6B). A similar trend was evident in the CA3 (Fig. 6B), suggesting the accumulation of Abl-pY412 during early AD. We observed increased Abl-pT735 immunoreactivity in the CA1 and CA3 of late AD when compared to control and early AD, with statistically significant increase in CA1 (Fig. 6C).
Fig. 6.
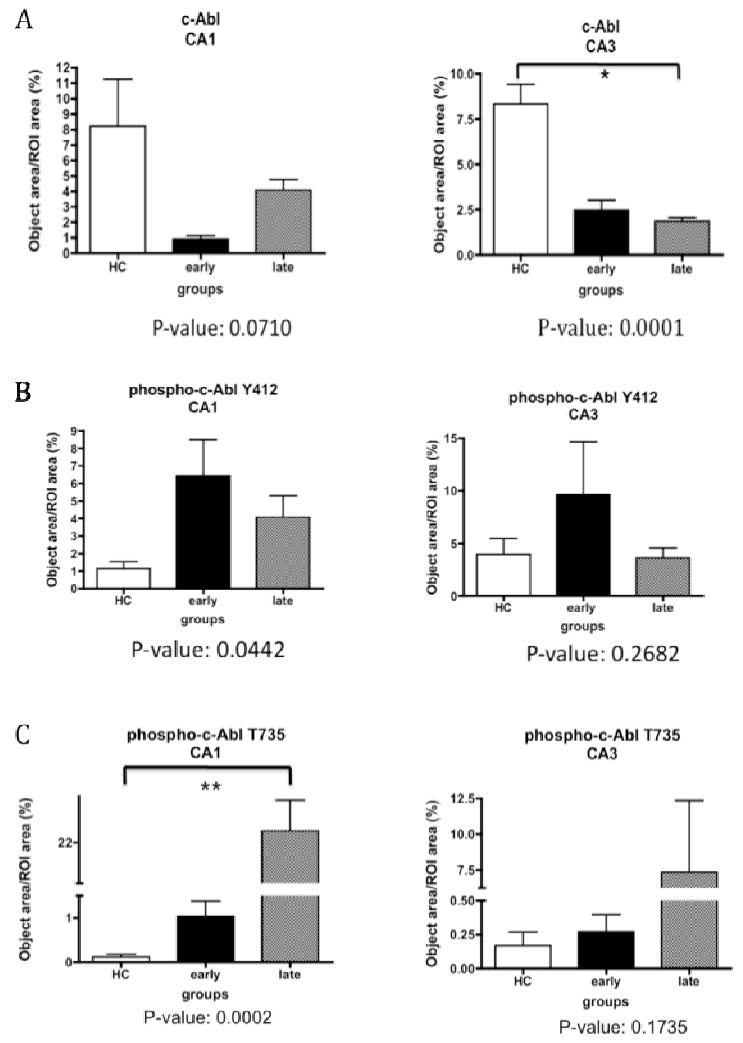
Quantification of immunohistochemistry for total c-Abl and phosphorylated isoforms of c-Abl in control and AD hippocampus. Quantification of total c-Abl immunoreactivity (panel A), Abl-pY412 immunoreactivity (panel B) and Abl-pT735 immunoreactivity (panel C). Error bars represent standard error of each group. White bars denote the healthy control group, and the black and grey bars denote the early- and late-stage AD respectively. Statistical analysis was performed by Kruskal-Wallis test (non-parametric one way ANOVA) across all subject groups (ANOVA P value indicated in the figure and considered significant when P < 0.05.), followed by post-hoc test to compare each pair of groups (marked by * when p < 0.05 between the indicated groups).
Co-localization of activated c-Abl with hyperphosphorylated tau and amyloid plaques
We next examined the co-localization of phospho-c-Abl isoforms with hyperphosphorylated tau (p-tau) during AD by double-label laser confocal microscopy. Abl-pY412 co-localized with phosphorylated tau in GVDs within NFTs bearing neurons and co-localized within tau-positive granules in amyloid plaques in late AD (Fig. 7). Abl-pY412 and p-tau co-localized all Abl-pY412 immunopositive neurons. Abl-pT735 co-localized with p-tau in both GVDs and NFTs (Fig. 8, panels A-F). All Abl-pT735 positive neurons were p-tau positive, with all p-tau positive GVDs also immunoreactive for Abl-pT735. Punctate Abl-pT735 immunoreactivity was also observed within amyloid plaques (Fig. 8, panels G-I), although it was not co-localized with Aβ.
Fig. 7.
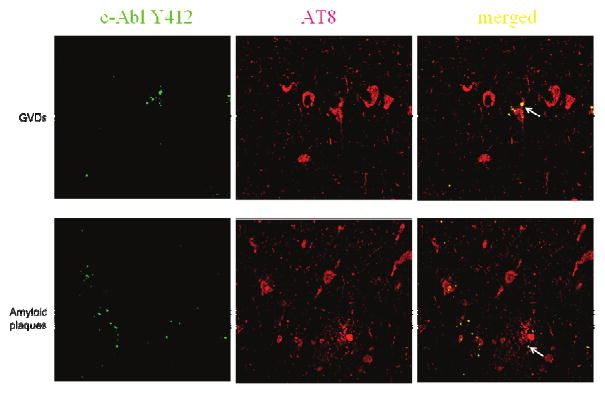
Confocal microscopy of Abl-pY412 and phospho-tau in CA1 late stage AD. (Magnification: 400X) Top panel: Abl-pY412 co-localized with phospho-tau (labeled by AT8) in GVDs within pyramidal hippocampal neurons (arrow in merged image). Bottom panel: Abl-pY412 co-localized with phospho-tau (labeled by AT8) in punctate structures within AT8 positive neuritic plaques (arrow in merged image). (green: Abl-pY412, red: p-tau, yellow: merged).
Fig. 8.
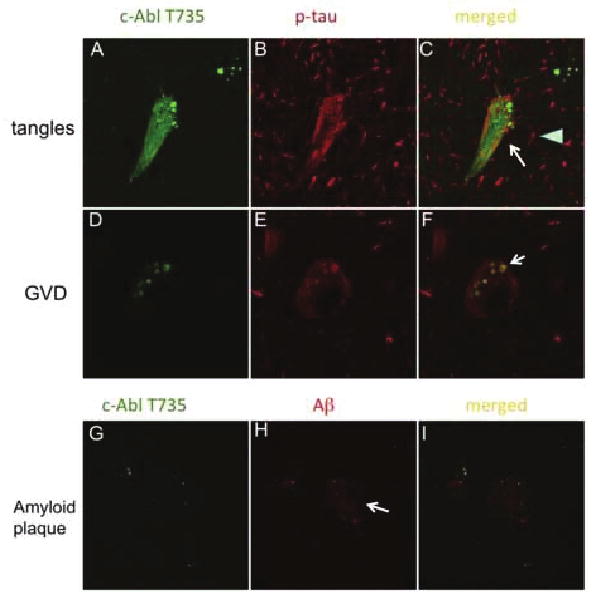
Confocal microscopy of Abl-pT735 with tau and Aβ in late stage AD. Panels A-F): Double-label confocal microscopy for Abl-pT735 and p-tau (AT8). (Magnification: 600X) Abl-pT735 co-localizes with NFTs (indicated by arrow) but not p-tau positive dystrophic neurites (indicated by arrowhead) (panels A-C). P-tau and Abl-pT735 co-localize to GVDs (indicated by arrow, panels D-F). (green, panel A & D: Abl-pT735, red, panel B & E: AT8, yellow, panel C & F: merged). Panels G-I): Double-label confocal microscopy for Abl-pT735 and Aβ. Punctate Abl-pT735 immunoreactivity is contained within amyloid plaques, although Abl-pT735 is not co-localized with Aβ. (panel G: Abl-pT735 in green; panel H: Aβ in red; panel I: merged image with co-localization in yellow. Amyloid plaque indicated by arrow).
Finally, we co-immunoprecipitated c-Abl and p-tau from AD hippocampus (Fig. 9). Immunoprecipitation of c-Abl resulted in the co-precipitation of p-tau specifically in AD brain (Fig. 9A). We also observed co-immunoprecipitation of c-Abl by immunoprecipitation of p-tau from AD or control brain (Fig. 9B). These data suggest interactions between c-Abl and p-tau in the hippocampus.
Fig. 9.
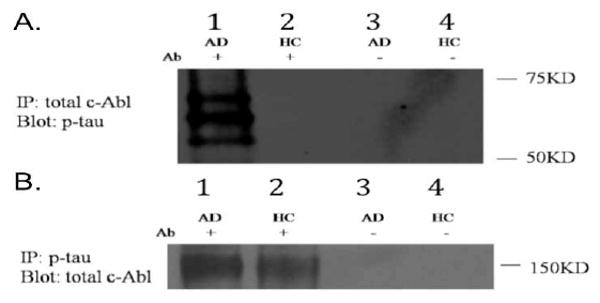
c-Abl interacts with p-tau in AD brain. Co-immunoprecipitation performed using hippocampal tissue extracts from healthy control or late AD subjects. A): Proteins were immunoprecipitated with antibody to c-Abl and proteins separated by SDS-PAGE. The resulting blot was probed with p-tau antibody (AT8). Lane 1: AD subject, lane 2: healthy control subject, lanes 3 and 4: No antibody negative controls (no antibody used for immunoprecipitation). B): Proteins were immunoprecipitated using anti-phospho-tau antibody and the resulting blot probed with antibody to c-Abl. Lane 1: AD subject, lane 2: healthy control subject, lanes 3 and 4: No antibody negative controls.
In summary, we examined the expression and distribution of c-Abl in control and AD hippocampus. The highest level of c-Abl (unphosphorylated form) immunoreactivity was observed in healthy controls. Abl-pY412 exhibited abundant immunoreactivity during early-stage of AD and was detected within GVDs in late AD. However, Abl-pT735 displayed increased immunoreactivity specifically in the CA1 subfield of late stage AD and co-localization with p-tau in GVDs and NFTs. Abl-pT735 was also observed within amyloid plaque structures in AD hippocampus. c-Abl and p-tau were co-immunoprecipitated from AD hippocampus. These results suggest the functional status of c-Abl is altered throughout different stages of AD disease. In addition, phospho-c-Abl co-localizes with p-tau within AD pathology and may directly associate with tau phosphorylation.
Discussion
In this study, we examined the expression and distribution of c-Abl and specific phospho-c-Abl isoforms in control and AD hippocampus. Total c-Abl was located predominantly in neuronal cell bodies, often in a granular staining pattern (Fig. 1). This granular staining was increased in the hippocampus of late AD subject (Fig. 2). Phosphorylation of c-Abl is dependent on its local concentration, as activation can be increased by inducing high local concentrations within the cell [27]. Therefore the increased granular immunoreactivity of c-Abl in AD may contribute to its activation. We failed to immunolabel neuropathologic hallmarks of AD with the antibody to non-phosphorylated c-Abl, suggesting phosphorylation may be required for its redistribution to pathologic hallmarks. By immunoblot, the antibody to non-phosphorylated c-Abl detected a protein band at 150 KD and a higher molecular weight species, suggesting this antibody recognizes both non-phosphorylated and phosphorylated c-Abl (data not shown). However, the staining pattern detected by this antibody was different from phosphorylated c-Abl specific antibodies, suggesting that c-Abl phosphorylation may induce protein conformational changes that impede antibody binding.
We observed increased Abl-pY412 in early AD, suggesting activation of c-Abl during early stages of AD. In late AD, Abl-pY412 was detected in GVDs in the CA1 (Fig. 3). GVDs, a specific type of autophagosome, accumulate during AD and have been shown to contain phosphorylated tau [28]. A recent in vitro study demonstrated that c-Abl phosphorylated tau at Tyr394 and this specific phosphorylated form of tau was identified in human brain by mass spectrometry [19]. Thus, we propose that c-Abl activation, as denoted by phosphorylation at Y412, occurs during early AD and may contribute to tau phosphorylation. Phosphorylated c-Abl and tau are both sequestered into GVDs during AD. We quantified the level of Abl-pY412 and p-tau in the hippocampus and noted a weak correlation between these two proteins in the CA1 region (r = 0.27, p = 0.059) that failed to reach statistical significance (data not shown). Further studies with additional subjects are required to examine the interaction or correlation between Abl-pY412 and p-tau. Furthermore, confocal microscopy demonstrated that Abl-pY412 and p-tau co-localized to GVDs within hippocampal pyramidal neurons (Fig. 7). Co-immunoprecipitation experiments suggest protein interactions between p-tau and c-Abl which may be mediated by the proline-riched region of tau and the SH3 domain of c-Abl [29]. Echarri and colleagues reported that activated c-Abl is degraded by the ubiquitin-proteasome dependent pathway [30]. Since GVDs are immunopositive for ubiquitin, sequestration of activated c-Abl to GVDs may be a cellular response to target the protein for degradation. Western blot analysis demonstrated reduced levels of Abl-pY412 protein in the soluble fraction of tissue homogenates from AD hippocampus, suggesting Abl-pY412 is sequestered into GVDs or other insoluble granules in AD.
Kinases such as c-Jun and JNK have also been detected within GVD granules of pyramidal neurons during AD and have been implicated in tau phosphorylation during AD [31–33]. Interestingly, a functional relationship between these c-Jun, JNK, and c-Abl has been reported, with positive feedback mechanisms between c-Abl and Jun [34]. Therefore, c-Abl may also contribute to tau pathology by directly phosphorylating tau or indirectly via regulating other serine/threonine kinases. In addition, both CDK5 and GSK-3β, which contribute to tau pathology in AD, are also c-Abl kinase substrates. Future studies will examine the functional association between c-Abl and mitogen-activated protein kinases.
As discussed above, phosphorylation of c-Abl at threonine 735 is required for the interaction of c-Abl with 14-3-3 and retention of c-Abl in the cytoplasm. Increased Abl-pT735 immunoreactivity in the cytoplasm of neurons in AD compared to control brain suggests that c-Abl may be sequestered in the cytoplasm by 14-3-3, in addition to accumulation within NFTs, GVDs, and Hirano bodies. Moreover, increased immunoreactivity of Abl-pT735 was specific to the CA1 of late AD hippocampus, where neuronal loss is most severe. Interestingly, our results demonstrate that only Abl-pT735 co-localized with p-tau labeled NFTs. We quantified the level of Abl-pT735 and p-tau in the hippocampus and noted a positive correlation between these two proteins in the CA1 region (r = 0.4893, p = 0.0054) and the CA3 subfield (r = 0.6677, p = 0.0002) (data not shown). Further studies are required to examine the functional significance of T735 phosphorylation and cytoplasmic accumulation of c-Abl during AD. It is possible that accumulation of Abl-pT735 within NFTs or GVDs represents a protective response within neurons, as has been suggested for p-tau [36,37]. We also observed Abl-pT735 in Hirano bodies, linking c-Abl accumulation in both tau and actin based cytoskeletal abnormalities in AD.
c-Abl is a non-receptor tyrosine kinase that shuttles between the cytoplasm and nucleus and functions in multiple physiological and pathological processes [12]. In the cytoplasm, c-Abl regulates the cytoskeleton through interactions with actin, whereas in the nucleus it can induce apoptosis in response to DNA damage [35]. Cultured neurons can be rescued from Aβ-induced toxicity via inhibiting c-Abl activity by a specific c-Abl inhibitor, STI 571, or by c-Abl RNAi [18]. We observed increased levels of Abl-pY412 in early stage AD, with increased Abl-pT735 in late stage AD (Figs 3, 4, and 6). Activation of c-Abl during early AD may induce downstream phosphorylation of proteins such as GSK-3β, and collectively contribute to tau phosphorylation and NFT formation. Further studies are required to test this hypothesis. The increased levels of Abl-pT735 during late AD may represent additional c-Abl phosphorylation that occurs upon c-Abl accumulation in NFTs and GVDs.
Although our immunohistochemistry results demonstrated that c-Abl was predominantly in the cytoplasm of pyramidal neurons, we did observe nuclear immunoreactivity for Abl-pY412 and Abl-pT735 within some hippocampal neurons in AD. This result is consistent with prior studies demonstrating c-Abl within nuclei of mouse neuroepithelial cells, while the majority of c-Abl was located in the cytoplasm [36]. Our results do not exclude the possibility of the involvement of nuclear c-Abl in the pathogenesis of AD, as c-Abl may participate in nuclear events contributing to apoptosis during AD [37]. In addition, activated c-Abl may only transiently enter the nucleus, thereby making its detection in postmortem tissues much more difficult. Our data suggests a preferential sequestration of Abl-pY412 into GVDs. Sequestering c-Abl in GVDs may represent a neuroprotective response as has been suggested for other proteins that accumulate in GVDs [38].
In summary, our results demonstrate that levels of total c-Abl (unphosphorylated form) were highest in control hippocampus. Abl-pY412 exhibited highest levels during early stage AD and localizes to GVDs in late AD. However, another phosphorylated form of c-Abl, Abl-pT735, displayed increased immunoreactivity in the CA1 and CA3 during AD and was located to GVDs, NFTs, and Hirano bodies. c-Abl represents a new protein component of GVDs, though further studies including immunoelectron microscopy are required to confirm its present in GVDs. To our knowledge, this is the first study to examine the expression and distribution of c-Abl in human AD brain, and indicates the functional status and subcellular distribution of c-Abl is altered during AD.
Supplementary Material
Schematic figure to show the method for quantify the IHC results. A schematic figure to show the method for the IHC quantification. A) The area in CA1 and CA3 where the image (200X magnification) was taken was indicated by red frame. B) An example to show how the software works. Briefly, in each section, the subfield of interest (pyramidal layer) was manually (digitally) outlined as indicated in Fig. S1A, and its area was measured. A threshold was set and only the objects with a staining level above this threshold were measured (Fig. S1B). Staining intensity was measured in the fraction of subfield of region of interest (ROI) area occupied by the threshold object area (object area/ROI area) within the selected areas outlined by the drawing tool. (Colours are visible in the electronic version of the article at www.iospress.nl)
Acknowledgments
The authors thank Dr. Ronald Hamilton for neuropathologic assessment of all cases and Jonette Werley for providing coded tissue samples. Funding support was provided by NIH NS042724 to RB.
References
- 1.Ozanne B, Wheeler T, Zack J, Smith G, Dale B. Transforming gene of a human leukaemia cell is unrelated to the expressed tumour virus related gene of the cell. Nature. 1982;299:744–747. doi: 10.1038/299744a0. [DOI] [PubMed] [Google Scholar]
- 2.Ben-Neriah Y, Bernards A, Paskind M, Daley GQ, Baltimore D. Alternative 5′ exons in c-abl mRNA. Cell. 1986;44:577–586. doi: 10.1016/0092-8674(86)90267-9. [DOI] [PubMed] [Google Scholar]
- 3.Van Etten RA, Jackson P, Baltimore D. The mouse type IV c-abl gene product is a nuclear protein, and activation of transforming ability is associated with cytoplasmic localization. Cell. 1989;58:669–678. doi: 10.1016/0092-8674(89)90102-5. [DOI] [PubMed] [Google Scholar]
- 4.Wen ST, Jackson PK, Van Etten RA. The cytostatic function of c-Abl is controlled by multiple nuclear localization signals and requires the p53 and Rb tumor suppressor gene products. EMBO J. 1996;15:1583–1595. [PMC free article] [PubMed] [Google Scholar]
- 5.Kipreos ET, Wang JY. Cell cycle-regulated binding of c-Abl tyrosine kinase to DNA. Science. 1992;256:382–385. doi: 10.1126/science.256.5055.382. [DOI] [PubMed] [Google Scholar]
- 6.Van Etten RA, Jackson PK, Baltimore D, Sanders MC, Matsudaira PT, Janmey PA. The COOH terminus of the c-Abl tyrosine kinase contains distinct F- and G-actin binding domains with bundling activity. J Cell Biol. 1994;124:325–340. doi: 10.1083/jcb.124.3.325. [DOI] [PMC free article] [PubMed] [Google Scholar]
- 7.Brasher BB, Van Etten RA. c-Abl has high intrinsic tyrosine kinase activity that is stimulated by mutation of the Src homology 3 domain and by autophosphorylation at two distinct regulatory tyrosines. J Biol Chem. 2000;275:35631–35637. doi: 10.1074/jbc.M005401200. [DOI] [PubMed] [Google Scholar]
- 8.Pluk H, Dorey K, Superti-Furga G. Autoinhibition of c-Abl. Cell. 2002;108:247–259. doi: 10.1016/s0092-8674(02)00623-2. [DOI] [PubMed] [Google Scholar]
- 9.McWhirter JR, Wang JY. An actin-binding function contributes to transformation by the Bcr-Abl oncoprotein of Philadelphia chromosome-positive human leukemias. EMBO J. 1993;12:1533–1546. doi: 10.1002/j.1460-2075.1993.tb05797.x. [DOI] [PMC free article] [PubMed] [Google Scholar]
- 10.Van Etten RA. c-Abl regulation: a tail of two lipids. Curr Biol. 2003;13:R608–610. doi: 10.1016/s0960-9822(03)00528-1. [DOI] [PubMed] [Google Scholar]
- 11.Dorey K, Engen JR, Kretzschmar J, Wilm M, Neubauer G, Schindler T, Superti-Furga G. Phosphorylation and structure-based functional studies reveal a positive and a negative role for the activation loop of the c-Abl tyrosine kinase. Oncogene. 2001;20:8075–8084. doi: 10.1038/sj.onc.1205017. [DOI] [PubMed] [Google Scholar]
- 12.Woodring PJ, Hunter T, Wang JY. Regulation of F-actin-dependent processes by the Abl family of tyrosine kinases. J Cell Sci. 2003;116:2613–2626. doi: 10.1242/jcs.00622. [DOI] [PubMed] [Google Scholar]
- 13.Yoshida K, Yamaguchi T, Natsume T, Kufe D, Miki Y. JNK phosphorylation of 14-3-3 proteins regulates nuclear targeting of c-Abl in the apoptotic response to DNA damage. Nat Cell Biol. 2005;7:278–285. doi: 10.1038/ncb1228. [DOI] [PubMed] [Google Scholar]
- 14.Zukerberg LR, Patrick GN, Nikolic M, Humbert S, Wu CL, Lanier LM, Gertler FB, Vidal M, Van Etten RA, Tsai LH. Cables links Cdk5 and c-Abl and facilitates Cdk5 tyrosine phosphorylation, kinase upregulation, and neurite outgrowth. Neuron. 2000;26:633–646. doi: 10.1016/s0896-6273(00)81200-3. [DOI] [PubMed] [Google Scholar]
- 15.Leyssen M, Ayaz D, Hebert SS, Reeve S, De Strooper B, Hassan BA. Amyloid precursor protein promotes post-developmental neurite arborization in the Drosophila brain. EMBO J. 2005;24:2944–2955. doi: 10.1038/sj.emboj.7600757. [DOI] [PMC free article] [PubMed] [Google Scholar]
- 16.Morishima-Kawashima M, Ihara Y. Alzheimer's disease: beta-Amyloid protein and tau. J Neurosci Res. 2002;70:392–401. doi: 10.1002/jnr.10355. [DOI] [PubMed] [Google Scholar]
- 17.Morrison JH, Hof PR. Life and death of neurons in the aging brain. Science. 1997;278:412–419. doi: 10.1126/science.278.5337.412. [DOI] [PubMed] [Google Scholar]
- 18.Alvarez AR, Sandoval PC, Leal NR, Castro PU, Kosik KS. Activation of the neuronal c-Abl tyrosine kinase by amyloid-beta-peptide and reactive oxygen species. Neurobiol Dis. 2004;17:326–336. doi: 10.1016/j.nbd.2004.06.007. [DOI] [PubMed] [Google Scholar]
- 19.Derkinderen P, Scales TM, Hanger DP, Leung KY, Byers HL, Ward MA, Lenz C, Price C, Bird IN, Perera T, Kellie S, Williamson R, Noble W, Van Etten RA, Leroy K, Brion JP, Reynolds CH, Anderton BH. Tyrosine 394 is phosphorylated in Alzheimer's paired helical filament tau and in fetal tau with c-Abl as the candidate tyrosine kinase. J Neurosci. 2005;25:6584–6593. doi: 10.1523/JNEUROSCI.1487-05.2005. [DOI] [PMC free article] [PubMed] [Google Scholar]
- 20.Klafki HW, Staufenbiel M, Kornhuber J, Wiltfang J. Therapeutic approaches to Alzheimer's disease. Brain. 2006;129:2840–2855. doi: 10.1093/brain/awl280. [DOI] [PubMed] [Google Scholar]
- 21.Mirra SS, Heyman A, McKeel D, Sumi SM, Crain BJ, Brownlee LM, Vogel FS, Hughes JP, van Belle G, Berg L. The Consortium to Establish a Registry for Alzheimer's Disease (CERAD). Part II. Standardization of the neuropathologic assessment of Alzheimer's disease. Neurology. 1991;41:479–486. doi: 10.1212/wnl.41.4.479. [DOI] [PubMed] [Google Scholar]
- 22.Hyman BT, Trojanowski JQ. Consensus recommendations for the postmortem diagnosis of Alzheimer disease from the National Institute on Aging and the Reagan Institute Working Group on diagnostic criteria for the neuropathological assessment of Alzheimer disease. J Neuropathol Exp Neurol. 1997;56:1095–1097. doi: 10.1097/00005072-199710000-00002. [DOI] [PubMed] [Google Scholar]
- 23.Reynolds FH, Jr, Oroszlan S, Stephenson JR. Abelson murine leukemia virus P120: identification and characterization of tyrosine phosphorylation sites. J Virol. 1982;44:1097–1101. doi: 10.1128/jvi.44.3.1097-1101.1982. [DOI] [PMC free article] [PubMed] [Google Scholar]
- 24.Plattner R, Kadlec L, DeMali KA, Kazlauskas A, Pendergast AM. c-Abl is activated by growth factors and Src family kinases and has a role in the cellular response to PDGF. Genes Dev. 1999;13:2400–2411. doi: 10.1101/gad.13.18.2400. [DOI] [PMC free article] [PubMed] [Google Scholar]
- 25.Okamoto K, Hirai S, Iizuka T, Yanagisawa T, Watanabe M. Reexamination of granulovacuolar degeneration. Acta Neuropathol (Berl) 1991;82:340–345. doi: 10.1007/BF00296544. [DOI] [PubMed] [Google Scholar]
- 26.Tomlinson BE, Kitchener D. Granulovacuolar degeneration of hippocampal pyramidal cells. J Pathol. 1972;106:165–185. doi: 10.1002/path.1711060305. [DOI] [PubMed] [Google Scholar]
- 27.Smith JM, Mayer BJ. Abl: mechanisms of regulation and activation. Front Biosci. 2002;7:d31–42. doi: 10.2741/a767. [DOI] [PubMed] [Google Scholar]
- 28.Bondareff W, Wischik CM, Novak M, Roth M. Sequestration of tau by granulovacuolar degeneration in Alzheimer's disease. Am J Pathol. 1991;139:641–647. [PMC free article] [PubMed] [Google Scholar]
- 29.Lee G. Tau and src family tyrosine kinases. Biochim Biophys Acta. 2005;1739:323–330. doi: 10.1016/j.bbadis.2004.09.002. [DOI] [PubMed] [Google Scholar]
- 30.Echarri A, Pendergast AM. Activated c-Abl is degraded by the ubiquitin-dependent proteasome pathway. Curr Biol. 2001;11:1759–1765. doi: 10.1016/s0960-9822(01)00538-3. [DOI] [PubMed] [Google Scholar]
- 31.Zhu X, Lee HG, Raina AK, Perry G, Smith MA. The role of mitogen-activated protein kinase pathways in Alzheimer's disease. Neurosignals. 2002;11:270–281. doi: 10.1159/000067426. [DOI] [PubMed] [Google Scholar]
- 32.Zhu X, Raina AK, Rottkamp CA, Aliev G, Perry G, Boux H, Smith MA. Activation and redistribution of c-jun N-terminal kinase/stress activated protein kinase in degenerating neurons in Alzheimer's disease. J Neurochem. 2001;76:435–441. doi: 10.1046/j.1471-4159.2001.00046.x. [DOI] [PubMed] [Google Scholar]
- 33.Lagalwar S, Berry RW, Binder LI. Relation of hippocampal phospho-SAPK/JNK granules in Alzheimer's disease and tauopathies to granulovacuolar degeneration bodies. Acta Neuropathol (Berl) 2007;113:63–73. doi: 10.1007/s00401-006-0159-4. [DOI] [PubMed] [Google Scholar]
- 34.Barila D, Mangano R, Gonfloni S, Kretzschmar J, Moro M, Bohmann D, Superti-Furga G. A nuclear tyrosine phosphorylation circuit: c-Jun as an activator and substrate of c-Abl and JNK. EMBO J. 2000;19:273–281. doi: 10.1093/emboj/19.2.273. [DOI] [PMC free article] [PubMed] [Google Scholar]
- 35.Van Etten RA. Cycling, stressed-out and nervous: cellular functions of c-Abl. Trends Cell Biol. 1999;9:179–186. doi: 10.1016/s0962-8924(99)01549-4. [DOI] [PubMed] [Google Scholar]
- 36.Koleske AJ, Gifford AM, Scott ML, Nee M, Bronson RT, Miczek KA, Baltimore D. Essential roles for the Abl and Arg tyrosine kinases in neurulation. Neuron. 1998;21:1259–1272. doi: 10.1016/s0896-6273(00)80646-7. [DOI] [PubMed] [Google Scholar]
- 37.Caltagarone J, Jing Z, Bowser R. Focal adhesions regulate Abeta signaling and cell death in Alzheimer's disease. Biochim Biophys Acta. 2007;1772:438–445. doi: 10.1016/j.bbadis.2006.11.007. [DOI] [PMC free article] [PubMed] [Google Scholar]
- 38.Thakur A, Wang X, Siedlak SL, Perry G, Smith MA, Zhu X. c-Jun phosphorylation in Alzheimer disease. J Neurosci Res. 2007;85:1668–1673. doi: 10.1002/jnr.21298. [DOI] [PubMed] [Google Scholar]
Associated Data
This section collects any data citations, data availability statements, or supplementary materials included in this article.
Supplementary Materials
Schematic figure to show the method for quantify the IHC results. A schematic figure to show the method for the IHC quantification. A) The area in CA1 and CA3 where the image (200X magnification) was taken was indicated by red frame. B) An example to show how the software works. Briefly, in each section, the subfield of interest (pyramidal layer) was manually (digitally) outlined as indicated in Fig. S1A, and its area was measured. A threshold was set and only the objects with a staining level above this threshold were measured (Fig. S1B). Staining intensity was measured in the fraction of subfield of region of interest (ROI) area occupied by the threshold object area (object area/ROI area) within the selected areas outlined by the drawing tool. (Colours are visible in the electronic version of the article at www.iospress.nl)


