

Abstract
Rationale
Although ventricular premature beats (VPBs) during acute regional ischemia have been linked to mechanical stretch of ischemic tissue, whether and how ischemia-induced mechanical dysfunction can induce VPBs and facilitate their degradation into reentrant arrhythmias has not been yet addressed.
Objective
This study used a novel multiscale electromechanical model of the rabbit ventricles to investigate the origin of and the substrate for spontaneous arrhythmias arising from ischemia-induced electrophysiological and mechanical changes.
Methods and Results
Two stages of ischemia were simulated. Dynamic mechanoelectrical feedback was modeled as spatially and temporally nonuniform membrane currents through mechanosensitive channels, the conductances of which depended on local strain rate. Our results reveal that both strains and strain rates were significantly larger in the central ischemic zone than in the border zone. However, in both ischemia stages, a VPB originated from the ischemic border in the left ventricular apical endocardium because of mechanically induced suprathreshold depolarizations. It then traveled fully intramurally until emerging from the ischemic border on the anterior epicardium. Reentry was formed only in the advanced ischemia stage as the result of a widened temporal excitable gap. Mechanically induced delayed afterdepolarization-like events contributed to the formation of reentry by further decreasing the already reduced-by-hyperkalemia local excitability, causing extended conduction block lines and slowed conduction in the ischemic region.
Conclusions
Mechanically induced membrane depolarizations in the ischemic region are the mechanism by which mechanical activity contributes to both the origin of and substrate for spontaneous arrhythmias under the conditions of acute regional ischemia.
Keywords: ventricular premature beats, acute ischemia, electromechanics, arrhythmias
Coronary artery disease causes one of every five deaths in the United States alone,1 with acute regional ischemia accounting for 80% of the sudden deaths without a prior history of heart disease.2 Electrophysiological changes during ischemia lead to malignant rhythm disorders and cardiac dysfunction. Although the substrate for ventricular fibrillation sustenance during acute ischemia has been extensively studied,3–5 the mechanisms by which ventricular premature beats (VPBs), the first initiating beats of ventricular fibrillation, are generated remain a matter of uncertainty and debate. VPBs have been linked to mechanical stretch of ischemic tissue: clinical trials have reported a statistical correlation between the occurrence of VPBs and wall motion abnormalities.6,7 However, whether and how regional ischemia-induced mechanical dysfunction can induce VPB and facilitate its degradation into reentrant arrhythmias has not been yet addressed.
A body of research in the normal heart has demonstrated that stretch of cardiac tissue can result in spontaneous firing of the myocytes and VPBs.8–11 All studies of acute ventricular dilatation have reported occurrence of ventricular arrhythmias in the first minute after dilatation.12,13 The inducibility of VPBs has been found to depend on the magnitude, velocity, and time of application of stretch.9,10,12 Studies on isolated myocytes have suggested that mechanically induced VPBs could be the result of activation of mechanosensitive channels (MSCs).14,15
In the acutely ischemic heart occurrence of VPBs has been also associated with rapid regional distension. A recent study showed that during acute ischemia, the probability of occurrence of spontaneous arrhythmias is much lower in the isolated unloaded heart than in the working heart.16 Although VPBs were not suppressed during acute ischemia with intra-coronary infusion of the MSC blocker gadolinium, gadolinium was administrated to the ischemic zone but not to the ischemic border; therefore, the possibility of spontaneous arrhythmias originating from the border could not be ruled out.17 Indeed, several studies have shown that most VPBs arose from regions around the electrophysiological ischemic border.3,18,19
In addition to its role in the genesis of VPBs in normal and ischemic hearts, stretch also induces changes in tissue excitability and conduction velocity (CV) that could promote the degeneration of VPBs into ventricular fibrillation.13,20 However, it remains unclear how mechanical deformation can contribute to the establishment of a proarrhythmic substrate under the conditions of acute myocardial ischemia.
Unraveling the exact mechanisms underlying mechanically induced spontaneous arrhythmias is hampered by the lack of adequate experimental protocols to measure the 3D electromechanical activity, with high spatiotemporal resolution, in the beating heart with ischemic injury. Whereas the state-of-the-art optical mapping techniques provide high-resolution information regarding epicardial electrical behavior, the methodology cannot be used to adequately resolve depth information. Furthermore, using the technique presently requires that myocardial contraction is suppressed either by constraining the heart physically or by the administration of pharmacological agents. Finally, the electrophysiological changes in acute ischemia are very rapid, rendering the assessment of mechanically induced arrhythmogenic mechanisms technically difficult. Thus, in this study, we used a novel anatomically realistic dynamic 3D electromechanical model of the rabbit ventricles to gain insight into the role of electromechanical dysfunction on arrhythmogenesis during acute ischemia. Specifically, we hypothesized that dispersion of mechanical strain during contraction in acute regional ischemia results in spatially and temporally nonuniform recruitment of MSCs, which in turn leads to (1) suprathreshold depolarizations around the ischemic border and generation of VPBs; and (2) subthreshold depolarizations in the ischemic region exacerbating the existing proarrhythmic ischemic substrate and thus facilitating the degradation of VPBs into reentrant arrhythmias. The goal of this study was to test these hypotheses.
Methods
A detailed description of model and simulation protocol is available in the Online Data Supplement at http://circres.ahajournals.org. Briefly, a novel 3D finite-element electromechanical model of the beating rabbit ventricles was developed with a distribution of central ischemic zone (CIZ) and border zone (BZ) as depicted in Figure 1. Two stages of ischemia, I and II, corresponding to 4 and 6 minutes postocclusion, respectively, were simulated with realistic ischemia-induced electrophysiological and mechanical changes. Dynamic mechanoelectrical feedback (MEF) was represented via spatially and temporally nonuniform membrane currents through MSCs, ie, IMSC, the conductances of which depended on local strain rate, dEff/dt, the temporal derivative of local strain in the fiber direction, Eff.
Figure 1.

Rabbit ventricular model geometry. A, NZ (blue), CIZ (red), and BZ following occlusion of the left anterior descending artery. B, Cross-sectional views of the model.
Results
Myofiber Strain and Mechanically Induced Depolarizations in the Ventricles
During isovolumic contraction, the dynamic geometric changes of the ventricles followed ellipticalization pattern, with expansion along the long axis, ie, base-to-apex direction, and shortening along the short axis. Figure 2 illustrates the spatial distribution of strain in the fiber direction in the normal (Figure 2A) and ischemic ventricles (ischemia stage I, Figure 2B) at 220 ms from the onset of the last pacing stimulus. At this time both ventricles were in systole and experienced the largest elongation in apex-to-base direction (4.9%). Large myofiber strain developed in the ischemic region, generally increasing from BZ toward CIZ. The local maximum strain rate during systole is shown in Figure 2C projected onto the undeformed ventricular geometry. The global maximum in the distribution of maximum strain rate occurred endocardially in the left ventricle (LV) within CIZ. Movie I (Online Data Supplement) presents the distribution of Eff in the normal and the ischemic (stage I) ventricles during isovolumic contraction.
Figure 2.

Distribution of myofiber strain (Eff) in the normal (A) and ischemic (stage I) (B) heart 220 ms after the onset of the last pacing stimulus. C, Maximum strain rate (dEff/dt) during contraction in the ischemic heart. Distribution of maximum dEff/dt is projected onto the undeformed heart geometry.
The histogram in Figure 3A presents the average values (with standard deviations) of the maximum fiber strain and strain rate in the normal zone (NZ), BZ and CIZ. Both values are significantly larger in BZ and CIZ than in NZ. Because the magnitude of IMSC was linearly related to strain rate, larger mechanically induced depolarizations occurred in the ischemic zone as compared to the neighboring normal tissue. Figure 3B depicts traces of transmembrane potential (Vm) and of Eff following the last pacing stimulus from three representative epicardial sites located in NZ, BZ, and CIZ, as marked in Figure 1A. The figure shows that during that pacing beat, CIZ was associated with the largest ischemia-induced elevation in resting potential (17.0 mV more than that in NZ), smallest action potential amplitude (79.0% of that in NZ), and shortest action potential duration (67.8% of that in NZ). In both BZ and CIZ, after the pacing beat, the strain and its rate started to rise gradually, whereas in NZ, they remained unchanged. In both BZ and CIZ, cell membranes underwent associated mechanically induced subthreshold depolarizations, ie, delayed afterdepolarization (DAD)-like events, with values of up to 5.9 and 12.9 mV, respectively, in BZ and CIZ, whereas such depolarizations were absent in NZ. Intracellular calcium concentration ([Ca2+]i) did not rise during the subthreshold depolarizations (data not shown). Therefore, the term DAD-like events was used to distinguish them from DADs, which are usually calcium-dependent.
Figure 3.

A, Histogram of maximum myofiber strain (Eff) and its rate (dEff/dt) in NZ, BZ, and CIZ. Bars represent mean values with standard deviations. Asterisks indicate significant deviation (P<0.01 in Student’s t test) from values in NZ. B, Traces of Vm (solid lines) and Eff (dashed lines), from sites in NZ, BZ, and CIZ (asterisks in Figure 1A). Time 0 is the onset of the last pacing stimulus.
Mechanically Induced VPB
Following the last pacing excitation, the normal heart returned to rest. In the ischemic heart, however, one VPB was induced for both ischemia stages. Figure 4A depicts the VPB activation sequence for stage I (Movie II). Cross-sectional views show that VPB originated from 2 locations around the endocardial BZ in LV (arrows in 191-ms inset), propagated fully intramurally in the apical region (193 and 195 ms) until part of the wavefront (enclosed by ellipse in bottom 195-ms inset) made a breakthrough onto the epicardium at the location enclosed by ellipse in the 198-ms inset (ventricles tilted for a better view of epicardial activation). Another part of the wavefront (enclosed by rectangle in bottom 195-ms inset) made a later epicardial breakthrough, shown enclosed by rectangle in the 200-ms inset, because it propagated across a thicker part of the wall. Both epicardial breakthrough sites were located close to the anterior ischemic border. The wavefront that these activations coalesced into initially encountered conduction block within CIZ and propagated around it (240 ms), then entered CIZ (300 ms) and terminated there.
Figure 4.
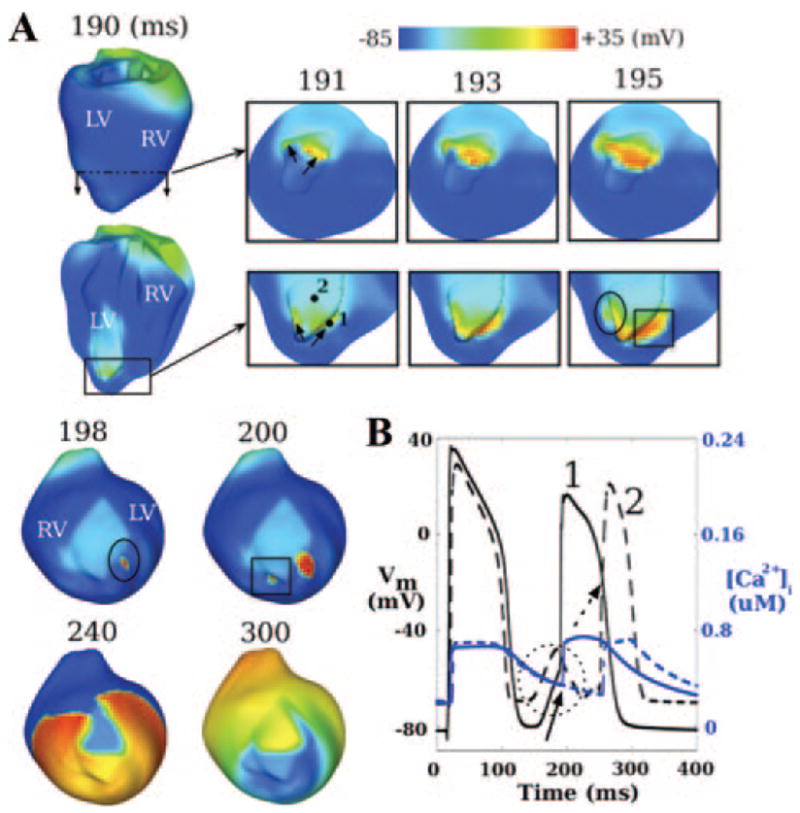
A, Evolution of mechanically induced VPB for ischemia stage I; 191- to 195-ms insets present short and long axis views of apical region; 198- to 300-ms insets present a titled anterior view of the ventricles. Arrows in 191-ms inset indicate locations of earliest spontaneous firing. Ellipse and rectangle in bottom 195-ms inset indicate parts of the wavefront that make the earliest epicardial breakthrough at the locations enclosed with the ellipse in 198-ms inset and the rectangle in 200-ms inset, respectively. B, Traces of Vm (black) and [Ca2+]i (blue) at sites 1 (solid lines, BZ) and 2 (dashed lines, CIZ) marked in the bottom 191-ms inset in A. Solid arrow and dashed circle denote mechanically induced depolarization at sites 1 and 2, respectively. Dashed arrow indicates activation at site 2 by propagation of the mechanically induced VPB.
Figure 4B presents action potentials and [Ca2+]i recorded at sites 1 (in BZ) and 2 (in CIZ) marked in the bottom 191-ms inset, Figure 4A. At both sites, cells underwent mechanically induced DAD-like events following the pacing beat. At site 1, the depolarization (solid arrow) evoked spontaneous firing with a takeoff potential of −56.2 mV. At site 2, despite the fact that the peak magnitude of subthreshold depolarization (encircled by dashed circle) was 8.5 mV larger, no action potential was triggered. Rather, following the end of the DAD-like event, the site was subsequently activated (dashed arrow) in the course of the propagating wave. Note that changes in [Ca2+]i followed those in Vm, which confirms that VPB was induced by opening of MSCs, rather than by [Ca2+]i preceding Vm.
Figure 5 shows induction of VPB and subsequent reentry in ischemia stage II (Movie III). The VPB originated from the endocardial BZ (arrows in 191-ms inset), traveled intramurally (193 and 195 ms) until part of the wavefront (encircled by rectangle in bottom 195-ms inset) broke onto the epicardium near the BZ (rectangle in 202-ms inset). The VPB propagated around the ischemic region, which now included a larger region of conduction block attributable to ischemia severity. Specifically, at 240 ms, 58.4% of tissue in the ischemic region was not excited, 80% more than that in stage I (compare 240-ms inset in Figure 5 to that in Figure 4A). The VPB then entered CIZ retrogradely from the neighboring normal tissue, resulting in figure-of-eight reentry on the epicardium of the LV (320 and 360 ms).
Figure 5.
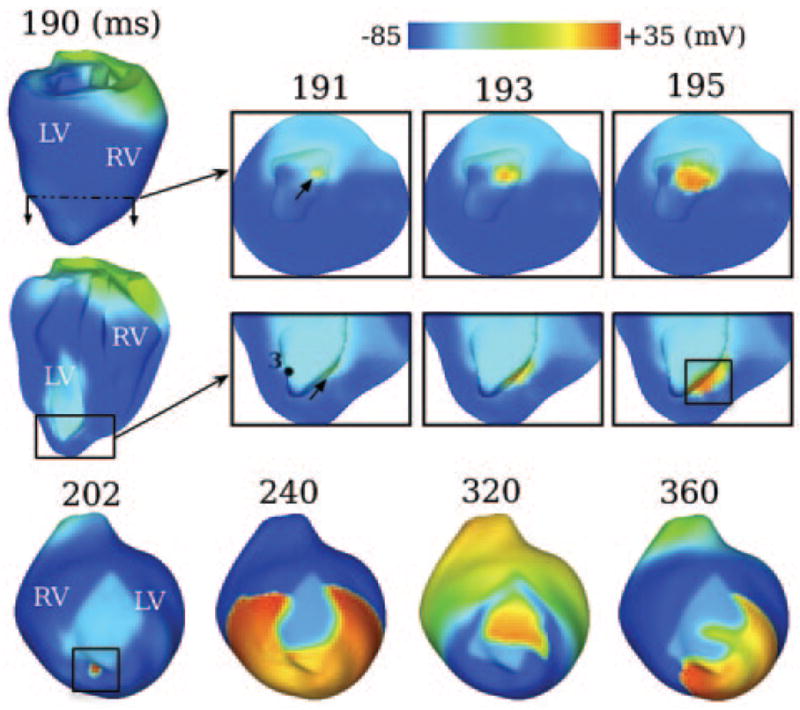
Evolution of mechanically induced VPB and subsequent figure-8-reentry for ischemia stage II. Other notations as in Figure 4.
In this stage, in contrast to stage I, there was no spontaneous firing in the region around site 3 (BZ, bottom 191-ms inset, Figure 5). Consequently, at 195 ms, there was no wavefront in the region encircled by the ellipse in the bottom 195-ms panel in Figure 4A. Traces of Vm, IMSC and [Ca2+]i at site 3 from both stages are presented in Figure 6. The transient mechanically induced depolarization (green arrow) resulted in spontaneous firing of this BZ cell in stage I but not in stage II. This demonstrates that the more advanced ischemic damage can inhibit the induction of mechanically induced spontaneous activations. Interestingly, the initial changes in Vm and IMSC were almost identical for both stages until the firing occurred in stage I. This result suggests that a small difference in the electrophysiology at the cellular level (from stage I to stage II) can be amplified through the alteration in the source-sink balance at the tissue level, and consequently yield a different outcome (compare Figures 4A to 5). Similar to Figure 4B, [Ca2+]i follows Vm.
Figure 6.
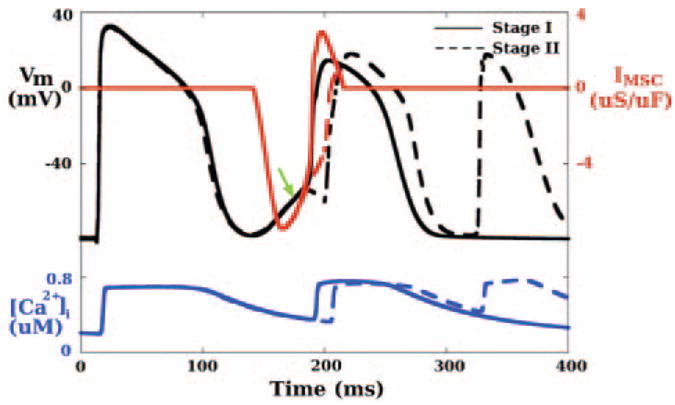
Traces of Vm (black), IMSC (red), and [Ca2+]i (blue) for ischemia stage I (solid lines) and stage II (dashed lines) at site 3 (BZ) marked in the bottom 191-ms panel in Figure 5. Green arrow indicates mechanically induced depolarization.
Electrophysiologically and Mechanically Induced Proarrhythmic Substrate
VPB activation maps for ischemia stages I and II are depicted in Figure 7A and 7B. The activation pattern in normal tissue was similar for these 2 stages. In the ischemic regions, conduction block (black lines) and then slow retrograde conduction took place. The length of the black line in stage II is almost double that in stage I, forcing the wavefront to travel longer distances before returning. Furthermore, CV within the ischemic region was only 21.0 cm/sec in stage II, much slower than that in stage I (35.6 cm/sec). Consequently, the maximum ΔAT (the largest difference in activation time between a ventricular location and its immediate neighbors, as defined in the Online Data Supplement) was 98 ms in stage II, 34 ms longer than that in stage I. Larger maximum ΔAT, and therefore larger temporal excitable gap, provides more time for recovery from the preceding activation (ie, the VPB) and thus increases the probability of reentry induction. This explains why reentry was induced in stage II and not in stage I. The location of the maximum ΔAT is marked with an asterisk in Figure 7B; it is the exit site of reentry in the 320-ms inset in Figure 5.
Figure 7.

Activation maps for ischemia stage I (A), ischemia stage II (B), model No_MSC (C), and model No_Ischemia (D) during VPB (see text for details). Snapshots of transmembrane potentials are also presented for models No_MSC and No_Ischemia, with time notations and color bars as in Figure 4. Black lines denote conduction block with ΔAT >20 ms. Asterisk in B indicates location with maximum ΔAT, which is the reentry exit site in 320-ms inset in Figure 5. E, Percentage of ventricular nodes in the ischemic region in each range of subthreshold depolarization for cases A through D. The level of subthreshold depolarization is determined as the maximum depolarization (relative to normal resting membrane potential of −84.6 mV) before local activation.
To dissect how electrophysiological factors (the ischemic changes incorporated in the model; see Online Table I) and mechanical factors (MSC recruitment) contribute to the generation of proarrhythmic substrate, 2 additional sets of simulations were executed. One was with ventricular model with all the electrophysiological changes of ischemia stage II, but without involvement of MSCs (ie, without MEF), and, thus, without mechanically induced depolarizations, this model is referred to as No_MSC. Because there would be no mechanically induced VPB in this case, external stimuli were applied at the exact same time and locations where the mechanically induced VPB originated in the full model (arrows in 191-ms inset in Figure 5). The other set of simulations was performed with a model that included MSCs as in ischemia stage II, ie, one that included the spatial distribution of mechanically induced depolarizations corresponding to this stage but without ischemia-induced electrophysiological changes; this model is referred to as No_Ischemia. The activation maps and Vm snapshots for these 2 models are presented in Figure 7C and 7D, respectively. In the No_MSC case (Movie IV), there was no conduction block in the ischemic region; CV within this region was 29.0 cm/sec, only 0.8 cm/sec slower than that in normal tissue (the 240-ms inset). In the No_Ischemia case (Movie V), conduction block (black line in Figure 7D) and slower CV (26.0 cm/sec) were observed within the region where ischemia would have existed (the 202-ms inset). The maximum ΔAT was 64 ms, which was insufficient for reentry to form, similarly to stage I. Note that in this case the appearance of VPB was 20 ms earlier than that in any of the full ischemia models (I or II), suggesting that electrophysiological changes during ischemia serve to delay the concomitant formation of mechanically induced VPBs.
The failure to induce reentry in the 2 additional models demonstrates that VPB cannot degrade into reentrant arrhythmia under the conditions of either electrophysiologically (No_MSC) or mechanically (No_Ischemia) -induced proarrhythmic substrate alone. As seen in the Vm trace from site 2, Figure 4B, both hyperkalemia-induced resting membrane depolarization and mechanically induced DAD-like events (enclosed by dashed circle) occurred before local activation (red arrow). If such depolarizations reach magnitude >20 mV, they greatly reduce the availability of fast sodium current, causing diminished membrane excitability. To further quantify and differentiate the proarrhythmic substrates caused by electrophysiological and mechanical factors, the maximum subthreshold depolarizations (relative to normal resting potential, −84.6 mV) at each location in the ischemic region for ischemia stages I and II as well as for the No_MSC and No_Ischemia cases were examined. Figure 7E presents the percentage of tissue within the outlines of the ischemic region experiencing levels of depolarization within ranges 2 to 10, 10 to 20, 20 to 30, 30 to 40, and 40 to 50 mV. The distribution of depolarization for stage I was close to that for stage II, with 59.5% of the ischemic region experiencing depolarization above 20 mV; this amount of tissue was 8.0% more in stage II. The distributions for the 2 other cases were quite distinct from each other. For the No_MSC case, hyperkalemia elevated the resting potential in the ischemic region, with a maximum increase of 15.6 mV in CIZ; as seen in Figure 7E, 81.5% of the ischemic region was depolarized by 10 to 20 mV, but no tissue experienced depolarization above 20 mV. This explains the lack of both conduction block and significant change in CV in this case (Figure 4C), because the level of depolarization was insufficient for significant reduction in availability of fast sodium current. On the other hand, for the No_Ischemia case, 62.0% of the tissue experienced depolarizations above 20 mV.
Based on this analysis, we conclude that in ischemia stages I and II, the electrophysiological factors (hyperkalemia) led to depolarization of the ischemic region of up to 15.6 mV only, whereas the mechanical factors (MSC activation) brought the depolarization above the critical value of 20 mV. These 2 contributions defined the arrhythmogenic substrate. Additionally, there was more tissue with depolarization above 20 mV in stage II than in stage I.
Discussion
This study investigated the genesis of mechanically induced ventricular ectopy and the mechanisms by which it degrades into spontaneous arrhythmia in acute regional ischemia. The main findings are (1) stretch of ischemic tissue by the surrounding normal tissue during contraction leads to increased strains and strain rates, causing mechanically induced depolarizations in the ischemic region, the magnitude of which increases from BZ to CIZ; (2) despite smaller mechanically induced depolarizations in BZ, mechanically induced VPBs originate from the ischemic border in the LV endocardium, then travel fully intramurally until emerging from the ischemic border on the epicardium; and (3) the mechanically induced DAD-like events contribute to the arrhythmogenic substrate by further decreasing the already-reduced by hyperkalemia local excitability, thus ultimately causing conduction block and slow retrograde conduction in the ischemic region, and resulting in reentry.
Electromechanical Model
The electromechanical model developed here serves as a unique approach to explore electromechanical interactions throughout the 3D ventricular volume not achievable by any other presently available technologies. In the past several years, remarkable progress has been made in modeling cardiac electromechanics.21–23 Limitations remained, however, with respect to representations of the complexity of heart geometry, active membrane behavior, calcium–force relation and MEF, all of which have been addressed in our multiscale model. This model features the newest myofilament model24 and bidomain representation of cardiac tissue; it is also the first to incorporate temporally and spatially varying strains, ie, dynamic MEF. Moreover, we incorporated physiologically accurate electrophysiological and mechanical changes in the ventricles with acute regional ischemia. This complex integrated model is a significant advancement over previous attempts to model electromechanical effects during ischemia25,26 and is thus capable of yielding insights into important aspects of electromechanical behavior observed experimentally, but which have remained mechanistically unclear, as elaborated in the following sections.
Mechanisms Underlying the Generation of Mechanically Induced VPB
In this study, VPB was induced as a result of local membrane depolarization following MSC activation. Because severely ischemic tissue loses its ability to contract, it becomes subjected to excessive stretch by the surrounding normal myocardium during contraction. Our results show that systolic distension of the ischemic region results in increased local systolic myofiber strain, with positive values reaching up to 0.5 during the contraction cycle. The maximum myofiber strain increases from BZ to CIZ, consistent with experimental findings.25 In contrast, in a recent modeling study26 only negative myofiber strains, ie, compression but not stretch, were obtained in the ischemic region. The improved physiological fidelity of our findings most likely arises from incorporation of physiologically accurate description of myofilament activation.
Location of VPB Origin
The VPB origin was always in LV endocardium in this study. Because faster stretch leads to larger depolarization, one would expect that VPB initiation site would be associated with the largest local strain rate. Indeed, the global maximum of the local maximum strain rates occurred endocardially in LV (Figure 2C). To our knowledge, no experimental data are available regarding the strain or strain rate throughout the myocardial wall in either normal or ischemic ventricles (rabbit or other species). Nonetheless, an experimental study on dogs found that in normal hearts, the inner half of the myocardial wall experienced larger systolic thickening than the outer,27 suggesting that the endocardium experienced larger stretch than the epicardium. A simulation study of passive dilatation in normal ventricles21 also reported a larger strain in the endocardium.
In this study, we incorporated both mechano-sensitive nonspecific cation current (Ins_MSC) and potassium current (Ik_MSC). We took into account the transmural heterogeneity of Ik_MSC by defining its current density to be four times larger in the endo- than epicardium.28 It has been hypothesized that because of this heterogeneity in Ik_MSC, VPB may not necessarily originate endocardially although the strain there is the highest; the reason suggested was that because Ik_MSC is a repolarizing current at negative membrane potentials, its large magnitude at the endocardium might counteract the depolarizing Ins_MSC there.29 In the present study, however, VPB originated endocardially, indicating that the effect of the strain rate there surpassed that of the current density for Ik_MSC.
Although CIZ experiences larger stretch and strain rate (Figures 2C and 3A), and therefore larger maximum depolarization (Figure 3B) than BZ and NZ, VPB originated from the ischemic border instead of CIZ (Figures 4 and 5). This is explained by our finding that because of their reduced excitability, CIZ cells require larger excitation current for mechanically induced spontaneous activation.30
The quantitative relationship between strain and IMSC is not well understood. In this study, IMSC magnitude was assumed linearly related to local strain rate, based on experimental finding that stretch depolarizes the cell membrane in a speed-dependent manner.10,31,32 This is different from previous studies where MSC activation was assumed to depend directly on local strain.21 Statistical analysis of the distribution of strain and strain rate in our model (Figure 3A) showed that regions with larger strains were associated with larger strain rates as well. Therefore, our findings regarding the location of VPBs would remain valid if MSC conductances were assumed depending on strains instead of strain rates.
For both ischemia stages, VPBs propagated fully intramurally before making epicardial breakthrough. The specific breakthrough sites were always close to the ischemic border. This is consistent with recordings on the epicardium, where the earliest activation occurred around the ischemic border.3,16,18 Note that although mechanically induced ectopic beat was induced in both ischemic stages here, an ectopic beat would not necessarily occur in severe ischemic episodes because more advanced ischemia does not necessarily result in larger strain/strain rate and therefore larger inducibility of ectopic beats.
Electrophysiologically and Mechanically Induced Proarrhythmic Substrate
In stage I, reentry was not induced. In stage II, however, reentry was induced in the presence of sufficient temporal excitable gap (maximum ΔAT=98 ms, 34 ms larger than that in stage I) as a result of a longer line of conduction block and slower retrograde conduction. This indicates that the induction of arrhythmias during acute regional ischemia is dependent on ischemic severity.
The proarrhythmic substrate during ischemia is the result of the combined effects of electrophysiological and mechanical factors. Whereas ischemia-induced electrophysiological changes alone resulted in characteristic resting depolarization, decreased action potential amplitude and shortened action potential duration, they only led to a slightly slower conduction during VPB propagation (Figure 7C). On the other hand, MSC activation alone resulted in spatially and temporally varying DAD-like events, which reduced local excitability and led to conduction block and subsequent slower retrograde conduction (Figure 7D). In both cases, however, no reentry was formed. This suggests that electrophysiologically and mechanically induced substrates combine to result in degradation of VPBs into ventricular arrhythmias under the conditions investigated here.
Further analysis showed that in stage II, hyperkalemia depolarized the membrane up to 15.6 mV only, at which level availability of fast sodium current is not greatly reduced. MSC activation resulted in further membrane depolarization to a level above 20 mV (Figure 7E) and therefore potentiated the formation of reentry by further reducing tissue excitability.
Study Implications
Experimental studies have shown that VPBs responsible for initiation of ventricular tachycardia during acute ischemia were mostly of focal origin.3,16,18 It has been suggested that injury currents between Purkinje fibers and ischemic tissue can lead to ectopic activation emanating from Purkinje fibers.3 An alternative mechanism for focal excitation, a mechanically induced disturbance, has been suggested,12 supported by a recent study showing that spontaneous arrhythmias occurred more often in the in situ heart than in the isolated nonbeating heart during acute regional ischemia.16 However, whether and how regional ischemia-induced mechanical dysfunction can induce VPB and facilitate its degradation into reentrant arrhythmias had not been yet established. Our study filled this void by providing the first direct evidence that mechanically induced membrane depolarizations and their spatial distribution within the ischemic region are possible mechanism by which mechanical activity contributes to both the origin of and substrate for spontaneous arrhythmias. Knowledge regarding the locations of VPB origin and the mechanisms by which VPBs degrade into reentrant arrhythmias could be critical in devising strategies for suppressing VPBs and reducing the propensity toward degradation into ventricular tachycardia/fibrillation. Our study suggests that MSCs could be potential therapeutic target for new antiarrhythmic drugs.
Limitations
Despite advances in the understanding of MEF, it remains unclear how the magnitude of IMSC is affected by acute ischemia, although whole heart studies have suggested that MEF varies with time during acute ischemia.33 In the absence of sufficient experimental data, MSC activation was not assumed to vary with ischemic severity (stage I versus II). In addition, because of the complex nature of the 3D electromechanical model, we did not incorporate possible mechanically induced changes in tissue conductivity, as done in a recent study of one-dimensional fiber.23 The figure-of-eight reentry obtained in our study was not sustained, which is understandable because only one isovolumic contraction phase of the cardiac cycle was implemented. A sustained reentry and more complicated activation patterns are expected if the simulation would involve multiple cardiac cycles. The activation pattern may be altered by transmural heterogeneity in cell types or in responses to ischemia, which were not incorporated here. The activation pattern may be further altered by Purkinje activity, which was not modeled here because of the following reasons: (1) lack of contemporary Purkinje model to which MSC activation can be added; (2) lack of means to validate the Purkinje strain distribution in the intact heart; (3) lack of experimental data on Purkinje mechano-sensitivity for development of the Purkinje MSC current model; and (4) controversy regarding the effects of Purkinje network on conduction patterns, once an activation has been initiated in the ventricles.34
In this study, the ventricles were paced at a fixed basic cycle length; further investigation is needed to address the potential pacing rate dependence of the observed effects. The ischemic region was modeled with lateral BZs only, without subepi- and subendocardial BZs, because variations in thicknesses of the latter throughout the ischemic region have not been fully characterized.35 Incorporation of subepi- and subendocardial BZs is not, however, expected to alter our findings. As a matter of fact, presence of additional BZs would increase the likelihood of VPB induction. Finally, the size of the ischemic region here was only 10% of total ventricular tissue. Ischemic region size can vary depending on factors such as species and occlusion site. Further studies are needed to assess the effects of the size of ischemic insult on the induction of mechanically induced VPBs.
Supplementary Material
Supplemental Table 1. Model parameters in normal zone (NZ) and central ischemic zone (CIZ) for two ischemia stages, I and II, including extracellular potassium concentration ([K+]o), intracellular ATP and ADP concentrations ([ATP]i and [ADP]i), and scaling factors of the maximum conductances for fast sodium (INa) and L-type calcium (ICaL) currents.
Supplemental Movie I. The distribution of local strain in the fiber direction (Eff) in the normal and the ischemic (stage I) ventricles during isovolumic contraction.
Supplemental Movie II. The activation sequence for ischemia stage I from the onset of the last pacing stimulus.
Supplemental Movie III. The activation sequence for ischemia stage II from the onset of the last pacing stimulus.
Supplemental Movie IV. The activation sequence for No_MSC case from the onset of the last pacing stimulus.
Supplemental Movie V. The activation sequence for No_Ischemia case from the onset of the last pacing stimulus.
Acknowledgments
Sources of Funding
Supported by NIH grants R01-HL082729 and R01-HL067322 and National Science Foundation award CBET-0933029 (to N.T.) and an American Heart Association Postdoctoral Fellowship (to V.G.).
Non-standard Abbreviations and Acronyms
- BZ
border zone
- CIZ
central ischemic zone
- CV
conduction velocity
- DAD
delayed afterdepolarization
- LV
left ventricle
- MEF
mechanoelectrical feedback
- MSC
mechanosensitive channel
- NZ
normal zone
- VPB
ventricular premature beat
Footnotes
This manuscript was sent to Michael Rosen, Consulting Editor, for review by expert referees, editorial decision, and final disposition.
Disclosures
None.
References
- 1.Lloyd-Jones D, Adams R, Carnethon M, De Simone G, Ferguson TB, Flegal K, Ford E, Furie K, Go A, Greenlund K, Haase N, Hailpern S, Ho M, Howard V, Kissela B, Kittner S, Lackland D, Lisabeth L, Marelli A, McDermott M, Meigs J, Mozaffarian D, Nichol G, O’Donnell C, Roger V, Rosamond W, Sacco R, Sorlie P, Stafford R, Steinberger J, Thom T, Wasserthiel-Smoller S, Wong N, Wylie-Rosett J, Hong Y. Heart disease and stroke statistics–2009 update. A report from the American Heart Association Statistics Committee and Stroke Statistics Subcommittee. Circulation. 2009;119:e21–e181. doi: 10.1161/CIRCULATIONAHA.108.191261. [DOI] [PubMed] [Google Scholar]
- 2.Myerburg RJ, Interian A, Jr, Mitrani RM, Kessler KM, Castellanos A. Frequency of sudden cardiac death and profiles of risk. Am J Cardiol. 1997;80:10F–19F. doi: 10.1016/s0002-9149(97)00477-3. [DOI] [PubMed] [Google Scholar]
- 3.Janse MJ, van Capelle FJ, Morsink H, Kleber AG, Wilms-Schopman F, Cardinal R, d’Alnoncourt CN, Durrer D. Flow of “injury” current and patterns of excitation during early ventricular arrhythmias in acute regional myocardial ischemia in isolated porcine and canine hearts. Evidence for two different arrhythmogenic mechanisms. Circ Res. 1980;47:151–165. doi: 10.1161/01.res.47.2.151. [DOI] [PubMed] [Google Scholar]
- 4.Pogwizd SM, Corr PB. Reentrant and nonreentrant mechanisms contribute to arrhythmogenesis during early myocardial ischemia: results using three-dimensional mapping. Circ Res. 1987;61:352–371. doi: 10.1161/01.res.61.3.352. [DOI] [PubMed] [Google Scholar]
- 5.de Groot JR, Wilms-Schopman FJ, Opthof T, Remme CA, Coronel R. Late ventricular arrhythmias during acute regional ischemia in the isolated blood perfused pig heart. Role of electrical cellular coupling. Cardiovasc Res. 2001;50:362–372. doi: 10.1016/s0008-6363(01)00222-x. [DOI] [PubMed] [Google Scholar]
- 6.Califf RM, Burks JM, Behar VS, Margolis JR, Wagner GS. Relationships among ventricular arrhythmias, coronary artery disease, and angiographic and electrocardiographic indicators of myocardial fibrosis. Circulation. 1978;57:725–732. doi: 10.1161/01.cir.57.4.725. [DOI] [PubMed] [Google Scholar]
- 7.Siogas K, Pappas S, Graekas G, Goudevenos J, Liapi G, Sideris DA. Segmental wall motion abnormalities alter vulnerability to ventricular ectopic beats associated with acute increases in aortic pressure in patients with underlying coronary artery disease. Heart. 1998;79:268–273. doi: 10.1136/hrt.79.3.268. [DOI] [PMC free article] [PubMed] [Google Scholar]
- 8.Hansen DE, Craig CS, Hondeghem LM. Stretch-induced arrhythmias in the isolated canine ventricle. Evidence for the importance of mechano-electrical feedback. Circulation. 1990;81:1094–1105. doi: 10.1161/01.cir.81.3.1094. [DOI] [PubMed] [Google Scholar]
- 9.Stacy GP, Jr, Jobe RL, Taylor LK, Hansen DE. Stretch-induced depolarizations as a trigger of arrhythmias in isolated canine left ventricles. Am J Physiol Heart Circ Physiol. 1992;263:H613–H621. doi: 10.1152/ajpheart.1992.263.2.H613. [DOI] [PubMed] [Google Scholar]
- 10.Franz MR, Cima R, Wang D, Profitt D, Kurz R. Electrophysiological effects of myocardial stretch and mechanical determinants of stretch-activated arrhythmias. Circulation. 1992;86:968–978. doi: 10.1161/01.cir.86.3.968. [DOI] [PubMed] [Google Scholar]
- 11.Fu L, Cao JX, Xie RS, Li J, Han Y, Zhu LQ, Dai YN. The effect of streptomycin on stretch-induced electrophysiological changes of isolated acute myocardial infarcted hearts in rats. Europace. 2007;9:578–584. doi: 10.1093/europace/eum132. [DOI] [PubMed] [Google Scholar]
- 12.Zabel M, Koller BS, Sachs F, Franz MR. Stretch-induced voltage changes in the isolated beating heart: importance of the timing of stretch and implications for stretch-activated ion channels. Cardiovasc Res. 1996;32:120–130. [PubMed] [Google Scholar]
- 13.Eckardt L, Kirchhof P, Monnig G, Breithardt G, Borggrefe M, Haverkamp W. Modification of stretch-induced shortening of repolarization by streptomycin in the isolated rabbit heart. J Cardiovasc Pharmacol. 2000;36:711–721. doi: 10.1097/00005344-200012000-00005. [DOI] [PubMed] [Google Scholar]
- 14.Craelius W. Stretch-activation of rat cardiac myocytes. Exp Physiol. 1993;78:411–423. doi: 10.1113/expphysiol.1993.sp003695. [DOI] [PubMed] [Google Scholar]
- 15.Kamkin A, Kiseleva I, Isenberg G. Stretch-activated currents in ventricular myocytes: amplitude and arrhythmogenic effects increase with hypertrophy. Cardiovasc Res. 2000;48:409–420. doi: 10.1016/s0008-6363(00)00208-x. [DOI] [PubMed] [Google Scholar]
- 16.Coronel R, Wilms-Schopman FJ, deGroot JR. Origin of ischemia-induced phase 1b ventricular arrhythmias in pig hearts. J Am Coll Cardiol. 2002;39:166–176. doi: 10.1016/s0735-1097(01)01686-2. [DOI] [PubMed] [Google Scholar]
- 17.Barrabes JA, Garcia-Dorado D, Agullo L, Rodriguez-Sinovas A, Padilla F, Trobo L, Soler-Soler J. Intracoronary infusion of Gd3+ into ischemic region does not suppress phase Ib ventricular arrhythmias after coronary occlusion in swine. Am J Physiol Heart Circ Physiol. 2006;290:H2344–H2350. doi: 10.1152/ajpheart.00917.2005. [DOI] [PubMed] [Google Scholar]
- 18.Zhang S, Skinner JL, Sims AL, Rollins DL, Walcott GP, Smith WM, Ideker RE. Three-dimensional mapping of spontaneous ventricular arrhythmias in a canine thrombotic coronary occlusion model. J Cardiovasc Electrophysiol. 2000;11:762–772. doi: 10.1111/j.1540-8167.2000.tb00048.x. [DOI] [PubMed] [Google Scholar]
- 19.Coronel R, Fiolet JW, Wilms-Schopman FJ, Schaapherder AF, Johnson TA, Gettes LS, Janse MJ. Distribution of extracellular potassium and its relation to electrophysiologic changes during acute myocardial ischemia in the isolated perfused porcine heart. Circulation. 1988;77:1125–1138. doi: 10.1161/01.cir.77.5.1125. [DOI] [PubMed] [Google Scholar]
- 20.Reiter MJ, Landers M, Zetelaki Z, Kirchhof CJ, Allessie MA. Electrophysiological effects of acute dilatation in the isolated rabbit heart: cycle length-dependent effects on ventricular refractoriness and conduction velocity. Circulation. 1997;96:4050–4056. doi: 10.1161/01.cir.96.11.4050. [DOI] [PubMed] [Google Scholar]
- 21.Vetter FJ, McCulloch AD. Mechanoelectric feedback in a model of the passively inflated left ventricle. Ann Biomed Eng. 2001;29:414–426. doi: 10.1114/1.1366670. [DOI] [PubMed] [Google Scholar]
- 22.Kuijpers NH, ten Eikelder HM, Bovendeerd PH, Verheule S, Arts T, Hilbers PA. Mechanoelectric feedback leads to conduction slowing and block in acutely dilated atria: a modeling study of cardiac electromechanics. Am J Physiol Heart Circ Physiol. 2007;292:H2832–2853. doi: 10.1152/ajpheart.00923.2006. [DOI] [PubMed] [Google Scholar]
- 23.Panfilov AV, Keldermann RH, Nash MP. Drift and breakup of spiral waves in reaction-diffusion-mechanics systems. Proc Natl Acad Sci U S A. 2007;104:7922–7926. doi: 10.1073/pnas.0701895104. [DOI] [PMC free article] [PubMed] [Google Scholar]
- 24.Rice JJ, Wang F, Bers DM, de Tombe PP. Approximate model of cooperative activation and crossbridge cycling in cardiac muscle using ordinary differential equations. Biophys J. 2008;95:2368–2390. doi: 10.1529/biophysj.107.119487. [DOI] [PMC free article] [PubMed] [Google Scholar]
- 25.Mazhari R, Omens JH, Covell JW, McCulloch AD. Structural basis of regional dysfunction in acutely ischemic myocardium. Cardiovasc Res. 2000;47:284–293. doi: 10.1016/s0008-6363(00)00089-4. [DOI] [PubMed] [Google Scholar]
- 26.Kerckhoffs RC, Neal ML, Gu Q, Bassingthwaighte JB, Omens JH, McCulloch AD. Coupling of a 3D finite element model of cardiac ventricular mechanics to lumped systems models of the systemic and pulmonic circulation. Ann Biomed Eng. 2007;35:1–18. doi: 10.1007/s10439-006-9212-7. [DOI] [PMC free article] [PubMed] [Google Scholar]
- 27.Gallagher K, Osakada G, Matsuzaki M, Miller M, Kemper W, Ross JJ. Nonuniformity of inner and outer systolic wall thickening in conscious dogs. Am J Physiol Heart Circ Physiol. 1985;249:H241–H248. doi: 10.1152/ajpheart.1985.249.2.H241. [DOI] [PubMed] [Google Scholar]
- 28.Tan JH, Liu W, Saint DA. Differential expression of the mechanosensitive potassium channel TREK-1 in epicardial and endocardial myocytes in rat ventricle. Exp Physiol. 2004;89:237–242. doi: 10.1113/expphysiol.2003.027052. [DOI] [PubMed] [Google Scholar]
- 29.Healy SN, McCulloch AD. An ionic model of stretch-activated and stretch-modulated currents in rabbit ventricular myocytes. Europace. 2005;7(suppl 2):128–134. doi: 10.1016/j.eupc.2005.03.019. [DOI] [PubMed] [Google Scholar]
- 30.Jie X, Rodriguez B, Trayanova N. The ischemic heart: what causes ectopic beating? Conf Proc IEEE Eng Med Biol Soc. 2005;7:7194–7197. doi: 10.1109/IEMBS.2005.1616168. [DOI] [PubMed] [Google Scholar]
- 31.Sachs F. Biophysics of mechanoreception. Membr Biochem. 1986;6:173–195. doi: 10.3109/09687688609065448. [DOI] [PubMed] [Google Scholar]
- 32.Nishimura S, Kawai Y, Nakajima T, Hosoya Y, Fujita H, Katoh M, Yamashita H, Nagai R, Sugiura S. Membrane potential of rat ventricular myocytes responds to axial stretch in phase, amplitude and speed-dependent manners. Cardiovasc Res. 2006;72:403–411. doi: 10.1016/j.cardiores.2006.08.011. [DOI] [PubMed] [Google Scholar]
- 33.Horner SM, Lab MJ, Murphy CF, Dick DJ, Zhou B, Harrison FG. Mechanically induced changes in action potential duration and left ventricular segment length in acute regional ischaemia in the in situ porcine heart. Cardiovasc Res. 1994;28:528–534. doi: 10.1093/cvr/28.4.528. [DOI] [PubMed] [Google Scholar]
- 34.Wyman BT, Hunter WC, Prinzen FW, McVeigh ER. Mapping propagation of mechanical activation in the paced heart with MRI tagging. Am J Physiol Heart Circ Physiol. 1999;276:H881–H891. doi: 10.1152/ajpheart.1999.276.3.H881. [DOI] [PubMed] [Google Scholar]
- 35.Wilensky RL, Tranum-Jensen J, Coronel R, Wilde AA, Fiolet JW, Janse MJ. The subendocardial border zone during acute ischemia of the rabbit heart: an electrophysiologic, metabolic, and morphologic correlative study. Circulation. 1986;74:1137–1146. doi: 10.1161/01.cir.74.5.1137. [DOI] [PubMed] [Google Scholar]
Associated Data
This section collects any data citations, data availability statements, or supplementary materials included in this article.
Supplementary Materials
Supplemental Table 1. Model parameters in normal zone (NZ) and central ischemic zone (CIZ) for two ischemia stages, I and II, including extracellular potassium concentration ([K+]o), intracellular ATP and ADP concentrations ([ATP]i and [ADP]i), and scaling factors of the maximum conductances for fast sodium (INa) and L-type calcium (ICaL) currents.
Supplemental Movie I. The distribution of local strain in the fiber direction (Eff) in the normal and the ischemic (stage I) ventricles during isovolumic contraction.
Supplemental Movie II. The activation sequence for ischemia stage I from the onset of the last pacing stimulus.
Supplemental Movie III. The activation sequence for ischemia stage II from the onset of the last pacing stimulus.
Supplemental Movie IV. The activation sequence for No_MSC case from the onset of the last pacing stimulus.
Supplemental Movie V. The activation sequence for No_Ischemia case from the onset of the last pacing stimulus.