

Summary
Rare cells can be difficult to analyze because they either occur in low numbers or coexist with a more abundant cell type, yet their detection is crucial for diagnosing disease and maintaining human health. In this tutorial review, we introduce the concept of microfluidic stochastic confinement for use in detection and analysis of rare cells. Stochastic confinement provides two advantages: 1) it separates rare single cells from the bulk mixture and 2) it allows signals to locally accumulate to a higher concentration around a single cell than in the bulk mixture. Microfluidics is an attractive method for implementing stochastic confinement because it provides simple handling of small volumes. We present technologies for microfluidic stochastic confinement that utilize both wells and droplets for the detection and analysis of single cells. We address how these microfluidic technologies have be used to observe new behavior, increase speed of detection, and enhance cultivation of rare cells. We discuss potential applications of microfluidic stochastic confinement to fields such as human diagnostics and environmental testing.
Introduction
Rare live cells are difficult to detect and analyze. Rare cells can be defined as either cells that are at low number in their natural environment or cells that coexist with high numbers of other cell types. Although these cells are not abundant, their identification and analysis can be important. For example, analysis of circulating tumor cells, fetal cells in maternal blood and pathogenic microorganisms are crucial for diagnosing disease and maintaining human health. A significant fraction of cell-cell communication and interaction relies on the secretion or the depletion of diffusible molecules,1 which can then be used to detect, analyze, and identify cells of interest.
1. Challenges of Isolating Rare Single Cells and Controlling Associated Diffusible Signals
There are two main bottlenecks in detection and analysis of rare single cells in large volumes. First, cellular activity cannot be observed using small numbers of cells because secreted molecules diffuse away from each cell and become diluted in the culture media. Either the amount of signal present in the media must be increased or the diffusion of signals away from cells must be prevented to provide a detectable amount of signal around the cell. Second, because rare cells often coexist with other cell types, any overlapping or inhibitory signals from these other cells may overwhelm the signal from a rare cell. Thus, rare cells must be isolated from the mixture to prevent signal overlap or inhibition.
1a. Traditional Methods Overcome These Challenges through Sequential Isolation and Growth to High Density
To solve these bottlenecks, the traditional method is to first isolate and then enrich the cell to a high enough density to provide significant signal. In cell culture, density is defined as the number of cells per unit volume. High density cultures, which generally consist of a large number of clonal cells, are typically required for rapid growth, activation of behavior, and detection of secreted signals. High density cultures are used for studying signaling between cells, growing new cells, isolating cells, analyzing behavior of cells, and detecting cells. The approach of isolating cells by methods such as flow cytometry, followed by enrichment, while effective, has two potential shortcomings. First, this approach takes time, for example Mycobacterium tuberculosis requires three to four weeks cultivation for the culture to reach high density or for the cells to accumulate sufficient amounts of signal for detection. Second, analysis is often done on the population as a whole, giving an average behavior and missing potentially important heterogeneity in behavior of individual cells.
1b. Confinement Overcomes These Challenges by Simultaneous Isolation and Establishment of a High Density Environment
An alternative method for reaching high density of cells is to take one or a few cells and confine them in a small volume. Confinement in small volumes has been known and used for over 50 years to study a variety of cell types,2-4 including bacteria, plant cells, and yeast, as well as to study enzymatic activity5 (Figure 1). Here, we will not attempt an exhaustive coverage of this area over the last 50 years. We will instead concentrate on the most recent results in the area of microfluidics.
Figure 1.

Small volumes have been used for confinement for over 50 years. Confined cells remain viable and can be used for assays. (A) Baker's yeast cells solubilized in isopropylpalmitat by using water and the surfactant Tween (10%) remained viable for 10 days.3 (Caption and figure reprinted from ref. 3, copyright © 1989, with permission from Elsevier) (B) A microphotograph of dispersed droplets of a fluorogenic substrate,6-hydroxyfluoran-β-D-galactopyranoside in silicone oil. The presence of a single p-D-galactosidase molecule in a droplet led to production of the fluorescent dye resulting in green fluorescence, which appears as solid white circles in the photograph, indicated by white arrows.5 (Caption and figure reprinted with permission from ref. 5. Copyright © 1961 Borris Rotman.).
1c. Stochastic Confinement using Microfluidics: Simple and Controlled Handling of Small Volumes
Using conventional tools, small volumes of liquid are difficult to work with. An attractive method for confining cells is to separate the whole sample into many small volumes such that the number of the small volumes is larger than the number of cells – we call this process “stochastic confinement”.6 Stochastic confinement of cells into small volumes provides two advantages: it separates single cells from the bulk mixture (Figure 2A) and confines the cells leading to an increase in the concentration and accumulation of signals around a single cell (Figure 2B).
Figure 2.
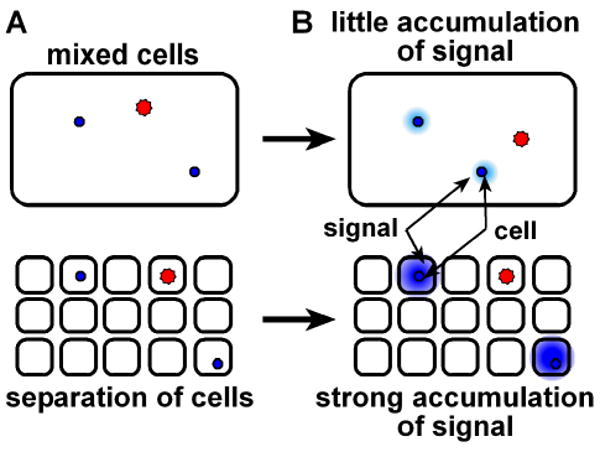
In a mixed culture stochastic confinement has two consequences: (A) It separates individual cell types (bottom) from the bulk mixture (top). (B) It enables signal accumulation (bottom) by limiting diffusion of secreted molecules away from a cell as well as preventing interference by signals from other cells.
Microfluidics is an ideal method for the creation of small volumes for stochastic confinement. Microfluidic devices control fluid flow on the nanoliter to femtoliter scale so that single cells can be separated from the bulk solution and contained in a small volume of fluid. Microfluidics offers a reproducible and reliable method to generate and manipulate small volumes,7 separate cells from a bulk mixture, concentrate diffusible signals, and create a high density environment.
There are two methods for creating small volumes of aqueous solution using microfluidics. Both provide the ability to perform high throughput experiments in an inexpensive device with a small quantity of reagents. First, microwells, fabricated by photolithography, can be used to form large arrays of small volumes in parallel. Using microfabricated wells to manipulate individual cells and their environments is a developing technology.7 Second, small channels, coupled with the careful control of interfacial properties, can be used to create droplets suspended in an immiscible carrier fluid, which are referred to as plugs.8 At attractive feature of droplets and plugs is the ability to control the liquid-liquid interfaces by incorporating surfactants into either the aqueous or oil phases. Fluorinated oils and surfactants provide chemistry orthogonal to the hydrophobic and hydrophilic interactions in standard biomolecules, and can be used both to create interfaces that prevent non-specific adsorption9 and provide specific binding. 10 Clever surface chemistries can be used to control coalescence of droplets.11 Microfluidic techniques for encapsulating and culturing cells in droplets are well established.6, 12-24 Furthermore, this approach can be used for whole organisms, such as Danio rerio25 and Caenorhabditis elegans.13
In the simplest case of stochastic confinement, the behavior of confined cells is the same as the behavior of cells in bulk culture. Confinement will not influence cellular processes that have linear kinetics26 because the rate of production of a soluble signal from a cell remains constant, i.e. there is no feedback. In this case, confinement increases the speed of accumulation of the signal but does not change the intrinsic properties of the cellular process. This limiting case should be rare because cells produce multiple diffusible molecules and change their environment simply by depleting nutrients and secreting waste; both effects produce feedback and affect behavior in a nonlinear fashion. Confinement may not appear to play a role in many cases because these effects are not taken into consideration in experiments or are below detection limits.
At the opposite extreme is the case of stochastic confinement of cells when the cellular processes have strongly nonlinear kinetics such as a threshold response. In this case, the cell produces a soluble signal that strongly feeds back on itself or on other signals produced by the cell. Spatial effects, including confinement, decrease the diffusional loss of soluble signals and thereby maintain a high local concentration around a cell.26 A dramatic example of spatial confinement affecting behavior was reported for bacteria in mazes.27 In a confined volume, attractant molecules secreted by cells increase in concentration, causing cells to migrate. As more cells accumulated, the signal became stronger, causing the majority of cells to migrate and eventually form a quorum. In general, one expects confinement to impact all cellular processes with nonlinear kinetics, such as quorum sensing,23 quorum acting,28 and blood clotting.29
In this review, we discuss how using microfluidic stochastic confinement to isolate live single cells in small volumes modifies cellular activity by controlling the diffusion of soluble signals released by the cells. Specifically, we focus on how separation and confinement of single cells can 1) induce behaviors driven by density-dependent pathways, 2) trap soluble signals to increase speed of detection of normal cellular activities, and 3) enhance cultivation of hard-to-grow species. Other topics using similar microfluidic technologies, such as manipulation and analysis of single cells on microfabricated chips and cell libraries in microdroplets, have been reviewed elsewhere30-34 and are outside the scope of this more focused review.
2. Benefits of Stochastic Confinement: Observation of New Behaviors
2a. High Density Behavior from Single Cells
Confinement can control the activation of pathways in single cells by preventing loss of soluble signals by diffusion. For example, bacteria can sense cell density by releasing diffusible signals in a mechanism called quorum sensing (QS). At a low concentration of bacteria, the signal diffuses away and does not accumulate, and bacteria do not detect a ‘quorum’. As bacteria are brought together to a higher concentration, the diffusible signal accumulates above a threshold concentration (quorum) and is sensed by the bacteria. QS is a nonlinear system with a threshold response and as such should be strongly dependent on the spatial environment.
QS is traditionally thought to be a counting mechanism that allows coordination of the behavior of a population. When pathogenic bacteria reach high density in a host, they typically activate QS and change their gene expression to produce virulence factors. The purpose for this behavior is to delay activation of QS and virulence factor production until there are enough bacteria to successfully overcome the host's immune system. An alternative hypothesis defines QS not as a population census mechanism, but rather as a cell-autonomous mechanism for diffusion or efficiency sensing.35, 36 According to this hypothesis, bacteria use small diffusible molecules to test the spatial environment in which they find themselves and determine the efficiency of activation of particular gene pathways. Microfluidic experiments indicated that in contrast to the prevailing view of QS as a social behavior, a single bacterial cell activated QS in the absence of host factors, if the cell was confined in a small enough volume (Figure 3).23 This result supports the possibility of using QS mechanisms in a cell-autonomous fashion and demonstrates the ability of spatial confinement to induce phenotypic change at the cellular level.
Figure 3.
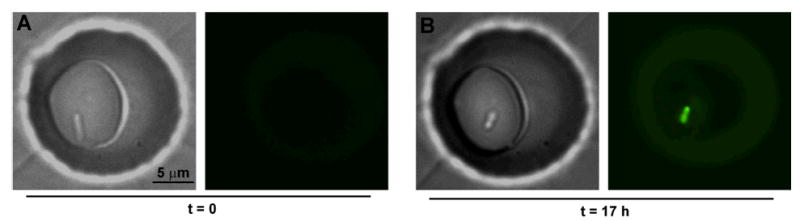
A single Pseudomonas aeruginosa bacterium, originating from a low-density culture, initiated quorum sensing (QS) after confinement for 17 h in a droplet ∼200 fL in volume. Bright-field (left) and fluorescent (right) images show the bacterium at 0 h (A) and 17 h (B). Fluorescent images show activation of QS after 17 h, as visualized by the expression of fluorescent reporter for the QS-controlled gene lasB.23 (Caption and figure from ref. 23. Copyright © 2009 WILEY-VCH Verlag GmbH & Co. KGaA. Reproduced with permission.)
2b. Heterogeneity in Induced Behaviors of Single Cells
Confinement also reveals heterogeneity in induced behaviors of single cells. For behaviors that are associated with high density or with a soluble molecule that can quickly diffuse away, heterogeneity cannot be observed unless the cells are confined. QS in a clonal laboratory population of cells is typically thought to be homogenous (Figure 4 D-E). In small volumes, however, heterogeneity was observed in the initiation of QS both between wells and among the cells within a well (Figure 4 A-C, F). This heterogeneity occurred when starting with multiple cells or a single cell, was independent of growth rate, and was not the result of plasmid loss. The behavior of small groups of cells may be more random than large groups due to stochastic effects that arise from small sample sizes.23
Figure 4.

Small populations of clonal cells initiated quorum sensing (QS) upon confinement, and did so with marked variability. (A–C) Three adjacent droplets (ca. 100 fL), each containing a small population of cells at time zero, show variability in initiation of QS after 8 h. White arrows point to cells that did not initiate QS; green arrows point to cells that initiated QS. (D) Bright field (left) and fluorescent (center) pictures of a Pseudomonas aeruginosa QS reporter strain growing in the bulk cell culture located at the outlet of a microfluidic device demonstrated that cells were more homogeneous in bulk cultures containing large numbers of cells than in droplets containing small groups of confined cells. (E) Cells in a larger droplet (ca. 20 pL) grew to a population of hundreds of cells and showed more homogeneous expression of QS, as visualized by the fluorescence reporter. Inside the red dashed boxes, cell counts were 109 total cells (from bright field, left), and 98 cells that initiated QS (from GFP, right). (F) Initiation of QS in droplets, loaded at time zero with 1 to 14 cells, was measured after 10 h, demonstrating increased variability in initiation of QS within small groups of cells. A well was scored as “with QS” if at least one bacterium in the well was fluorescent. Inoculation No. is the initial number of cells; the bar for >8 represents groups of 9, 10, and 14 cells at t=0. Numbers above bars represent the total number of wells N for that inoculation number.23 (Caption and figure from ref. 23. Copyright © 2009 WILEY-VCH Verlag GmbH & Co. KGaA. Reproduced with permission.)
Heterogeneity has also been observed in the metabolism of single cells confined in small volumes. A microwell system with a mechanical lid was developed to observe oxygen consumption from single cells (Figure 5). The microwells were coated with a an oxygen sensitive platinum phosphor sensor, and single cells were confined in picoliter volumes.37, 38 Measurements of oxygen consumption from single cells revealed heterogeneity in constitutive functions of cells.
Figure 5.
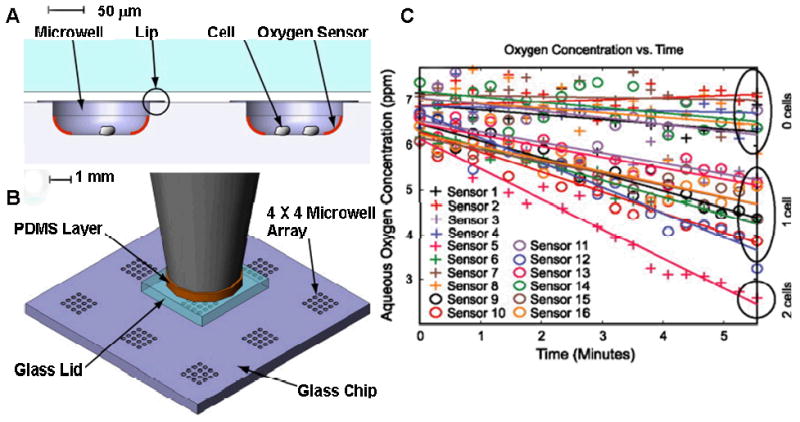
Microwells for measuring oxygen consumption rate (OCR) of cells. (A) The cells residing in the microwells with the oxygen sensor were diffusionally sealed from the external surroundings when the glass lid was pushed down onto the top of the microwell array. A phosphorescent oxygen sensor enabled monitoring of the oxygen concentration inside the microwell as the cell consumed oxygen. (B) Each glass chip contained nine 4×4 microwell arrays, providing nine different areas for potential experiments. Each array was sized so that all 16 microwells were within the field of view using a 10× microscope objective, and all 16 locations could be investigated in parallel. A thin PDMS layer was placed between the piston and the glass lid to provide a means for the lid to self-align to the chip surface if there was any off-axis tilt in the piston. (C) An experiment to measure OCR in the cells in the array yielded a plot of oxygen concentration versus time for each sealed microwell in the array after a lid was lowered. This typical result showed separation of oxygen concentration depletion rates inside microwells containing zero, one, or two cells. Sensors were numbered from left to right and top to bottom. Each well was lined with a fluorescent oxygen sensor. Once a lid was clamped over the top the respiration of individual cells was measured.38 (Caption and figure reprinted from ref. 38, copyright © 2009, with permission from Elsevier.)
3. Benefits of Stochastic Confinement: Increase Speed of Detection
Cells are detected in a variety of samples and for many purposes, such as in biological samples for diagnostics and in environmental samples for safety monitoring. The two biggest bottlenecks in detection of cells are sensitivity and speed. Sensitivity of detection of rare cells can be increased by isolating the cells using confinement because isolation eliminates interference from “background” signaling by other cells that co-exist in the bulk sample. Cells are detected by the appearance (production of proteins) or disappearance (e.g. consumption of O2 as in Figure 538) of soluble molecules in the media. The speed of detection depends the rate of accumulation of the signals and is reduced when the signal can diffuse away from the cell. Under a particular production rate of the signal, the time needed to reach a detectable concentration scales with the volume of the sample. Confinement may increase speed of detection by preventing loss by diffusion and thus decreasing the time it takes to observe a function from small numbers of cells. Activities such as antibody production, enzymatic activity, protein expression, and antibiotic resistance can all be observed from single cells confined in small volumes.
3a. Detection of Antibodies
There is a high demand for monoclonal antibodies in biomedical research. Their collection is both lengthy and costly, requiring screening of a large number of cells and then retrieving the cells that produced the desired antibody. Although screening cells of hybridomas by limiting serial-dilution can require seven to ten days for the culture to achieve sufficient concentrations of antibodies for detection by ELISA, a microengraving method has been developed to create arrays of microwells for rapid selection of hybridomas. In this method, single cells were isolated from a mixture by depositing a cell suspension into up to 25,000 wells (0.1-1 nanoliter), and a single cell confined in a small volume produced detectable concentrations of antibodies in less than 12 h (Figure 6).39 This method for rapid screening of cells to identify those secreting particular molecules has been adapted for detecting other cell types, for example human lymphocytes secreting cytokines.40
Figure 6.

When confined in nanoliter volumes, small numbers of cells from hybridomas produced a detectable concentration of antibodies much faster than in bulk solution. (A) Phase contrast micrograph of a region of a microarray 4 h after preparation. The arrowheads indicate the location of cells in the wells. (B) Fluorescence micrograph of the corresponding microwells showing conjugation of captured antibody with fluorescently-labeled tetramers of H-2Kb-streptavidin-Alexa 647 and secondary goat-anti-mouse (Alexa 532). The mean signal-to-noise ratio for positive spots to background spots was 6.2 ± 4.1. Scale bar, 200 µm.39 (Caption and figure reprinted with permission from Macmillan Publishers Ltd: Nature Biotechnology, ref. 39, copyright 2006.)
3b. Detection of Enzymes
Enzymatic assays are an essential tool in identifying unknown bacterial cells from a mixture. There is a great need to screen and select microorganisms with useful enzymatic activities, such as those that degrade cellulose, hydrocarbons, toxic organic pollutants, or heavy metals from the natural environment. Most enzymatic assays are performed on high density cultures, and cells must first be separated from the mixture and then enriched to generate high cell numbers. Microfluidic stochastic confinement allows separation of cells without dilution and determination of enzymatic activity on a small number of cells. When a single cell is confined in a small volume any reaction products can rapidly accumulate to a high concentration. A plug-based approach for this purpose was demonstrated by isolating Paenibacillus curdlanolyticus cells with cellulase activity from a mixture with a high abundance of Eschericia coli cells. Single cells were isolated into individual droplets nanoliters in volume by stochastic confinement, and droplets containing P. curdlanolyticus were identified by a cellulase assay, after an incubation to obtain only hundreds of cells of P. curdlanolyticus in those droplets (Figure 7)24. Similar assays have been performed in picoliter microdroplets to detect the alkaline phosphatase41 and the cytochrome c peroxidase (CCP)42 expressed by E. coli cells, as well as the β-galactosidase activity of yeast cells in droplets (Figure 8).43
Figure 7.

A mixture of cells can be separated into plugs by stochastic confinement and then assayed for enzymatic activity.24 (Caption and figure from ref. 24, copyright© 2009- Reproduced by permission of The Royal Society of Chemistry).
Figure 8.

Detecting levels of β-galactosidase in drops containing cells by fluorescence intensity. (A) Bright field image. Individual cells confined in droplets are indicated by the white arrows. (B) Color gradient map of a fluorescence image shows levels of β-galactosidase at 45 min.43 Scale bar, 40 μm. (Caption and figure from ref. 43, copyright © 2009- Reproduced by permission of The 2009 Royal Society of Chemistry).
3c. Detection of Metabolic Activity for Antibiotic Resistance
The metabolic activity of cells can be used as a mechanism to detect their presence in a sample. Metabolic assays can be used to detect the presence of bacteria in blood, however this typically requires incubation times that can range from hours to days. In the case of systemic bacterial infections like sepsis, in which rapid treatment is essential to prevent multiple organ failure and death, detection speed is often crucial. Stochastic confinement of individual bacterial cells into plugs locally concentrates the bacteria and increases the accumulation of the assay product generated by their metabolic activity, enabling faster detection (Figure 9) and providing a potential way for rapid diagnostic analysis.6
Figure 9.

Stochastic confinement of bacterial cells into plugs reduces detection time. (A) Schematic drawing illustrates the increase in cell density resulting from the stochastic confinement of an individual bacterium in a nanoliter-sized plug. While most plugs were empty, a few were occupied by a single bacterium at an effective concentration greater than the initial concentration. (B) Schematic drawing illustrates the experimental procedure to compare the detection of bacteria incubated in nanoliter-volume plugs and the detection of bacteria incubated in a milliliter-volume culture. Line scans indicate that confining the bacteria at the beginning of incubation (t = 0) led to a few occupied plugs with high fluorescence intensity and many empty plugs with low fluorescence intensity (solid line). All plugs made from the milliliter-scale culture had intermediate fluorescence intensity (dotted line). (C) When single bacterial cells were confined in plugs, the detection time decreased with the log of the volume of the plug. (D) The detection times measured for bacterial cells incubated in plugs (○) were similar to detection times measured for bacterial cells incubated in 96-well plates (×) with similar initial cell densities.6 (Caption and figure from ref. 6, copyright © 2008- Reproduced by permission of The Royal Society of Chemistry).
3d. Detection of Intracellular Molecules from Lysed Cells
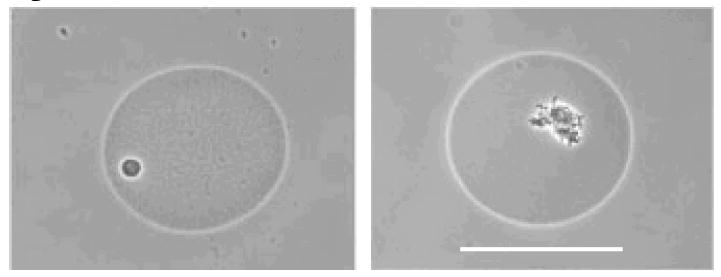
In addition to detecting secreted molecules, microfluidic stochastic confinement can also be used to detect intracellular molecules from lysed cells by preventing loss of molecules by diffusion. Several microfluidic methods based on stochastic confinement have been used to monitor protein expression in single cells, by first isolating individual cells in small volumes, then lysing the cells, and finally detecting the released molecules in the small volumes. In one example four intracellular proteins, FLAG-tagged GST, HA-tagged BAP, Ca2+-dependent protease (calpain), and caspase 3, were analyzed after trapping and lysing single rat pheochromocytoma PC12 cells in picoliter-scale microwells (Figure 10).44 In another example, the intracellular enzyme β-galactosidase was assayed from single mouse mast cells encapsulated in small droplets by laser photolysing the cells within the droplets (Figure 11).45 Stochastic confinement in small volume is especially useful for detecting intracellular molecules that have low copy numbers.
Figure 10.

Detection of intracellular proteins of a single cell and of enzymatic activity in a single-cell. (top) Bright field (left) and fluorescence (right) images of a single rat pheochromocytoma PC12 cell. The calpain activity is visualized by fluorescence 10 min after lysis. The white arrowhead indicates the location in the well of the trapped cell. (bottom) Images from the control experiment with no cells. Scale bar, 10 μm.44 (Caption and figure reprinted with permission from ref. 44. Copyright © 2008 American Chemical Society).
Figure 11.

enzymatic assay performed on a single-cell within an aqueous droplet in soybean oil. (A) A mast cell was encapsulated in an aqueous droplet that contained the fluorogenic substrate FDG. (B) Prior to photolysis of the cell, there was little fluorescent product within the droplet because the intracellular enzyme β -galactosidase was physically separated from FDG by the cell membrane. (C, D) After laser induced cell lysis (C), β-galactosidase catalyzed the formation of the product fluorescein, which caused the droplet to become highly fluorescent (D). The scale bar in (A) applies to all panels.45 (Caption and figure reprinted with permission from ref. 45. Copyright © 2005 American Chemical Society).
4. Benefits of Stochastic Confinement: Enhance Cultivation
Although obtaining pure cultures of microbes is important for microbiological study, it is often a difficult task because many microbial species appear to be “unculturable”. “Unculturable” does not mean that those microbes cannot grow, since they grow in their natural environments, but rather that appropriate conditions for their growth have not yet been found or compatible techniques have not yet been developed. It is known that growth of many bacteria is a non-linear process, with little to no growth during the lag phase followed by rapid growth during the exponential phase. During lag phase, some species “condition” their environment. Spatial confinement should have a large effect on cultivation by isolating cells from inhibitory factors secreted by competing cells and by shortening the lag phase through acceleration of “conditioning” of the environment by confined cells.
Because most microbes occur in communities with other species, isolation of the species of interest from the mixture is usually required. The two representative strategies for isolation of microbes are plating by streaking the microbes on solid media, and “dilution-to-extinction”. Plating becomes challenging when the species of interest is rare in the mixture or when it co-exists with some fast-growing species. “Dilution-to-extinction” separates individual species from the mixture by diluting the original mixture to such an extent that each individual volume contains one or a few individual cells. However, this approach has three limitations that may prevent species from being cultivated. First, large volumes prevent cells from conditioning media, accumulating signals, and activating genes which process nutrient sources. Second, dilution to such a low density makes it more difficult to detect organisms that grow slowly, have density dependent growth, undergo just a few divisions, or grow to a low final density. Third, analysis of secreted molecules becomes more difficult when starting with a low density of cells, because secreted molecules are initially present at low concentrations.
4a. Enhance Cultivation by Isolating Cells from a Mixture
There are several microfluidic methods based on stochastic confinement or analogues to isolate cells and then cultivate them. Small volume microwells can be used to separate microbes in a multi-species mixture, screen for their activity, and recover desired phenotypes based on their activity. 22 microcolonies of oligotrophic bacteria with organic phosphate metabolism were recovered from >200,000 isolates from Rhine water by using a million-well growth chip (Figure 12).46 Encapsulating cells in gel micro-droplets (GMDs) is another method to isolate microbes from a multi-species mixture (Figure 13).47 In this method, the gel matrix allowed the exchange of small molecules from the media to the microcolonies so that cells in different GMDs were able to communicate. A third method uses aqueous droplets suspended in an immiscible carrier fluid to compartmentalize microbes into miniature trials and prevent diffusion of small signaling molecules away from the cells. In a high-throughput manner, individual cells can be isolated into small compartments to prevent competition or inter-inhibition so as to allow adequate growth time for slowly growing species. Using this technique, rare and slowly-growing bacteria were isolated from mixtures and cultured (Figure 14).24
Figure 12.

Isolation of cells of rare phenotype by microwells. (A) SEM of 7 × 7-μm compartments from above at a 30° angle. (B) Culture of Lactobacillus plantarum in six compartments of the same dimensions as stained with a fluorogenic dye, Syto 9, after growth and imaged from above. (C) β-galactosidase activity from E. coli containing the plasmid pUC18 and grown in a 20 × 20-μm compartment was detected by using the fluorogenic substrate FDG. (D) One plasmid-containing microcolony from (C), viewed at lower magnification.46 (Caption and figure reprinted with permission from ref. 46. Copyright © 2007 National Academy of Sciences, U.S.A.)
Figure 13.
Cells isolated in gel-microdroplets. Phase contrast photomicrograph of separated GMDs containing microcolonies. Bar = 50 um.47 (Caption and figure reprinted with permission from ref. 47 Copyright © 2002 National Academy of Sciences, U.S.A.)
Figure 14.

Rare individual cells in a mixture were isolated by stochastic confinement at ratios much lower than those that were achievable by plate culture. (A) Colonies of both E. coli and P. curdlanolyticus were observed after incubating a culture plate spread by a mixture of them, with the ratio of cell density at 1.5:1. (B) Colonies of only E. coli were observed after incubating a plate spread by a mixture of E. coli and P. curdlanolyticus with the ratio at 15:1. No P. curdlanolyticus colonies were observed. (C) A plot of the recovered fraction of colonies to the expected number after isolating E. coli and P. curdlanolyticus from mixtures with different ratios on plates. Error bars denote standard deviations (n = 2). (D) A plot of the recovered fraction of cells to the expected number after isolating E. coli and P. curdlanolyticus in plugs. Pc indicates P. curdlanolyticus.24 (Caption and figure from ref. 24, copyright © 2009- Reproduced by permission of The Royal Society of Chemistry).
4b. Enhance Cultivation by Creating a High Density Environment
In cases where the initiation of growth of the microorganism relies on self-signaling that scales with cell density, confinement is crucial for cultivation. Confinement in small volumes enables single cells or small numbers of microbes to rapidly condition their surrounding media and increases the effective concentration of molecules released by them. One of the consequences is activation of high-density behavior, which may be needed for growth. For example, in a minimal media containing adenosine as the sole carbon source, Pseudomonas aeruginosa bacteria must initiate quorum sensing (QS) before they can utilize the adenosine. Under these conditions, the bacterial cells grew only if they were confined and turned on the QS genes (Figure 15).23
Figure 15.

In media with adenosine as the sole carbon source, small groups of bacterial cells did not divide more than a few times, unless they initiated quorum sensing (QS). Both wells indicated by arrows started with one cell at t=0. After 29 h, a well with cells that had initiated QS (green arrows) contained a population of tens of cells, whereas in a well with cells which did not initiate QS (white arrow) the cells did not divide. (A) Brightfield image and (B) fluorescence image of the same wells. Fluorescence on the edges of wells is an artifact.23 (Caption and figure from ref. 23. Copyright © 2009 WILEY-VCH Verlag GmbH & Co. KGaA. Reproduced with permission).
Conclusions
Here we have discussed how microfluidic stochastic confinement enhances work with single cells that secrete diffusible signals. Microfluidic stochastic confinement provides new opportunities to culture cells with density-dependent growth and to rapidly observe constitutive and density-dependent activities. There are a few limitations to this approach. First, the creation of larger numbers of small volumes requires sophisticated analysis programs to distinguish empty droplet from droplets containing cells. Ordered arrays of droplets or wells make this process easier. Combining this approach with a mature sorting technology such as flow cytometry may also enhance the analysis of the many small volumes.48 Second, stochastic loading is not efficient. A low concentration of cells would create a large number of empty droplets to be sorted. Loading cells with a higher probability would simplify analysis,21 and changing geometries of channels in microfluidic devices has the potential to lead to non-stochastic loading.16 Third, the use of confinement will only be advantageous in systems where soluble signals are known to be important, for example, in platelet activation, stem cell maintenance, and wound healing. Fourth, in very small volumes nutrients will be the limiting factor, so this microfluidic stochastic confinement may be most useful for shorter-term analysis or for studying metabolically slower cells.
In addition to the applications reviewed here, which have already demonstrated potential for the cultivation and analysis of rare single cells, there are many other potential applications in the fields of human diagnostics and environmental testing where microfluidic confinement could make a difference. First, microfluidic confinement could be used to grow “unculturable” bacteria. Some bacteria species may be considered “unculturable” because they require conditioned media and are unable to effectively condition their media in large volume cultures. Confinement would allow individual cells in small volumes to rapidly condition their media. Even culturable bacterial species often have a long lag phase before exponential growth during which they are conditioning their media by secreting soluble signals. Once a critical concentration of these signals has been reached, they exhibit rapid growth. This lag time has been decreased by the addition of pre-conditioned media or by starting with a higher number of cells49 and could presumably also be decreased by confining cells to concentrate signals or to increase the number of cells per unit volume. Second, microfluidic stochastic confinement has already demonstrated the ability to increase the speed of testing for antibiotic resistance,6 and this approach has the potential to be extended to other areas. Third, microfluidic confinement could allow us to routinely observe in the lab behaviors that are rare in nature, as many rare cells live in environments where signals are not routinely encountered at the concentration required to initiate a particular behavior. Signals can be easily accumulated by confinement, and behaviors that are rare in nature could be observed routinely in the lab. Microfluidic devices are already being used for the detection of circulating tumor cells in the blood, which are extremely rare and are thought to be the origin of metastatic cancer50 and this technology could be extended to studying the signaling of these cells by using stochastic confinement. Detection and characterization of these cells is a promising method for both diagnosis and clinical management of cancer patients as well as for monitoring treatment. Finally, cultivating single cells in small volumes may reveal new functions or previously unobserved heterogeneity in existing functions, as was the case for QS in P. aeruginosa.23 Technological developments will undoubtedly improve the use of stochastic confinement techniques, further increasing their impact in biomedical science. The ability to add more reagents and to recover contents from small wells and droplets will allow for a wider range of both assays and analytical methods to characterize the molecules secreted by the confined cells. For example, the SlipChip51 can be used to add reagents to stochastically confined microbial samples in individual wells, the chemistrode24, 52 can be used to generate confined droplets directly from the environment, and fiber optic arrays53, 54 can be used to study single cell responses in small volumes. The ability to manipulate and characterize single cells will further our understanding of single cell behavior in physiologically relevant contexts.
Acknowledgments
This work was supported by ONR Grant N000140610630, NSF CRC Grant No. 0526693 and NIH Director's Pioneer Award DP1 OD003584 to R.F.I. We thank Rebecca Pompano, James Boedicker, and Elena Lucchetta for helpful discussion and Heidi Park for contributions to writing and editing this manuscript.
Footnotes
Part of the themed issue: From microfluidic application to nanofluidic phenomena.
References
- 1.Lauffenburger DA, Linderman JJ. Receptors: Models for binding, trafficking, and signaling. Oxford University Press; New York: 1993. [Google Scholar]
- 2.Haring G, Luisi PL, Meussdoerffer F. Biochem Biophys Res Commun. 1985;127:911–915. doi: 10.1016/s0006-291x(85)80030-9. [DOI] [PubMed] [Google Scholar]
- 3.Pfammatter N, Guadalupe AA, Luisi PL. Biochem Biophys Res Commun. 1989;161:1244–1251. doi: 10.1016/0006-291x(89)91376-4. [DOI] [PubMed] [Google Scholar]
- 4.Hochkoeppler A, Luisi PL. Biotechnol Bioeng. 1991;37:918–921. doi: 10.1002/bit.260371004. [DOI] [PubMed] [Google Scholar]
- 5.Rotman B. Proc Natl Acad Sci USA. 1961;47:1981. doi: 10.1073/pnas.47.12.1981. [DOI] [PMC free article] [PubMed] [Google Scholar]
- 6.Boedicker JQ, Li L, Kline TR, Ismagilov RF. Lab Chip. 2008;8:1265–1272. doi: 10.1039/b804911d. [DOI] [PMC free article] [PubMed] [Google Scholar]
- 7.Weibel DB, DiLuzio WR, Whitesides GM. Nat Rev Microbiol. 2007;5:209–218. doi: 10.1038/nrmicro1616. [DOI] [PubMed] [Google Scholar]
- 8.Song H, Chen DL, Ismagilov RF. Angew Chem Int Ed. 2006;45:7336–7356. doi: 10.1002/anie.200601554. [DOI] [PMC free article] [PubMed] [Google Scholar]
- 9.Roach LS, Song H, Ismagilov RF. Anal Chem. 2005;77:785–796. doi: 10.1021/ac049061w. [DOI] [PMC free article] [PubMed] [Google Scholar]
- 10.Kreutz JE, Li L, Roach LS, Hatakeyama T, Ismagilov RF. J Am Chem Soc. 2009;131:6042–6043. doi: 10.1021/ja808697e. [DOI] [PMC free article] [PubMed] [Google Scholar]
- 11.Pays K, Giermanska-Kahn J, Pouligny B, Bibette J, Leal-Calderon F. Langmuir. 2001;17:7758–7769. doi: 10.1103/PhysRevLett.87.178304. [DOI] [PubMed] [Google Scholar]
- 12.Koster S, Angile FE, Duan H, Agresti JJ, Wintner A, Schmitz C, Rowat AC, Merten CA, Pisignano D, Griffiths AD, Weitz DA. Lab Chip. 2008;8:1110–1115. doi: 10.1039/b802941e. [DOI] [PubMed] [Google Scholar]
- 13.Clausell-Tormos J, Lieber D, Baret JC, El-Harrak A, Miller OJ, Frenz L, Blouwolff J, Humphry KJ, Koster S, Duan H, Holtze C, Weitz DA, Griffiths AD, Merten CA. Chem Biol. 2008;15:427–437. doi: 10.1016/j.chembiol.2008.04.004. [DOI] [PubMed] [Google Scholar]
- 14.Tan YC, Hettiarachchi K, Siu M, Pan YP. J Am Chem Soc. 2006;128:5656–5658. doi: 10.1021/ja056641h. [DOI] [PubMed] [Google Scholar]
- 15.Huebner A, Srisa-Art M, Holt D, Abell C, Hollfelder F, Demello AJ, Edel JB. Chem Commun. 2007:1218–1220. doi: 10.1039/b618570c. [DOI] [PubMed] [Google Scholar]
- 16.Edd JF, Di Carlo D, Humphry KJ, Koster S, Irimia D, Weitz DA, Toner M. Lab Chip. 2008;8:1262–1264. doi: 10.1039/b805456h. [DOI] [PMC free article] [PubMed] [Google Scholar]
- 17.Martin K, Henkel T, Baier V, Grodrian A, Schon T, Roth M, Kohler JM, Metze J. Lab Chip. 2003;3:202–207. doi: 10.1039/b301258c. [DOI] [PubMed] [Google Scholar]
- 18.Grodrian A, Metze J, Henkel T, Martin K, Roth M, Kohler JM. Biosens Bioelectron. 2004;19:1421–1428. doi: 10.1016/j.bios.2003.12.021. [DOI] [PubMed] [Google Scholar]
- 19.Kumaresan P, Yang CJ, Cronier SA, Blazei RG, Mathies RA. Anal Chem. 2008;80:3522–3529. doi: 10.1021/ac800327d. [DOI] [PubMed] [Google Scholar]
- 20.Sgro AE, Allen PB, Chiu DT. Anal Chem. 2007;79:4845–4851. doi: 10.1021/ac062458a. [DOI] [PMC free article] [PubMed] [Google Scholar]
- 21.Chabert M, Viovy JL. Proc Natl Acad Sci U S A. 2008;105:3191–3196. doi: 10.1073/pnas.0708321105. [DOI] [PMC free article] [PubMed] [Google Scholar]
- 22.Park MC, Hur JY, Kwon KW, Park SH, Suh KY. Lab Chip. 2006;6:988–994. doi: 10.1039/b602961b. [DOI] [PubMed] [Google Scholar]
- 23.Boedicker JQ, Vincent ME, Ismagilov RF. Angewandte Chemie. 2009;48:5908–5911. doi: 10.1002/anie.200901550. [DOI] [PMC free article] [PubMed] [Google Scholar]
- 24.Liu W, Kim HJ, Lucchetta EM, Du W, Ismagilov RF. Lab Chip. 2009;9:2153–2162. doi: 10.1039/b904958d. [DOI] [PMC free article] [PubMed] [Google Scholar]
- 25.Funfak A, Brosing A, Brand M, Kohler JM. Lab Chip. 2007;7:1132–1138. doi: 10.1039/b701116d. [DOI] [PubMed] [Google Scholar]
- 26.Pompano R, Li H, Ismagilov RF. Biophys J. 2008;95:1531. doi: 10.1529/biophysj.108.129486. [DOI] [PMC free article] [PubMed] [Google Scholar]
- 27.Park S, Wolanin PM, Yuzbashyan EA, Silberzan P, Stock JB, Austin RH. Science. 2003;301:188–188. doi: 10.1126/science.1079805. [DOI] [PubMed] [Google Scholar]
- 28.Kastrup CJ, Boedicker JQ, Pomerantsev AP, Moayeri M, Bian Y, Pompano RR, Kline TR, Sylvestre P, Shen F, Leppla SH, Tang WJ, Ismagilov RF. Nat Chem Biol. 2008;4:742–750. doi: 10.1038/nchembio.124. [DOI] [PMC free article] [PubMed] [Google Scholar]
- 29.Shen F, Pompano R, Kastrup CJ, Ismagilov RF. Biophys J. 2009;97:2137–2145. doi: 10.1016/j.bpj.2009.08.004. [DOI] [PMC free article] [PubMed] [Google Scholar]
- 30.Whitesides GM, Ostuni E, Takayama S, Jiang XY, Ingber DE. Annu Rev Biomed Eng. 2001;3:335–373. doi: 10.1146/annurev.bioeng.3.1.335. [DOI] [PubMed] [Google Scholar]
- 31.Walker GM, Zeringue HC, Beebe DJ. Lab Chip. 2004;4:91–97. doi: 10.1039/b311214d. [DOI] [PubMed] [Google Scholar]
- 32.Yi CQ, Li CW, Ji SL, Yang MS. Anal Chim Acta. 2006;560:1–23. [Google Scholar]
- 33.El-Ali J, Sorger PK, Jensen KF. Nature. 2006;442:403–411. doi: 10.1038/nature05063. [DOI] [PubMed] [Google Scholar]
- 34.Kelly BT, Baret JC, Taly V, Griffiths AD. Chem Commun. 2007:1773–1788. doi: 10.1039/b616252e. [DOI] [PubMed] [Google Scholar]
- 35.Redfield RJ. Trends Microbiol. 2002;10:365–370. doi: 10.1016/s0966-842x(02)02400-9. [DOI] [PubMed] [Google Scholar]
- 36.Hense BA, Kuttler C, Mueller J, Rothballer M, Hartmann A, Kreft JU. Nat Rev Microbiol. 2007;5:230–239. doi: 10.1038/nrmicro1600. [DOI] [PubMed] [Google Scholar]
- 37.Molter TW, Holl MR, Dragavon JM, McQuaide SC, Anderson JB, Young AC, Burgess LW, Lidstrom ME, Meldrum DR. IEEE Trans Autom Sci Eng. 2008;5:32–42. doi: 10.1109/tase.2007.909441. [DOI] [PMC free article] [PubMed] [Google Scholar]
- 38.Molter TW, McQuaide SC, Suchorolski MT, Strovas TJ, Burgess LW, Meldrum DR, Lidstrom ME. Sens Actuator B-Chem. 2009;135:678–686. doi: 10.1016/j.snb.2008.10.036. [DOI] [PMC free article] [PubMed] [Google Scholar]
- 39.Love JC, Ronan JL, Grotenbreg GM, van der Veen AG, Ploegh HL. Nat Biotechnol. 2006;24:703–707. doi: 10.1038/nbt1210. [DOI] [PubMed] [Google Scholar]
- 40.Bradshaw EM, Kent SC, Tripuraneni V, Orban T, Ploegh HL, Hafler DA, Love JC. Clin Immunol. 2008;129:10–18. doi: 10.1016/j.clim.2008.06.009. [DOI] [PMC free article] [PubMed] [Google Scholar]
- 41.Huebner A, Olguin LF, Bratton D, Whyte G, Huck WTS, de Mello AJ, Edel JB, Abell C, Hollfelder F. Anal Chem. 2008;80:3890–3896. doi: 10.1021/ac800338z. [DOI] [PubMed] [Google Scholar]
- 42.Thorsen T, Maerkl SJ, Quake SR. Science. 2002;298:580–584. doi: 10.1126/science.1076996. [DOI] [PubMed] [Google Scholar]
- 43.Schmitz CH, Rowat AC, Köster S, Weitz DA. Lab Chip. 2009;9:44–49. doi: 10.1039/b809670h. [DOI] [PubMed] [Google Scholar]
- 44.Sasuga Y, Iwasawa T, Terada K, Oe Y, Sorimachi H, Ohara O, Harada Y. Anal Chem. 2008;80:9141–9149. doi: 10.1021/ac8016423. [DOI] [PubMed] [Google Scholar]
- 45.He MY, Edgar JS, Jeffries GDM, Lorenz RM, Shelby JP, Chiu DT. Anal Chem. 2005;77:1539–1544. doi: 10.1021/ac0480850. [DOI] [PubMed] [Google Scholar]
- 46.Ingham CJ, Sprenkels A, Bomer J, Molenaar D, van den Berg A, Vlieg J, de Vos WM. Proc Natl Acad Sci U S A. 2007;104:18217–18222. doi: 10.1073/pnas.0701693104. [DOI] [PMC free article] [PubMed] [Google Scholar]
- 47.Zengler K, Toledo G, Rappe M, Elkins J, Mathur EJ, Short JM, Keller M. Proc Natl Acad Sci U S A. 2002;99:15681–15686. doi: 10.1073/pnas.252630999. [DOI] [PMC free article] [PubMed] [Google Scholar]
- 48.Baret JC, Miller OJ, Taly V, Ryckelynck M, El-Harrak A, Frenz L, Rick C, Samuels ML, Hutchison JB, Agresti JJ, Link DR, Weitz DA, Griffiths AD. Lab Chip. 2009;9:1850–1858. doi: 10.1039/b902504a. [DOI] [PubMed] [Google Scholar]
- 49.Lankford CE, Walker JR, Reeves JB, Nabbut NH, Byers BR, Jones RJ. J Bacteriol. 1966;91:1070–1079. doi: 10.1128/jb.91.3.1070-1079.1966. [DOI] [PMC free article] [PubMed] [Google Scholar]
- 50.Nagrath S, Sequist LV, Maheswaran S, Bell DW, Irimia D, Ulkus L, Smith MR, Kwak EL, Digumarthy S, Muzikansky A, Ryan P, Balis UJ, Tompkins RG, Haber DA, Toner M. Nature. 2007;450:1235–1239. doi: 10.1038/nature06385. [DOI] [PMC free article] [PubMed] [Google Scholar]
- 51.Du W, Li L, Nichols KP, Ismagilov RF. Lab Chip. 2009;9:2286–2292. doi: 10.1039/b908978k. [DOI] [PMC free article] [PubMed] [Google Scholar]
- 52.Chen D, Du WB, Liu Y, Liu WS, Kuznetsov A, Mendez FE, Philipson LH, Ismagilov RF. Proc Natl Acad Sci U S A. 2008;105:16843–16848. doi: 10.1073/pnas.0807916105. [DOI] [PMC free article] [PubMed] [Google Scholar]
- 53.Biran I, Walt DR. Anal Chem. 2002;74:3046–3054. doi: 10.1021/ac020009e. [DOI] [PubMed] [Google Scholar]
- 54.Walt DR. Chem Soc Rev. 2010;39:38–50. doi: 10.1039/b809339n. [DOI] [PubMed] [Google Scholar]