

Abstract
Background
Adult patients with X-linked adrenoleukodystrophy (X-ALD) remain at risk for progressive neurological deterioration. Phenotypes vary in their pathology, ranging from axonal degeneration to inflammatory demyelination. The severity of symptoms is poorly explained by conventional imaging.
Objective
To test the hypothesis that neurochemistry in normal appearing brain differs among adult phenotypes of X-ALD, and that neurochemical changes correlate with the severity of symptoms.
Patients and Methods
Using a 7 Tesla scanner we performed structural and proton MRSI in 13 adult patients with X-ALD, including 4 patients with adult cerebral ALD (ACALD), 5 with adrenomyeloneuropathy (AMN) and 4 female heterozygotes. Studies were also performed in nine healthy controls.
Results
Among adult X-ALD phenotypes, MI/Cr was 46% higher and Cho/Cr 21% higher in normal appearing white matter of ACALD compared to AMN (p < 0.05). Both NAA/Cr and Glu/Cr ratios were lower in AMN patients (p = 0.028 and p = 0.036, respectively) than in controls. There were no significant differences between AMN and female heterozygotes. In cortex, ACALD patients had lower values of NAA/Cr compared to female heterozygotes and controls (p = 0.022). The global MI/Cr ratio demonstrated a significant association with the EDSS (Spearman ρ = 0.66, p = 0.039).
Conclusion
7 Tesla proton MRSI reveals differences in the neurochemistry of ACALD but is unable to distinguish AMN from female heterozygotes. MI/Cr correlates with the severity of the symptoms and may be a meaningful biomarker in adult X-ALD.
X-linked adrenoleukodystrophy (X-ALD) is a peroxisomal disorder that confers a lifelong risk for neurological deterioration [1, 2]. In adulthood male phenotypes can range from adrenomyeloneuropathy (AMN), a spastic paraparesis that is due to a chronic axonopathy of the spinal cord [3], to adult cerebral ALD (ACALD), a rapidly progressive brain disorder involving inflammatory demyelination [4]. In females heterozygous for X-ALD, neurologic symptoms are also frequent and incapacitating [5].
Abnormally high levels of plasma very long chain fatty acids (VLCFA) are diagnostic for X-ALD [6] but unfortunately do not correlate with symptom severity or predict the pathology of the phenotype. Conventional imaging reveals distinct lesion patterns in demyelinating and axonopathic phenotypes [7] but is poorly sensitive, resulting in delays in diagnosis and treatment.
Proton magnetic resonance spectroscopy (MRS) can provide insight into the varying pathology of adult X-ALD in vivo. In AMN, decreases in white matter N-acetylaspartate (NAA) are believed to reflect axonal loss or dysfunction [8]. In ACALD, demyelination may cause elevations in choline (Cho), a composite signal of compounds that are precursors and breakdown products of membranes [9]. In female heterozygotes, NAA levels are reduced within corticospinal tract fibers, suggesting axonal dysfunction similar to AMN [5]. To date, no comparative study of spectroscopic markers across adult phenotypes of X-ALD has been reported.
Since biochemical changes of membrane metabolism are likely present before structural changes, normal appearing brain in adult phenotypes with X-ALD may differ early on in their neurochemistry. At conventional magnetic field strength (1.5 Tesla), changes are limited to a few metabolites and their ratios (NAA, creatine, choline, myo-inositol)[10, 11]. In order to improve spectral resolution and deconvolute resonances from myo-inositol (MI) and glutamate (Glu), we used a 7 Tesla human scanner [12]. We hypothesized that proton MR spectroscopic imaging (MRSI) using a 7 Tesla scanner can distinguish adult phenotypes of X-ALD, and that neurochemical changes correlate with the severity of symptoms.
Methods
Subjects
Subjects were recruited from the Leukodystrophy Clinic at the Massachusetts General Hospital. Thirteen adult patients with the biochemical defect for ALD and nine healthy control subjects were enrolled in this study (see Table 1). The patients had elevations of VLCFA in plasma confirming the diagnosis of X-ALD. Neurologic examination consisted of the Expanded Disability Status Scale (EDSS). A neurologist blinded to the patients' spectroscopy results performed the EDSS. The local institutional review board approved the study, and informed consent was obtained from each study subject.
Table 1. Clinical Characteristics of Adult X-ALD Patients.
Clinical Characteristics of 13 Patients with Adrenoleukodystrophy. The individual phenotypes, age as well as the Expanded Disability Status Scale (EDSS) with its subscores at the time of examination are provided.
| Patient no. | phenotype | age | motor | sensory | bladder | mental | EDSS |
|---|---|---|---|---|---|---|---|
| 1 | ACALD | 21 | 3 | 2 | 2 | 1 | 6 |
| 2 | ACALD | 26 | 1 | 0 | 2 | 0 | 3 |
| 3 | ACALD | 36 | 1 | 0 | 1 | 0 | 1.5 |
| 4 | ACALD | 29 | 2 | 1 | 1 | 0 | 2.5 |
| 5 | AMN | 46 | 1 | 2 | 0 | 0 | 2.5 |
| 6 | AMN | 25 | 4 | 4 | 4 | 0 | 8 |
| 7 | AMN | 48 | 3 | 2 | 1 | 1 | 3.5 |
| 8 | AMN | 21 | 0 | 1 | 0 | 0 | 1 |
| 9 | AMN | 36 | 4 | 0 | 4 | 0 | 7.5 |
| 10 | heterozygote | 51 | 2 | 1 | 2 | 2 | 2.5 |
| 11 | heterozygote | 46 | 2 | 2 | 0 | 1 | 2 |
| 12 | heterozygote | 48 | 3 | 2 | 1 | 0 | 4 |
| 13 | heterozygote | 65 | 2 | 0 | 0 | 0 | 2.5 |
1.5 Tesla MRSI PROTOCOL
The clinical standard protocol for ALD patients on the Signa 1.5 Tesla scanner using a quadrature head coil (General Electric, Milwaukee, Wisconsin) included an axial T1 weighted image sequence with the following parameter: 220 mm field of view [FOV], minimum echo time [TE], 450 ms repetition time [TR], 5 mm skip 1mm slice thickness. This resulted in a resolution of 0.86 × 0.86 × 5 mm3. Magnetic resonance spectroscopic imaging was performed using a position resolved spectroscopy [PRESS] sequence with chemical shift selective [CHESS] water suppression on a FOV of 220 mm, 16 × 16 phase-encoding steps which were subsequently interpolated to 32 × 32 and a TE/TR = 144/1500ms. In addition, six spatial outer-volume suppression pulses were used for improved fat suppression.
7 Tesla MRSI PROTOCOL
Magnetic resonance structural imaging and spectroscopic imaging experiments were performed on a 7 Tesla scanner (Siemens AG, Erlangen, Germany) using a detunable birdcage coil for excitation and an 8-channel coil array for signal reception. The imaging exam included sagittal T1 weighted images (FOV 220, TE/TR 5/30 ms, slice thickness 2.5 mm) and axial magnetization prepared rapid acquisition gradient echo [MPRAGE] images (TE/TR/TI=3.6/2500/1100 ms, 120 contiguous slices) with a resolution of 0.56 × 0.56 × 1 mm3 = 0.31 mm3 from which the volume of interest (VOI) for MRSI was prescribed.
2D proton MRSI spectra were acquired in a 1.5-cm thick oblique-axial slice parallel to a line through the anterior and posterior commissures at the levels of the white matter centrum semiovale as well as the cingulate cortex. The VOI was selectively excited using PRESS (TE=35 ms, TR=2 s) with WET water suppression and six spatial outer-volume suppression pulses for improved fat suppression. The field-of-view (FOV = 20 cm) was partitioned into 16 × 16 phase encoding steps, resulting in a nominal voxel size of 1.25 cm × 1.25 cm × 1.5 cm = 2.3 cm3, and a scan time of 8 min. Other MRSI acquisition parameters included a bandwidth of 4000 Hz and a water suppression bandwidth of 120 Hz. Prior to data acquisition, the VOI underwent an automatic shim routine using first and second order shimming, followed by final manual shimming adjustments. The typical line width (FWHM) for water within the entire VOI was 26 – 30 Hz, yielding a spectral resolution of 9 Hz for creatine (Cr).
Data Processing
Spectra were processed off-line using an automated parametric spectral analysis method, LCModel, 6.01 (Dr. Stephen Provencher, Ontario, Canada) which seeks to determine the optimum parameters that enable so-called model functions to best describe the data in order to determine signal intensities of brain metabolites NAA, Cr, Cho, Glu, and MI [13]. The basis set or model functions, to analyze the metabolites via LCModel was generated by GAMMA (ETH Zürich), a program designed to simulate magnetic resonance spin systems with the prior knowledge of all chemicals shifts and coupling constants for metabolites. Only voxels identified by visual inspection on an overlay of structural MPRAGE and spectral grids as “predominantly gray matter” or “predominantly white matter” were included in the metabolite analysis. Further, voxels were excluded from the analysis due to poor water and fat suppression as determined by visual inspection of spectral data, and if their location was close to the PRESS-box boundary in regions of excitation chemical shift artifact. Metabolite concentrations were only used in the analysis if their standard error estimates were less than 15%. In particular, concentrations of glutamate were only included in the analysis if both glutamine and glutamate met that criteria.
Statistical Analysis
A multivariate analysis of variance (MANOVA) was performed to test our hypothesis that the metabolite ratios (NAA/Cr, Cho/Cr, Glu/Cr and MI/Cr) in each of two tissue types, e.g. gray matter and normal appearing white matter (NAWM) are altered in different phenotypes (e.g. controls, ACALD, AMN, female heterozygotes). Analyses of variance (ANOVA) for individual metabolites across phenotypes were carried out only if the MANOVA was significant (p < 0.05). As the overall alpha was limited by the initial MANOVA, no corrections for multiple comparisons were needed. If the ANOVA was significant (p < 0.05) or showed a trend towards significance (p < 0.1), a Holm's t-test was performed to test for differences in metabolite ratios among the phenotypes. Associations between various global metabolic ratios, defined as the metabolite ratio of all gray and white matter voxels combined per patient, and the EDSS were assessed using the Spearman rank correlation. In this context, the impact of individual scale components of the EDSS (motor, sensory, bladder, mental) was also examined. We further examined associations between plasma VLCFA (C26:0) and global metabolic ratios.
Results
Clinical characteristics are listed in Table 1. The mean EDSS for ACALD patients was 3.3 ± 1.9 (range = 1.5 to 6). The mean EDSS for AMN patients was 4.5 ± 3.1 (range = 1 to 8). The mean EDSS for female heterozygotes was 2.8 ± 0.9 (range = 2 to 4).
All 4 ACALD patients had characteristic T1 hypointense lesions in the splenium of the corpus callosum on MPRAGE images (see Figure 1). Two of the 4 AMN patients had T1 hypointense lesions confined to the bilateral corticospinal tracts. The remaining 2 AMN patients, all 4 female heterozygotes and all controls had no brain abnormalities on conventional sequences. In contrast to routine 1.5 Tesla images, MPRAGE at 7 Tesla showed high resolution of individual fiber tracts (resolution 0.56 × 0.56 × 1mm3).
Figure 1. 1.5 Tesla versus 7 Tesla in adult X-ALD.
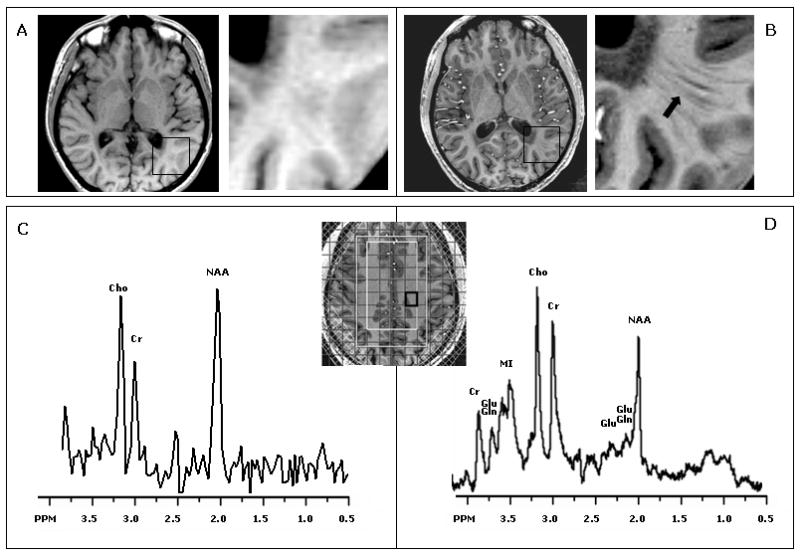
1.5 compared to 7 Tesla examination in X-ALD. Images reveal a lesion within the splenium in a 26 year old man with adult cerebral adrenoleukodystrophy (A: 1.5 Tesla, B: 7 Tesla). At 7 Tesla fiber tracts beyond the lesion are visible that are not seen at 1.5 Tesla (black arrow). Spectra from normal appearing white matter are shown from the 2D proton MRSI box (C: 1.5 Tesla, D: 7 Tesla). At 7 Tesla there is better spectral resolution and detection of more metabolites, such as glutamate (Glu) and myoinositol (MI).
All MRSI voxels were assigned to either predominantly white matter, or predominantly gray matter voxels based on visual inspection by a neuroradiologist. On average, 12 ± 5 (mean ± SD) voxels were assigned to predominantly white matter and 5 ± 2 voxels were assigned to predominantly gray matter. In addition, on three ACALD patients, 5 ± 1 voxels were assigned to lesions. Peaks of NAA, Cho, Cr, MI and Glu were detected in all patients and controls, and average values for metabolite ratios within normal appearing white matter and gray matter were determined and are shown in the bar graphs in Figures 2 and 3. No significant age difference between the 13 ALD patients (37±13) and 9 controls (32±8) was observed (p = 0.3). Neither in our control population nor in our X-ALD population did we find any significant correlations between age and metabolite ratios.
Figure 2. Metabolite Ratios in White Matter.
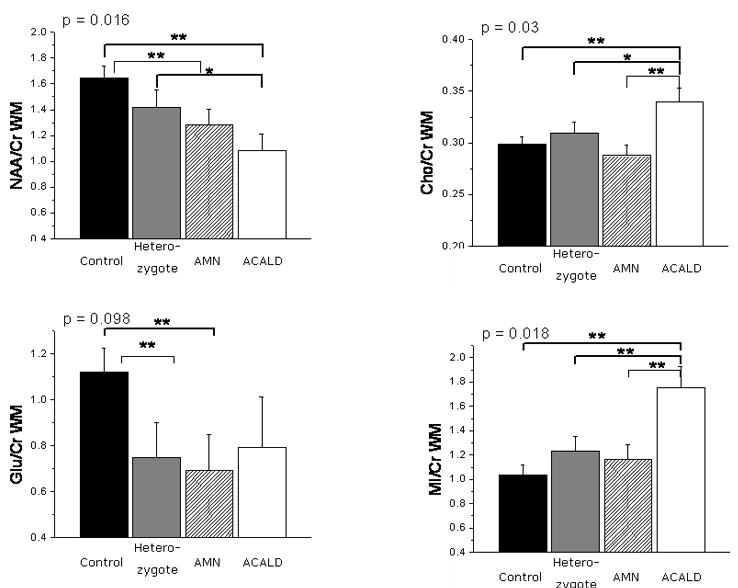
Metabolite ratios of white matter in various phenotypes of X-ALD. The mean NAA/Cr ratios were reduced in patients with adrenomyeloneuropathy (AMN) and adult cerebral adrenoleukodystrophy (ACALD) compared to controls. The Cho/Cr and MI/Cr ratios were elevated in ACALD patients compared to controls, AMN and female heterozygotes. The p values given are for the difference of mean metabolite ratios derived from a multivariate ANOVA; a significant difference on a Holm's t-test (p < 0.05) is indicated by **; a trend on the Holm's t-test (p < 0.1) is indicated by *.
Figure 3. Metabolite Ratios in Gray Matter.
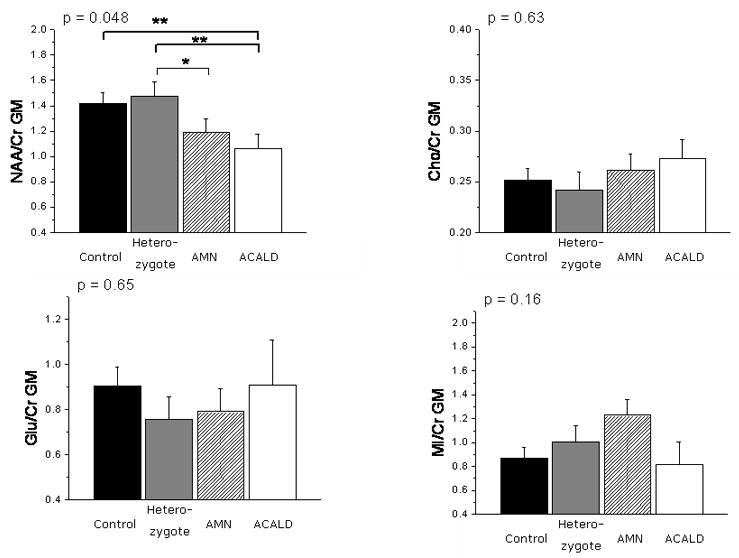
Metabolite ratios in gray matter in adult phenotypes of X-ALD. Male hemizygote patients had a decreased NAA/Cr ratio in the cortical gray matter compared to controls. The p values given are for the difference of mean metabolite ratios derived from a multivariate ANOVA; a significant difference on a Holm's t-test (p < 0.05) is indicated by **; a trend on the Holm's t-test (p < 0.1) is indicated by *.
Metabolite Ratios in White Matter
Initially, MANOVA was performed using a model including four metabolite ratios, NAA/Cr, Cho/Cr, Glu/Cr and MI/Cr, in two tissue types, gray matter and NAWM. There was a significant difference between ACALD, AMN, female heterozygotes and controls (p = 0.01). Based on these results, we analyzed the individual four metabolite ratios in the two regions using ANOVA and used Holm's t-tests to isolate differences between the phenotypes (see Figure 2).
Compared to controls, we found significantly decreased NAA/Cr ratios in the normal appearing white matter of ACALD and AMN patients (p=0.003 and p = 0.028, respectively), but not in female heterozygotes. By contrast, Cho/Cr and MI/Cr metabolite ratios were increased in ACALD compared to controls (p = 0.014 and p = 0.002, respectively), but not in AMN patients and female heterozygotes. In all X-ALD patients, including female heterozygotes, white matter Glu/Cr showed a trend to be lower compared to normal controls (p = 0.09).
Among adult X-ALD phenotypes, MI/Cr was 46% higher in ACALD compared to AMN and female heterozygotes (p = 0.015 and p = 0.028, respectively). The Cho/Cr ratio was 21% higher in ACALD compared to AMN (p = 0.006). There was a trend for NAA/Cr to be lower in ACALD compared to AMN and female heterozygotes, although this was not significant. There were no significant differences between AMN and female heterozygotes.
Metabolite Ratios in Gray Matter
Compared to controls we found a decreased NAA/Cr ratio in the cortical gray matter (p = 0.022) (Figure 3) in male X-ALD patients. There was no significant elevation of the Cho/Cr, Glu/Cr and MI/Cr ratios in cortex compared with healthy volunteers.
Among adult X-ALD patients, ACALD patients had lower values of NAA/Cr compared to female heterozygotes (p = 0.022). There were no significant differences between AMN and ACALD or AMN and female heterozygotes.
A significant correlation between NAA/Cr and Glu/Cr (Spearman ρ = 0.66, p = 0. 002) was found. NAA/Cr and MI/Cr (Spearman ρ = - 0.49, p = 0. 03) as well as Glu/Cr and MI/Cr (Spearman ρ = -0.55, p = 0. 015) showed a significant negative correlation.
Relationship to Clinical Disability and PLASMA VLCFA
The scatter-plot matrix in Figure 4 demonstrates the interrelationship between the global metabolic estimates and clinical disability index (EDSS). Global metabolic ratios were defined as the metabolite ratio of all gray and white matter voxels combined per patient. EDSS demonstrated a significant association with the global MI/Cr ratio (Spearman ρ = 0.66, p = 0.039). Assessment of individual scale components revealed significant correlations between motor function and global metabolite ratios of Glu/Cr (Spearman ρ = -0.64, p = 0.003), MI/Cr (Spearman ρ = 0.67, p = 0.002), and NAA/Cr (Spearman ρ = -0.61, p = 0.002). This correlation was also present for bladder function (with Glu/Cr: Spearman ρ = -0.67, p = 0.002; with MI/Cr: Spearman ρ = 0.67, p = 0.002; with NAA/Cr: Spearman ρ = -0.59, p = 0.002) but not for sensory or mental function.
Figure 4. Metabolite Ratios, EDSS and plasma VLCFA.
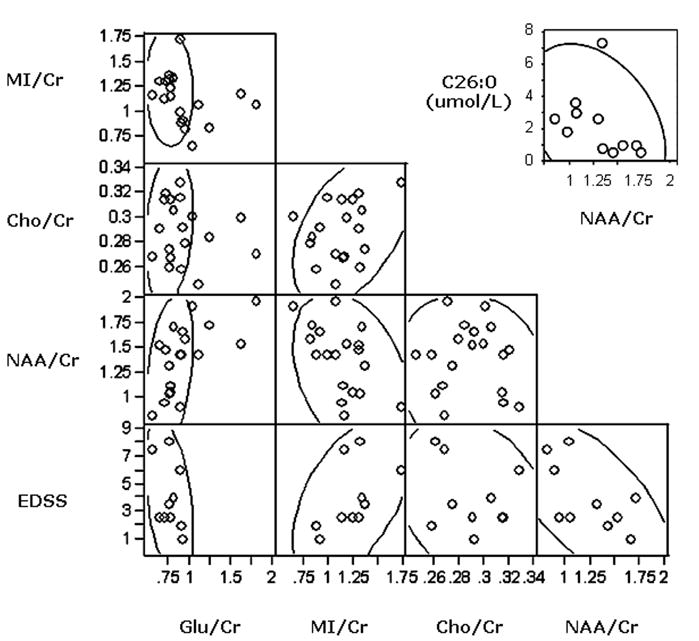
Scatter plot matrix showing interrelationship between global estimates of N acetylaspartate (NAA)/creatine (Cr), Choline (Cho)/Cr, Myo-Inositol (MI)/Cr and Glutamate (Glu)/Cr and clinical disability measures (Expanded Disability Status Scale - EDSS). The scatter points demonstrate a significantly positive correlation between MI/Cr and EDSS (Spearman ρ = 0.66, p = 0.039). We find significantly negative correlations between MI/Cr and NAA/Cr (Spearman ρ = -0.49, p = 0.03) and Glu/Cr (Spearman ρ = 0.55, p = 0.015), respectively. In addition, we find a significantly positive correlation between NAA/Cr and Glu/Cr (Spearman ρ = 0.66, p = 0.002). In the top right corner we show the inverse relationship of plasma VLCFA (C26:0 in umol/L) and global NAA/Cr values in ALD patients (Spearman ρ = -0.67, p = 0.02).
We found an inverse correlation between the patients' plasma VLCFA (absolute C26:0 levels) and their global NAA/Cr (Spearman ρ = -0.67, p = 0.02) (see Figure 4). On the other hand, we do not find any correlations between C26:0 and any of the other metabolic markers (MI/Cr – C26: Spearman ρ = 0.36, p = 0.38; Cho/Cr – C26: Spearman ρ = 0.11, p = 0.7; Glu/Cr – C26: Spearman ρ = -0.52, p = 0.18).
Comment
Proton MR spectroscopic imaging at 7 Tesla was used to study adult patients with X-ALD. Metabolite ratios of NAA/Cr, Cho/Cr, Glu/Cr and MI/Cr were analyzed in both white and gray matter. We hypothesized that adult phenotypes with X-ALD would differ in their neurochemistry, and we have found that among adult X-ALD phenotypes, MI/Cr was 46% higher and Cho/Cr 21% higher in normal appearing white matter of ACALD compared to AMN (p < 0.05). There were no significant differences between AMN and female heterozygotes.
Traditional methods to distinguish adult phenotypes of X-ALD include clinical and biochemical assessment as well as imaging at 1.5 Tesla. However, these methods remain inadequate to explain the dramatic differences in pathology and symptoms severity among ALD patients. We demonstrate that MR imaging at 7 Tesla allows for better visualization of X-ALD lesion architecture, white matter tracts and gray-white matter distinction compared to 1.5 Tesla (Figure 1). Improved SNR and chemical-shift dispersion result in better spectral resolution and more reliable detection of metabolites, such as Glu and MI.
The best correlation with the EDSS, a validated clinical rating scale, was with the MI/Cr ratio (Figure 4). Since microglia produce myo-inositol [14, 15] and ALD protein is highly expressed in glial cells [16], the increased myoinositol may reflect microglial activation and gliosis. Our findings of elevated myoinositol and choline, the latter an established marker of cell membrane turnover and demyelination, further support this notion [9].
Consistent with prior reports [5, 17], NAA was decreased in normal appearing white matter of all adult X-ALD phenotypes, suggesting a tight link between the mutated peroxisome and axonal dysfunction. Interestingly, higher plasma VLCFA levels were associated with lower NAA/Cr. Recent findings in a conditional PEX5 knockout mouse suggest the degree of peroxisomal dysfunction in oligodendrocytes alone may regulate the onset of axonal degeneration [18, 19].
The normal choline levels in patients with axonopathy indicate structural integrity of myelin despite the mutated organelle in the oligodendrocyte. In many neurodegenerative conditions there is a decrease in glutamate associated with neuroaxonal loss [20, 21], and our finding of concurrent decreases in NAA and Glu within white matter of X-ALD patients supports this observation.
A novel finding in our study is that of decreased NAA in cortex of X-ALD patients, which appears greater in male hemizygotes than female heterozygotes, and most pronounced with the occurrence of white matter lesions in males. Although the cytoarchitecture of cerebral cortex generally appears normal in X-ALD, scattered neuronal loss can be seen in gray matter during pathological examination [22]. Dementia, depression and emotional disturbances are common in male hemizygote X-ALD patients [23, 24], and may also be a manifestation of altered cortical metabolism. Unfortunately, EDSS is a crude measure of cognition and careful correlation of neuropsychological function and cerebral metabolism needs to be undertaken.
Neurological abnormalities in female heterozygotes range from severe disability to hyperreflexia and impaired vibration sense. In our study the neurochemistry in female heterozygotes was similar to that of AMN patients, suggesting that the normal X-chromosome may protect against the inflammatory brain disease but not the noninflammatory axonopathy. Prior reports have shown that NAA levels are reduced within the corticospinal tract fibers, suggesting axonal dysfunction [5]. We found a similar trend, although this did not reach significance. Of note, we did not find decreases in NAA/Cr in gray matter, as we found in males with X-ALD.
Despite the advantages at 7 Tesla, the interpretation of 7T MRSI data sets requires care. Voxels closest to the scalp were necessarily excluded due to poor water and lipid suppression as determined by visual inspection of spectra along the edge of the PRESS volume. Further, the quantification of spectral data in the presence of substantial RF excitation field (B1) variations is a challenging task, and in this study we relied on ratios of metabolites to Cr, which, while improving robustness for conditions where the Cr signal is stable, limits the interpretation of the findings in the presence of unknown Cr variations. In childhood ALD, high concentrations of creatine have been reported in brain lesions but not in normal appearing white matter, the subject of our study [10].
This study demonstrates the feasibility of proton MRSI at 7 Tesla and takes advantage of improved signal dispersion and higher signal-to-noise ratio of 7 Tesla compared to lower field. Limitations of our study are the small sample size as well as the limited spatial coverage of regions of interest, which we are addressing with full brain spiral spectroscopic imaging [25]. The expanded coverage of such methods, in combination with segmented high-resolution structural images, will allow us to analyze the tract-specific nature of metabolic abnormalities in X-ALD [26] and obtain improved-quality cortical data.
The utility of MI/Cr as a biomarker in adult X-ALD will require further investigation. Specifically, to determine its disease specificity and predictive ability with early diagnosis of ALD, a study is required that follows male hemizygotes with normal MRI prospectively. How the degree of VLCFA accumulation in plasma contributes to the neurochemical changes in various phenotypes is currently unknown. A better understanding of the regional metabolic impact of VLCFA in brain in various phenotypes will help elucidate this question. Hence, a longitudinal study with sequential 7 Tesla proton MRSI examinations will be necessary to establish the sensitivity of the MI/Cr ratio in predicting disease progression.
Acknowledgments
F.E. takes responsibility for the integrity of the data and the accuracy of the data analysis. Supported by grants NIH 1K08NS52550-01A1, NIH R01 NS050041-01A1, P41RR014075, and the Robert J. Shillman Career Development Chair. We thank Dr. Elkan Halpern for his advice regarding the biostatistics. Further, we thank Drs. Bruce Rosen and Lawrence Wald for their support in facilitating our studies.
Footnotes
Disclosure: The authors have reported no conflicts of interest.
References
- 1.Moser H, Smith K, Watkins P, et al. In: X-linked adrenoleukodystrophy, in The metabolic and molecular bases of inherited disease. Scriver C, editor. McGraw Hill; New York: 2001. pp. 3257–3301. [Google Scholar]
- 2.Moser HW, Loes DJ, Melhem ER, et al. X-Linked adrenoleukodystrophy: overview and prognosis as a function of age and brain magnetic resonance imaging abnormality. A study involving 372 patients. Neuropediatrics. 2000;31:227–39. doi: 10.1055/s-2000-9236. [DOI] [PubMed] [Google Scholar]
- 3.van Geel BM, Assies J, Haverkort EB, et al. Progression of abnormalities in adrenomyeloneuropathy and neurologically asymptomatic X-linked adrenoleukodystrophy despite treatment with “Lorenzo's oil”. J Neurol Neurosurg Psychiatry. 1999;67:290–9. doi: 10.1136/jnnp.67.3.290. [DOI] [PMC free article] [PubMed] [Google Scholar]
- 4.van Geel BM, Bezman L, Loes DJ, et al. Evolution of phenotypes in adult male patients with X-linked adrenoleukodystrophy. Ann Neurol. 2001;49:186–94. doi: 10.1002/1531-8249(20010201)49:2<186::aid-ana38>3.0.co;2-r. [DOI] [PubMed] [Google Scholar]
- 5.Fatemi A, Barker PB, Ulug AM, et al. MRI and proton MRSI in women heterozygous for X-linked adrenoleukodystrophy. Neurology. 2003;60:1301–7. doi: 10.1212/01.wnl.0000059546.15529.cb. [DOI] [PubMed] [Google Scholar]
- 6.Moser AB, Kreiter N, Bezman L, et al. Plasma very long chain fatty acids in 3,000 peroxisome disease patients and 29,000 controls. Ann Neurol. 1999;45:100–10. doi: 10.1002/1531-8249(199901)45:1<100::aid-art16>3.0.co;2-u. [DOI] [PubMed] [Google Scholar]
- 7.Eichler F, Mahmood A, Loes D, et al. Magnetic resonance imaging detection of lesion progression in adult patients with X-linked adrenoleukodystrophy. Arch Neurol. 2007;64:659–64. doi: 10.1001/archneur.64.5.659. [DOI] [PubMed] [Google Scholar]
- 8.Birken DL, Oldendorf WH. N-acetyl-L-aspartic acid: a literature review of a compound prominent in 1H-NMR spectroscopic studies of brain. Neurosci Biobehav Rev. 1989;13:23–31. doi: 10.1016/s0149-7634(89)80048-x. [DOI] [PubMed] [Google Scholar]
- 9.Barker PB, Breiter SN, Soher BJ, et al. Quantitative proton spectroscopy of canine brain: in vivo and in vitro correlations. Magn Reson Med. 1994;32:157–63. doi: 10.1002/mrm.1910320202. [DOI] [PubMed] [Google Scholar]
- 10.Pouwels PJ, Kruse B, Korenke GC, et al. Quantitative proton magnetic resonance spectroscopy of childhood adrenoleukodystrophy. Neuropediatrics. 1998;29:254–64. doi: 10.1055/s-2007-973571. [DOI] [PubMed] [Google Scholar]
- 11.Tzika AA, Ball WS, Vigneron DB, et al. Childhood adrenoleukodystrophy: assessment with proton MR spectroscopy. Radiology. 1993;189:467–80. doi: 10.1148/radiology.189.2.8210375. [DOI] [PubMed] [Google Scholar]
- 12.Wiggins GC, Potthast A, Triantafyllou C, et al. Eight-channel phased array coil and detunable TEM volume coil for 7 T brain imaging. Magn Reson Med. 2005;54:235–40. doi: 10.1002/mrm.20547. [DOI] [PubMed] [Google Scholar]
- 13.Provencher SW. Automatic quantitation of localized in vivo 1H spectra with LCModel. NMR Biomed. 2001;14:260–4. doi: 10.1002/nbm.698. [DOI] [PubMed] [Google Scholar]
- 14.Ross BD, Bluml S, Cowan R, et al. In vivo MR spectroscopy of human dementia. Neuroimaging Clin N Am. 1998;8:809–22. [PubMed] [Google Scholar]
- 15.Broom KA, Anthony DC, Lowe JP, et al. MRI and MRS alterations in the preclinical phase of murine prion disease: association with neuropathological and behavioural changes. Neurobiol Dis. 2007;26:707–17. doi: 10.1016/j.nbd.2007.04.001. [DOI] [PubMed] [Google Scholar]
- 16.Fouquet F, Zhou JM, Ralston E, et al. Expression of the adrenoleukodystrophy protein in the human and mouse central nervous system. Neurobiol Dis. 1997;3:271–85. doi: 10.1006/nbdi.1997.0127. [DOI] [PubMed] [Google Scholar]
- 17.Dubey P, Fatemi A, Barker PB, et al. Spectroscopic evidence of cerebral axonopathy in patients with “pure” adrenomyeloneuropathy. Neurology. 2005;64:304–10. doi: 10.1212/01.WNL.0000149514.13580.84. [DOI] [PubMed] [Google Scholar]
- 18.Kassmann CM, Lappe-Siefke C, Baes M, et al. Axonal loss and neuroinflammation caused by peroxisome-deficient oligodendrocytes. Nat Genet. 2007;39:969–76. doi: 10.1038/ng2070. [DOI] [PubMed] [Google Scholar]
- 19.Aubourg P. Axons need glial peroxisomes. Nat Genet. 2007;39:936–8. doi: 10.1038/ng0807-936. [DOI] [PubMed] [Google Scholar]
- 20.Hattori N, Abe K, Sakoda S, et al. Proton MR spectroscopic study at 3 Tesla on glutamate/glutamine in Alzheimer's disease. Neuroreport. 2002;13:183–6. doi: 10.1097/00001756-200201210-00041. [DOI] [PubMed] [Google Scholar]
- 21.Antuono PG, Jones JL, Wang Y, et al. Decreased glutamate + glutamine in Alzheimer's disease detected in vivo with (1)H-MRS at 0.5 T. Neurology. 2001;56:737–42. doi: 10.1212/wnl.56.6.737. [DOI] [PubMed] [Google Scholar]
- 22.Schaumburg HH, Powers JM, Raine CS, et al. Adrenoleukodystrophy. A clinical and pathological study of 17 cases. Arch Neurol. 1975;32:577–91. doi: 10.1001/archneur.1975.00490510033001. [DOI] [PubMed] [Google Scholar]
- 23.Garside S, Rosebush PI, Levinson AJ, et al. Late-onset adrenoleukodystrophy associated with long-standing psychiatric symptoms. J Clin Psychiatry. 1999;60:460–8. doi: 10.4088/jcp.v60n0708. [DOI] [PubMed] [Google Scholar]
- 24.Rosebush PI, Garside S, Levinson AJ, et al. The neuropsychiatry of adult-onset adrenoleukodystrophy. J Neuropsychiatry Clin Neurosci. 1999;11:315–27. doi: 10.1176/jnp.11.3.315. [DOI] [PubMed] [Google Scholar]
- 25.Adalsteinsson E, Irarrazabal P, Topp S, et al. Volumetric spectroscopic imaging with spiral-based k-space trajectories. Magn Reson Med. 1998;39:889–98. doi: 10.1002/mrm.1910390606. [DOI] [PubMed] [Google Scholar]
- 26.Kim DH, Adalsteinsson E, Spielman DM. Spiral readout gradients for the reduction of motion artifacts in chemical shift imaging. Magn Reson Med. 2004;51:458–63. doi: 10.1002/mrm.20004. [DOI] [PubMed] [Google Scholar]