

Abstract
To examine the molecular details of ligand activation of G-protein coupled receptor (GPCRs), emphasis has been placed on structure determination of these receptors with stabilizing ligands. Here we present the methodology for receptor dynamics characterization of the GPCR human β2 adrenergic receptor bound to the inverse agonist carazolol using the technique of amide hydrogen/deuterium exchange coupled with mass spectrometry (HDX MS). The HDX MS profile of receptor bound to carazolol is consistent with thermal parameter observations in the crystal structure and provides additional information in highly dynamic regions of the receptor and chemical modifications demonstrating the highly complementary nature of the techniques. Following optimization of HDX experimental conditions for this membrane protein, better than 89% sequence coverage was obtained for the receptor. The methodology presented paves the way for future analysis of β2AR bound to pharmacologically distinct ligands as well as analysis of other GPCR family members.
Keywords: β2-adrenergic receptor, G-protein coupled receptor, H/D exchange, mass spectrometry, membrane proteins
Introduction
G-protein coupled receptors (GPCRs) are molecular targets of many therapeutic drugs used in the treatment of a wide range of disorders and diseases 1-3. The prototypic GPCR β2-adrenergic receptor (β2AR) plays a critical role in converting external stimuli into intracellular signals that regulate many cellular processes. β2AR is expressed predominantly in smooth muscle, skeletal muscle and liver and has been shown to be involved in regulation of muscle relaxation, glycogenolysis, gluconeogenesis and potassium uptake 4. Drugs that modulate β2AR have been developed to treat diseases such as asthma 1, 5. Typical of members of the GPCR superfamily, human β2AR contains 413 amino acids composed of seven transmembrane helices, an extracellular N-terminus, and an intracellular C-terminus 1-3. The receptor is activated upon binding of endogenous (catecholamines) or synthetic ligands that modulate receptor-G-protein interaction. Specifically, in the resting state, β2AR associates with G-protein via its intracellular 3rd loop and C-terminus and upon ligand binding, conformational changes likely facilitate the release of G-protein subunits that initiate a subsequent signaling cascade 4. Understanding the structure and conformational dynamics of β2AR is essential to understanding the mechanism of action of natural and synthetic ligands. This structural information will aid in the design and development of functionally selective GPCR modulators.
Recent successes in high resolution x-ray crystallography have revealed the structures of human β2AR in the inverse agonist or inactive form 6-8. These high resolution structures were obtained for the ligand bound form with the insertion of T4-lysozyme domain replacing a highly dynamic third intracellular loop 6-8. While these inactive structures provided significant insight into the structure of GPCRs as well as the molecular details of ligand interaction, questions remain about conformational dynamics, active state structure, and the role of dynamic regions of the receptor. For instance, the N- and C-termini of the receptor, which are subjected to extensive post-translational modifications and are expected to play critical roles in the interaction with signaling molecules, remain largely unresolved by crystallography 6-8. Most proteins are globular in nature and are dynamic molecules that undergo constant flexing and motion. Changes in protein conformation and dynamics are important to molecular recognition and these changes occur during many key biological processes such as ligand binding to receptors. Thus, techniques to study protein structure and dynamics are critical to the understanding of biological processes.
Amide hydrogen/deuterium exchange (HDX) can be used to probe protein dynamics, and is an ideal complement to other structural techniques such as x-ray crystallography9, 10. HDX has increasingly demonstrated its exceptional capability to study the fine dynamic structural changes of large complicated protein systems 11, 12. The exchange rate of an amide hydrogen is influenced significantly by hydrogen bonding and exchange kinetics of an amide hydrogen can be highly reflective of its locations in secondary and tertiary structures 10, 13. The methods of choice for measuring solution phase HDX are nuclear magnetic resonance (NMR) and mass spectrometry 14,15. While NMR offers single amide resolution the technique requires large amounts of protein and the analysis can be limited to relatively small proteins. The coupling of HDX with mass spectrometry affords high sensitivity requiring very low amount of protein with virtually no limit to size or complexity of the protein, and is tolerant of impurities. However, to date, HDX studies have primarily focused on soluble proteins and reports on membrane proteins are very limited 16, 17 with no published comprehensive HDX studies of a GPCR. The lack of HDX reports on membrane proteins is likely due to the technical challenges of analysis of membrane proteins.
HDX MS involves proteolytic digestion of the target protein with acid stable proteases under so called “slow exchange” conditions (low pH and low temperature) to minimize loss of deuterium during digestion and subsequent mass analysis. Unfortunately, like all GPCRs, β2AR contains seven highly hydrophobic transmembrane helices, is very sensitive to pH, and is prone to aggregation in detergent solubilized solution.18 These structural features limit accessibility of protease leading to low digestion efficiency in aqueous solution conditions optimized for HDX studies. Further limiting digestion efficiency under HDX conditions are short digestion times and use of immobilized protease columns. Purification procedures for isolating GPCRs require the presence of detergent to maintain native structure, solubility and functional activity 19 and purified GPCRs often have bound phospholipids, sterols and detergents 6-8. Problematic for HDX MS, many commonly used detergents can interfere with mass spectrometry analysis. Due to their highly polar or charged head groups, detergents can cause ion suppression during the electrospray ionization (ESI) or matrix-assisted laser desorption/ionization (MALDI) process, although non-ionic detergents have been shown to be the least detrimental 20. The non-ionic detergent n-dodecyl-β-D-maltoside (dodecyl maltoside, DDM) has been found to be applicable to most membrane proteins, not only in efficient solubilization and maintaining activity, but also in crystallization 19, 21-23. To further complicate HDX MS analysis GPCRs such as β2AR are potentially heavily post-translational modified with glycosylation, cysteine palmitoylation, phosphorylation, disulfide bonds, and ubiquitination 8, 24-26.
Through careful optimization of a wide range of experimental variables, significantly improved digestion efficiency can be obtained under HDX compatible conditions resulting in excellent sequence coverage. These optimized conditions enabled comprehensive HDX analysis of β2AR bound to the inverse agonist carazolol. This study provides insights into structural dynamics of β2AR and paves the way for comparative HDX studies of β2AR bound with various functional ligands as well as HDX studies of other GPCRs.
Experimental Section
Reagents and chemicals
HPLC grade H2O, D2O (99.9%), acetonitrile, formic acid, iso-propanol, tris-(carboxyethyl)-phosphine hydrochloride (TCEP), iodoacetamide, Tris, NaCl, NaH2PO4, glycerol and anti-FLAG antibody, and horse heart myoglobin were purchased from Sigma-Aldrich (St. Louis, MO). Trifluoroacetic acid (TFA, Sequanal grade) was obtained from Pierce (Rockford, IL). High purity n-dodecyl-β-D-maltoside (DDM) and cholesterol hemisuccinate (CHS) were purchased from Anatrace Inc. (Maumee, OH). PNGase F at 500,000 unit/mL was purchased from New England BioLabs Inc. (Ipswich, MA). The pre-prepared 4-20% tris-glycine gels used in sodium dodecyl sulfate polyacrylamide gel electrophoresis (SDS-PAGE) for Coomassie stain and Western blot were purchased from Invitrogen (Carlsbad, CA). The porcine pepsin-immobilized POROS 20 AL beads (particle size 20 μm) used to pack immobilized pepsin columns were purchased from Applied Biosystems (Foster City, CA).
Expression and purification of β2AR
Human β2AR containing an N-terminal FLAG tag and a C-terminal 10×His tag with E122W and N187E mutations (E130W and N195E in the current sequence shown in Figure S1 due to the 8-residue N-terminal FLAG) 8 and shortened 3IL and C-terminus (amino acid #245-259 and 349-413 were deleted) was expressed in Sf9 insect cells and purified by using immobilized metal affinity chromatography (IMAC) with 50 μM carazolol present. The protein was treated with 1 mg/mL iodoacetamide prior to solubilization to block the solvent-exposed free cysteine residues8. The final purified protein (typically 40-50 μM) with carazolol-bound and was kept in the buffer containing 50 mM Hepes (pH 7.5), 150 mM NaCl, 10% (v/v) glycerol, 0.05% (m/v) DDM, 0.01% (m/v) CHS and 50μM carazolol. The protein concentration was determined with the bicinchroninic acid (BCA™) protein assay kit (Pierce, Rockford, IL) using bovine serum albumin as a reference. Purity of the protein sample was followed using SDS-PAGE and analytical size exclusion chromatography. All sequence numbers cited in the current study referred to the β2AR wild type sequence number shown in Figure S1.
Sequence coverage of β2AR
Unless specified otherwise, the purified protein was diluted to 15 μM for mass spectrometry experiments using the buffer composed of 50 mM Hepes (pH 7.5), 150 mM NaCl, 2% (v/v) glycerol, 0.02% (m/v) DDM (∼3.3 critical micelle concentration (cmc)), 0.01% (m/v) CHS, and H2O. The buffer for HDX on-exchange studies was the same composition except H2O was replaced with D2O (99.9%). Four μL of β2AR protein was mixed by an automated system (described elsewhere 12) with 16 μL of the H2O buffer and then 30 μL of quench solution containing a number of different compositions (all at final pH of 2.2-2.5 prior to pepsin digestion), and digested either online by passing through an immobilized pepsin-coupled column (2 mm i.d. × 20 mm), or offline by incubation with pepsin-coupled bead slurry under room temperature (27.8± 0.5°C at the bench). The digest was then separated by a Agilent (Santa Clara, CA) high-performance liquid chromatography (HPLC) equipped with a C8 trap (2 mm i.d., Thermo Fisher Scientific, San Jose, CA) and C4 column (2 mm i.d. × 50 mm, Thermo Fisher Scientific, San Jose, CA) using a gradient of 45 min, which started with 5% B and linearly increased to 100% B over the next 45 minutes, unless specified otherwise. The mobile phase for the online immobilized pepsin-coupled column is H2O with 0.1% (v/v) TFA and the flow rate is 50 or 200 μL/min. For HPLC, buffer A is H2O containing 0.3% (v/v) formic acid, buffer B is acetonitrile: water at 4:1 (v/v) containing 0.3% (v/v) formic acid, and flow rate is 50 or 200 μL/min. The ESI MS and collision-induced dissociation (CID) tandem mass spectrometry (MS/MS) spectra of the peptides eluted from HPLC were acquired in positive ion mode on a quadrupole linear ion trap mass spectrometer equipped with an ESI source (Thermo Fisher Scientific, San Jose, CA) at capillary temperature of 225 °C and spray voltage of 3.5 kV. Mass spectra were acquired for m/z 300-2000 using a maximum injection time of 75 ms and target value of 3e4. Tandem mass spectra were obtained using data-dependent acquisition with dynamic exclusion where the top five most abundant ions in each scan were selected and subjected to CID. MS/MS spectra were acquired under wide band activation at an activation Q value of 0.25, activation time of 30 ms, normalized collision energy of 35, isolation width of 2.0, target number of 1e4 and maximum injection time of 100 ms unless specified otherwise. Each scan was the average of 3 microscans under normal scan mode in both MS and MS/MS.
All MS/MS spectra were analyzed using the MASCOT program. Searches were run without protein modifications and with modifications such as carboxamidemethyl cysteine, methionine oxidation, phosphorylation, and deglycosylation. Results from all searches against multiple sets of MS/MS data were combined. Peptides included in the peptide set used for HDX had a MASCOT score of 20 or greater. The MS/MS MASCOT search was also performed against a decoy (reverse) sequence and ambiguous identifications were ruled out. The MS/MS spectra of all of the peptide ions from the MASCOT search were further manually inspected and only those verifiable are used in the coverage.
HDX analysis of β2AR
For HDX MS experiments, four μL of β2AR protein was mixed with 16 μL of the D2O buffer (final D2O content was 80%) and incubated at various time intervals at 4°C, before being added to 30 μL of quench solution containing 15mM TCEP, 0.1M NaH2PO4 (HCl, pH 2.4) and 0.02% (m/v) DDM. Deuterated protein was then digested online using the same procedure described above. HPLC (Eksigent, Dublin CA) was performed with a 9.5 min gradient at flow rate of 50 μL/min, and all of the pepsin column, trap and analytical columns applied to HDX-MS experiments were the same as in the MS/MS experiments except that the internal diameters were all decreased to1 mm. The gradient started with 5% B, increased to 15% B over 0.1min, increased to 50% B within 5.4 min, then quickly ramped to 98% within 0.5 min, held for 1.5 min, and dropped back to 5% within 0.1 min. MS was acquired in the range of m/z 300-2000 for 8 min in positive ion mode on an orbi-trap mass spectrometer (Thermo Fisher Scientific, San Jose, CA) equipped with an ESI source operated at capillary temperature of 225 °C and spray voltage of 3.5 kV. Protein and quench solutions, pepsin column, trap and HPLC columns were all kept at 1.0 °C unless specified otherwise. HDX incubation was performed at 4.0 °C for six different time points: 10 s, 30 s, 60 s, 300 s, 900 s and 3600 s. The experiments were performed at random order, and between every two injections, blank injections were made to remove any potential protein carryover from previous runs. Two additional incubations (12±1 hr and 15 hr) were performed in 92% D2O buffer in sealed centrifuge tubes also under 4°C. The t0 data were acquired using the H2O buffer. Data for each on-exchange time point were obtained in four replicates (four individually prepared samples, not four injections of the same sample).
All HDX data were normalized to 100% D2O content (80% D on-exchange buffer for the first 6 time points and 92% D on-exchange buffer for the 12±1 hr and 15 hr time points), corrected for an estimated average deuterium recovery of 70%, and processed using the software HD Desktop 27. Percent deuterium incorporation was plotted versus incubation time in log scale, and the date points were connected through a second order smoothing polynomial. All on-exchange plots used in the analysis of β2AR are shown in Supplemental Figure S2. The HDX profile of carazolol-bound β2AR was mapped to its own amino acid sequence and also to the crystal structure of human β2AR T4L monomer which is carazolol-bound and starts with W40 (PDB: 2RH1) 8.
De-glycosylation of β2AR through PNGase F digestion
The purified β2AR was incubated with PNGase F at 4°C or 37°C for 1 hr (PNGase F final concentration at 50 unit/μL) prior to mass spectrometry experiments (MS/MS and HDX t0 MS). The effect of PNGase F digestion was monitored by SDS-PAGE and Western blot. HDX was performed on the protein following PNGase F treatment and separation using fast protein liquid chromatography (FPLC) at 4°C.
SDS-PAGE and western blot of β2AR
β2AR-460 proteins with and without PNGase F treatment were mixed with NuPAGE LDS sample buffer, and loaded onto 10% Bis-Tris gels and stained with SimplyBue™ SafeStain (Invitrogen), or transferred to a membrane for Western blot using anti-FLAG antibody at 1:1000 (v:v) dilution.
Results And Discussion
Optimization of protein sequence coverage – detergent, reductant, and HPLC parameters
To obtain a comprehensive HDX profile of β2AR, procedures for analysis were progressively optimized directed by insights gained from crystal structure. Consideration was also made for putative posttranslational modifications, and considering the physical characteristics of membrane proteins. Our initial experiments used a quench solution of 3 M urea and 1 % TFA, however very limited sequence coverage was obtained for β2AR (∼25%). In an effort to improve sequence coverage various experimental parameters were systematically optimized. Parameters optimized included protein concentration, various quench buffers (different combinations of denaturing and reducing reagents at various concentrations), temperature and length of digestion, HPLC conditions, MS acquisition settings (number of micro scans, max injection time), and the application of a static exclusion ion list including several recurrent low m/z non-peptide ions for the MS/MS experiments (see Table 1).
Table 1.
Experimental variables probed to improve the sequence coverage of β2AR
| [β2AR_460] (μM) | Pepsin online/offline; dig. temp | Urea_TFA | TCEP | NaPi pH2.40 HCl/TFA | DDM(m/v) | MS, MS/MS μscan; max inj time | Rej. list 5 m/z values) | HPLC flow rate (μL/min) | MASCOT(>20) coverage | CCC loop covered? | MS spectra ok? | ||
|---|---|---|---|---|---|---|---|---|---|---|---|---|---|
| 24.8 μM | Online; RT# | 3 M_1% | / | / | / | default* | / | 200 | 34% | no | yes | ||
| 24.8 μM | Online; RT | 4 M_1% | / | / | / | default | / | 200 | 51% | no | yes | ||
| 24.8 μM | Online; RT | 5 M_1% | / | / | / | default | / | 200 | 48% | no | yes | ||
| 24.8 μM | Online; RT | 6 M_1% | / | / | / | default | / | 200 | 45% | no | yes | ||
| 24.8 μM | Online; RT | 7 M_1% | / | / | / | default | / | 200 | 44% | no | yes | ||
| 24.8 μM | Online; RT | 8 M_1% | / | / | / | default | / | 200 | 42% | no | yes | ||
| 49.6 μM | Offline; 30 min 37°C | 3 M_1% | / | / | / | default | / | 200 | 45% | no | yes | ||
| 16.5 μM | Online; RT | 4 M_1% | / | / | / | MS 1 μscan | / | 50 | 21% | no | yes | ||
| 16.5 μM | Online; RT | 4 M | 0.5 M | / | / | MS 1 μscan | / | 50 | 0% | no | no | ||
| 16.5 μM | Online; RT | 4M_1% | / | / | 0.02% | MS 1 μscan | / | 50 | 27% | no | yes | ||
| 16.5 μM | Online; RT | / | / | 0.1 M NaPi HCL | 0.02% | MS 1 μscan | / | 50 | 45% | no | yes | ||
| 16.5 μM | Online; RT | 4 M_1% | / | / | / | default | / | 50 | 21% | no | yes | ||
| 16.5 μM | Online; RT | 4 M_1% | / | / | / | 1μscan 200ms | / | 50 | 20% | no | yes | ||
| 16.5 μM | Online; RT | 4 M_1% | / | / | / | default | yes | 200 | 25% | no | yes | ||
| 16.5 μM | Online; RT | 4 M | 0.5 M | / | / | default | yes | 200 | 27% | yes | no | ||
| 16.5 μM | Online; RT | 4M_1% | / | / | 0.02% | default | yes | 200 | 35% | no | yes | ||
| 16.5 μM | Online; RT | / | / | 0.1 M NaPi HCl | 0.02% | default | yes | 200 | 46% | no | yes | ||
| 16.5 μM | Online; RT | / | / | 0.1 M NaPi TFA | 0.02% | default | yes | 200 | 42% | no | yes | ||
| 24.8μM | Online; RT | / | / | 0.1 M NaPi HCl | 0.02% | default | / | 200 | 41% | no | yes | ||
| 24.8 μM | Online; RT | / | / | 0.1 M NaPi HCl | 0.02% | default | yes | 200 | 48% | no | yes | ||
| 24.8 μM | Offline; 30 min 37°C | / | / | 0.1 M NaPi HCl | 0.02% | default | yes | 200 | 55% | no | yes | ||
| 16.5 μM | Online; RT | / | 0.2 M | 0.1 M NaPi HCl | 0.02% | default | yes | 200 | 37% | yes | no | ||
| 16.5 μml | Online; RT | / | / | 0.1 M NaPi HCl | 0.02% | default | yes | 200 | 55% | yes | yes | ||
| 16.5 μM | Online; RT | / | 0.2 M | / | 0.02% | default | yes | 200 | 46% | yes | no | ||
| 16.5 μM | Online; RT | / | / | 0.1 M NaPi HCl | 0.02% | default | yes | 200 | 36% | no | yes | ||
| 16.5 μM | Online; RT | / | 2 mM | 0.1 M NaPi HCl | 0.02% | default | yes | 200 | 50% | only one C | yes | ||
| 16.5 μM | Online; RT | / | 5 mM | 0.1 M NaPi HCl | 0.02% | default | yes | 200 | 51% | yes | yes | ||
| 16.5 μM | Online; RT | / | 10 mM | 0.1 M NaPi HCl | 0.02% | default | yes | 200 | 58% | yes | yes | ||
| 16.5 μM | Online; RT | / | 20 mM | 0.1 M NaPi HCl | 0.02% | default | yes | 200 | 49% | yes | yes | ||
| 16.5 μm | Online; RT | / | / | 0.1 M NaPi HCl | 0.02% | default | yes | 200 | 34% | no | yes | ||
| [B2AR_460] (μM) | Pepsin online/offline; dig. temp | Urea_TFA | TCEP | NaPl pH2.40 HCL/TFA | DDM (m/v) | MS, MS/MS μscan; max inj time | Rej. list (5 m/z values) | HPLC flow rate (μL/min) | MS spectra ok? | MASCOT (>20) coverage | CCC loop covered? | Search with Carboxamidyl methyl Cys (Cap-C) | Search with Cap-C and deglycosylation |
| 15 μM | Online; RT | 4M_1% | / | / | / | default | yes | 50 | yes | 35% | none |  |
|
| 15 μM | Online; RT | / | 10 mM | 0.1 M NaPi HCL | 0.02% | default | yes | 50 | yes | 65% | only one C |  |
 |
| 15 μM | Online; RT | / | 20 mM | 0.1 M NaPi HCl | 0.02% | default | yes | 50 | yes | 64% | yes |  |
 |
default represents MS: 3 uscan_75 ms, MS/MS: 3 uscan_100ms
RT was 27.8 + 0.5 °C at LTQ bench
During optimization of HDX experimental parameters, various protein concentrations were considered. As expected, 25 μM β2AR afforded higher sequence coverage than 16 μM, indicating that the digestion efficiency is not limited by the digestion capacity of the pepsin column (Table 1). Using the typical HDX quench solutions composed primarily of high concentrations of urea and 1% (v/v) TFA, 11, 12 poor sequence coverage was obtained for all concentrations of urea tested (3 M -8 M) with 4 M urea providing the highest coverage. Also, without reductant, no peptides were observed from regions in proximity to the disulfide bonds. Although urea is usually considered to denature proteins making them more susceptible to proteases, the reagent was either not efficient at denaturing the membrane protein β2AR or was unable to prevent aggregation at the low pH conditions of the digestion step 28. Use of quench solutions composed of 0.1M NaH2PO4 (pH 2.4)/0.02% DDM consistently afforded higher coverage than quench buffers containing urea.
The crystal structure of β2AR revealed two disulfide bonds in β2AR (corresponding to C106-C191 and C184 - C190 in β2AR) and palmitoylation of C341. Out of the total 11 cysteine residues, three cysteine residues (C77, C265 and C327) were determined to be present predominantly carboxamidomethylated as a result of prior iodoacetamide treatment (Supplemental Table S1). Peptides containing unmodified C265 and C327 were also detected but at low abundance. Consistent with the crystal structure, C265 was noted to be modified with an acetamide group in the electron density maps. These results suggested that these three cysteines are likely reduced and are readily accessible to the iodoacetamide treatment. Peptides containing cysteines that are involved in disulfide bonds will only be detected after exposure of protein to reductant. To improve coverage in proximity of disulfide bonds various reducing conditions were considered. The reductant TCEP has previously been applied in HDX studies to reduce disulfide bonds under acidic conditions and is typically used at high concentrations (1 M). 11, 29 However, high concentrations of TCEP were shown here to yield poor peptide sequence coverage (Table 1). Upon investigation, high concentrations of TCEP (> 200 mM) resulted in mass spectra dominated by clusters of peaks formed by adducts of TCEP throughout most of the chromatographic gradient (data not shown) thus interfering with peptide identification. The interference results from overlapping ions, suppression of ionization, and filling the ion trap with chemical noise. In addition, the highly ionic nature of TCEP might have caused the membrane protein to aggregate or precipitate prior to peptic digestion. Although the sequence coverage was poor, the region of I182-F193 (INCYAEETCCDF) in the extracellular loop of β2AR, previously shown in crystal structures to contain one and a half disulfide bonds (C106 with C191, and C184 with C190) 7, 8 was observed only when TCEP was used, confirming that this region is disulfide bonded in the protein construct used here. Upon further investigation of the β2AR crystal structures (PDB: 3D4S and 2RH1) indicate that this region is in the solvent exposed extracellular loop (Figures 3 and S1), suggesting that perhaps low concentrations of TCEP might be sufficient to reduce this disulfide bond. Thus, addition of TCEP to the quench solution (0.1 M NaH2PO4 (HCl, pH 2.40) 0.02% (m/v) DDM) was tested at various concentrations (0, 2, 5, 10, 20, 200 and 500 mM). Results displayed in Table 1 demonstrate that incorporation of TCEP at concentrations as low as 5 mM level is sufficient to reduce the disulfide bonds in β2AR and as concentrations of TCEP reached 20 mM, peptide sequence coverage started to decrease. Optimal TCEP concentration was determined to be in the range of 10-15 mM, and 15 mM was used in the HDX studies presented here. Unfortunately, peptides containing C116 and C285 were not observed under all conditions employed.
Figure 3.
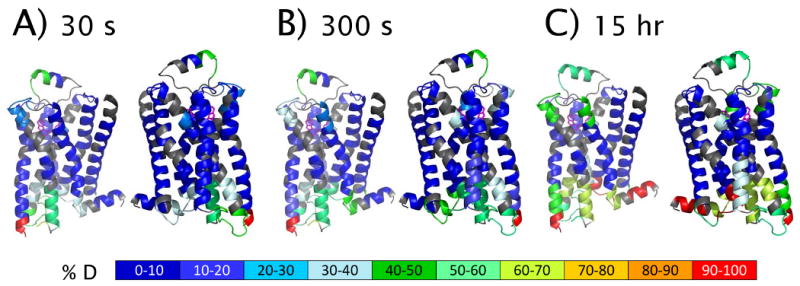
HDX profile of carazolol-bound β2AR mapped to a model derived from the 3-D crystal structure of β2AR T4L (PDB: 2RH1) after exchange time of 30 s (A), 300 s (B) and 15 hr (C). Two views are represented for each timepoint. Each pair corresponds to rotation through 180°. The structure model was derived from 2RH1 with removal of T4L amino acids to reflect the construct used for HDX studies. All non-protein molecules were removed with the exception of carazolol. Gray cartoons represent the sequences not presented in the HDX profile.
The use of DDM at 0.02% m/v (∼3 cmc) in quench solution consistently afforded improved sequence coverage under all conditions suggesting that keeping the membrane protein soluble and stable prior to and during digestion, is important to obtaining high sequence coverage. The use of DDM in the quench buffer may also aid the solubilization of extremely hydrophobic peptides generated during peptic digestion. Interestingly, DDM eluted near the end of the HPLC gradient as a single sharp peak, indicating its high purity, and resulted in minimal interference of β2AR peptides. DDM formed predominantly protonated dimeric ions with minimal protonated monomer or cationic adduct formation observed. These results suggest that, in contrast to protease digestion of soluble proteins, digestion of highly hydrophobic membrane proteins requires careful maintenance of protein solubility in addition to efficient denaturation. While denaturation involves alteration of the protein tertiary structure, partial or complete protein aggregation may occur resulting in poor digestion efficiency by limiting the access of the protease to cleavage sites.
Several mass-spectrometry-compatible detergents that involve cleaving the detergent into smaller moieties prior to mass spectrometry analysis have recently been applied to improving protein analysis 30, 31. However, some types of the cleavable detergents are ionic and have been shown to cause precipitation of purified membrane proteins. In addition, the time required to cleave these detergents introduces an undesirable time window for back exchange. Each membrane protein is unique, and its structure, stability and activity are highly sensitive to the properties of a detergent 19. For structural studies including HDX, it is essential that the detergent used during purification and analysis does not alter the protein's structure and stability. The evidence that DDM, a detergent proven to maximally maintain the structure and activity of β2AR 6-8, can significantly improve the digestion efficiency without causing appreciable interference in the mass spectrometer, makes the use of cleavable detergents unnecessary for HDX studies of β2AR.
Effects of temperature and length of digestion time were optimized by comparing sequence coverage and deuterium retention. Briefly, online digestion using immobilized pepsin-coupled column at room temperature was compared to offline digestion using pepsin-coupled beads slurry at 37 °C for 30 min, and online digestion at 1 °C and room temperature (27 °C) using t0 MS (Table 1). Not unexpectedly, these results demonstrate that digestion for longer time at higher temperature yield higher sequence coverage (offline 37 °C for 30 min vs. online at room temperature for less than one minute). However, it is important to note that these digestion conditions had minimal impact on deuterium retention. Using myoglobin as a control, no appreciable difference in deuterium recovery was observed when the pepsin-coupled column was held at 1°C or 22°C.
Both a C4 and a C8 analytical columns were chosen in conjunction with a C8 trap column to ensure the recovery of the hydrophobic components within the gradient used for HDX 32. Using the C8 trap column and C4 or C8 column, peptides were eluted within the 9.5 min HPLC gradient. Importantly, under these conditions DDM eluted as a narrow well defined peak just prior to the end of the gradient. In addition, intact diacylglycerolphospholipids isolated along with β2AR eluted after the DDM peak. Nearly all of the peptides are each found only at a single retention time range, suggesting that aggregation of protein or peptide in the eluted solution was minimal. This suggested that inclusion of detergents in the HPLC mobile phase is not required.
In initial MS/MS analysis of β2AR under HDX conditions, sequence coverage of helix 1 and helix 3 was minimal. These regions of the protein are very hydrophobic and contain multiple pepsin cleavage sites 33, suggesting that under HDX conditions, this region would only be represented by several small hydrophobic peptides. In addition to pepsin treatment, other acid stable proteases (fungal XIII and XVIII) were tested but failed to improve sequence coverage in this region. Thus, in an effort to improve detection of these peptides, the MS/MS experiment was run with an extended 120 min gradient. This method improved sequence coverage to 89% (Figure 2). Changing the MS/MS selection from top five ions to top 12 ions during the 120 min gradient did not result in any further improvement in sequence coverage, suggesting that the extended gradient afforded efficient separation of the peptic peptides.
Figure 2.
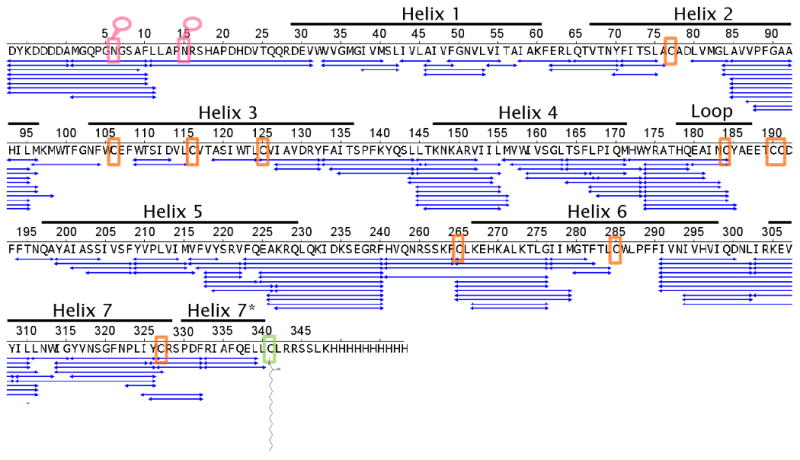
Peptide sequence map showing the MS/MS and MS verified coverage of carazolol-bound β2AR obtained under experimental conditions used in HDX experiments: 15 μM deglycosylated β2AR digested online using the immobilized pepsin column at room temperature (22 °C) and the quench solution containing 0.1 M NaPi_HCl (pH 2.4) 0.02% (m/v) DDM and 10-15 mM TCEP. Pink box dictates sites of N-glycosylation. Orange box indicates a cysteine residue (see Supplemental Table 1). Green box dictates site of protein palmitoylation.
Optimization of protein sequence coverage – mass spectrometer settings
Application of a precursor ion reject list containing five recurrent abundant precursor ions in data-dependent acquisition improved the coverage of identified peptides (Table 1). Blocking these abundant non-peptide ions allowed the less abundant peptide ions to be selected for MS/MS analysis. The reject list was applied in addition to the dynamic exclusion. Increasing the maximum ion injection time for MS/MS experiments while keeping the target number unchanged can potentially enhance the fragment ion abundance in MS/MS spectrum by allowing the precursor ions more time to fill the trap to reach the target number before they are fragmented and scanned out to the detector. However, increasing the maximum injection time for MS/MS acquisition from 100 ms to 200 ms did not improve sequence coverage, suggesting that failing to identify peptides from the uncovered sequence is not due to their low fragmentation efficiency or low precursor ion abundance. Peptides not observed were either not formed efficiently during digestion and or their abundance was not sufficient to trigger MS/MS. It is also possible that the peptides are formed but cannot be trapped with the HPLC columns and chromatography conditions employed here. The combined optimal HDX experimental conditions were determined to be use of quench buffer of 0.1 M NaH2PO4 (HCl, pH 2.40) 0.02% (m/v) DDM, offline digestion at 37°C for 30min of 25 μM β2AR.
Optimization of protein sequence coverage – protein modifications
Based on the homology with other seven transmembrane-helix GPCRs, 26, 32, 34 glycosylation and phosphorylation of the N-terminus of β2AR was expected. These modifications have been reported in human β2AR using biochemical and proteomic approaches, and the phosphorylation was found to be regulated by ligand binding 25. Initial MS/MS studies of β2AR failed to detect peptic peptides from the N-terminus and transmembrane helix 1, even though this region of the protein is extracellular and should be accessible to protease. As this region of the protein contains two putative glycosylation sites, N6 and N15 25, 26, 32, 34, 35, the protein was treated with PNGase F to remove N-glycosylation of asparagines. Western blot analysis of β2AR following 1 hr of PNGase F treatment (Figure 1) clearly demonstrates effective removal of sugars. No difference was observed between the 4°C and 37°C treatments. MS/MS analysis of β2AR following PNGase F treatment lead to the identification of peptides originating from the N-terminus (residues 1-19), confirming that β2AR was heavily glycosylated.
Figure 1.
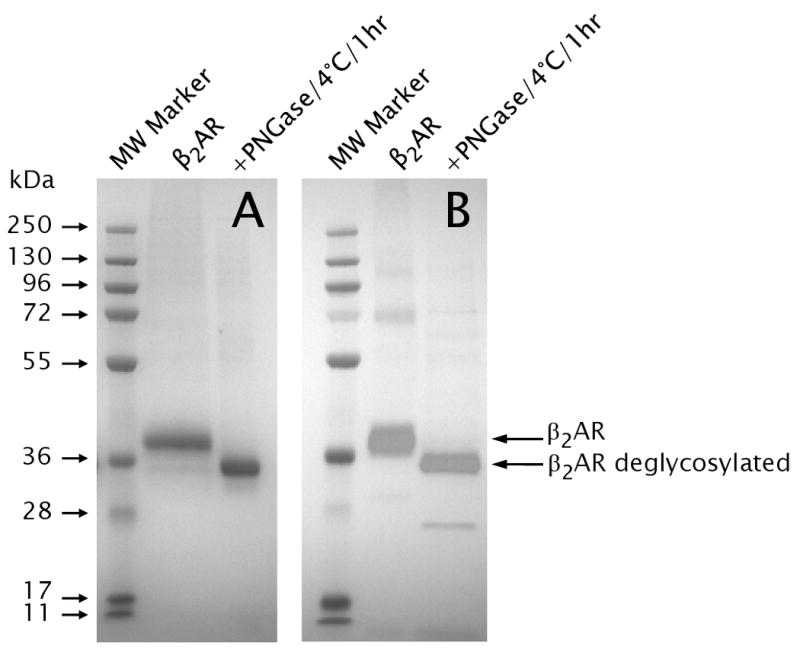
Western blot analysis of carazolol-bound β2AR_460 after PNGase F incubation at 4°C for 1 hour, probed by using anti-FLAG (A), following separation by SDS-PAGE gel 10% Bis-Tris stained by SimplyBlue Safestain (B).
Further posttranslational modifications were considered in an effort to improve sequence coverage. Analysis of the crystal structure of β2AR shows that C334 is palmitoylated. However, in all MS and MS/MS runs under HDX conditions no peptic peptides were detected that corresponded to C334 as either unmodified or palmitoylated even though the palmitoyl group was observed in the crystal structure. Thus, this region of the receptor was undetected in the HDX experiments described below. Lastly, β2AR contains several phosphorylation sites 25 although the β2AR protein material made in sf9 cells are not expected to be phosphorylated under the existing conditions. MASCOT analysis of all MS/MS spectra confirmed the absence of phosphorylated residues. Finally, MASCOT analysis of all MS/MS spectra where methionine was considered as sulfoxide or sulfone did not result in an improvement of β2AR sequence coverage, suggesting that the methionine oxidation is minimal.
HDX profile of β2AR bound to carazolol
To visualize the dynamics of β2AR, HDX data obtained at 30 s, 300 s and 15 h were overlaid onto a structure model derived from the crystal structure of β2AR T4L bound to carazolol (PDB: 2RH1) as shown in Figure 3. The structure model was derived from PDB: 2RH1 with removal of T4L amino acids to reflect the construct used for HDX studies. All non-protein molecules were removed with the exception of bound carazolol. A comprehensive HDX profile of carazolol-bound β2AR is presented in Figure 4A. Deuterium incorporation versus time (log scale) for several representative peptides are shown in Figure 4B (see Figure S2 for all plots). As illustrated in Figure 3A, significant protection to exchange was observed for all transmembrane helices throughout the entire time course monitored (15 h). The highest degree of protection to exchange was detected toward the core of these helices, while the linkages between helices displayed moderate exchange kinetics. Peptides representative of the third cytoplasmic loop at the C-terminus of helix 5 (3rd intracellular loop) demonstrated the most rapid exchange kinetics. This is the region of β2AR that was replaced with T4L to facilitate crystallization and also the loop region known to interact with G-alpha. Peptides representative of the N-terminus of the receptor also exhibited rapid exchange kinetics. The short helical loop between helix4 and helix 5 (2nd extracellular domain) displayed an intermediate exchange rate that is faster than the transmembrane helices but slower than the intra-helical linkages. This observation is interesting since the rhodopsin 2nd extracellular loop region covers the access to the retinal binding site in the rhodopsin structure where retinal undergoes a cis to trans isomerization instead of retinal coming on and off. 36 In contrast to the β2AR structure and the HDX data, the 3rd extracellular loop that contains an ordered short helix may be a lid that is capable of moving over and away from the ligand binding site in different conformational states.
Figure 4.
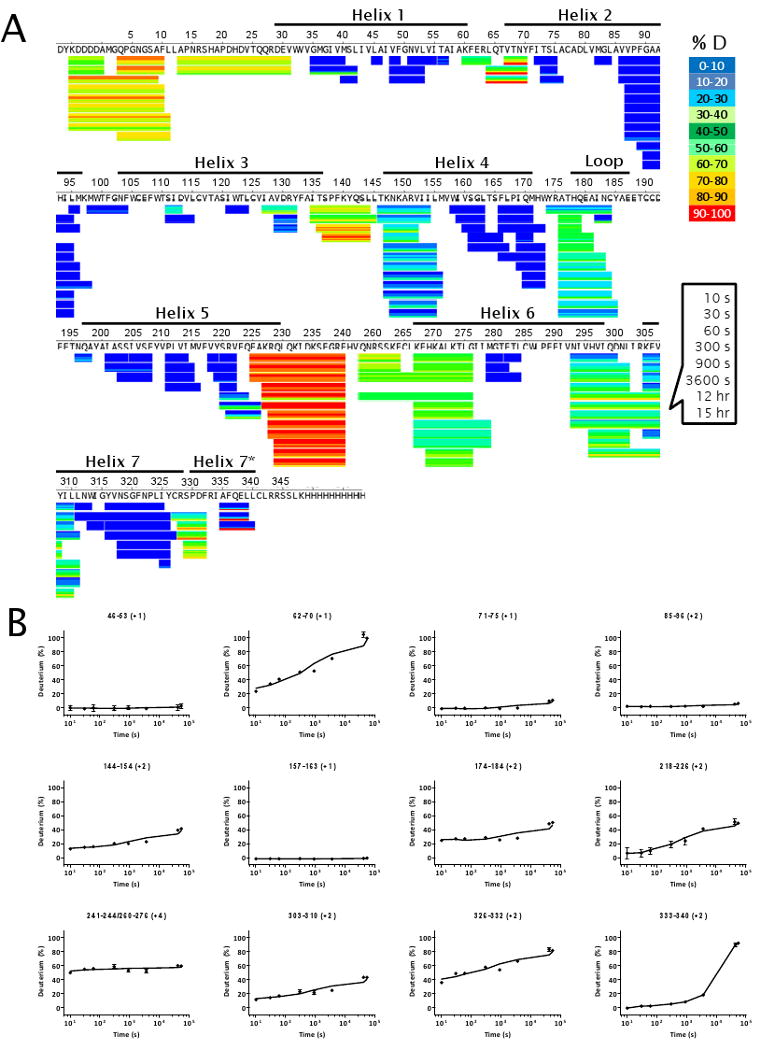
HDX profile of deglycosylated β2AR mapped to its sequence after exchange time of 10 s, 30 s, 60 s, 300 s, 900 s, 3600 s, 12 h and 15 h and discarding the first two amino acid residues at the N-terminus of each peptide (A), and graphs of %D as a function of exchange time in log scale for selected peptide ions shown in panel A (B). The error bars in panel B were plotted as the standard deviation of four independent replicates, although in some cases the error bars are too small to be visible.
Conclusions
Previously we have described a robust HDX platform that provides comprehensive and reproducible analysis of proteins such as nuclear receptors, enzymes, and matrix metalloproteases 12. Using this HDX platform we uncovered a novel mechanism for partial agonist activation of the nuclear receptor PPARγ, unique binding modes of natural and synthetic estrogens on ERα and ERβ, and substrate binding site on MMP1 12, 37-40. Here we demonstrate the ability to determine which regions of the integral membrane β2-adrenergic G-protein coupled receptor are more dynamic than other regions of the membrane protein. Although for membrane proteins, the regions of flexibility might seem obvious, the results presented here highlight a number of dynamic secondary elements being observed in relatively small extra- or intracellular loops indicating the functional importance of these regions. While analysis of β2AR with previously optimized conditions resulted in less than ideal sequence coverage, optimization of several experimental parameters and by consideration of the sequence and structure of the receptor, sequence coverage of β2AR was significantly improved while maintaining HDX compatible conditions. Following optimization, excellent sequence coverage was obtained spanning the entire β2AR structure with few exceptions. Importantly, sequence coverage was obtained for regions that were unresolved in the crystal structures and these highly dynamic regions of the receptor are likely important to receptor function such as ligand recognition and receptor signaling. The improved methodology presented here enabled effective and comprehensive HDX characterization of human β2AR bound to the inverse agonist carazolol. A great deal of insight on GPCR dynamics will come from differential HDX analysis of different ligands bound such as comparison of agonist, antagonists, and inverse agonists and observing the changes in dynamics relative to the varying functional states of the receptor. The methodology presented paves the way for future analysis of other GPCR family members.
Supplementary Material
Table S1. Summary of identification of cysteine residues in carazolol-bound β2AR.
Figure S1. Amino acid sequence of β2AR used in this study.
Figure S2. Comprehensive graphs of %D as a function of exchange time in log scale for all of the peptide ions verified by both MS/MS and MS and plotted in Figure 3A. * represents peptides containing carboxamidomethylated cysteine residues.
Acknowledgments
The work is supported by GM084041 (X.Z., P.R.G., M.J.C., B.D.P) and NIH Roadmap Initiative grant P50 GM073197 (E.Y.T.C., R.C.S.).
References
- 1.Hanson MA, Stevens RC. Structure (Cambridge, MA, United States) 2009;17:8–14. [Google Scholar]
- 2.Kroeze WK, Sheffler DJ, Roth BL. Journal of Cell Science. 2003;116:4867–4869. doi: 10.1242/jcs.00902. [DOI] [PubMed] [Google Scholar]
- 3.Conn PJ, Christopoulos A, Lindsley CW. Nature Reviews Drug Discovery. 2009;8:41–54. doi: 10.1038/nrd2760. [DOI] [PMC free article] [PubMed] [Google Scholar]
- 4.Golan DE, T AH, Jr, Armstrong EJ, Armstrong AW. Principles of pharmacology: The pathophysiologic Basis of Drug Therapy. 2nd. Lippincott Williams & Wilkins; Baltimore, MD: 2008. [Google Scholar]
- 5.Penn RB. Proceedings of the National Academy of Sciences. 2009;106:2095–2096. doi: 10.1073/pnas.0812935106. [DOI] [PMC free article] [PubMed] [Google Scholar]
- 6.Rosenbaum DM, Cherezov V, Hanson MA, Rasmussen SG, Thian FS, Kobilka TS, Choi HJ, Yao XJ, Weis WI, Stevens RC, Kobilka BK. Science. 2007;318:1266–1273. doi: 10.1126/science.1150609. [DOI] [PubMed] [Google Scholar]
- 7.Cherezov V, Rosenbaum DM, Hanson MA, Rasmussen SG, Thian FS, Kobilka TS, Choi HJ, Kuhn P, Weis WI, Kobilka BK, Stevens RC. Science. 2007;318:1258–1265. doi: 10.1126/science.1150577. [DOI] [PMC free article] [PubMed] [Google Scholar]
- 8.Hanson MA, Cherezov V, Griffith MT, Roth CB, Jaakola VP, Chien EYT, Velasquez J, Kuhn P, Stevens RC. Structure (Cambridge, MA, United States) 2008;16:897–905. doi: 10.1016/j.str.2008.05.001. [DOI] [PMC free article] [PubMed] [Google Scholar]
- 9.Englander SW. Journal of the American Society for Mass Spectrometry. 2006;17:1481–1489. doi: 10.1016/j.jasms.2006.06.006. [DOI] [PMC free article] [PubMed] [Google Scholar]
- 10.Katta V, Chait BT, Carr S. Rapid Commun Mass Spectrom. 1991;5:214–217. doi: 10.1002/rcm.1290050415. [DOI] [PubMed] [Google Scholar]
- 11.Bruning JB, Chalmers MJ, Prasad S, Busby SA, Kamenecka TM, He Y, Nettles KW, Griffin PR. Structure (Cambridge, MA, United States) 2007;15:1258–1271. doi: 10.1016/j.str.2007.07.014. [DOI] [PubMed] [Google Scholar]
- 12.Chalmers MJ, Busby SA, Pascal BD, He Y, Hendrickson CL, Marshall AG, Griffin PR. Analytical chemistry. 2006;78:1005–1014. doi: 10.1021/ac051294f. [DOI] [PubMed] [Google Scholar]
- 13.Cravello L, Lascoux D, Forest E. Rapid Commun Mass Spectrom. 2003;17:2387–2393. doi: 10.1002/rcm.1207. [DOI] [PubMed] [Google Scholar]
- 14.Shimada I. Nuclear Magnetic Resonance of Biological Macromolecules, Part C. 2005;394:483–+. [Google Scholar]
- 15.Engen JR, Smith DL. Anal Chem. 2001;73:256A–265A. doi: 10.1021/ac012452f. [DOI] [PubMed] [Google Scholar]
- 16.Busenlehner LS, Salomonsson L, Brzezinski P, Armstrong RN. Proceedings of the National Academy of Sciences. 2006;103:15398–15403. doi: 10.1073/pnas.0601451103. [DOI] [PMC free article] [PubMed] [Google Scholar]
- 17.Busenlehner LS, Branden G, Namslauer I, Brzezinski P, Armstrong RN. Biochemistry. 2008;47:73–83. doi: 10.1021/bi701643a. [DOI] [PubMed] [Google Scholar]
- 18.White SH, Ladokhin AS, Jayasinghe S, Hristova K. Journal of Biological Chemistry. 2001;276:32395–32398. doi: 10.1074/jbc.R100008200. [DOI] [PubMed] [Google Scholar]
- 19.Garavito RM, Ferguson-Miller S. J Biol Chem. 2001;276:32403–32406. doi: 10.1074/jbc.R100031200. [DOI] [PubMed] [Google Scholar]
- 20.Cristoni S, Bernardi LR. Mass Spectrom Rev. 2003;22:369–406. doi: 10.1002/mas.10062. [DOI] [PubMed] [Google Scholar]
- 21.Thompson DA, Suarez-Villafane M, Ferguson-Miller S. Biophys J. 1982;37:285–293. doi: 10.1016/S0006-3495(82)84677-8. [DOI] [PMC free article] [PubMed] [Google Scholar]
- 22.le Maire M, Champeil P, Møller JV. Biochimica et Biophysica Acta, Biomembranes. 2000;1508:86–111. doi: 10.1016/s0304-4157(00)00010-1. [DOI] [PubMed] [Google Scholar]
- 23.Qin L, Hiser C, Mulichak A, Garavito RM, Ferguson-Miller S. Proc Natl Acad Sci U S A. 2006;103:16117–16122. doi: 10.1073/pnas.0606149103. [DOI] [PMC free article] [PubMed] [Google Scholar]
- 24.Marchese A, Benovic JL. Methods in Molecular Biology (Totowa, NJ, United States) 2004;259:299–305. doi: 10.1385/1-59259-754-8:299. [DOI] [PubMed] [Google Scholar]
- 25.Trester-Zedlitz M, Burlingame A, Kobilka B, Von Zastrow M. Biochemistry. 2005;44:6133–6143. doi: 10.1021/bi0475469. [DOI] [PubMed] [Google Scholar]
- 26.Li J, Edwards PC, Burghammer M, Villa C, Schertler GFX. Journal of Molecular Biology. 2004;343:1409–1438. doi: 10.1016/j.jmb.2004.08.090. [DOI] [PubMed] [Google Scholar]
- 27.Pascal BD, Chalmers MJ, Busby SA, Griffin PR. Journal of the American Society for Mass Spectrometry. 2009;20:601–610. doi: 10.1016/j.jasms.2008.11.019. [DOI] [PMC free article] [PubMed] [Google Scholar]
- 28.Lim WK, Rösgen Jr, Englander SW. Proceedings of the National Academy of Sciences. 2009;106:2595–2600. doi: 10.1073/pnas.0812588106. [DOI] [PMC free article] [PubMed] [Google Scholar]
- 29.Yan X, Zhang H, Watson J, Schimerlik MI, Deinzer ML. Protein Science. 2002;11:2113–2124. doi: 10.1110/ps.0204402. [DOI] [PMC free article] [PubMed] [Google Scholar]
- 30.Chen EI, McClatchy D, Park SK, Yates JR., III Analytical Chemistry (Washington, DC, United States) 2008;80:8694–8701. doi: 10.1021/ac800606w. [DOI] [PMC free article] [PubMed] [Google Scholar]
- 31.Chen EI, Cociorva D, Norris JL, Yates JR., III Journal of Proteome Research. 2007;6:2529–2538. doi: 10.1021/pr060682a. [DOI] [PMC free article] [PubMed] [Google Scholar]
- 32.Roos M, Soskic V, Poznanovic S, Godovac-Zimmermann J. J Biol Chem. 1998;273:924–931. doi: 10.1074/jbc.273.2.924. [DOI] [PubMed] [Google Scholar]
- 33.Yoshitomo Hamuro SJC, Molnar Kathleen S, Tuske Steven J, Morrow Jeffrey A. Rapid Communications in Mass Spectrometry. 2008;22:1041–1046. doi: 10.1002/rcm.3467. [DOI] [PubMed] [Google Scholar]
- 34.Papac D, Thornburg K, Bullesbach E, Crouch R, Knapp D. J Biol Chem. 1992;267:16889–16894. [PubMed] [Google Scholar]
- 35.Pepinsky RB, Zeng C, Wen D, Rayhorn P, Baker DP, Williams KP, Bixler SA, Ambrose CM, Garber EA, Miatkowski K, Taylor FR, Wang EA, Galdes A. J Biol Chem. 1998;273:14037–14045. doi: 10.1074/jbc.273.22.14037. [DOI] [PubMed] [Google Scholar]
- 36.Palczewski K, Kumasaka T, Hori T, Behnke CA, Motoshima H, Fox BA, Le Trong I, Teller DC, Okada T, Stenkamp RE, Yamamoto M, Miyano M. Science. 2000;289:739–745. doi: 10.1126/science.289.5480.739. [DOI] [PubMed] [Google Scholar]
- 37.Dai SY, Burris TP, Dodge JA, Montrose-Rafizadeh C, Wang Y, Pascal BD, Chalmers MJ, Griffin PR. Biochemistry. 2009 doi: 10.1021/bi901149t. [DOI] [PMC free article] [PubMed] [Google Scholar]
- 38.Dai SY, Chalmers MJ, Bruning J, Bramlett KS, Osborne HE, Montrose-Rafizadeh C, Barr RJ, Wang Y, Wang M, Burris TP, Dodge JA, Griffin PR. Proc Natl Acad Sci U S A. 2008;105:7171–7176. doi: 10.1073/pnas.0710802105. [DOI] [PMC free article] [PubMed] [Google Scholar]
- 39.Avvaru BS, Busby SA, Chalmers MJ, Griffin PR, Venkatakrishnan B, Agbandje-McKenna M, Silverman DN, McKenna R. Biochemistry. 2009;48:7365–7372. doi: 10.1021/bi9007512. [DOI] [PMC free article] [PubMed] [Google Scholar]
- 40.Lauer-Fields JL, Chalmers MJ, Busby SA, Minond D, Griffin PR, Fields GB. J Biol Chem. 2009;284:24017–24024. doi: 10.1074/jbc.M109.016873. [DOI] [PMC free article] [PubMed] [Google Scholar]
Associated Data
This section collects any data citations, data availability statements, or supplementary materials included in this article.
Supplementary Materials
Table S1. Summary of identification of cysteine residues in carazolol-bound β2AR.
Figure S1. Amino acid sequence of β2AR used in this study.
Figure S2. Comprehensive graphs of %D as a function of exchange time in log scale for all of the peptide ions verified by both MS/MS and MS and plotted in Figure 3A. * represents peptides containing carboxamidomethylated cysteine residues.