Abstract
C1q is of interest in SLE research due to deficiencies in its activity being associated with the disease. Current published protocols for measuring C1q vary greatly in their results and ease of reproducibility. Due to this, average C1q concentrations have been reported between 56 and 276 µg/ml in non-SLE serum. We present an improved method for quantifying C1q concentrations that employs a sandwich ELISA. This method has improved precision, cost efficiency, up-scaling, reproducibility, and uses significantly lesser volumes of serum sample when compared to RID and other methods for quantifying C1q. We report an average concentration of 113±40 µg/ml for C1q in non-SLE serum. The assay designed here will be useful in the high-throughput measurement of serum C1q in SLE cases.
Keywords: C1q, ELISA, Serum, Systemic lupus erythematosus
1 Introduction
C1 is the first component in the classical complement pathway which is involved in cell lysis. It is a complex formed by three units: C1q, C1r, and C1s. The C1q unit is composed of 18 subunits (6 of chain A, 6 of chain B, and 6 of chain C) that together form a protein of ~472 kD.
C1q is of interest in the field of immunology, especially in SLE research since deficiencies in its activity have been associated with the disease [1–4]. 93% of subjects who have complete C1q deficiency have SLE [1, 5]. Furthermore, C1q levels have been shown to be lower in lupus nephritis subjects when compared to subjects without nephritis and lower in active SLE subjects when compared to non-active SLE subjects [6]. The activity of C1q may also be affected by anti-C1q which is present at significant levels in ~29% of SLE cases [7].
Currently there are commercially available C1q “circulating immune complex” assays [8], but we were unable at this time to find an easily accessible C1q concentration assay on the market. Published protocols vary greatly in their methods, results, and ease of reproducibility. Furthermore, published levels for C1q in non-SLE serum have been reported between 56 and 276 µg/ml [3, 6, 9–13]. Since our group is involved in studying C1q deficiency at the protein level and how it relates to anti-C1q in SLE, we have developed an improved high-throughput method for determining C1q levels in human serum.
In our assay, we have used commercially available components to build a sandwich ELISA which uses monoclonal anti-C1q as a capture antibody. The biological components (monoclonal Ab, polyclonal Ab, C1q, C1q depleted serum, and IgG conjugated to alkaline phosphatase) cost $675 and were enough for eight, or nine, 96 well ELISA plates, with the monoclonal Ab being the limiting component.
2 Materials and Methods
2.1. Samples, components, and antibodies
Human serum (n = 48) was obtained according to Institutional Review Board guidelines and stored long term at −80°C. Polystyrene microtiter plates were purchased from Nunc (#475434). Biological components purchased from Quidel included: murine monoclonal anti-human C1q (#A201), purified human C1q (#A400), human C1q-depleted sera (#A509), and goat antisera to human C1q (#A301). Rabbit anti-goat IgG antibody conjugated to alkaline phosphatase was purchased from Sigma (#A-4062).
2.2. Detailed protocol
Anti-human C1q monoclonal antibody from mice was diluted to a concentration of 1.1 µg/ml in coating buffer (0.64 g/L sodium carbonate, 3.7 g/L sodium bicarbonate, pH 9.6). Microtiter plates were coated with 120µl of this solution and incubated overnight at 4°C. Wells were then filled to the top with blocking solution (3% non-fat dry milk in PBS) and allowed to incubate for 2 hours at 23°C. After briefly rinsing the wells once with washing solution (PBST), standards and 100µl of diluted serum sample (1/10,000 in coating buffer) were added to their respective wells.
The serum dilutions were done by first making a 2µl/100µl dilution and then re-diluting this solution 2µl/400µl thus giving a 1/10,000 final dilution. A standard curve (ranging from 0 to 1,000 ng/ml) was made by first diluting purified human C1q to 1 µg/ml in coating buffer containing 1/10,000 C1q-depleted serum. This solution was then double diluted to ~2 ng/ml. A control solution containing no C1q was also made. The standards and C1q serum samples were assayed in duplicate and coated overnight at 4°C.
Wells were then washed 3 times for 3 minutes each at 23 °C with PBST. Goat antisera to human C1q was diluted 1/1,000 in diluent (3% non-fat milk in PBST). To each well, 100µl of this solution was added and incubated for 2 hours at 23°C. After washing 3 times for 3 minutes each in PBST, rabbit anti-goat IgG antibody conjugated to alkaline phosphatase was diluted in diluent to 1/1,000 and 100µl was added to each well. The plate was then incubated for 1 hour at 23°C.
The wells were washed 3 times for 3 minutes each with PBST and 100µl of the substrate solution (2mM para-nitrophenylphosphate, 167mM sodium bicarbonate, 12mM sodium carbonate, 1mM magnesium chloride, pH 8.6) was added to each well. The absorbance of each well was read 25 minutes later at 405 nm. The concentration of C1q in a serum sample was determined by matching its absorbance with the corresponding C1q concentration in the standard curve and then correcting for the assays dilution factor.
3 Results and Discussion
3.1. Assay characteristics and results
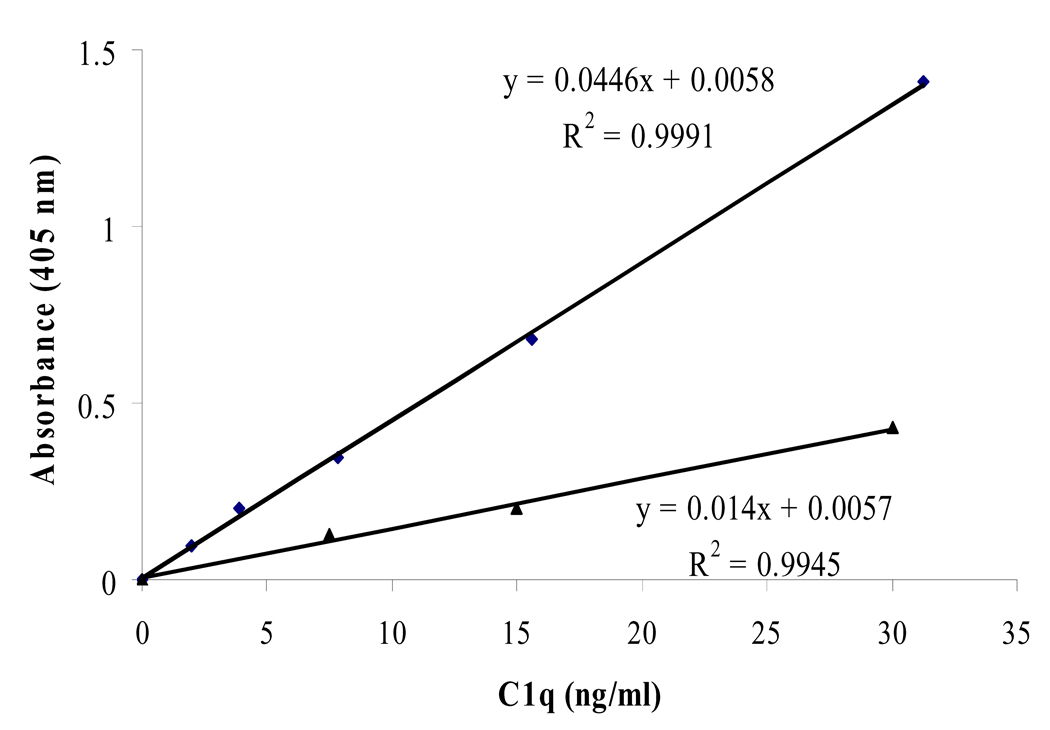
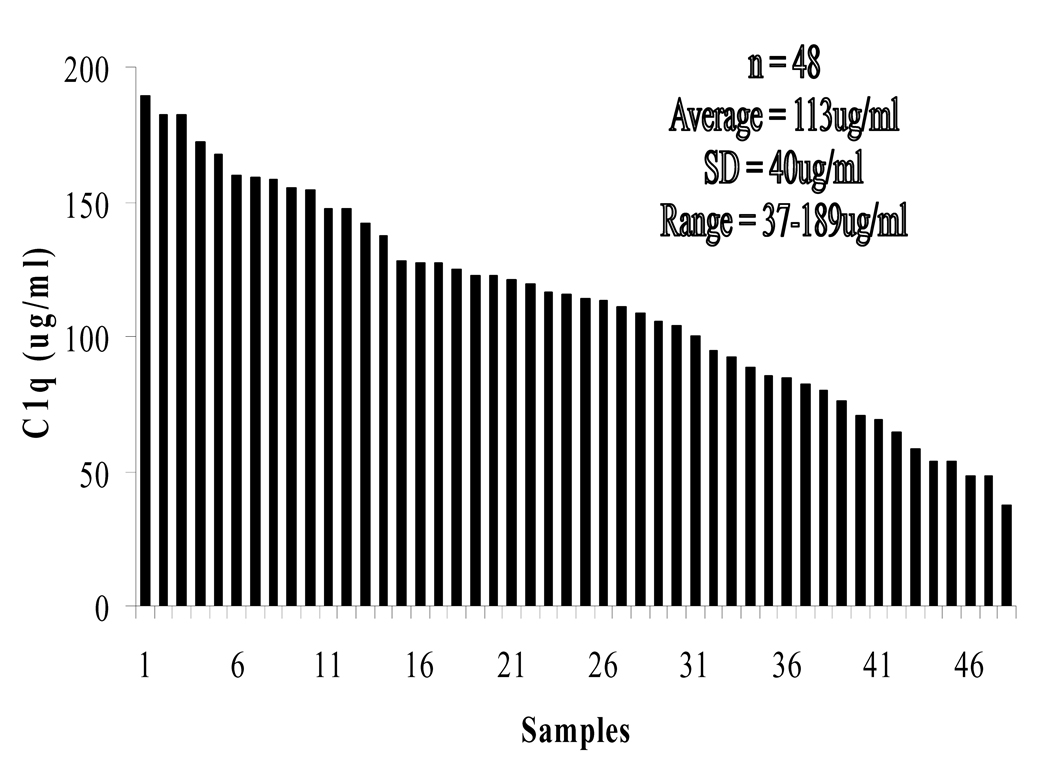
Our standard curve was linear in the 0 to 30 ng/ml C1q concentration range (Fig. 1). Non-SLE serum had a C1q concentration of 113±40 µg/ml (Fig. 2). The intra-assay and inter-assay coefficient of variation for our method is 8.7% and 10.5% (Table 1). This is on par with similar sandwich ELISA setups [14–16]. Our results disagree with the published values from Schuller and Kishore [9, 13] which suggest an average of 276 and 56.4 µg/ml, respectively. This is likely due to the different inherent accuracies for each method.
Figure 1.
The assay’s standard curve of C1q concentrations. A polystyrene plate was coated in the following order with: monoclonal anti-C1q (overnight), blocking solution (2hrs), sample C1q (overnight), polyclonal anti-C1q (2hrs), anti-IgG conjugated to an enzyme (1hr), and finally enzyme substrate (25mins). A quantifiable color signal, that is relative to C1q concentration, was produced and absorbance was read with a spectrophotometer.
Figure 2.
Serum C1q concentrations in 48 healthy subjects were measured and ranked in descending order.
Table 1.
A relative comparison of published C1q assays with our assay
| Referenced | [9] | [6] | [11] | [12] | [3] | [10] | [13] | Oursa) |
|---|---|---|---|---|---|---|---|---|
| Assay type | EID | RID | RID | RID | ELISA | ELISA | ELISA | ELISA |
| Avg. Healthy C1q (µg/ml) | 276±25 | N/A | 129±29 | N/A | N/A | 127±37 | 56±15 | 113±40 |
| Avg. SLE C1q (µg/ml) | N/A | 145±52 | N/A | N/A | N/A | N/A | 38±13 | N/A |
| Throughput and up-scaling | Low | Low | Low | Low | High | High | High | High |
| Cost per sample | High | High | High | High | Low | Low | Low | Low |
| Precision | Low | Low | Low | Low | Med | Med | Med | Med |
| Time (days) | 1 | 2–3 | 2–3 | 3 | 2 | 2 | 2 | 1–3 |
| Sample amount used | Med | Med | High | Med | Low | Low | Low | Low |
| Reproducible | N/A | N/A | N/A | N/A | No | No | No | Yes |
Table compares seven published C1q assays with our assay. The assays from [6, 9, 11, 12] use immunodiffusion which tends to have low throughput, resolution, and precision. The three ELISA assays [3, 10, 13] were not reproducible with our described components (refer to section 3.2, figure 3, and figure 4). Our assay is best suited for large numbers of sample, short assay times, and reproducibility.
After assaying several dilutions of serum between 1/200 and 1/50,000, the dilution of 1/10,000 was chosen for this assay since it produced an ideal absorbance in a 25 minute time frame, fit in the straightest region of the standard curve, and had the most reproducible intra and inter-assay results. At this dilution, coating saturation is not an issue since there are approximately 350 monoclonal antibodies for each serum C1q molecule (refer to theory in section 3.3).
3.2. Current published protocols for measuring C1q concentrations fall short
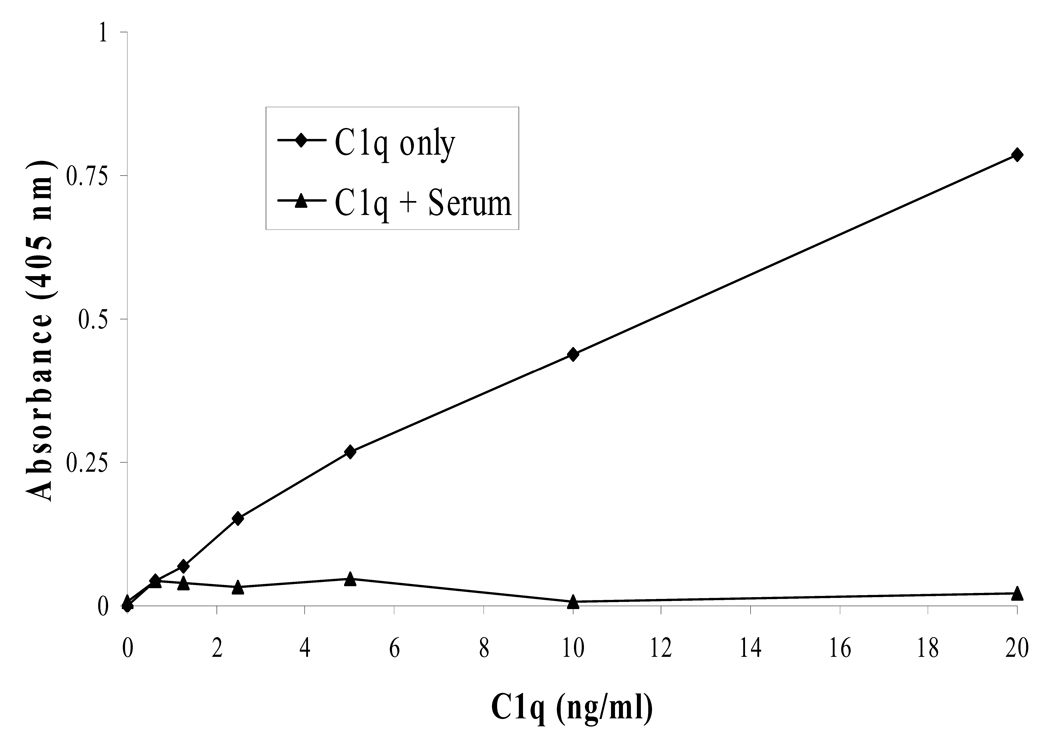
Some published protocols use an ELISA method where serum (diluted 1/100) is coated onto the plate first [13]. We replicated this setup and were unable to reproduce usable results. Competitive binding between C1q and other serum proteins may have prevented C1q from binding to the plate or prevented antibodies from binding C1q (Fig. 3). Also, when directly coating serum, the 1/100 dilution of serum is not enough for C1q. Ignoring other serum proteins, the C1q concentration alone will be near or above the total available binding sites on the polystyrene plate (refer to theory in section 3.3). This type of an assay would then not be capable of differentiating between high and average concentrations of C1q, since excess C1q would not have a place on the plate to adsorb to.
Figure 3.
When using an ELISA method to measure C1q concentrations, a sandwich assay is preferred over a direct coating of serum onto the polystyrene plate. A standard curve of C1q concentrations was not producible, if C1q was in the presence of serum, when directly coating sample C1q onto the plate.
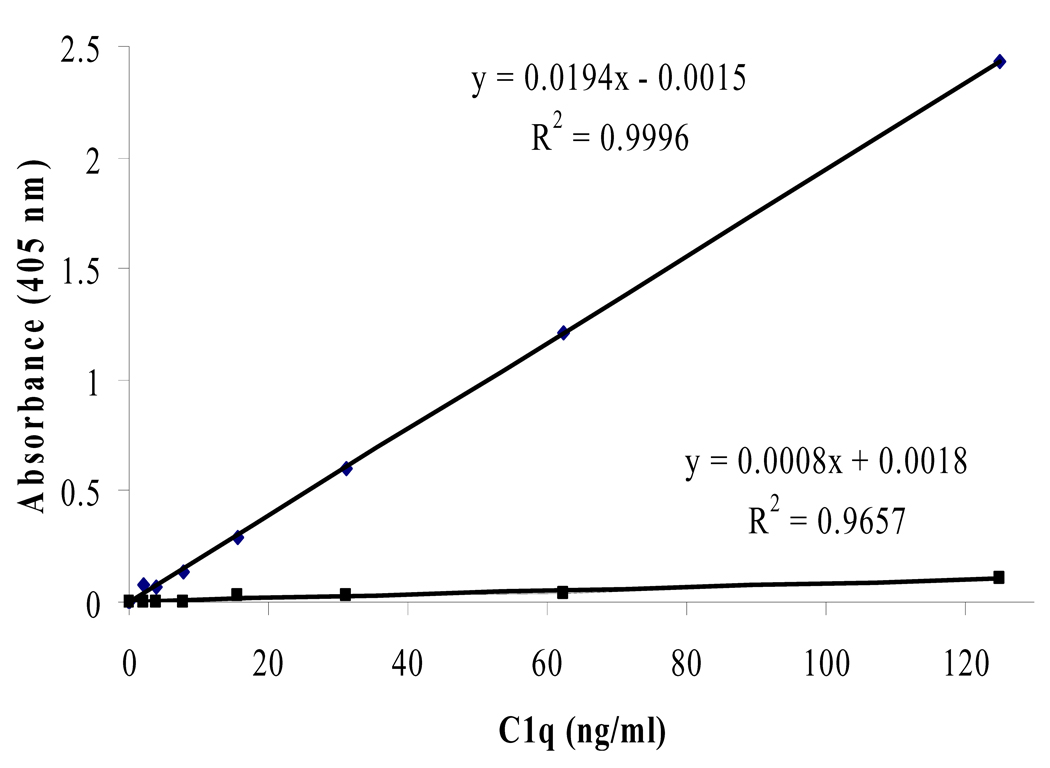
Some published protocols also use a sandwich ELISA method, however, they use polyclonal Ab coated to the plate [3, 10]. We replicated this method as well and were unable to reproduce it. The absorbances achieved were too low to differentiate between different concentrations of C1q (Fig. 4). It is quite possible that our polyclonal Ab is occupying almost all epitopes on C1q before the next antibody has a chance to bind. We also tried all of the possible monoclonal and polyclonal combinations for a sandwich ELISA, and found that the setup that uses monoclonal coated to the plate first followed by polyclonal was the only one that could produce usable results.
Figure 4.
The top trend line represents a standard curve obtained using a monoclonal capture Ab (i.e. our described method). The bottom trend line represents a standard curve obtained using a polyclonal capture Ab (i.e. published methods [3, 10]). Using polyclonal as the capture antibody is not preferred due to the ability of polyclonal to bind many epitopes of C1q and prevent follow-up binding of primary antibodies. Using our polyclonal anti-C1q as a capture Ab produced an unusable standard curve.
3.3. Theoretical calculation for coating antibody concentration
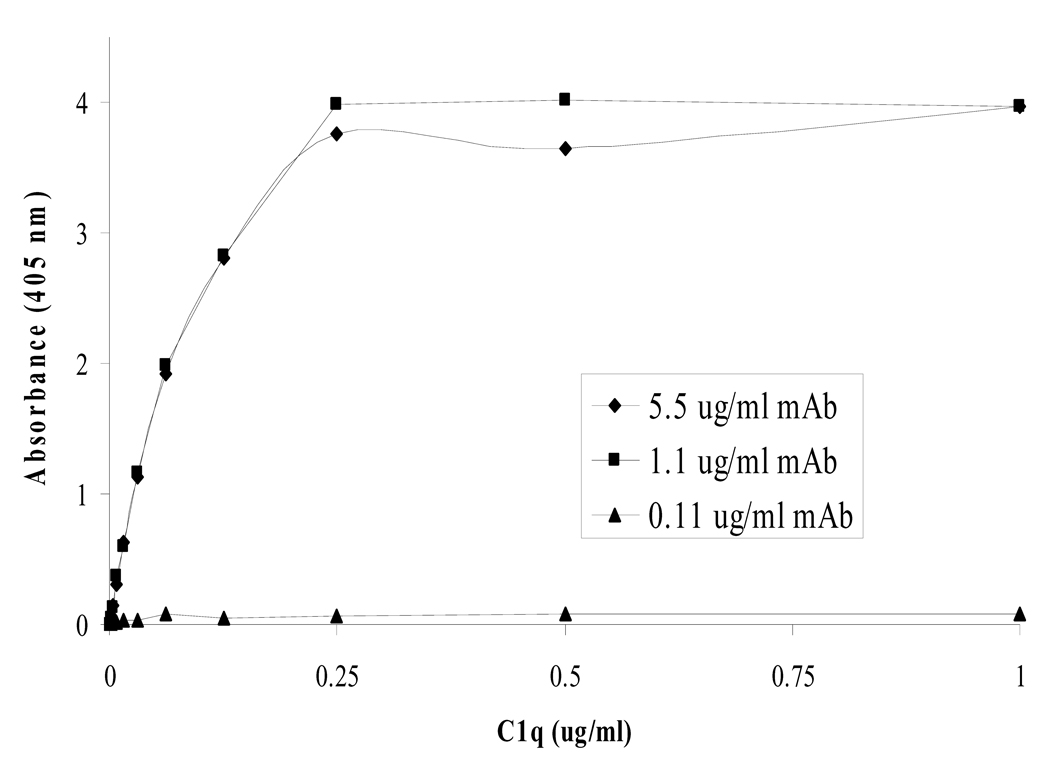
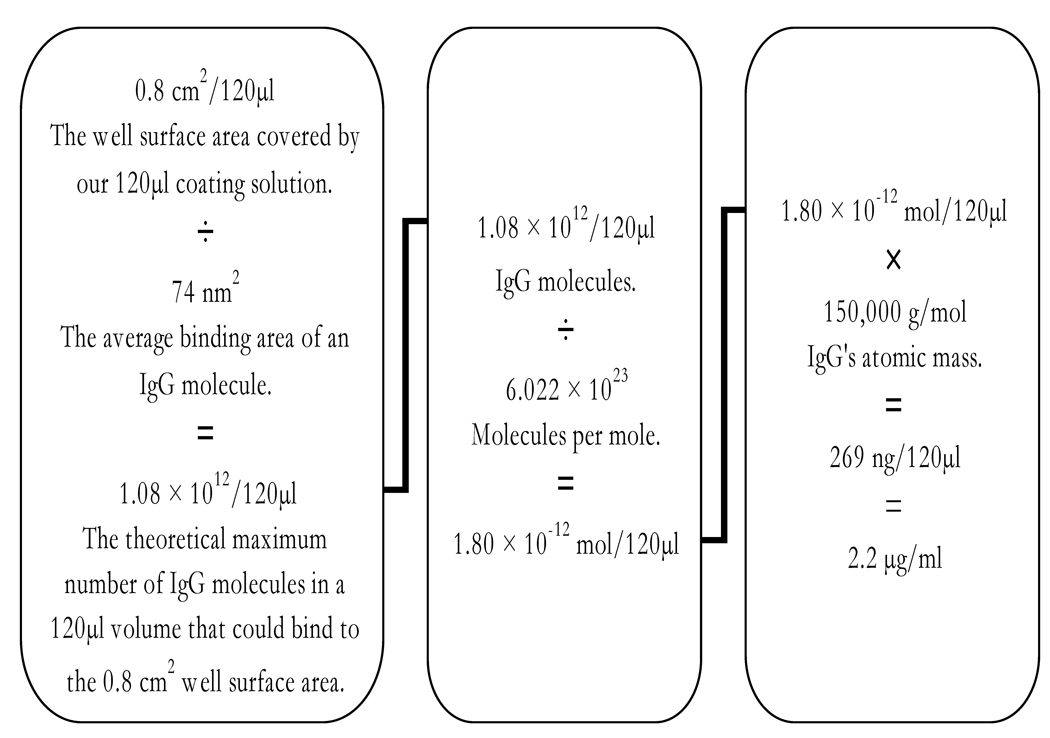
The best concentration of monoclonal to coat onto the plate was determined to be ~1.1 µg/ml (Fig. 5). This is in close agreement with a calculation we made that predicts a 2.2 µg/ml concentration of monoclonal as being the theoretical maximum amount of antibody that could adsorb to our microtiter wells (Fig. 6). The calculation made the following assumptions: the measured well surface area covered by our 120µl monoclonal coating solution is 0.8 cm2, the antibody has an average binding area of 74nm2 (measured from RCSB Protein Data Bank ID: 1igy) [17], has a mass of ~150 kD, forms a monolayer, and 100% of it is adsorbed to the polystyrene well.
Figure 5.
Standard curves of C1q concentration were produced using different coating concentrations of monoclonal capture Ab in our described method. The 0.11 µg/ml dilution of monoclonal was too low and did not provide enough binding sites for all of the C1q, while the 1.1 and 5.5 µg/ml dilutions had reached coating saturation on the plate. This is in close agreement with the theoretical maximum coating concentration of 2.2 µg/ml calculated in figure 6.
Figure 6.
A calculation of the theoretical maximum concentration of antibodies that could adsorb onto the surface of a microtiter well. The variables can be adjusted for other proteins and uses. This calculation can aid in determining the best dilution of sample and components to use as well as help avoid immeasurable sample oversaturation and conserve components. As expected and shown in figure 5, the actual observed saturation concentration of antibody was below and close to the predicted 2.2 µg/ml maximum.
3.4. Summary
We have described a sandwich ELISA to measure C1q levels in serum. To our knowledge, there are currently no easily accessible commercial C1q concentration assays on the market. The biological components in our described method cost $675 and are enough for ~816 ELISA wells and can easily be formatted for a high-throughput approach.
There is, however, room for improvement within our assay. One obvious area are the incubation times. Currently for the described method, it takes three days to perform the assay due to the two overnight incubations (one for coating of the primary monoclonal Ab and one for the addition of subject serum). In our hands, these incubation times were the best at obtaining reproducible results. However, reducing the overnight incubation times to 2 hours each and reducing the other times to 1 hour each may also be satisfactory (Table 2). This modification allows for the assay to be completed within one day and thus may be of use in a clinical laboratory setting.
Table 2.
Precision of the 1 and 3 day assay
| 1 Day assaya) | 3 Day assay | |
|---|---|---|
| Intra-assay CV | 10.2% | 8.7% |
| Inter-assay CV | 19.1% | 10.5% |
Alterations to described method: mAb 2hrs, block 1hr, C1q 2hrs, primary Ab 1hr, secondary Ab 1hr.
In conclusion, our described method is an improvement in scale, theory, precision, reproducibility, cost efficiency, and ease of use when compared to RID and other published protocols for quantifying serum C1q concentrations.
Acknowledgments
Research was funded by grant 5R01AR053734 to RHS.
Abbreviations
- PBST
phosphate buffered saline with 0.05% Tween 20
- RID
Radial Immunodiffusion
- EID
Electro-immunodiffusion
- SLE
Systemic lupus erythematosus.
Footnotes
The authors have declared no conflict of interest.
References
- 1.Botto M, Walport MJ. C1q, autoimmunity and apoptosis. Immunobiology. 2002;205:395–406. doi: 10.1078/0171-2985-00141. [DOI] [PubMed] [Google Scholar]
- 2.Sontheimer RD, Racila E, Racila DM. C1q: its functions within the innate and adaptive immune responses and its role in lupus autoimmunity. J. Invest. Dermatol. 2005;125:14–23. doi: 10.1111/j.0022-202X.2005.23673.x. [DOI] [PubMed] [Google Scholar]
- 3.Bowness P, Davies KA, Norsworthy PJ, Athanassiou P, et al. Hereditary C1q deficiency and systemic lupus erythematosus. QJM. 1994;87:455–464. [PubMed] [Google Scholar]
- 4.Kallel-Sellami M, Baili-Klila L, Zerzeri Y, Laadhar L, et al. Pediatric systemic lupus erythematosus with C1q deficiency. Ann. N. Y. Acad. Sci. 2007;1108:193–196. doi: 10.1196/annals.1422.021. [DOI] [PubMed] [Google Scholar]
- 5.Pickering MC, Botto M, Taylor PR, Lachmann PJ, Walport MJ. Systemic lupus erythematosus, complement deficiency, and apoptosis. Adv. Immunol. 2000;76:227–324. doi: 10.1016/s0065-2776(01)76021-x. [DOI] [PubMed] [Google Scholar]
- 6.Horak P, Hermanova Z, Zadrazil J, Ciferska H, et al. C1q complement component and -antibodies reflect SLE activity and kidney involvement. Clin. Rheumatol. 2006;25:532–536. doi: 10.1007/s10067-005-0110-4. [DOI] [PubMed] [Google Scholar]
- 7.Horvath L, Czirjak L, Fekete B, Jakab L, et al. High levels of antibodies against Clq are associated with disease activity and nephritis but not with other organ manifestations in SLE patients. Clin. Exp. Rheumatol. 2001;19:667–672. [PubMed] [Google Scholar]
- 8.Van Hoeyveld E, Bossuyt X. Evaluation of seven commercial ELISA kits compared with the C1q solid-phase binding RIA for detection of circulating immune complexes. Clin. Chem. 2000;46:283–285. [PubMed] [Google Scholar]
- 9.Schuller E, Helary M. Determination in the nanogram range of C1q in serum and unconcentrated CSF by electro-immunodiffusion. J. Immunol. Methods. 1983;56:159–165. doi: 10.1016/0022-1759(83)90407-6. [DOI] [PubMed] [Google Scholar]
- 10.Delamarche C, Berger F, Pouplard A, Emile J. An ELISA technique for the measurement of C1q in cerebrospinal fluid. J. Immunol. Methods. 1988;114:101–106. doi: 10.1016/0022-1759(88)90160-3. [DOI] [PubMed] [Google Scholar]
- 11.Leyva-Cobian F, Moneo I, Mampaso F, Sanchez-Bayle M, et al. Familial C1q deficiency associated with renal and cutaneous disease. Clin. Exp. Immunol. 1981;44:173–180. [PMC free article] [PubMed] [Google Scholar]
- 12.Hoekzema R, Hannema AJ, Swaak TJ, Paardekooper J, Hack CE. Low molecular weight C1q in systemic lupus erythematosus. J. Immunol. 1985;135:265–271. [PubMed] [Google Scholar]
- 13.Kishore U, Sontheimer RD, Sastry KN, Zappi EG, et al. The systemic lupus erythematosus (SLE) disease autoantigen-calreticulin can inhibit C1q association with immune complexes. Clin. Exp. Immunol. 1997;108:181–190. doi: 10.1046/j.1365-2249.1997.3761273.x. [DOI] [PMC free article] [PubMed] [Google Scholar]
- 14.Gomo ZA, Henderson LO. High-density lipoprotein apolipoproteins in urine: II. Enzyme-linked immunoassay of apolipoprotein A-I. Clin. Chem. 1988;34:1781–1786. [PubMed] [Google Scholar]
- 15.Kunishima S, Hayashi K, Kobayashi S, Naoe T, Ohno R. New enzyme-linked immunosorbent assay for glycocalicin in plasma. Clin. Chem. 1991;37:169–172. [PubMed] [Google Scholar]
- 16.Monaghan DA, Power MJ, Fottrell PF. Sandwich enzyme immunoassay of osteocalcin in serum with use of an antibody against human osteocalcin. Clin. Chem. 1993;39:942–947. [PubMed] [Google Scholar]
- 17.Harris LJ, Larson SB, Hasel KW, McPherson A. Refined structure of an intact IgG2a monoclonal antibody. Biochemistry. 1997;36:1581–1597. doi: 10.1021/bi962514+. [DOI] [PubMed] [Google Scholar]


