

Abstract
Background
Information on dietary intake provides some of the most valuable insights for mounting intervention programmes for the prevention of chronic diseases. With the growing concern about adolescent overweight, the need to accurately measure diet becomes imperative. Assessment among adolescents is problematic as this group has irregular eating patterns and they have less enthusiasm for recording food intake.
Subjects/Methods
We used qualitative and quantitative techniques among adolescents to assess their preferences for dietary assessment methods.
Results
Dietary assessment methods using technology, for example, a personal digital assistant (PDA) or a disposable camera, were preferred over the pen and paper food record.
Conclusions
There was a strong preference for using methods that incorporate technology such as capturing images of food. This suggests that for adolescents, dietary methods that incorporate technology may improve cooperation and accuracy. Current computing technology includes higher resolution images, improved memory capacity and faster processors that allow small mobile devices to process information not previously possible. Our goal is to develop, implement and evaluate a mobile device (for example, PDA, mobile phone) food record that will translate to an accurate account of daily food and nutrient intake among adolescents. This mobile computing device will include digital images, a nutrient database and image analysis for identification and quantification of food consumption. Mobile computing devices provide a unique vehicle for collecting dietary information that reduces the burden on record keepers. Images of food can be marked with a variety of input methods that link the item for image processing and analysis to estimate the amount of food. Images before and after the foods are eaten can estimate the amount of food consumed. The initial stages and potential of this project will be described.
Keywords: dietary assessment, food records, digital images
Introduction
Accurate methods and tools to assess food and nutrient intake are essential in monitoring nutritional status for epidemiological and clinical research on the association between diet and health. The collection of data on food intake provides some of the most valuable insights into the occurrence of disease and subsequent approaches for mounting intervention programmes for prevention. However, one of the most problematic groups for the assessment of diet is adolescents. Food intake in this age group has been evaluated by a variety of methods including food records (FR), the 24-h dietary recall (24HR) and a food frequency questionnaire with external validation by doubly labelled water and urinary nitrogen (Champagne et al., 1998; McPherson et al., 2000; Larsson et al., 2002; Bandini et al., 2003; Livingstone and Black, 2003; Rockett et al., 2003). Currently, there are too few validation studies in adolescents to justify the use of one particular method over another for any given study design, and underreporting is well documented (Black et al., 1993; Livingstone et al., 2004).
Little is known about the factors that may contribute to underreporting in adolescents. In general, subjects who underreport using one method are likely to underreport using another dietary assessment method. Older children, 15- to 18-year-old, are more likely to underreport compared with those who are 7-, 9- and 12-year-old (Black et al., 1993; Bandini et al., 2003; Livingstone et al., 2004). One factor that may contribute to underreporting is the effort involved in keeping a FR (Goodwin et al., 2001). In comparison with younger children, adolescents eat more food because they are growing. Their eating habits are much more unstructured, and they eat away from home more often. These factors add to the burden of keeping a FR, as well as making the 24HR recall and the food frequency questionnaire more difficult to undertake.
Focus group methods have been used to evaluate the reaction of 6- to 17-year-olds to collecting dietary data using a FR (Goodwin et al., 2001). Adolescents reported that they would not carry the food and activity booklet during recording and would consider altering their food intake to simplify recording. They also said that they became annoyed when their parents tried to help them. Early adolescents aged 11–14 years, in particular, are in that period of time when the novelty and curiosity of assisting in or self-reporting of food intakes starts to wane, and assistance from parents is seen as an intrusion (Livingstone et al., 2004). Therefore, novel approaches to the assessment of food intake in this age group using technology may keep adolescents more engaged in the activity itself.
Adolescents are the ones most eager in terms of adopting new technology. Mobile computing devices such as personal digital assistants (PDAs) and smart phones with cameras are poised to show their potential as a general purpose computing device. PDAs are ideal as a field data collection device (Wang et al., 2002; Kretsch et al., 2004; Kikunaga et al., 2007). In 2004, a survey by Quality Education Data Inc. found that 28% of US school districts offered handheld computers for student and teacher use (Burke, 2005). Limited diet assessment software applications for handheld computers are currently available and this area remains underexplored. Therefore, this paper describes the pilot study that was used to determine adolescents’ preferences for reporting dietary intake and the early development of using mobile devices for dietary assessment.
Materials and methods
Subjects and study design
A pilot study was conducted as an adjunct to a metabolic study following methods that have been described earlier (Braun et al., 2006, 2007). Owing to the objectives of the primary study, participants (n = 31) were 16 boys and 15 girls of Chinese heritage between the ages of 11 and 15 years. The metabolic study, including the adjunct study described here, was approved by the Purdue University Institutional Review Board. Parental consent and participant assent were completed for each study subject prior to study participation.
The enrolled boys and girls lived in a campus residence hall converted into a metabolic ward for two 3-week periods separated by a 1-week washout period where the participants returned to their homes. All meals and snacks were provided. Between the time of enrollment in the study and the final day of the study, the participants completed six approaches to collecting dietary information: multipass 24HR, FR (paper and pencil), PDA with hierarchical menu, PDA with search menu, PDA with camera and camera with notebook.
Dietary assessment methods
Prior to the first day of the study, the participants were requested to complete 6 days of FRs. Separately, PDA software was developed that allowed users to record foods eaten. The user interface was designed so that the foods eaten were selected from a hierarchical tree structure that was based on the major and minor groups’ food coding scheme of the nutrient database of the United States Department of Agriculture (USDA) Food and Nutrient Database for Dietary Studies (FNDDS), 1.0, 2004, Beltsville, MD, Agricultural Research Service, Food Surveys Research Group. During the washout period, the user interface was enhanced to include a search feature so that foods could be found by entering partial food names.
During the first 3 weeks, subjects participated in 1 or 2 days of the 24HR. Later, subjects had the opportunity to complete at least 2 days of the PDA-based food record with meals and snacks. One PDA with a camera was available, and thus its use was limited to only a few meals per subject. To use the camera PDA, subjects were given instructions to take a digital image of a meal or snack. To identify foods, they were shown how to use the stylus to make notes directly on the image of the meal (Figure 1). During the second 3 weeks of the study, the PDA-search food record was used.
Figure 1.
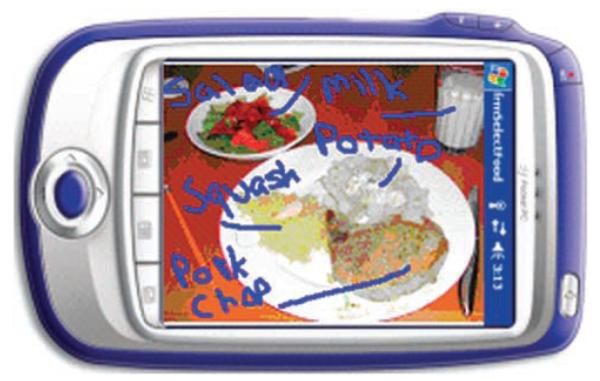
Input technique of using stylus to handwrite notes to label food items on a digital image of a meal.
To further experiment with capturing food intake with pictures, during the washout period, each child was sent home with a disposable camera and a small notebook. They were instructed to take pictures of foods consumed for at least 1 day during the week and write notes about the foods eaten in the small notebook. Instruction emphasized that an item of known size or a fiducial marker (the small notebook, a chopstick or a coin) was to be included in each picture. The camera and notebook were to be returned at the start of the second 3 weeks of the metabolic study. The only incentive provided was the promise of receiving any personal photos developed. The subjects received no reminders during the washout week to record intake while at home.
Feedback approach
At the end of each 3-week period, separate focus groups for boys and girls were conducted using a predetermined outline and set of prompts. The focus groups were audiotaped and transcribed verbatim. The transcripts were reviewed to identify consistent themes with regard to the dietary assessment methods. After the focus group sessions, a brief questionnaire was completed that asked about an individual’s level of agreement, neutrality or disagreement about his/her liking of each dietary assessment method. The questionnaire contained statements such as ‘I liked writing the foods I ate in the yellow food record booklet’ followed by seven response categories ranging from ‘agree strongly’ to ‘neither agree or disagree’ to ‘disagree strongly.’ For frequency analysis, these categories were collapsed into three categories of ‘agree,’ ‘neutral’ and ‘disagree.’
Results
Lessons learned from adolescents
On the first day of the study, 27 of the 31 participants (87%, 13 boys and 14 girls) turned in their completed 6 days of food records. Fifteen males and 14 females participated in focus groups regarding the six different dietary assessment methods. A summary of statements from the focus groups is in Figure 2. Girls commented that the FR was a ‘hassle.’ The PDA methods were described as ‘better than the interview’ (referring to the 24HR), ‘high technology’ and ‘easier.’ Comments about using a camera included: ‘lot easier,’ ‘fun’ and ‘wasn’t anything I didn’t like about this.’ In the focus group sessions, especially among the boys, a high level of frustration about the 24HR was expressed, for example, ‘boring,’ ‘tedious.’
Figure 2.

Quotes from focus groups among boys (n = 15) and girls (n = 14) between 11 and 15 years regarding likes and dislikes of dietary assessment methods.
During the focus groups, subjects expressed difficulty in finding foods using the hierarchical tree data entry method and suggested the addition of a search mechanism for the PDA food record tool. The subjects explained that they did not always know the food grouping for a food. The search method for finding a food was added as a feature during the washout period. Other issues that distracted from the data entry process were the unfamiliar food names used in the database (for example, gum drops for gummy bears, frankfurters for hot dogs) and programme bugs that surfaced during the programme’s first use by a variety of adolescents.
Table 1 shows the cooperation of the 30 adolescents provided with a disposable camera and small notebook to take home during the 1-week washout period. Despite the lack of remuneration and reminders, 23 of 30 individuals (77%) took pictures beyond the requested 1 day. Just over half of the participants (17/30) recorded in the notebook, whereas 29 of 30 took pictures.
Table 1.
Frequency of participation of 30 boys and girls aged 11–15 years provided with a disposable camera and small notebook to take home, to photograph foods consumed and record descriptions of foods for at least 1 day during a 1-week period
| Number of youth recording 2 days: 23 |
Number of youth recording 1 day: 6 |
Number of youth recording 0 day: 1 |
|||||||
|---|---|---|---|---|---|---|---|---|---|
| Recorded in notebook | Took photos | Recorded in notebook | Took photos | Recorded in notebook | Took photos | ||||
| None or little | Yes detail | Yes | Unable to developa | None or little | Yes detail | Yes | Unable to developa | None or little | No |
| 8 | 15 | 22 | 1 | 4 | 2 | 5 | 1 | 1 | 1 |
Several of the disposable cameras were past their expiration dates, which may explain the problem with developing the film; however damage inflicted to the camera by the user cannot be ruled out. In each case, these individuals had detailed recordings in their notebooks.
During the focus groups, in response to the question, ‘Were there any situations where you felt embarrassed using the camera?,’ most individuals said ‘no.’ Those respondents who claimed potential for embarrassment, including one who stated ‘some embarrassment at a buffet,’ were comfortable with the process of saying things such as, ‘My friends would think it was weird. But I would take the pictures anyway.’ There was verbal consensus that audio recordings of their intakes would have been embarrassing, and they expressed dislike at the idea of talking out loud about their food intakes.
The results of the questionnaire asking for partiality toward the six diet assessment methods are shown in Table 2. When allowed to express their opinions on the questionnaire, which is confidential compared with the more public focus group approach, the 24HR was disliked no more than the PDA tree method. A surprising observation was that a larger proportion of respondents selected liking the 24HR compared with the PDA tree method. The paper and pencil food record was liked the least. There was 100% agreement for the disposable camera and PDA camera as well-liked methods.
Table 2.
Preferences for six dietary assessment methods among 29 boys and girls aged 11–15 years
| Response to ‘I likedy…’ |
Traditional food record (%) |
24 h recall (%) |
PDA w/tree structure (%) |
PDA w/food search (%) |
Disposable camera (%) |
PDA camera (%) |
|---|---|---|---|---|---|---|
| Agreea | 35 | 52 | 38 | 75 | 100 | 100 |
| Neutral | 31 | 21 | 34 | 14 | 0 | 0 |
| Disagree | 35 | 28 | 28 | 11 | 0 | 0 |
Abbreviations: PDA, personal digital assistant; w/, with.
Totals do not always add to 100 due to rounding.
When testing the pilot PDA food record tool with the subjects, almost every child indicated previous experience in using a PDA and readily adapted to using the tool. Of the 29 subjects completing the questionnaire, 59% (17/29) owned a mobile phone and 66% (19/29) reported owning a digital camera.
A unique aspect of this pilot study was that the subjects were exposed to six different dietary assessment methods, with some of these methods incorporating digital images and handheld PDA tools. Adolescents in this study showed a strong preference for using methods that incorporate technology such as capturing images of food. The use of properly designed handheld computing devices that work through the paradigm of how young people actually live and interact in the ‘digital’ age may address many of the issues outlined as barriers to recording intake among adolescents.
Adolescents’ unstructured eating patterns may be contributing to the underreporting often seen in this age group, along with a combination of forgetfulness, irritation and boredom caused by having to record intake frequently (Livingstone and Black, 2003). Our focus group testing and quantitative data would support this. We had high adherence when subjects were asked to use a disposable camera to photograph all foods consumed. The young people even took pictures of single food items and small snacks, such as a single licorice rope and a single frankfurter along with one of the recommended fiducial markers (for example, coin, small notebook). With future technology-based applications, we envisage that adolescents will be more engaged in the activity of collecting food intake data, which may lead to more accurate information and representative data on their dietary intakes. This is consistent with the observation that dietary assessment methods perceived as less burdensome and time-consuming may improve compliance (Livingstone and Black, 2003). To confirm these predictions, validation studies that compare dietary intakes based on technological methods with recovery biomarkers, such as doubly labelled water and urinary nitrogen, need to be undertaken.
Discussion
Current work in progress
The issues highlighted by this pilot study reflect an initiative within the National Institutes of Health called the Gene and Environmental Initiative (GEI) (http://www.nih.gov/news/pr/sep2007/nhgri-04.htm). The activities of the initiative include improving genomic tools and exposure measurements to better address environmental and genetic influences on health and disease. The Exposure Biology Program, which makes up part of the GEI, addresses several critical exposures including the improvement of dietary assessment methods to better understand gene–environment interactions. Several investigative teams are being supported to develop improved methods. Our approach to this challenge is outlined here (Zhu et al., 2008).
Our goal is to develop, implement and evaluate a mobile device (for example, PDA, mobile phone) food record that will translate to an accurate account of daily food and nutrient intake among adolescents. The end product would be a mobile device with a built-in camera that includes integrated image analysis, visualization tools and a nutrient database that would allow an adolescent to discretely ‘record’ foods eaten. The user would capture images of his/her meals and snacks before and after eating. Automatic image analysis would estimate the volume of food consumed, thus reducing the burden on the user. Our pilot study results showed that adolescents preferred PDA with camera or a camera alone to other methods of dietary assessment. The development of a mobile device that works the way young people interact with portable devices may address many of the barriers identified to recording food intake among adolescents.
Image analysis and visualization
With the use of image calibration, acquisition and image segmentation, we are developing methods to automatically estimate the volume of the foods consumed from images captured with a mobile device (Zhu et al., 2008). The goal is to identify each food item and estimate the volume of each food item consumed. From this information, the energy and nutrients consumed can be determined through linking the volume information with the nutrient database. These steps require a calibrated, possibly 3D, imaging system. A block diagram of our analysis system is shown in Figure 3, and parts of this system are outlined below.
Figure 3.

Image analysis system.
Examples of the steps leading to segmented food items are shown in Figure 4 using a stylized collection of food representing a meal. To estimate the volume, a calibrated system is needed. This calibrated system can be accomplished by having a fiducial marker in the image or an object of known size. In the case of Figure 4, this is accomplished with the pattern on the tablecloth. Next, the regions of the food need to be identified. This process is shown by the white outlines around the foods in Figures 4a and b, the former being completed by hand and the latter being carried out automatically. By taking images before and after the meal, the segmentation process and the reference size estimation are used to determine the volume of food consumed in cubic centimeters.
Figure 4.

Segmented food items. (a) Ground truth (human) and (b) automatic segmentation.
In some cases, the food image may not be completely clear, such as melted butter on a pancake or noodles under sauce. In these cases, we will use 3D shape reconstruction techniques to generate a similar shaped object as a reference and composite over the food item. Then, the user would be asked to adjust the shape with a simple slider bar to confirm the correct size.
Once a food item is segmented and its features are extracted (Figure 3), the food item can be identified using statistical pattern recognition techniques (Yao et al., 2007; Zhu et al., 2008). In time, a large, well-developed database of images will allow rapid identification of most foods consumed. If a food cannot be automatically identified, the user will be prompted to identify the food. Built-in adaptive programming would enable future images of these previously unidentified foods to be automatically identified. The food images will be linked to food codes in the FNDDS, thus allowing the calculation of the gram weight of food eaten and the energy and nutrient content of the amount consumed. At various stages, the information collected would be relayed to a central server space, thus preventing loss of data and immediate access of the information for researchers.
In the event that a food cannot be automatically identified, a system to allow the user to identify foods needs to be developed as shown earlier in Figure 1. We have been conducting formative evaluation and alternative methods of identifying foods including tapping the screen and using various data entry menus and forms (Figure 5). The entry methods being tested include a simplified tree method and a search mechanism. Supplementary work with the words used to identify foods has involved the addition of common food terms based on feedback from adolescents during our pilot study.
Figure 5.

Additional input devices for use with mobile device food record. (a) Using the onscreen tree method to label food items in digital image. (b) Using an onscreen keyboard to search for a food item from the database.
For calibration of the system, the fiducial marker becomes an important element in the entire process. If the marker has some depth, this aids in recovering depth information from the image. Likewise, placement of the marker may help in anchoring the foods that would improve the accuracy of the calculations for the before and after images of the food. As the programming is dependent on the fiducial marker, the same marker needs to be used for all recording days and all users. Therefore, the development of an object that is convenient to carry, has minimal probability of getting lost, will maintain its shape and be minimally obtrusive to the user while eating is being addressed.
Currently, our plans include testing the mobile device with adolescents under controlled feeding conditions for one or two meals. The amount of food estimated with the mobile device in the hands of adolescents will be compared with the known amount of foods consumed. A subset of the group will consume foods of known amounts over a 24-h period, and the estimated intake from the mobile device will be compared with the actual food amounts and urinary biomarkers. There are many more challenges involved with deploying a mobile device system than described in this paper. Some of the issues not mentioned here can be found in the report from the technology breakout session found elsewhere in this supplement.
Conclusions
We have observed poor acceptance of traditional methods of dietary assessment in adolescents. Unstructured eating patterns that require more frequent recording of food intakes may be contributing to these methods being considered burdensome. Those wishing to undertake dietary assessment in adolescents need to consider more innovative approaches when collecting food intake data. The goal of our study is to improve dietary assessment through further development of a novel and more precise method of measuring food intake. We aim to establish a system that will run on a mobile device to automatically determine what and how much food is consumed by acquiring images before and after every eating occasion. Mobile computing devices provide a unique medium for collecting dietary information that reduces the burden on record keepers.
Acknowledgements
Support for this work comes from the National Cancer Institute (1U01CA130784-01) and the National Institute of Diabetes and Digestive and Kidney Diseases (1R01-DK073711-01A1).
Footnotes
Disclosure The authors have declared no financial interests.
References
- Bandini LG, Must A, Cyr H, Anderson SE, Spadano JL, Dietz WH. Longitudinal changes in the accuracy of reported energy intake in girls 10–15 y of age. Am J Clin Nutr. 2003;78:480–484. doi: 10.1093/ajcn/78.3.480. [DOI] [PubMed] [Google Scholar]
- Black AE, Prentice AM, Goldberg GR, Jebb SA, Bingham SA, Livingstone MB, et al. Measurements of total energy expenditure provide insights into the validity of dietary measurements of energy intake. J Am Diet Assoc. 1993;93:572–579. doi: 10.1016/0002-8223(93)91820-g. [DOI] [PubMed] [Google Scholar]
- Braun M, Martin BR, Kern M, McCabe GP, Peacock M, Jiang Z, et al. Calcium retention in adolescent boys on a range of controlled calcium intakes. Am J Clin Nutr. 2006;84:414–418. doi: 10.1093/ajcn/84.1.414. [DOI] [PubMed] [Google Scholar]
- Braun M, Palacios C, Wigertz K, Jackman LA, Bryant RJ, McCabe LD, et al. Racial differences in skeletal calcium retention in adolescent girls with varied controlled calcium intakes. Am J Clin Nutr. 2007;85:1657–1663. doi: 10.1093/ajcn/85.6.1657. [DOI] [PubMed] [Google Scholar]
- Burke G. The digital classroom: handhelds are dramatically rewriting approaches to 3 R’s. Lafayette Journal and Courier. 2005:B5. [Google Scholar]
- Champagne CM, Baker NB, DeLany JP, Harsha DW, Bray GA. Assessment of energy intake underreporting by doubly labeled water and observations on reported nutrient intakes in children. J Amer Diet Assoc. 1998;98:426–433. doi: 10.1016/S0002-8223(98)00097-2. [DOI] [PubMed] [Google Scholar]
- Goodwin RA, Brule D, Junkins EA, Dubois S, Beer-Borst S. Development of a food and activity record and a portion-size model booklet for use by 6- to 17-year olds: a review of focus-group testing. J Amer Diet Assoc. 2001;101:926–928. doi: 10.1016/S0002-8223(01)00229-2. [DOI] [PubMed] [Google Scholar]
- Kikunaga S, Tin T, Ishibashi G, Wang DH, Kira S. The application of a handheld personal digital assistant with camera and mobile phone card (Wellnavi) to the general population in a dietary survey. J Nutr Sci Vitaminol. 2007;53:109–116. doi: 10.3177/jnsv.53.109. [DOI] [PubMed] [Google Scholar]
- Kretsch MJ, Blanton CA, Baer D, Staples R, Horn WF, Keim NL. Measuring energy expenditure with simple, low-cost tools. J Amer Diet Assoc. 2004;104(Suppl 2):A–13. [Google Scholar]
- Larsson CL, Westerterp KR, Johansson GK. Validity of reported energy expenditure and energy and protein intakes in Swedish adolescent vegans and omnivores. Am J Clin Nutr. 2002;75:268–274. doi: 10.1093/ajcn/75.2.268. [DOI] [PubMed] [Google Scholar]
- Livingstone MBE, Black AE. Validation of estimates of energy intake by weighed dietary record and diet history in children and adolescents. J Nutr. 2003;133:895S–920S. doi: 10.1093/ajcn/56.1.29. [DOI] [PubMed] [Google Scholar]
- Livingstone MBE, Robson PJ, Wallace JMW. Issues in dietary intake assessment of children and adolescents. Br J Nutr. 2004;92:S213–S222. doi: 10.1079/bjn20041169. [DOI] [PubMed] [Google Scholar]
- McPherson RS, Hoelscher D, Alexander M, Scanlon KS, Serdula MK. Dietary assessment methods among school-aged children: validity and reliability. Prev Med. 2000;31:S11–S33. [Google Scholar]
- Rockett HR, Berkey CS, Colditz GA. Evaluation of dietary assessment instruments in adolescents. Curr Opin Clin Nutr Metab Care. 2003;6:557–562. doi: 10.1097/00075197-200309000-00009. [DOI] [PubMed] [Google Scholar]
- Wang DH, Kogashiwa M, Ohta S, Kira S. Validity and reliability of a dietary assessment method: the application of a digital camera with a mobile phone card attachment. J Nutr Sci Vitaminol. 2002;48:498–504. doi: 10.3177/jnsv.48.498. [DOI] [PubMed] [Google Scholar]
- Yao N, Sclabassi RJ, Liu Q, Yang J, Fernstrom JD, Fernstrom MH, et al. A video processing approach to the study of obesity. Institute of Electrical and Electronics Engineers, International Conference on Manufacturing Engineering [Proceedings of the 2007 International Conference on Multimedia & Expo (ICME); China: Beijing; [2–5 July 2007]. 2007. pp. 1727–1730. [Google Scholar]
- Zhu F, Mariappan A, Boushey CJ, Kerr D, Lutes KD, Ebert DS, et al. Technology-assisted dietary assessment. Proceedings of the IS&T/SPIE Conference on Computational Imaging VI. 2008;6814:1–10. doi: 10.1117/12.778616. [DOI] [PMC free article] [PubMed] [Google Scholar]