Abstract
Devices based on differential mobility spectrometry (DMS) are used in a number of ways, including applications as ion prefilters for API-MS systems, as detectors or selectors in hybrid instruments (GC-DMS, DMS-IMS), and in standalone systems for chemical detection and identification. DMS ion separation is based on the relative difference between high field and low field ion mobility known as the alpha dependence, and requires the application of an intense asymmetric electric field known as the DMS separation field, typically in the megahertz frequency range. DMS performance depends on the waveform and on the magnitude of this separation field. In this paper, we analyze the relationship between separation waveform and DMS resolution and consider feasible separation field generators. We examine ideal and practical DMS separation field waveforms and discuss separation field generator circuit types and their implementations. To facilitate optimization of the generator designs, we present a set of relations that connect ion alpha dependence to DMS separation fields. Using these relationships we evaluate the DMS separation power of common generator types as a function of their waveform parameters. Optimal waveforms for the major types of DMS separation generators are determined for ions with various alpha dependences. These calculations are validated by comparison with experimental data.
INTRODUCTION
Since its discovery and initial application in the 1980s and 1990s, the method of differential mobility spectrometry (DMS) described in Refs. 1, 2, 3 has been developed as a field and laboratory tool for detection and identification of trace chemicals and as a prefilter for atmospheric pressure ionization mass spectrometry (API-MS). DMS is sensitive, rapid, and provides a unique type of selectivity that is largely orthogonal to many other techniques. It is a flexible system that can be applied to the separation and characterization of gas-phase ions from any type of ion source. Developed and refined over the past decade4, 5 by multiple groups, DMS is also known as field-asymmetric waveform ion mobility spectrometry.6 DMS analyzers have been applied for the analysis of a variety of chemicals at trace levels.7 These applications include explosives,8 drugs, chemical warfare agents,9 toxic and industrial components, sulfur contained chemicals, and other organic10 and inorganic11 substances. Hybrid DMS techniques such as miniature gas chromatograph with DMS (GC-DMS), DMS with ion mobility spectrometer (DMS-IMS), and electrospray ionization DMS-MS have also been reported.
Under near-atmospheric pressure conditions, ions in an electric field rapidly reach a limiting velocity determined by the drag on ion motion caused by scattering from the ion-neutral interaction potential. The relationship between ion velocity and field, V(E)=K(E)E, contains a proportionality constant, K(E), known as the ion mobility coefficient, which is dependent on the field strength at high fields and forms the basis of the DMS technique. The IMS technique measures the low field ion mobility, K(0), usually by determining the ion drift time in a gated drift tube. IMS is approximately related to the ion mass-to-charge (m∕z), but also retains enough sensitivity to structure and to chemical family that IMS has been added to mass spectrometry in commercial systems,12 and in academic research. In contrast to IMS based on low field mobility, DMS devices are sensitive to the difference between high field and low field ion mobility coefficients. This mobility difference is characterized by the normalized field dependence of ion mobility, known as the alpha function, α(E)=[K(E)-K(0)]∕K(0), a characteristic ion property similar to the low field ion mobility in IMS or m∕z in mass spectrometry.
DMS experimental data obtained and reported during the last decade demonstrate that α(E), determined by the interaction of each ion species with neutrals,13 can be used for ion separation and identification. Since DMS is sensitive to molecular conformation, rigidity, polarity, and clustering affinity, many compounds are resolved by DMS properties, often including even compounds of similar or identical m∕z. As a result, adding mobility-based instrumentation to other technologies can enhance separation, identification, and quantification, since distinct physical properties are combined.14 DMS works well in combination with mass spectrometry because alpha separations are largely orthogonal to m∕z separations. Other types of hybrid technologies include DMS with IMS,15 and GC with DMS.16
In DMS, ion species are separated according to their trajectories in a narrow analytical channel. This analytical channel is formed between two parallel electrodes, where positive and negative ions are introduced continuously from the ion source and drawn through the analytical channel by gas flow. A field is applied transverse to the flow direction that includes a periodic strong asymmetric high frequency separation field combined with a weak dc compensation field. All ion species move through the analytical channel carried by the transport gas. The ions also undergo an oscillatory motion transverse to the flow due to the applied field. Because of the waveform asymmetry, ions can also acquire a net transverse velocity due to difference in field strength for different parts of the waveform. The rate at which ions move transverse to the flow depends on the ion mobility field dependence. The alpha parameter mentioned above, α(E)=K(E)∕K(0)−1, is a unitless measure of the change in mobility coefficient between strong field and weak field conditions. A superimposed dc field, the compensation field, is tuned to compensate for this transverse motion, allowing ion species with a particular alpha curve to be selected. The selected ions pass through the DMS analytical region without being neutralized, and can be detected in any detector type, including mass spectrometric detectors and others. Trajectories of the other ion species present in the transport gas will not be correctly compensated, and will be neutralized on one of the electrodes inside the analytical gap. Adjusting the compensation field establishes conditions for filtration for other ion species with different alpha parameters.
DMS-MS implementations on lab-scale mass spectrometers have been the subject of previous papers.17, 18, 19, 20 These papers provide a great deal of background material on DMS usage as a prefilter for mass spectrometry. The present paper focuses on the instrumental basis of DMS technology, namely, the separation electric field and methods for its generation, and on its influence on DMS performance. This aspect has received attention in the literature;3, 21 however, there is no previous consideration of the different implementations of separation voltage generators for DMS and their optimization in terms of DMS separation.
From the point of view of instrumental properties, performance of the DMS method for ion separation depends on a number of interconnected sensor parameters (height, width, and length of the analytical gap), experimental conditions (drift gas composition and flow rate), separation field (frequency, waveform, amplitude), and gas phase chemistry conditions (temperature, pressure, moisture). DMS geometry and electronics affect DMS separation and performance, while the gas-phase environment can modify the alpha parameter itself through reversible clustering.20 The quality of a DMS analysis is determined by sensor and separation generator properties, but also by the alpha parameter, so there may be different optimal designs for different ion species.
Typically, for laboratory conditions operation, the major requirement is to get the best possible DMS performance, balanced between sensitivity and selectivity, without regard for power consumption or size. For field applications of DMS analyzers, additional critical requirements appear that must be considered by designers at the system level. The challenge is to choose an appropriate sensor design with minimum analyzer size and power consumption, low flow rate, wide temperature range, and relying on simpler and more efficient sample handling systems and electronics.
This paper is intended to provide a systematic classification and analysis of existing DMS separation generators, to evaluate performance both theoretically and in comparison with existing experimental data, and, furthermore, to evaluate the sensitivity of DMS performance to variations of waveform away from the optimum shape. To develop the tools for the analysis, we first describe DMS operation and derive the relationship between alpha dependence, separation field, and DMS peak positions (compensation field). Then we consider possible circuit designs for separation field generation, identifying those which are practical and in common use. Finally, we answer the following questions: (1) which feasible separation waveform provides the best ion separation, and (2) what are the best parameters for each separation voltage waveform type? Experimental data are available that allow us to verify the theoretical results.
The structure of the article is as follows. Section 2 sketches DMS theory in application to the separation waveform. The algorithm that allows calculation of the DMS peak position for any separation waveforms and for any ion species is described. Section 2 surveys and discusses the feasible methods for generating the separation voltage (SV). Separation waveform optimization is presented in Section 4. Section 5 contains experimental data for a range of waveform shapes that support and reinforce our general results.
DMS SEPARATION
For ions to pass the DMS analytical region without contacting the walls and being neutralized, the net transverse motion of the ion during a period of DMS field [Eq. 1a] should be zero. This is the DMS filter condition. It is usually represented in terms of the period average transverse speed, ⟨V(t)⟩, [Eq. 1b]. The expressions for the field ion mobility dependence are required for the transverse speed evaluation and are also given in the following equation:
DMS field
| (1a) |
Filter condition
| (1b) |
Field mobility dependence
| (1c) |
Alpha expansion
| (1d) |
In this set of expressions, T is the waveform period, f(t) is the separation field waveform, S is the separation field amplitude, and C is the compensation field. Conditions on f(t) are described below. Only even terms appear in the polynomial expansion of the alpha dependence.22 With f(t) defined as a zero-mean waveform, it is readily found that the compensation field, C, depends only on α(E) not on the low field mobility K(0). Phenomenological aspects of the ion alpha dependence as a characteristic ion property utilized for the ion separation and identification in DMS are further discussed in Ref. 13.
DMS is implemented by passing a gas stream containing ions through a gap between two electrodes (filter gap) where the superimposed separation (S) and compensation (C) fields affect the ions. The trajectory of each ion species is determined by the drift gas flow, alpha parameter, and DMS field [Eq. 1a]. Certain combination of S and C allows the target ions to pass through the filter gap without colliding with the electrodes and being neutralized, according to the DMS filter condition [Eq. 1b].
The high frequency part of the DMS field [Sf(t), the separation field] must satisfy the following conditions [Eq. 2]. Its average period value is zero (zero offset condition), separating the separation field from the quasistatic compensation field. The peak amplitude of the positive portion is greater than the peak amplitude of the negative portion (enforcing the asymmetry condition, and defining field polarity). Under the influence of the DMS field, ions oscillate perpendicular to the carrier gas flow. The amplitude of the ion oscillation must be smaller than the filter gap or the ions will be neutralized on the electrodes (high frequency condition). In addition, the maximum separation field strength should be high enough to exploit the greatest possible range of the ion mobility field dependence without electrical discharge in the sensor (high strength condition).
Zero offset
| (2a) |
Asymmetry
| (2b) |
High frequency
| (2c) |
High strength
| (2d) |
where f(t) is a periodic normalized {max[f(t)]=1} function describing the separation waveform, S is the separation field peak amplitude, EBD is the break down electric field strength, T and F are separation field period and frequency, d is the distance between DMS electrodes, K is the approximate ion mobility coefficient for the analyte, and triangular brackets denote averaging over one period of separation field.
Ions drifting due to the separation field would eventually reach one of the electrodes and be neutralized; however, the deviation of the drift trajectory can be corrected by a compensation field that is specific to a given ion in the particular separation field. The compensation field produces an offsetting drift, allowing ions to remain in equilibrium inside the filter gap. Only compensated ions pass through the filter gap with gas flow while other ion species are filtered. Every ion species appears as a spectrum peak at a certain value of the compensation field that depends on the separation field and the ion’s alpha dependence. The filter condition [see Eq. 1b] results in the following expression for the compensation field, C, in terms of the alpha dependence, the separation field magnitude, S, and waveform, f(t),3, 13
| (3) |
The compensation field is expanded as odd powers of the separation field. When the polynomial expansion for the alpha function inserted into this expression, this equation takes the form of a ratio of series in which the separation waveform is represented by its moments, ⟨fk⟩, that is, by the averaged powers of the normalized waveform,
| (4) |
Matching the powers of S in this expression, term by term through the number of terms selected for use in the C and α expansions, allows the compensation field coefficients to be related to the expansion coefficients for the alpha function and the separation waveform moments, with the following result for three terms in both C and α,
| (5) |
These expressions can be used in either direction, either as shown to determine C coefficients from those of α, or with a little rearrangement, to determine α coefficients from C coefficients. The effects of the separation field amplitude and the waveform are separately represented in the expression for the coefficients: the amplitude appears as powers of S in the expansion of C and the waveform appears as the moments of f(t). Changing the separation field amplitude with the same waveform changes the peak position (compensation field for certain ion) as given by the Eq. 3. This representation allows us to consider the influence on compensation field of the separation field waveform at fixed separation field amplitude. We see that changing the separation waveform at the same field amplitude affects DMS peak position. The waveform moments, ⟨fk⟩, can be obtained analytically for idealized waveforms, or by numerical integration for experimentally measured waveforms. Such an approach provides a basis for waveform optimization.
SEPARATION VOLTAGE GENERATORS
In this section we consider feasible DMS separation waveforms, survey, and discuss practical ways to generate them. We shall begin with a few general considerations. It is intuitively clear that the longer time ions spend under the influence of high field, the better the DMS separation. In other words shortening the front edges of the separation waveform improves DMS separation. The ideal rectangular (IR) pulse can be strictly proven to be the best possible waveform for DMS. However, duty cycle of the rectangular waveform is still an object for optimization. Both very short pulses (duty cycle→0) and symmetrical pulses (duty cycle→0.5) nullify DMS separation, so the optimal value, which provides the highest compensation field, C, for a given ion lies somewhere in between. The optimal duty cycle depends on the alpha function for the ion of interest, and it will be shown that different ions require different waveforms to maximize the compensation field. It is important to emphasize here that an IR waveform is unreachable for practical DMS. However, the IR waveform is useful as a “gold standard” for rating real separation waveforms.
One more general conclusion can be made for the output parameters of the separation waveform generator. To create separation field inside the filter gap, a high frequency, high amplitude separation voltage (SV) is applied to the filter gap electrodes. High frequency requirement [Eq. 2c] results in a criterion for the product of SV amplitude (U) and frequency (F). To derive this criterion, the filter gap height, d, is replaced in Eq. 2c by U∕S,
| (6) |
Reasonable values (S=30 kV∕cm, K=1 cm2∕V s) yield estimations of UF⪢0.25 [kV MHz]. All SV generators must satisfy this criterion to ensure that the ion oscillation is smaller than the gap.
There are a few ways to implement a SV generator. All practical high voltage and high frequency asymmetric waveform generators known today can be reduced to three main types proposed in Ref. 23. A fourth method mentioned there, nonlinear capacitance in resonant LC circuit did not find practical application and will be ignored in this paper. So we classify SV generators by output waveform as follows:
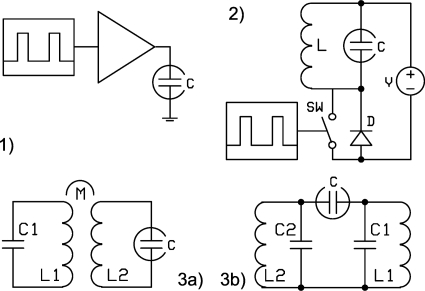
Block schemes of these generators are presented in Fig. 1, with the advantages and disadvantages discussed below.
Figure 1.
Implementation of the SV generators. (1) Pulse amplifier, PA; (2) Flyback generator, FB; (3) Two-harmonics generator, H2 (a) inductive coupling and (b) capacitive coupling.
APA [Fig. 1(1)] operates by power amplification, with the required (rectangular) waveform amplified up to necessary magnitude. PA output waveform repeats to some extent the input waveform, so potentially PA is able to provide the best DMS separation. However, if the PA output deviates from the IR waveform, the effectiveness of the DMS waveform is reduced. For example, we found that, if the front edge duration equals 0.1 of the separation waveform period, the resolving power of the DMS instrument is reduced by about 15% in comparison with the IR waveform (front edge duration 0).
Along with providing the highest resolving power, PA has some drawbacks. Since the DMS filter gap is a capacitive load for the SV generator, forced driving of such load results in significant power consumption. A lower estimate for power consumption for a PA can be calculated as
| (7) |
Actual power consumption significantly exceeds this estimation because of the internal power dissipation and parasitic capacitance within the PA. Combining Eqs. 7, 6 allows numerical evaluation of the PA power consumption. Assuming the capacitive load and parasitic capacitance to be about 40 pF yields P⪢0.01U [W]. High power consumption may be unacceptable, particularly for portable field analyzers.
As we discussed above for the best DMS separation front edges of the waveform should be as short as possible. To shorten pulse rise times, PA must provide extremely high output peak current. For example, if the front edge duration is 0.1 of the SV period, the output pulse current of the PA generator can be determined from Eq. 8,
| (8) |
Under the same assumptions as above PA output current can be evaluated as I⪢50 mA. Such high output current along with high output voltage may cause electric shock, and therefore special safety measures need to be provided.
Another disadvantage of the PA generator is related to reliability. DMS separation gap is a subject of various external factors, which can lead to shorting or arcing. Without special protective measures consequences of such event may be devastating for the PA circuit.
Resonant circuit designs provide an alternate way to create SVs. In general, power consumption is reduced by a Q-factor of the resonant system, which can be as high as 100. Risk of electric shock is significantly reduced in comparison with PA because contact with the high voltage output results in termination of SV generation. Resonant systems are tolerant to shorting and continue working after the normal load is restored. The main challenge for the design of resonant generators in DMS is the creation of an asymmetrical waveform. FB and H2 generators are two main ways to reach asymmetry.
FB generator [Fig. 1(2)] consists of a resonant LC circuit and a switch connected to the circuit directly or through a transformer. The basic operation is as follows.
During the on-time of the switch, a linearly rising current flows through the inductor and energy is stored in the inductance as current. When the voltage across the inductor reverses, the stored energy will charge the capacitor up to a high voltage as the inductor current decreases as shown in Eq. 9,
| (9) |
where U is amplitude of the output voltage on the load capacitor; V is power supply voltage; t is switch on-time; L is inductance; and C is load capacitance.
The capacitor then discharges through the inductor. The system behaves like a regular LC circuit but only for the positive half-period of the harmonic waveform. As soon as the voltage across the capacitor becomes negative the diode opens and energy circulating in the resonant circuit returns back to the power supply. Thus the output waveform of the FB generator is a sinusoidal pulse of duration π(LC)1∕2 and amplitude given by Eq. 9, and pulse frequency is equal to the switch frequency. If a step-up transformer is used to increase output voltage, the calculation is based on the load capacitance reduced to the primary winding.
Power consumption is determined by the Q-factor of the resonant circuit and can be very low. FB generator waveform is relatively stable because the inductor and capacitor instabilities affect the output pulse duration and amplitude as a square root. As for most resonant systems, FB generators are safe, reliable, and will resume operation after a shorting when its cause is eliminated.
H2 generator [Fig. 1(3)] is a resonant system with two resonant frequencies of ratio 2. The H2 generator output waveform is the sum of two harmonics,
| (10) |
where a, b are the amplitude of harmonics (a+b=1 by definition); φ is the phase shift between harmonics; ω is the main (lowest) resonant frequency. The phase shift is zero in most configurations. For φ=0, the H2 waveform moments of Eq. 5 necessary to relate ion mobility and waveform shape to DMS separation can be obtained analytically ( moments for the H2 waveforms for powers j=2–7 are given by (a2+b2)∕2, (3a2b)∕4, 3(a4+4a2b2+b4)∕8, 5(2aa4b+3a2b3)∕8, 5(2a6+21a4b2+18a2b4+2b6)∕32, and 105a2b(a4+4a2b2+2b4)∕64. Numerically, for a=2∕3 and b=1∕3, . Integrations performed using Wolfram Mathematica 7.0, Wolfram Research, Champaign, Illinois.).
To create such a waveform, two regular LC resonant circuits are to be coupled. The LC circuits are characterized by the resonant frequency ν=2π(LC)−1∕2. Coupling is characterized by the coefficient k=Z12 (Z1Z2)−1∕2, where Z12 is coupling impedance; Z1 and Z2 are corresponding impedances of the circuits. Coupling can be achieved in different ways, and the H2 generators may be distinguished by the type of coupling, inductive or capacitive. Capacitive coupling also can be implemented in different ways, so a few configurations (internal, external, and simplified coupling) are possible.
To illustrate the notion of the coupled resonant circuits we consider two inductively coupled resonant circuits of resonant frequencies ν1 and ν2. Coupling coefficient is k=M(L1L2)−1∕2, where M is mutual inductance. Active resistances are assumed to be negligible. Uncoupled two-circuits resonant system (k=0) has two resonant frequencies w1=ν1 and w2=ν2. Increasing k results in a shift of resonant frequencies. The characteristic equation relating initial resonant frequencies, resulting resonant frequencies, and coupling coefficient is Eq. 11,
| (11) |
Twofold condition for the resulting resonant frequencies of the resonant system (w2=2w1) yields the relation between the coupling coefficient and initial resonant frequencies ratio,
| (12) |
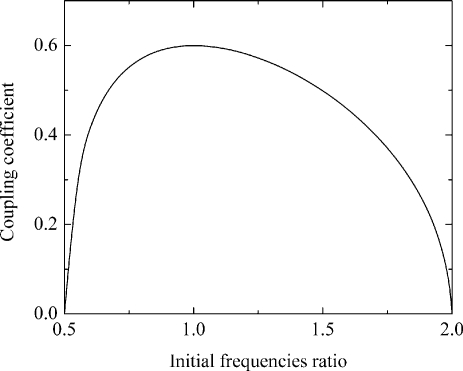
Analysis of Eq. 12 reveals that a H2 generator can be implemented only within the limited range of parameters. Initial resonant frequencies ratio should be in a range 0.5–2 and the coupling coefficient should be smaller than 0.6 (see Fig. 2). Typically H2 generators use coupling values of 0.3–0.6.32 Inductor and capacitor instabilities directly affects the output waveform, and it is critical to account for this29 when designing a stable H2 generator. Features of the operation at low coupling (<0.05) will be discussed in Sec. 5.
Figure 2.
Coupling coefficient as a function of the initial resonant frequencies ratio.
Power consumption is determined by the Q-factor of the resonant circuit and can be very low. Alternatively, output voltage and frequency can be very high. Similar to the discussion regarding FB resonant systems, H2 generators are safe and reliable.
SEPARATION WAVEFORM OPTIMIZATION
In this section, we determine the waveform that provides best DMS separation for feasible DMS generators. To formalize our task we assume that in general the highest compensation field corresponds to the highest resolving power of the DMS. Therefore we are seeking to maximize compensation field for certain ion species with feasible separation waveforms. Separation field amplitude and alpha are considered as independent parameters of the optimization task. Theoretical solution will be verified and confirmed experimentally in Section 5.
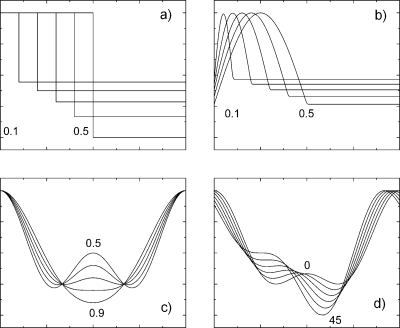
Thus we have sorted out three classes of DMS separation waveforms of practical value: quasirectangular, semiresonant, and two harmonic. However, inside of each class, waveforms can vary as shown in Fig. 3. For the optimization these variations should be characterized by numerical parameters describing the waveform. We define the term “form parameter” (FP) for this purpose (see text in Fig. 3). For IR generators, the FP is the duty cycle, pulse duration divided by pulse period. For FB generators, the FP is a ratio of the sinusoidal pulse duration divided by the pulse period. For two harmonic generators, FP is first harmonic amplitude divided by pulse amplitude, FP=a∕(a+b). Since a+b=1 by definition FP=a [see Eq. 10]. Frequently used ratio of harmonic amplitudes, a∕b, is related to our form parameter as a∕b=FP∕(1-FP). Phase shift of the two harmonics also affects DMS separation, so strictly speaking it should be optimized as well. However, from the consideration of symmetry we expect that zero phase shift provides the best DMS separation as will be experimentally confirmed in Section 5.
Figure 3.
Variation of the waveform shape with form parameter for different SV generators (a) ideal rectangular, IR; (b) flyback, FB; (c) two harmonics, H2, (zero phase shift); (d) H2, phase shift (0.66 form parameter).
Notice that DMS separation takes place within a limited range of the form parameter values. The range of the DMS separation for IR generators is 0–0.5; for H2 generators is 0–1; and for FB generators is 0–0.742. Both extremes give no DMS separation because they correspond to either a symmetrical waveform or infinitely sharp pulse. Form parameters in-between the extremes are known to provide DMS separation. Therefore we may expect the following FP dependence: DMS separation increases with increasing FP from zero, reaches a maximum, then decreases. This simple consideration verifies the correctness of the optimization task: the solution of the optimization task exists and lies within the range specified.
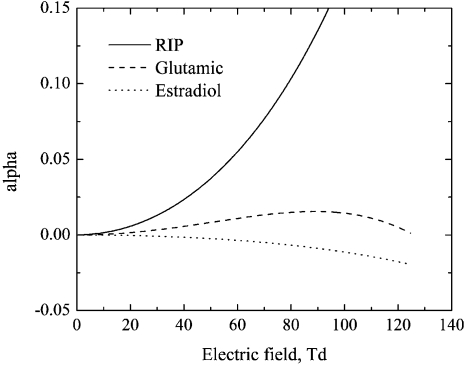
Here one important detail must be clarified. Analysis of Eq. 3 reveals that optimal separation waveforms are different for different ions distinguished by their alpha dependences. To evaluate the difference, alpha functions should be classified as follows. Two alpha function patterns are typically observed for ions within a dry transport gas. These are a monotonically decreasing alpha and an alpha function that increase with the field up to a maximum value and then decrease; however, monotonically increasing alpha is also possible. The variety of possible alpha functions can be reduced to three main types: monotonic increasing, monotonic decreasing, and so-called max-type alpha function (increasing then decreasing). All three typical alpha functions for real ions33 are shown in Fig. 4. Below these three types of the alpha function will be traditionally34 referred to as alpha-A, alpha-C, and alpha-B, correspondingly. Notice that min-type alpha function (decreasing then increasing) does not exist for reasons related to the physical basis of the alpha function.35
Figure 4.
Examples of the three main types of alpha functions behavior with field: monotonic increasing alpha-A (positive reactant ion); monotonic decreasing alpha-C (estradiol sulfate), and max-type alpha-B (glutamic acid).
At this point we can make the optimization task statement. We are seeking for the form parameter maximizing the compensation voltage for three types of alpha functions and three types of separation waveforms corresponding to three types of SV generators. To solve this optimization task we employed two main approaches: computer simulation and theoretical calculation. Theoretical calculations were principally carried out and a computer simulation with SIONEX DMx software36 was utilized for an independent check.
Procedures
Our theory is based on Eqs. 3, 4, 5 relating DMS peak position, ion field mobility dependence, separation field amplitude, and separation waveform. For alpha-A mobility behavior, approximated by a quadratic function, an analytical solution is possible. Substituting quadratic alpha in Eq. 5 and truncating the series yields the compensation field as a cubic function of the separation field amplitude,
| (13) |
Compensation field under the same conditions will be proportional to the averaged cube of the normalized waveform, ⟨f3⟩. Therefore the optimal waveform for alpha-A corresponds to maximum ⟨f3⟩, and the following values can be calculated. For an IR waveform, the optimal duty cycle is 0.333 and ⟨f3⟩=0.25. For a two-harmonics waveform the optimal form parameter is 0.667 (harmonics ratio 2), phase shift is 0, and ⟨f3⟩=0.111. For a FB waveform the optimal duty cycle is 0.447 and ⟨f3⟩=0.123. Comparative DMS resolution under the same conditions will be 100%, 44%, and 49% for IR, H2, and FB waveforms, correspondingly. This result is accurate for relatively low separation field where any alpha function can be approximated as positive or negative quadratic functions. However, in the absence of clustering modifiers,20 the majority of ions display alpha-C or alpha-B mobility behavior. Optimization of the separation waveform for these types of ions requires extended calculations.
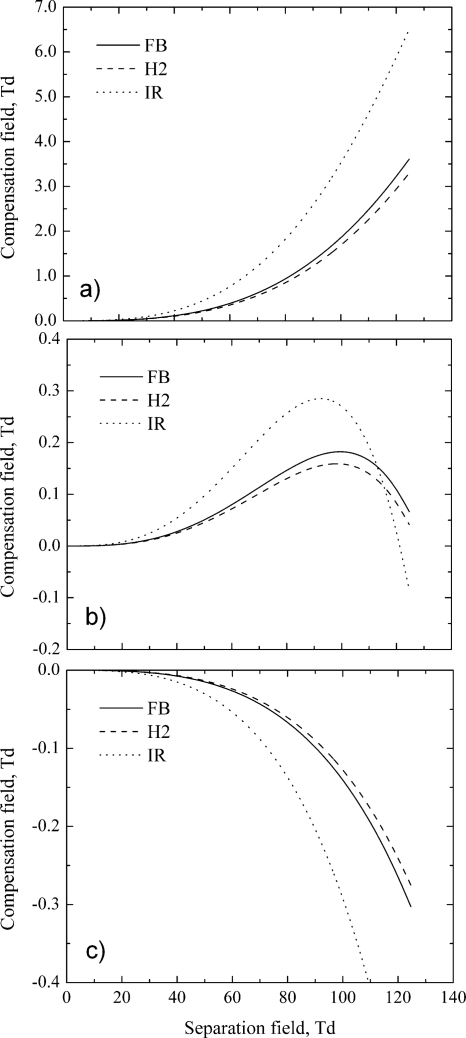
We have calculated dispersion plots, C(S), for different alpha functions and different SV generators (see Fig. 5). Form parameters for these calculations correspond to typical experimental conditions and the resulting dispersion plots are similar to the experimentally observed ones. Notice that compensation field for max-type alpha-B ions cannot be more than a certain value, and the DMS resolution reaches maximum at a certain separation field (usually about 80–110 Td).
Figure 5.
Dispersion plots, C(S), for different SV generators and alpha functions: (a) monotonic increasing alpha-A (positive reactant ion); (b) max-type alpha-B (glutamic acid) and (c) monotonic decreasing alpha-C (estradiol sulfate).
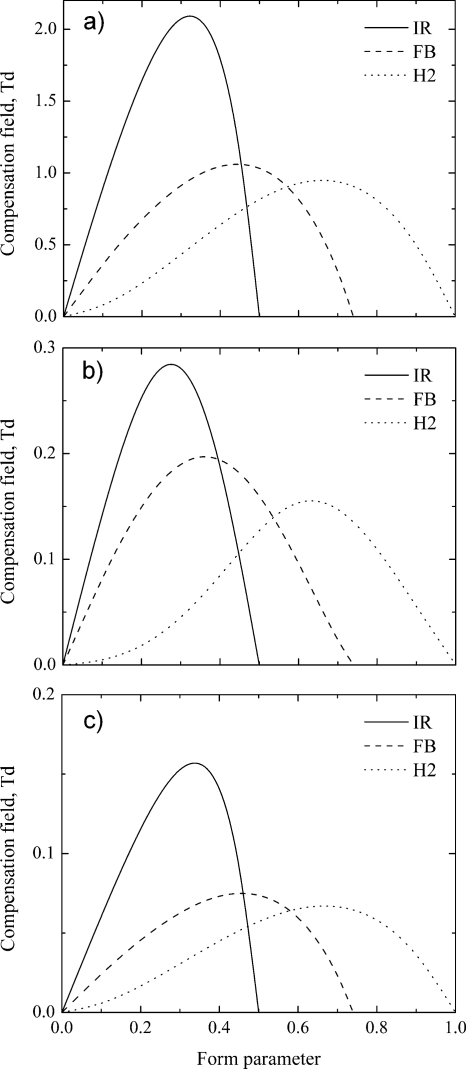
Form parameter variation for a particular generator type shifts the compensation field curves up and down. We can calculate compensation field (peak position at certain SV value) in dependence on the form parameter, C(FP), for different alphas and separation waveforms (see Fig. 6). As expected C(FP) curves attain a clear maxima, and the assumption is that the maxima correspond to optimal waveforms.
Figure 6.
Compensation field vs form parameter for different SV generators and alpha functions: (a) monotonic increasing alpha-A (positive reactant ion); (b) max-type alpha-B (glutamic acid) and (c) monotonic decreasing alpha-C (estradiol sulfate).
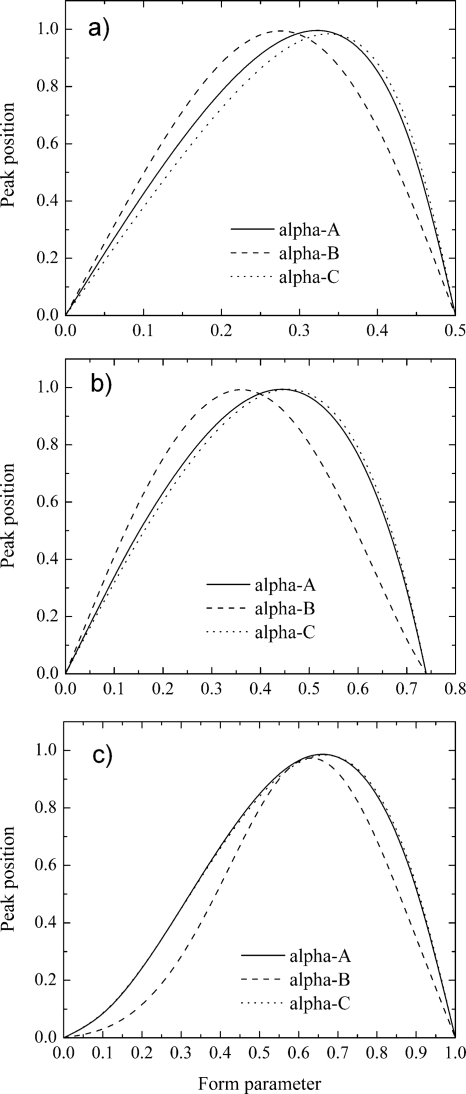
To generalize our finding we have regrouped and normalized form parameter dependencies (see Fig. 7). Data analysis reveals that optimal form parameter values differ for different ions. To maximize compensation field for different types of ion species, the form parameters should be tuned in a range of about 12%, 13%, and 3.5% for the IR, FB, and H2 waveforms, correspondingly. Accurate FP tuning can provide as much as 10%, 8%, and 2% better DMS resolution for the IR, FB, and H2 waveforms, correspondingly.
Figure 7.
DMS peak position vs form parameter for different alpha functions and SV generators: (a) IR; (b) FB; (c) H2.
A summary of our optimization results is presented in Table 1. Numerical values for three types of the alpha functions and three types of the SV generators are divided into nine groups of similar structure. Optimal form parameter values are presented in the first row. Resolving power estimated as a compensation field for real generator divided by the maximum possible compensation field reachable with IR waveform is presented in the second row. Compensation field for the test chemical is presented in the third row. For monotonic alpha functions (A and C) separation field was equal to 80 Td. For max-type alpha-B separation field was chosen to reach absolute maximum of the compensation field (80, 90, and 85 Td correspondingly for IR, FB, and H2).
Table 1.
Optimal waveform.
| Alpha-A | Alpha-B | Alpha-C | |
|---|---|---|---|
| Positive reactant ion | Glutamic acid ion | Estradiol sulfate ion | |
| Ideal Rectangular waveform | |||
| Optimal FP | 0.323 | 0.275 | 0.337 |
| Resolving power | 100% | 100% | 100% |
| Experimental | C(80)=2.099 Td | C(80)=0.286 Td | C(80)=0.159 Td |
| Stability | 7.2% | 7.9%. | 6.5% |
| Flyback generator waveform | |||
| Optimal FP | 0.443 | 0.361 | 0.457 |
| Resolving power | 51% | 69% | 47% |
| Experimental | C(80)=1.067 Td | C(90)=0.198 Td | C(90)=0.075 Td |
| Stability | 8.2% | 8.6% | 7.4% |
| Two harmonics generator waveform | |||
| Optimal FP | 0.661 | 0.632 | 0.667 |
| Resolving power | 46% | 56% | 43% |
| Experimental | C(80)=0.961 Td | C(85)=0.160 Td | C(80)=0.068 Td |
| Stability | 6.0% | 4.8% | 6.0% |
Finally we should discuss stability aspect of the form parameter. From a practical point of view it is important to know how fluctuation of the form parameter affects the peak position. We present stability estimation in the fourth row. Waveform stability is characterized by a magnitude of the form parameter fluctuation corresponding to 1% stability of the DMS peak position (compensation voltage value).
EXPERIMENTAL
To validate our theoretical findings series of experiments had been conducted to observe how the waveform variation affects DMS peak position.
FB generator
The FB DMS experiments were conducted with the SVAC (Ref. 27) (Sionex Corp. Bedford, MA) electronics and a custom DMS sensor. The dimensions of the electrodes in the DMS analyzer were the following: length 15.0 mm, width 1.5 mm, and gap 0.50 mm. The transport gas flow rate was 0.3 L min−1 and the SV amplitude was 800 V (corresponding electric field in the analytical gap was 65 Td) with frequency of 1.18 MHz. The ionization source was 63Ni of 2 mCi. All experiments were carried out in purified nitrogen at ambient pressure and temperature with a moisture level below 5 ppmv. Test ions were positive reactant ions in nitrogen to improve accuracy of the peak position measurements.
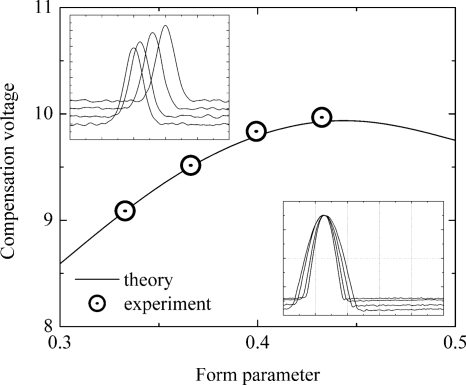
Additional capacitance connected in parallel with the filter gap capacitance allows waveform variation over a small range of form parameter (0.33–0.43). Separation waveforms acquired with digital oscilloscope (Tektronix TDS 3014B) were integrated to calculate form parameter moments, ⟨fi⟩. Experimental f-moments appear to be slightly different than the theoretical ones calculated for ideal FB waveforms. Known alpha function and calculated f-moments yield positive reactant ion peak positions to compare with experimentally measured ones. Theoretical calculation appears to be in a good agreement with experiment (see Fig. 8).
Figure 8.
Dependence of positive reactant ion peak position on FB waveform form parameter. DMS spectra are in the upper insertion and DMS waveforms are in the lower insertion.
Pulse amplifier
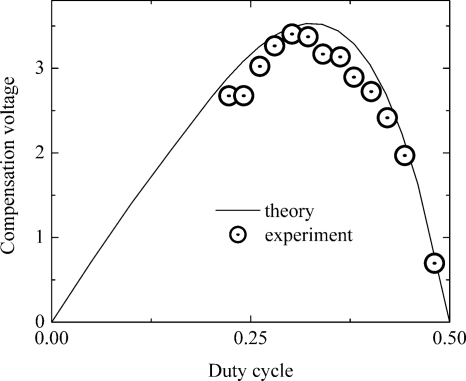
DMS separation with PA was experimentally and theoretically investigated in Ref. 25. Two 2 kV, 300 W power supplies drive the high voltage switch together with a input pulse signal that controls frequency and duty cycle. The SV amplitude and frequency were 1 kV and 0.8 MHz, respectively, delivered to the DMS electrode. The higher frequency necessary for improving ion transmission limits the pulse amplitude and distorts the rectangular waveform. Air was purified through a molecular sieve and served as the carrier gas at flows of 1 L min−1. The DMS filter gap was 0.5×5×15 mm and the ion source was 63Ni of 1 mCi. All experiments were carried out in air at ambient pressure and temperature with moisture levels of 0.150 ppmv.
DMS peak position was analytically calculated in dependence of the duty cycle for the IR waveform under assumption of two-term approximation of the alpha function. Theoretical curves presented in Figs. 9 and 10 of Ref. 25 are exactly the same as ours shown in Fig. 7a for an IR generator. If two independent approaches yield the same result it may serve as a validation for both calculation procedures.
Experimental compensation voltages for alpha-A ions were in good agreement with theory. However, alpha-B ions fit the theoretical curve not so good. This illustrates the limitations of the purely analytical approach. Real waveforms do not have an IR shape and real alpha-B function cannot be accurately approximated by the two term expansion, which was used in that publication.
We believe that most of the discrepancies in the Ref. 25 can be eliminated by using a three terms approximation for alpha-B function and accounting for the waveform nonideality. The algorithm described above provides better agreement with experimental data reported in cited reference. The nonideal waveform shown in Fig. 2 of Ref. 25 allows calculation of the f-moments, and they appear to be quite different than the moments for the IR waveform used for the analytical calculation in the cited reference. A three-term approximation for alpha-B functions and calculation with real waveform coefficients results in acceptable agreement of the theoretical curve and experimental data (see Fig. 9).
Figure 9.
Compensation voltage for two pentanone plotted against duty cycle for a real PA generator. Experimental data are from Ref. 25. Theoretical curve obtained with the algorithm proposed in this article.
Analysis of the PA-DMS experiments reveals some problem with alpha data compatibility. PA separation waveforms at low and high output voltages are different, as displayed in Fig. 2 of Ref. 25 and confirmed by accurate calculation. At 500 V the quasirectangular waveform provides 5% lower DMS resolution than the ideal one, and at 1000 V the resolution is 15% lower. Higher output voltages are also expected to obey this trend. Such behavior results in the lower accuracy of the alpha calculation and therefore makes experimental data incompatible with other types of SV generators.
H2 generator
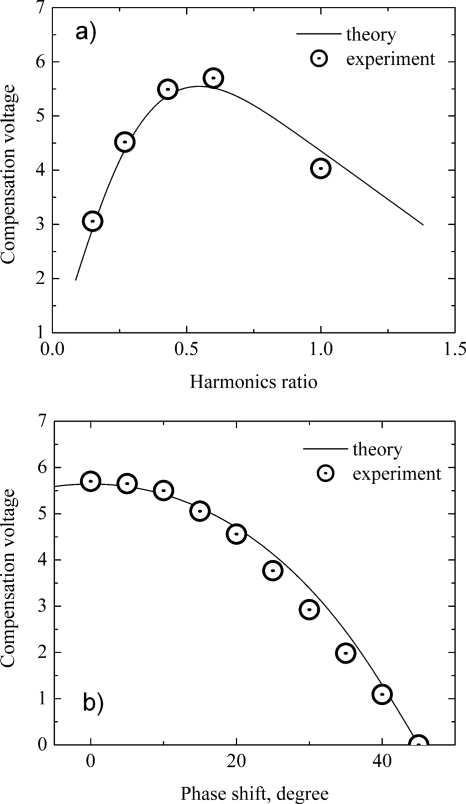
H2-DMS separation was studied with a generator developed by MDS Sciex.37 The main feature of this generator is very low coupling (see Fig. 2 for operation mode). Both resonant circuits work almost independently driven by independent circuits with the two synchronized harmonics applied to opposing electrodes. Such a mode of operation allows instrumental stabilization of the harmonics amplitude and phase shift, resulting in excellent separation field stability (better than 1%) in long and short terms. High Q resonant coils provide high output voltage and frequency.
Experiments were conducted in ESI-DMS-MS configuration. The details of the electrospray ionization source, planar DMS, mass spectrometer, and the means utilized to interface them have been described previously.17, 20 Briefly, a planar DMS was interfaced to an API 4000™ instrument by sealing the DMS cell to the inlet orifice of the mass spectrometer. The dimensions of the DMS cell were 15 mm long, 10 mm wide with a 1 mm gap between the electrodes. The transport gas was nitrogen provided at 0.8 L∕min. The temperature of the transport gas was approximately 100 °C. The SV generator was operated at 3 MHz, providing SV with peak magnitude from 0–4000 V peak-to-peak. Corresponding maximum electric field amplitude was 128 Td. The compensation voltages could be scanned ±100 V or set to a particular value within that range. A high precision barometer (Setra Model 276 with 0.1% accuracy, Setra, Boxborough, MA) was used to track the barometric pressure in the DMS cell38 and feedback this information to the SV generator controller. The standard TurboV™ ESI source was used with an extension flange to adjust the position of the source relative to the extended protrusion of the curtain plate when the DMS was installed. Samples were infused at 10 μL∕min from a syringe pump (Harvard Apparatus, Syringe Infusion 22, South Natick, MA).
Stable experimental conditions and a wide range of the separation waveform variation allowed experiments of high accuracy. Reserpine ions (alpha-C) were used for testing. Data were acquired at SV 3500 V peak-to peak (112 Td). The harmonics amplitude ratio (second harmonic amplitude divided by the fundamental amplitude) was investigated in a range of 0.15–0.1 (corresponding form parameter is equal to 0.87–0.5), and the phase shift in a range of 0°–45° [see Figs. 3c, 3d for corresponding waveforms]. Theory appears to be in good agreement with the experimental data (see Fig. 10).
Figure 10.
Experimental data and theory for (a) CV vs H2 harmonics ratio; (b) CV vs H2 harmonics phase shift.
CONCLUSION
Formulas allowing calculation of the DMS peak position for any separation field waveform and any alpha dependence have been given. These expressions have been validated experimentally and by comparison with an independent method.
Three main feasible methods of DMS separation field generation were reviewed and separation waveform optimization has been conducted. Optimal waveforms were found to be dependent on the type of ions (alpha functions). Our finding can be summarized as follows:
Ideal rectangular (IR) waveform provides maximum possible DMS separation (MPS);
Pulse amplifiers (PA) do not provide IR waveform, consume a lot of power, and are not safe;
Two harmonics (H2) generators are able to reach 43%–56% of MPS, are stable, and safe; and
Flyback (FB) generators are able to reach 47%–69% of MPS, are stable, and safe.
Comparing the two resonant circuit generators, the advantages of the FB generator lies slightly improved resolution and small size, while the principal advantage of the H2 generator is its ability to operate effectively under conditions of high SV amplitudes, high frequency, and high capacitive load. The desirable attributes of the FB generator make it ideal for portable field applications, whereas the H2 generator is ideal for laboratory applications.
ACKNOWLEDGMENTS
This work was partially supported by the Columbia University Center for Medical Countermeasures against Radiation (P.I. David Brenner), NIH (NIAID) Grant No. U19 AI067773-02.
References
- Gorshkov M. P., SU 966,583 G01N27/62, 1982.
- Buryakov I. A., Krylov E. V., and Soldatov V. P., SU 1485808, G01N27/62, 1989.
- Buryakov I. A., Krylov E. V., Nazarov E. G., and Rasulev U. Kh., Int. J. Mass Spectrom. Ion Process. 128, 143 (1993). 10.1016/0168-1176(93)87062-W [DOI] [Google Scholar]
- Eiceman G. A. and Karpas Z., Ion Mobility Spectrometry, 2nd ed. (CRC, Boca Raton, 2004). [Google Scholar]
- Shvartsburg A. A., Differential Ion Mobility Spectrometry: Nonlinear Ion Transport and Fundamentals of FAIMS (CRC, Boca Raton, 2009). [Google Scholar]
- Purves R. W., Guevremont R., Day S., Pipich C. W., and Matyjaszczyk M. S., Rev. Sci. Instrum. 69, 4094 (1998). 10.1063/1.1149255 [DOI] [Google Scholar]
- Buryakov I. A., Krylov E. V., Makas’ A. L., and Nazarov E. G., J. Anal. Chem. 48, 156 (1993). [Google Scholar]
- Eiceman G. A., Krylov E., Krylova N., Nazarov E. G., and Miller R. A., Anal. Chem. 76, 4937 (2004). 10.1021/ac035502k [DOI] [PubMed] [Google Scholar]
- Krylova N., Krylov E., Eiceman G. A., and Stone J. A., J. Phys. Chem. A 107, 3648 (2003). 10.1021/jp0221136 [DOI] [PubMed] [Google Scholar]
- Eiceman G. A., Miller R. A., Tadjikov B., Krylov E., Nazarov E. G., Westbrook J., and Funk P., J. Chromatogr. A 917, 205 (2001). 10.1016/S0021-9673(01)00656-2 [DOI] [PubMed] [Google Scholar]
- Eiceman G. A., Krylov E. V., Tadjikov B., Ewing R. G., Nazarov E. G., and Miller R., Analyst (Cambridge, U.K.) 129, 297 (2004). 10.1039/b316326a [DOI] [PubMed] [Google Scholar]
- Synapt G2, Waters, http://www.waters.com.
- Krylov E. V., Nazarov E. G., and Miller R. A., Int. J. Mass Spectrom. 266, 76 (2007). 10.1016/j.ijms.2007.07.003 [DOI] [Google Scholar]
- Anderson A. G., Markoski K. A., Shi Q., Coy S. L., Krylov E. V., and Nazarov E. G., in Chemical, Biological, Radiological, Nuclear, and Explosives (CBRNE) Sensing IX, edited by A. W.FountainIII and Gardner P. J. (SPIE, Bellingham, WA, 2008); [Proc. SPIE 6954, 69540H (2008)]. [Google Scholar]
- Nazarov E. G., Anderson A. G., Krylov E. V., Coy S. L., Miller R. A., Burchfield D., and Eiceman G. A., “Miniature DMS-IMS Detector for Enhanced Resolving Power,” Proceedings of 16th International Conference on Ion Mobility Spectrometry (22–25 July 2007), Mikkeli, Finland.
- Miller R. A., Eiceman G. A., Nazarov E. G., Zapata A., Krylov E., and Tadjikov B., Int. J. Ion Mobility Spectrom. 4, 58 (2001). [Google Scholar]
- Levin D. S., Vouros P., Miller R. A., Nazarov E. G., and Morris J. C., Anal. Chem. 78, 96 (2006). 10.1021/ac051217k [DOI] [PubMed] [Google Scholar]
- Levin D. S., Miller R. A., Nazarov E. G., and Vouros P., Anal. Chem. 78, 5443 (2006). 10.1021/ac060003f [DOI] [PubMed] [Google Scholar]
- Schneider B. B., Covey T. R., Coy S. L., Krylov E. V., and Nazarov E. G., “Planar differential mobility spectrometer as a pre-filter for atmospheric pressure ionization mass spectroscopy,” Int. J. Mass Spectrom. (in press). [DOI] [PMC free article] [PubMed]
- Schneider B. B., Covey T. R., Coy S. L., Krylov E. V., and Nazarov E. G., “Control of chemical effects in the separation process of a defferential mobility/mass spectrometer system,” Eur. J. Mass Spectrom. (in press). [DOI] [PMC free article] [PubMed]
- Shvartsburg A. A. and Smith R. D., J. Am. Soc. Mass Spectrom. 19, 1286 (2008). 10.1016/j.jasms.2008.05.008 [DOI] [PMC free article] [PubMed] [Google Scholar]
- Mason E. A. and McDaniel E. W., Transport Properties of Ions in Gases (Wiley, New York, 1988). 10.1002/3527602852 [DOI] [Google Scholar]
- Krylov E. V., Instrum. Exp. Tech. 40, 628 (1997). [Google Scholar]
- Buryakov I. A., Krylov E. V., and Soldatov V. P., SU 1337934 A2, 15 September 1987.
- Papanastasiou D., Wollnik H., Rico G., Tadjimukhamedov F., Mueller W., and Eiceman G. A., J. Phys. Chem. A 112, 3638 (2008). 10.1021/jp711732c [DOI] [PubMed] [Google Scholar]
- Krylov E., Nazarov E. G., Miller R. A., Tadjikov B., and Eiceman G. A., J. Phys. Chem. A 106, 5437 (2002). 10.1021/jp020009i [DOI] [PubMed] [Google Scholar]
- SVAC DMS, Sionex Corp., www.sionex.com.
- Krylov E. V., Instrum. Exp. Tech. 34, 114 (1991). [Google Scholar]
- Kouznetsov V., U.S. Patent No. 5,801,379, Mine Safety Company. Pittsburgh, PA, USA (1 September 1998).
- Buryakov I. A., Krylov E. V., and Soldatov V. P., SU 1412447 G01N27/62,22 March 1988.
- Ridgeway M. E., Remes P. M., McKinney C., and Glish G. L., ASMS 2008.
- Potvin L. and Baribeau Y., U.S. Patent No. 7,078,678 B2, Ionalytics Corp., Ottawa, Canada (18 July 2006).
- Schneider B. B., Covey T. R., Coy S. L., Krylov E. V., and Nazarov E. G., “Chemical Effects in the Separation Process of a Differential Mobility/Mass Spectrometer System,” Anal. Chem. (accepted). [DOI] [PMC free article] [PubMed]
- Guevremont R. and Purves R. W., Rev. Sci. Instrum. 70, 1370 (1999). 10.1063/1.1149599 [DOI] [Google Scholar]
- Krylov E. V. and Nazarov E. G., Int. J. Mass Spectrom. 285, 149 (2009). 10.1016/j.ijms.2009.05.009 [DOI] [Google Scholar]
- Nazarov E. G., Miller R. A., Coy S. L., Krylov E., and Kryuchkov S. I., Int. J. Ion Mobility Spectrom. 9, 40 (2006). [Google Scholar]
- Vandermey J., U.S. Patent No. 2009/0140138 A1 (4 June 2009).
- Nazarov E. G., Coy S. L., Krylov E. V., Miller R. A., and Eiceman G. A., Anal. Chem. 78, 7697 (2006). 10.1021/ac061092z [DOI] [PubMed] [Google Scholar]


