Abstract
The analysis of the ultrasonic frequency-dependent backscatter coefficient of aggregating red blood cells reveals information about blood structural properties. The difficulty in applying this technique in vivo is due to the frequency-dependent attenuation caused by intervening tissue layers that distorts the spectral content of signals backscattered by blood. An optimization method is proposed to simultaneously estimate tissue attenuation and blood structure properties, and was termed the structure factor size and attenuation estimator (SFSAE). An ultrasound scanner equipped with a wide-band 25 MHz probe was used to insonify porcine blood sheared in both Couette and tubular flow devices. Since skin is one of the most attenuating tissue layers during in vivo scanning, four skin-mimicking phantoms with different attenuation coefficients were introduced between the transducer and the blood flow. The SFSAE gave estimates with relative errors below 25% for attenuations between 0.115 and 0.411 dB∕MHz and kR<2.08 (k being the wave number and R the aggregate radius). The SFSAE can be useful to examine in vivo and in situ abnormal blood conditions suspected to promote pathophysiological cardiovascular consequences.
INTRODUCTION
Ultrasonic tissue characterization techniques using the radio frequency (rf) backscattered signals have received broad interest for the past 25 years. One approach is to use the magnitude and frequency dependence of the rf backscatter spectrum in order to quantify the tissue structures such as the size, acoustic impedance, and concentration of the scatterers. Many in vitro and in vivo experiments have been performed to demonstrate the utility of this approach for characterizing the eye,1, 2 liver,3 kidney,4 prostate,5 and breast.6 Recently, the frequency dependence of the ultrasound (US) backscatter coefficient was studied to assess the level of red blood cell (RBC) aggregation.7
It is well known that when RBCs are under low shear rates (<10 s−1), they interact strongly with each other and form complex three-dimensional (3D) rouleaux structures. When the shear rate increases, rouleaux structures disaggregate. This phenomenon is normal and occurs in the circulation of many mammalian species. However, RBC hyper-aggregation, an abnormal increase in RBC aggregation, is a pathological state associated with several circulatory diseases such as deep venous thrombosis, atherosclerosis, and diabetes mellitus. These pathologies inflict particular sites (inferior members for thrombosis, arterial bifurcations for atherosclerosis, and the foot and eye for diabetes). It would thus be of great interest to elucidate the role of flow-dependent rheological parameters, such as RBC aggregation, in the etiology of these pathologies in vivo and in situ with US techniques. To achieve this goal, the backscattering coefficient from blood was parametrized: two indices describing RBC aggregation, the packing factor and mean aggregate diameter, were extracted from the structure factor size estimator (SFSE).7 The SFSE is a second-order data reduction model based on the structure factor and adapted to a dense medium such as blood. This approach is based on the analysis of the backscattered power spectrum that contains information about the size, spatial organization, concentration, and mechanical properties of scatterers (i.e., RBCs). The difficulty in using the SFSE in vivo is that the spectral content of backscattered echoes is also affected by attenuation caused by intervening tissue layers between the probe and the blood flow. More generally, US scatterer size estimation techniques for tissue characterization are facing similar challenges and several approaches to this problem have been developed.8, 9, 10, 11, 12, 13, 14, 15, 16, 17, 18, 19, 20, 21, 22, 23
In vitro attenuation measurement methods are difficult to transfer in vivo since most of the clinical studies can be performed only in a single-transducer backscatter configuration. Indeed, in vitro backscatter coefficient measurements are generally compensated with an estimation of the attenuation using transmission mode8, 9 or reflection mode with a reflector on the opposite side of the examined tissue,10, 11 which is difficult to implement in clinical practice. Many researchers have then attempted to improve the in vivo backscatter power spectrum estimates by assuming a priori attenuation values for the different intervening tissue layers.12, 13, 14 Thicknesses of the intervening tissues are evaluated from the backscattered signals and typical attenuation values are assigned to each tissue, based on the results found in the relevant literature. Unfortunately, the tissue attenuation coefficients vary among patients (see, for example, the detailed review of the literature on tissue attenuation by Goss et al.15) and must be determined on a patient-specific basis. Several research groups have thus developed in vivo measurement techniques to evaluate the frequency-dependent attenuation for the compensation of the backscatter power spectrum.16, 17, 18, 19 Recently, Bigelow and co-workers20, 21, 22 introduced a new algorithm that has the advantage to estimate simultaneously the effective radius of the tissue microstructure and the total attenuation. These two parameters were determined by using a single minimization method that fits the spectrum of the backscattered rf echoes from the region of interest (ROI) to an estimated spectrum by an appropriate model. In our previous work, this last strategy has been adapted for estimation of RBC scatterer sizes.23 Blood structural parameters and total attenuation were determined simultaneously by using an optimization method, termed the structure factor size and attenuation estimator (SFSAE).
The goal of this paper was to further develop the SFSAE and assess its ability to evaluate three parameters (the packing factor, mean aggregate diameter, and total attenuation) with in vitro experiments mimicking in vivo conditions. To ensure that the global minimum of the optimization strategy is found, the algorithm was modified by employing an exhaustive search on the attenuation, combined with an analytical solution for the two blood structure parameters given for a fixed value of the attenuation, rather than a trust-region technique24 used in our previous paper.23 Porcine RBCs were first sheared in a Couette flow system, and ultrasonic rf echoes were obtained using a 25 MHz center-frequency transducer. Four skin-mimicking phantoms with different attenuation coefficients were introduced between the transducer and the blood flow. Other experiments were conducted in a tubular flow allowing to be closer to the in vivo situation.
The theoretical framework describing the SFSAE development is given in Sec. 2. Section 3 explains the two experimental setups. Section 4 presents results and compares the new SFSAE with the SFSE with compensation for attenuation. The validation of the method is finally discussed in Sec. 5.
STRUCTURE FACTOR SIZE AND ATTENUATION ESTIMATOR (SFSAE)
Ultrasonic scattering from blood is mainly caused by the RBCs. Indeed, blood can be mechanically described as a colloidal suspension of RBCs in plasma. RBCs constitute the vast majority (97%) of the cellular content of blood and occupy a large volume fraction (hematocrit) of 35%–45% under normal conditions. These RBCs cannot be treated as independent scatterers since particle interactions (collision, attraction, deformation, and flow dependent motions) are strong. The theoretical model of US backscattering by blood that we developped7 is based on the particle approach,25, 26 which consists of summing contributions from individual RBCs and modeling the RBC interaction by a particle pair-correlation function. Assuming that all the RBCs in the insonified blood are identical and using the Born approximation (weak scattering), the model predicts that the theoretical backscatter coefficient of blood is given by23
| (1) |
where k is the wavenumber, m is the number density of RBCs in blood, σb is the backscattering cross section of a single RBC, S is the structure factor describing the spatial organization of RBCs, and A is the frequency-dependent attenuation function. The number density of RBCs m can be estimated by measuring the hematocrit H by microcentrifugation; m is then given by m=H∕Vs, where Vs is the volume of a RBC (typically 87 μm3). The backscattering cross-section σb of a weak scatterer small compared to the wavelength (Rayleigh scatterer) can be determined analytically as follows:
| (2) |
where γz=(ZRBC−Zplasma)∕Zplasma is the fractional variation of impedance between the RBC and its suspending medium (i.e., the plasma). The structure factor S is by definition the Fourier transform of the pair-correlation function26g and can be approximated by its second-order Taylor expansion7 in k as
| (3) |
In this expression, g(r) represents the probability of finding two particles separated by a distance r. W is the low-frequency limit of the structure factor [|S(k)|k→0] called the packing factor.26, 27R is the radius of 3D RBC aggregates assumed to be isotropic. We introduce D=R∕a as the isotropic diameter of an aggregate (expressed in number of RBCs) with a the radius of one RBC sphere-shaped model of volume Vs. The attenuation function A is given by
| (4) |
where c is the mean speed of sound in the intervening tissue layers, f is the frequency in MHz, and α0 is the attenuation coefficient (in dB∕MHz) defined by α0=∑iαiei, where αi and ei are, respectively, the intervening tissue layer attenuations (in dB∕cm MHz) and thicknesses. One can note in Eq. 4 the coefficient 8.68 that expresses unit conversion from decibels to neper: α0[Np∕MHz]=α0[dB∕MHz]∕8.68. According to the above equation, we thus assume, as a first approximation, that the attenuation increases linearly with the frequency: α(f)=α0f∕8.68. Altogether, we obtain the following expression for the theoretical backscatter coefficient from blood:
| (5) |
In particular, for a given value of the wavenumber k (equivalently, a given value of the frequency f) and a given value of the attenuation coefficient α0, BSCtheor(k) is a linear function of the variables W and D2.
The measured backscatter coefficient reported in this study was computed as
| (6) |
In Eq. 6, the mean backscattered power spectrum was obtained by averaging the power spectra of 20 backscattered echoes from blood. The mean power spectrum was obtained from a reference sample of non-aggregated RBCs at a low hematocrit of 6% (i.e., Rayleigh scatterers).28 In this case, 20 echoes were also averaged. The backscatter coefficient of this reference sample BSCref was estimated by using the expression of the Perkus–Yevick packing factor for spheres WPYs (that is a function of the hematocrit H) as follows:26, 27
| (7) |
This reference sample was used to compensate the backscattered power spectrum for the electromechanical system response, and the depth-dependent diffraction and focusing effects caused by the US beam.
The packing factor W, aggregate diameter D, and total attenuation along the propagation path α0 were determined by matching the measured BSCmeas given by Eq. 6 with the theoretical BSCtheor given by Eq. 5. For this purpose, we searched values of (W,D2,α0)∊(0,∞)×(0,∞)×[0,1], W and D being variables without dimension and α0 expressed in dB∕MHz, minimizing the cost function which synthesizes all of the wavenumbers ki (i=1⋯N) within the −20 dB bandwidth of :
| (8) |
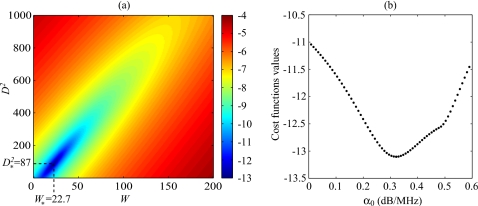
The cost function had in the majority of cases reported in this study one minimum, as was observed by plotting the cost function surface F(W,D2,α0) with varying values of α0. An example is given in Fig. 1. That is why a simple minimization routine lsqnonlin in MATLAB (The MathWorks, Inc., Natick, MA), i.e., a trust-region method based on the interior-reflective Newton method,24 was first employed in our previous paper.23 Nevertheless, on a possibility of the appearance of several minima, an exhaustive search on the value of α0 was employed in this paper in order to ensure that the global minimum is found. If the value of α0 is fixed, a quadratic function of the two variables W and D2 is obtained, as can be seen from Eq. 8, and by calculating its critical points, a system of two linear equations of two unknowns can be easily solved. One can show using the Cauchy–Schwartz’ inequality that the determinant of this system never vanishes (unless all frequencies are equal) and thus that the solution is unique. If the unique solution of this system denoted is such that W*(α0)≤0 or , then the cost function F(W,D2,α0) has no global minimum on (0,∞)×(0,∞) (with the value of α0 fixed). Also, this case means that the value of α0 has to be rejected, since it is meaningless. Otherwise, the global minimum of F(W,D2,α0) on (0,∞)×(0,∞) occurs at . In practice, there is a maximal value α* of α0 between 0 and 1 dB∕MHz, for which W*(α0)≥0 and . Thus, the global minimum of F(W,D2,α0) on the domain (0,∞)×(0,∞)×[0,α*] is the global minimum of the function on the interval [0,α*]. The optimal value of α0 can thus be obtained upon sweeping the interval [0,α*]. In our tests, we started the exhaustive search with a step of 10−5 dB∕MHz. Then, the step was iteratively decreased by a factor of 10−1 dB∕MHz, while the search is performed on the interval of length twice the preceeding step around the best value obtained so far. The iterative (multi-resolution) exhaustive search was stopped after a step of 10−20 dB∕MHz. At the end of the SFSAE algorithm, a simple test allowed to verify the validity of the solution. If the solution (W,D2,α0) of the optimization problem was such that W or D2 was on the inferior boundary of the domain (i.e., W or D2 are equal to zero), the solution was rejected since such values of W or D2 are unrealistic. This last point will be discussed later in Sec. 5D.
Figure 1.
(a) Typical aspect of the logarithm of the cost function F(W,D2,α0) for a fixed value of α0. The logarithm is shown here in order to enhance the visual contrast. This cost function has one minimum denoted that depends on α0. (b) Typical aspect of the function for varying values of α0 (W* and being calculated for each α0). This cost function has a single minimum.
METHODS
Blood sample preparation
Blood from two different pigs were used for the two experiments in a Couette device and in a tube. This fresh porcine whole blood was obtained from a local slaughter house and anticoagulated with 3 g∕l of ethylene diamine tetra acetic acid (EDTA). Then the whole blood was centrifuged and the plasma and buffy coat were removed. Two blood samples were then prepared for each experiment: (i) a H6 reference sample, which was a 6% hematocrit non-aggregating RBCs resuspended in physiological saline solution, and (ii) a 40% hematocrit T40 test sample, which consisted of RBCs resuspended in plasma to promote aggregation.
In vitro experiments
In vitro experiments in a Couette flow system (Couette device)
US measurements were first performed in a Couette device to produce a linear blood velocity gradient at a given shear rate (see Fig. 1 in Ref. 29). The system consists of a rotating inner cylinder with a diameter of 160 mm surrounded by a fixed concentric cylinder of diameter 164 mm. A 60 ml blood sample was sheared in the 2 mm annular space between both coaxial cylinders. An US scanner (Vevo 660, Visualsonics, Toronto, Canada) equipped with the RMV 710 probe was used in B-mode. The oscillating single-element focused circular transducer had a center frequency of 25 MHz, a diameter of 7.1 mm, and a focal depth of 15 mm. We acquired RF data from this scanner at a sampling frequency of 250 MHz with 8 bit resolution (Gagescope, model 8500CS, Montreal, Canada). The probe was mounted in the side wall of the fixed outer cylinder and was positioned to have its focal zone at the center of the gap between both cylinders. To ensure ultrasonic coupling, the hole within the outer stationary cylinder (containing the probe) was filled with a liquid agar gel based mixture. When solidified, this gel was cut to match the curvature of the cylinder to avoid any flow disturbance. The gel was a mixture of distilled water, 3% (w∕w) agar powder (A9799, Sigma Chemical, Saint-Louis, MO), 10% (w∕w) glycerol, and a specific concentration of 50 μm cellulose scattering particles (S5504 Sigmacell, Sigma Chemical, Saint-Louis, MO) that determined the attenuation coefficient. Five experiments were performed with five mixtures having SigmaCell (SC) concentrations varying from 0% to 1% (w∕w). The 0% concentration constituted the non-attenuating gel and the four other mixtures mimicked skin attenuations.
All US measurements were made at room temperature. Prior to each measurement, the T40 blood was sheared at 200 s−1 during 30 s to disrupt RBC aggregates. The shear rate was then reduced to residual values of 5, 10, 20, 30, and 50 s−1 for 90 s until an equilibrium in the state of aggregation was reached. For each shear rate, 20 B-mode images were constructed from acquired rf echoes each 4 s for a total period of analysis of 80 s. Each image contained 384 vertical lines. For 180 vertical lines at the center of the B-mode images, echoes were selected with a rectangular window of axial length 0.4 mm at 20 depths every 0.031 mm (i.e., with 92% overlap between windows). For each depth, the power spectra of the backscattered rf echoes were averaged over 20 acquisitions (corresponding to the 20 acquired B-mode images) to provide . This protocol was repeated five times with the same blood and with each of the five agar-based phantoms.
Then, the T40 blood was removed and the H6 sample was introduced in the Couette device. The H6 sample was sheared at 50 s−1 and coupled with the 0% SC concentration agar gel. Echoes were windowed as for the H40 sample at the same depths and their power spectra were averaged over 20 acquisitions to obtain . This reference power spectrum allowed to normalize the average power spectrum [as described in Eq. 6, Sec. 2].
In vitro experiments in a tube
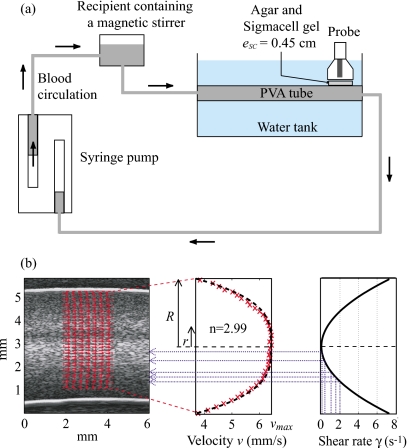
In order to be closer to in vivo conditions, US measurements were also performed in a tubular flow device. The experimental test section was an horizontal tube made of polyvinyl alcohol (PVA) cryogel. This tube had an internal diameter of 4.9 mm and a length of 10 cm, and was immersed in a tank filled with degassed water at room temperature. The US measurements were made at a position 7 cm from the tube entrance with the Vevo 660 US scanner. The transducer focal point at 15 mm was positioned at the middle of the tube, imaged in the longitudinal plane. The T40 blood sample was circulated in the PVA tube using a double syringe pump (Harvard PHD 2000) at a constant flow rate from the outflow syringe, to the tube and the second inflow syringe. In order to ensure that the RBCs are disaggregated at the tube entrance, the T40 sample blood passed through a small recipient containing a magnetic stirrer just before entering the PVA tube, as indicated in Fig. 2a. Similarly to the Couette experiments (Sec. 3B1), a layer of gel was placed between the probe and the tubular flow. Five experiments were successively performed on the same blood with five mixtures having SC concentrations: 0%, 1%, 1.5%, 2%, and 2.5% (w∕w).
Figure 2.
(a) Diagram of the experimental apparatus used in the tubular flow experiments. (b) Echographic image of the T40 blood in the tube (obtained with the US scanner Visualsonics) and estimates of particle displacement fields by B-mode speckle tracking and corresponding mean velocity and shear rate as a function of depths in the tube.
The flow rate was chosen equal to 5 ml∕min to promote RBC aggregation and when 30 ml of blood had circulated in the tube, 20 B-mode images were constructed for 80 s. The data were processed as described for the in vitro experiment in the Couette device, except that echoes were selected with a rectangular window of length 0.4 mm at 65 depths every 0.031 mm (again with 92% overlaps). A reference measurement was done by using the H6 sample circulating in the tube at a flow rate of 5 ml∕min. Echoes were windowed as for the H40 sample at the same 65 depths and their power spectra were averaged over 20 acquisitions to obtain . One can note here that allow to compensate not only for the electromechanical system response, and the depth-dependent diffraction and focusing effects caused by the US beam, but also for the US response of the PVA cryogel tube.
Attenuation measurements for comparison with the SFSAE attenuation estimates
The attenuation coefficients of the reference (0% SC) and of the skin-mimicking phantoms were determined by using a standard substitution method. The Vevo 660 US scanner equipped with the same RMV 710 25 MHz transducer was used in M-mode and in transmission∕reception with a reflector on the opposite side of the phantom for reflection measurements. Reflected signals were recorded both with and without the agar gel sample in the acoustic path. The attenuation coefficient was then estimated using a log spectral difference technique.30 For a given concentration of SC, measurements were obtained from two different sample thicknesses, and for each, six regions were scanned for averaging purpose. In our experimental devices, thicknesses of skin-mimicking phantoms eSC were fixed to 1.3 cm in the case of the Couette device and 0.45 cm for the tubular flow experiments. Values of the average attenuations expressed in dB∕cm MHz and of the attenuation coefficients expressed in dB∕MHz for the Couette and tube experiments are reported in Table 1. As it can be observed in this table, attenuation coefficients of skin-mimicking phantoms were in the same range as the human dermis (which is 0.21 dB∕MHz at 14–50 MHz considering a 1 mm dermis thickness31).
Table 1.
Values of the average attenuations of skin-mimicking phantoms expressed in dB∕cm MHz and corresponding attenuation coefficients expressed in dB∕MHz for the Couette and tube experiments.
| Sigmacell (SC) concentration (%) | Attenuation (dB∕cm∕MHz) | Attenuation coefficient for the Couette flow device (eSC=1.3 cm) (dB∕MHz) | Attenuation coefficient for the tube flow device (eSC=0.45 cm) (dB∕MHz) |
|---|---|---|---|
| 0 | 0.0054±0.0015 | 0.0070±0.0019 | 0.0024±0.0006 |
| 0.25 | 0.088±0.018 | 0.115±0.024 | ⋯ |
| 0.5 | 0.168±0.023 | 0.219±0.030 | ⋯ |
| 0.75 | 0.246±0.027 | 0.320±0.035 | ⋯ |
| 1 | 0.316±0.031 | 0.411±0.040 | 0.142±0.014 |
| 1.5 | 0.475±0.053 | ⋯ | 0.214±0.024 |
| 2 | 0.633±0.051 | ⋯ | 0.285±0.023 |
| 2.5 | 0.768±0.060 | ⋯ | 0.346±0.027 |
For the Couette device configuration, blood attenuation was also measured at different shear rates in the reflection mode. The gel had a 0% SC concentration, the probe was used in M-mode and the rotating inner cylinder was used as the reflector. For each shear rate, acquisitions of 20 rf lines were performed both with blood and with water in the Couette device. The water acquisition was used for normalization. For each acquisition, blood attenuation was estimated using the log spectral difference technique. These values were then averaged to provide . Values obtained were 0.053±0.011, 0.036±0.008, 0.024±0.005, 0.016±0.003, and 0.015±0.003 dB∕mm MHz for shear rates of 5, 10, 20, 30, and 50 s−1, respectively.
Reference measurements for blood structural parameters with the 0% SC concentration phantom for in vitro experiments
For both in vitro devices, experiments with the 0% SC phantom were realized in order to have reference results on packing factors Wref and aggregate diameters Dref. For these reference measurements, the measured backscatter coefficient was compensated for predetermined values of blood and 0% SC phantom attenuations and thus computed as follows:
| (9) |
and the parameters Wref and Dref were deduced by fitting the measured backscatter coefficient to the theoretical backscatter coefficient using the classical SFSE:7
| (10) |
The parameters Wref and Dref were assumed to be true values of packing factors and aggregate diameters at all shear rates, and will be compared in Sec. 4 with packing factors and diameters estimated by the SFSAE when skin-mimicking phantoms were used.
RESULTS
In vitro experiments in the Couette device
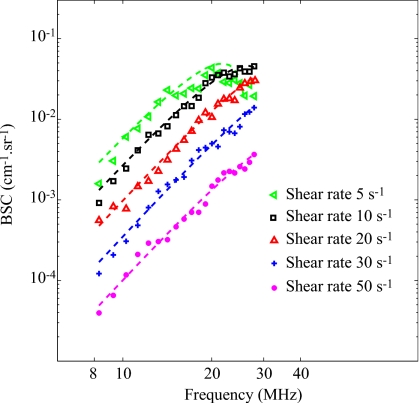
Figure 3 shows the typical BSCmeas as a function of frequency for different residual shear rates in the case of 0% SC (i.e., reference measurements). Also represented are corresponding fitted curves obtained with the SFSE after compensation for predetermined values of blood attenuation. The parameters Wref and Dref were estimated over 20 depths and 180 rf lines of the B-mode image (i.e., 3600 estimations) in a chosen ROI. Their mean values , as well as their standard deviations σWref, σDref are reported in Table 2. It can be noticed that the BSCmeas amplitude as well as the estimation of the parameters and decrease when the shear rate increases (i.e. when the level of aggregation becomes smaller). Also given in Table 2 is the correlation coefficient r2 in order to assess the goodness of fit between the model and the measured data. It reveals that the highest level of aggregation (at 5 s−1) had the worst fit, i.e., r2=0.67.
Figure 3.
Backscatter coefficients for blood sheared at different residual shear rates and measured with the 0% SC concentration phantom, and corresponding fitting with the classical SFSE with compensation for blood attenuation (in dashed lines).
Table 2.
Reference values of the packing factor and diameter obtained with the SFSE at different residual shear rates. The parameter r2 represents the correlation coefficient of the fitted SFSE model on experimental data BSCmeas.
| Shear rate (s−1) | r2 | ||
|---|---|---|---|
| 5 | 24.56±2.82 | 10.11±0.72 | 0.67±0.02 |
| 10 | 9.14±1.89 | 4.59±0.78 | 0.95±0.02 |
| 20 | 3.90±0.79 | 2.68±0.54 | 0.93±0.03 |
| 30 | 1.39±0.34 | 1.35±0.38 | 0.95±0.02 |
| 50 | 0.44±0.040 | 0.82±0.23 | 0.95±0.03 |
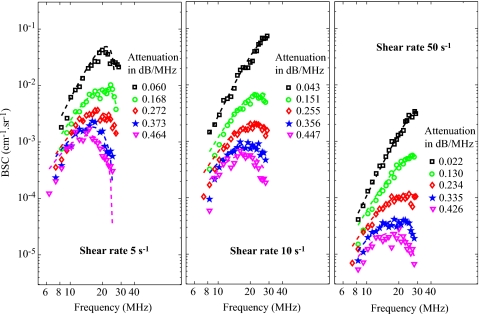
Typical results of the SFSAE minimization procedure for the different agar phantoms at shear rates of 5, 10, and 50 s−1 are given in Fig. 4. The attenuations given in Fig. 4 correspond to the reference total attenuations i.e., the sum of and estimated in the reflection mode as shown in Sec. 3B3. For all shear rates, an increase in the total attenuation has the effect of decreasing the amplitude of the BSCmeas at all frequencies and also has an effect of moving the peak of the BSCmeas at lower frequencies. It is very interesting to observe how attenuation influences the well-known quasi-Rayleigh backscattering behavior of disaggregated RBCs (i.e., at a shear rate of 50 s−1). Indeed, for the 50 s−1 shear rate combined with the 0% SC concentration (reference measurement), the frequency dependence of the BSCmeas is close to f4 and is thus quasi-linear on our log compressed scale, as expected. In the presence of attenuation, the frequency dependencies of the BSCmeas are drastically modified.
Figure 4.
Measured backscatter coefficients for blood sheared at 5, 10, and 50 s−1 and with each of the five phantoms. The corresponding fitted models (in dashed lines) are the SFSE for the 0% SC phantom with compensation for blood attenuation (black squares) and the SFSAE for the four skin-mimicking phantoms (0.25%, 0.5%, 0.75%, and 1% SC).
The parameters W, D, and α0 were estimated over 20 depths and 180 rf lines of the B-mode image in the same ROI used for the reference measurements. Their mean values , , and corresponding r2 are reported in Tables 3, 4 and 5 for shear rates of 5, 10, and 50 s−1, respectively. The values of and from the SFSAE are quite similar to the reference values of and , as well as the total attenuation from the SFSAE are similar to the reference total attenuation , except for the shear rate of 5 s−1 and the 0.25% SC skin-mimicking phantom. In these tables, the relative errors for each parameter ϵW, ϵD, and ϵα0 correspond, respectively, to , , and .
Table 3.
Reference values of the packing factor and diameter obtained with the SFSE (0% SC), and values of the packing factor , diameter , and attenuation obtained with the SFSAE (0.25%, 0.5%, 0.75%, and 1% SC) at the shear rate 5 s−1 in the Couette flow device. The parameter ϵ indicates the relative error and r2 the correlation coefficient of the fitted SFSAE model on experimental data BSCmeas.
| SC (%) | 0 | 0.25 | 0.5 | 0.75 | 1 |
| 24.56±2.82 | ⋯ | ⋯ | ⋯ | ⋯ | |
| ⋯ | 36.97±12.40 | 23.33±8.96 | 26.83±8.65 | 23.01±6.83 | |
| ϵW (%) | ⋯ | 50.53 | −0.65 | 9.24 | −6.31 |
| 10.11±0.72 | ⋯ | ⋯ | ⋯ | ⋯ | |
| ⋯ | 10.87±1.74 | 9.05±1.61 | 11.11±1.68 | 11.08±1.68 | |
| ϵD (%) | ⋯ | 7.52 | −10.48 | 9.89 | 9.59 |
| (dB∕MHz) | 0.060±0.018 | 0.168±0.035 | 0.272±0.041 | 0.373±0.046 | 0.464±0.051 |
| (dB∕MHz) | ⋯ | 0.246±0.045 | 0.314±0.046 | 0.409±0.048 | 0.445±0.051 |
| ϵα0 (%) | ⋯ | 46.43 | 15.44 | 9.65 | −4.09 |
| r2 | 0.67±0.02 | 0.81±0.06 | 0.79±0.05 | 0.79±0.07 | 0.74±0.05 |
Table 4.
Reference values of the packing factor and diameter obtained with the SFSE (0% SC), and values of the packing factor , diameter , and attenuation obtained with the SFSAE (0.25%, 0.5%, 0.75%, and 1% SC) at the shear rate 10 s−1 in the Couette flow device. The parameter ϵ indicates the relative error and r2 the correlation coefficient of the fitted SFSAE model on experimental data BSCmeas.
| SC (%) | 0 | 0.25 | 0.5 | 0.75 | 1 |
| 9.14±1.89 | ⋯ | ⋯ | ⋯ | ⋯ | |
| ⋯ | 10.14±3.03 | 9.35±2.73 | 9.08±1.93 | 10.86±3.88 | |
| ϵW (%) | ⋯ | 10.94 | 2.29 | −0.65 | 18.81 |
| 4.59±0.78 | ⋯ | ⋯ | ⋯ | ⋯ | |
| ⋯ | 5.25±1.01 | 4.83±0.81 | 4.84±0.55 | 5.07±1.26 | |
| ϵD (%) | ⋯ | 14.38 | 5.23 | 5.45 | 10.45 |
| (dB∕MHz) | 0.043±0.010 | 0.151±0.032 | 0.255±0.038 | 0.356±0.043 | 0.447±0.048 |
| (dB∕MHz) | ⋯ | 0.172±0.061 | 0.283±0.053 | 0.367±0.033 | 0.410±0.057 |
| ϵα0 (%) | ⋯ | 13.91 | 10.98 | 3.09 | −8.28 |
| r2 | 0.95±0.02 | 0.86±0.06 | 0.84±0.08 | 0.86±0.08 | 0.81±0.06 |
Table 5.
Reference values of the packing factor and diameter obtained with the SFSE (0% SC), and values of the packing factor , diameter , and attenuation obtained with the SFSAE (0.25%, 0.5%, 0.75%, and 1% SC) at the shear rate 50 s−1 in the Couette flow device. The parameter ϵ indicates the relative error and r2 the correlation coefficient of the fitted SFSAE model on experimental data BSCmeas.
| SC (%) | 0 | 0.25 | 0.5 | 0.75 | 1 |
| 0.44±0.10 | ⋯ | ⋯ | ⋯ | ⋯ | |
| ⋯ | 0.46±0.19 | 0.53±0.21 | 0.38±0.15 | 0.35±0.11 | |
| ϵW (%) | ⋯ | 4.54 | 20.45 | −13.64 | −20.45 |
| 0.82±0.23 | ⋯ | ⋯ | ⋯ | ⋯ | |
| ⋯ | 0.89±0.24 | 0.98±0.28 | 0.90±0.21 | 1.02±0.19 | |
| ϵD (%) | ⋯ | 8.54 | 19.51 | 9.76 | 24.39 |
| (dB∕MHz) | 0.022±0.005 | 0.130±0.027 | 0.234±0.033 | 0.335±0.038 | 0.426±0.043 |
| (dB∕MHz) | ⋯ | 0.148±0.059 | 0.287±0.060 | 0.370±0.061 | 0.409±0.063 |
| ϵα0 (%) | ⋯ | 13.85 | 22.65 | 10.45 | −3.99 |
| r2 | 0.95±0.03 | 0.91±0.04 | 0.90±0.06 | 0.86±0.05 | 0.86±0.06 |
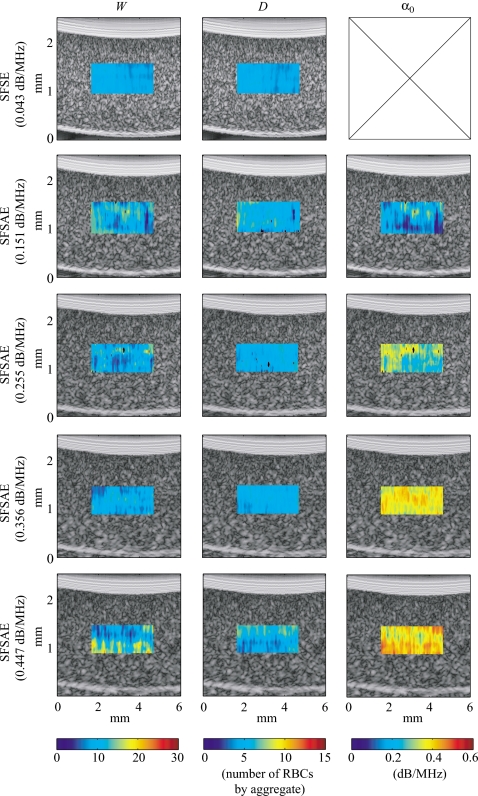
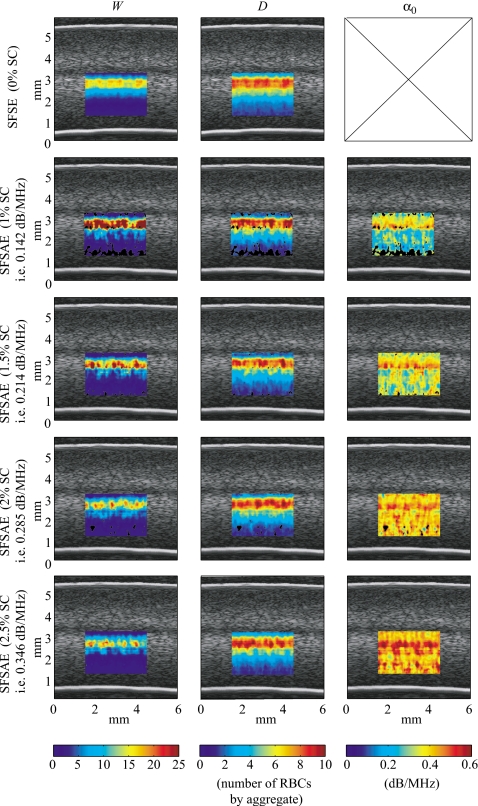
Figure 5 shows quantitative images superimposed on the gray-scale B-mode images of the blood sheared at 10 s−1 in the Couette device. The color of each pixel was assigned based on the value of the parameters estimated by the SFSE with the 0% SC phantom and by the SFSAE with the four skin-mimicking phantoms. The color bars relate the pixels in the quantitative images to the estimated parameters (W, D, and α0) in the chosen ROI. The black pixels in the ROI correspond to rejected solutions of the optimization method (when the estimated packing factor W or diameter D2 was found equal to zero, which is unrealistic). A clear distinction between images of the estimated total attenuation with the four skin-mimicking phantoms is apparent, which was expected, whereas images of the estimated parameters W and D are quite similar, which was also wished.
Figure 5.
Quantitative images of blood sheared at 10 s−1 in the Couette device superimposed on the gray-scale B-mode images. Parameters were estimated by the classical SFSE with compensation for blood attenuation for the 0% SC concentration (top panel) and by the SFSAE for the four skin-mimicking phantoms.
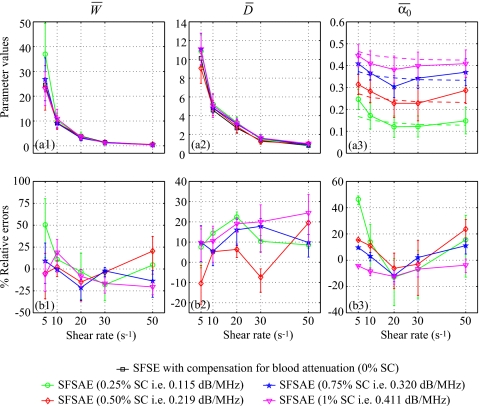
For each residual shear rate, quantitative images for the three parameters W, D, and α0 were constructed. The average estimates are summarized in Fig. 6. The lower and upper error bars for relative errors correspond to
| (11) |
where X represents one of the estimated parameters W, D, or α0. For all shear rates and all skin-mimicking phantoms, the SFSAE gave quantitatively satisfactory estimates of and with relative absolute errors below 25%, except for the shear rate of 5 s−1 and the 0.25% SC skin-mimicking phantom.
Figure 6.
(a) Values of , , and (in dB/MHz) for different residual shear rates estimated by the SFSAE for the four skin-mimicking phantoms in the Couette experiments (mean±standard deviation). Also represented are values of and estimated by the classical SFSE with compensation for blood attenuation for the 0% SC concentration and values of in dashed lines. (b) Corresponding relative errors of , , and .
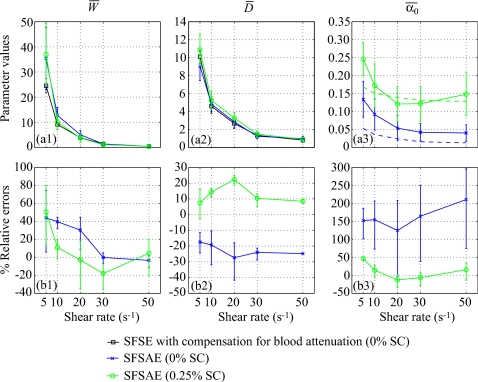
The use of the SFSAE when there is little attenuation (i.e., the 0% SC phantom) was also investigated. Figure 7 presents the averaged parameters , , and obtained from the SFSAE with the 0% SC phantom. In this experiment, the total attenuation came mainly from the blood (0.015≤αblood≤0.053 dB∕MHz) and a little part from the SC phantom (0.007 dB∕MHz). Also represented in Fig. 7 are the SFSAE results with the 0.25% SC phantom in order to compare the SFSAE performance in the presence of higher attenuation. When there is little attenuation, estimates of were less accurate for shear rates of 5, 10, and 20 s−1 (in comparison with obtained with the four other SC phantoms) with relative errors between 25% and 42%. Estimates of were between 0.041 and 0.133 dB∕MHz, so the total attenuation were overestimated giving the largest relative errors between 124% and 211%.
Figure 7.
(a) Values of , , and (in dB/MHz) for different residual shear rates estimated by the SFSAE for the 0% and 0.25% SC concentrations. Also represented are values of and estimated by the classical SFSE with compensation for blood attenuation for the 0% SC concentration and values of in dashed lines. (b) Corresponding relative errors of , , and .
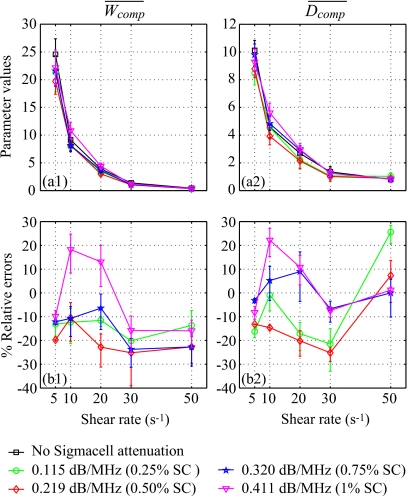
Finally, to support the discussion reported later, the packing factor Wcomp and the diameter of the aggregates Dcomp were also evaluated by compensating the BSCmeas in the SFSE with the predetermined values measured in reflection mode (Sec. 3B3). Values of Wcomp and Dcomp were averaged over 20 depths and 180 lines of the B-mode image in the same ROI used for the reference measurements to provide and . Results are presented in Fig. 8. The relative errors are below 25% for all shear rates and all skin-mimicking phantoms.
Figure 8.
(a) Values of and for different residual shear rates estimated by the classical SFSE with compensation for attenuation by taking predetermined values measured in reflection mode for the four skin-mimicking phantoms (mean±standard deviation). (b) Corresponding relative errors of and .
In vitro experiments in the tubular flow device
Figure 9 shows quantitative images superimposed on the gray-scale B-mode images of tubular blood flow for each skin-mimicking phantom. As observed in the Couette experiment, a clear distinction between images of the estimated total attenuation is apparent, whereas images of the estimated parameters W and D are quite similar.
Figure 9.
Quantitative images of blood sheared in a tube superimposed on the gray-scale B-mode images. Parameters were estimated by the classical SFSE with compensation for blood attenuation for the 0% SC concentration (top panel) and by the SFSAE for the four skin-mimicking phantoms.
In order to know the shear rate profile in the tube, a speckle tracking method32 was used to obtain the displacement fields of RBCs, as shown in Fig. 2b. The displacement of the speckle pattern between each frame is then related to the velocity through the time elapsed between the images. The mean velocity profile across the tube was fitted to the following simple power-law model:
| (12) |
where v(r) is the mean velocity at radius r, R is the radius of the tube, vmax is the maximum velocity, and n is the power-law exponent (n=2 for parabolic flow). As expected, the velocity profile was slightly blunted due to RBC aggregation with n=2.99 [see Fig. 2b]. The shear rate profile, γ(r), was deducted from this velocity profile by computing the derivative of v(r):
| (13) |
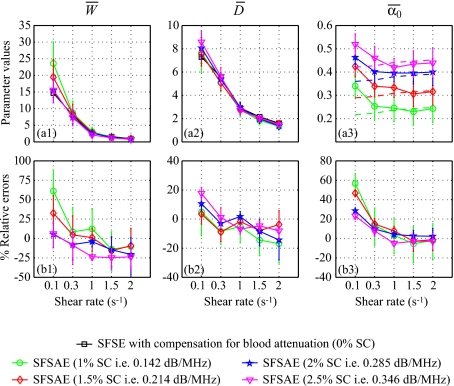
Five shear rates were selected on the shear rate profile (i.e., 0.1, 0.3, 1, 1.5, and 2 s−1) corresponding to specific depths [see Fig. 2b] and thus corresponding to specific blood thicknesses (i.e., 2.7, 2.9, 3.4, 3.6, and 3.8 mm). For each shear rate, values of W, D, and α0 were simultaneously estimated by the SFSAE and averaged over three depths (one specific depth and their two adjacent depths, i.e., ±0.031 mm) and 180 lines of the B-mode image. These average values of and obtained with the SFSAE were compared with average values of and evaluated by the SFSE with attenuation-compensation. The reference total attenuation was the sum of estimated in the reflection mode (see Sec. 3B3) and of , with eblood varying for each shear rate. The blood attenuation was arbitrarily chosen to be equal to 0.028 dB∕mm MHz. This point will be discussed later in Sec. 5A. Figure 10 summarizes these results. The SFSAE gave estimates of , , and with relative errors below 25% for all skin-mimicking phantoms at shear rates between 0.3 and 2 s−1. Worse estimates were obtained for the smallest shear rate of 0.1 s−1: for 1% and 1.5% SC concentrations, relative errors for were 61% and 32%, respectively, those for were 56% and 47%, respectively, whereas those for remained below 20%.
Figure 10.
(a) Values of , , and (in dB/MHz) for different shear rates estimated by the SFSAE for the four skin-mimicking phantoms in the tube experiments (mean±standard deviation). Also represented are values of and estimated by the classical SFSE with compensation for blood attenuation for the 0% SC concentration and values of in dashed lines. (b) Corresponding relative errors of , and .
DISCUSSION
The difficulty to measure the blood attenuation in a tube flow device
The following discussion intends to explain why blood attenuation values in function of the shear rate cannot be obtained directly by measurements in a tube by a standard substitution method. The ideal protocol would be to realize blood attenuation measurements on a Couette apparatus (as performed in Sec. 3B3) for the different shear rates present in the tube. In our experiments, the tube was not long enough (kinetic time) to obtain the same aggregate sizes as in the Couette device, that is why we chose a mean blood attenuation equal to 0.028 dB∕mm MHz corresponding to the average of blood attenuations estimated with the Couette device for the different shear rates (see Sec. 3B3).
Limitations of the SFSAE with respect to kR and attenuation
For both Couette and tubular flow devices, the SFSAE gave good estimates of W, D, and α0 with relative errors below 25% for all skin-mimicking phantoms and for all shear rates, except for the smallest shear rates and the smallest attenuations (0.115 dB∕MHz for the Couette and 0.142 dB∕MHz for the tube): relative errors for W were around 50% (Couette) and 61% (tube), for α0 around 48% (Couette) and 56% (tube), for D below 25% as indicated in Figs. 610. In the tube experiment, one can also notice that relative errors for were always worse at the smallest shear rate (0.1 s−1) for all skin-mimicking phantoms. For the peculiar case when there is little attenuation (i.e., ≤0.06 dB∕MHz), the SFSAE did not give accurate results (absolute relative errors reaching 42% for W and 211% for α0).
For the Couette device, the correlation coefficients given in Tables 3, 4, 5 reveal that the SFSAE produced quite good fits to data for all skin-mimicking phantoms and all shear rates, i.e., 0.74≤r2≤0.91. Nevertheless, for both SFSE and SFSAE models, the smallest r2 values occurred at the lowest shear rate of 5 s−1. It is illustrated by fits of SFSE and SFSAE models in Fig. 4 that are worse at 5 s−1 (in comparison with fits at 10 and 50 s−1), especially for the largest attenuation.
Considering the correlation coefficients and the accuracy of the estimates, both SFSE and SFSAE seem to reach their limit of applicability for large aggregate sizes: for the Couette experiments, typically in Table 2 (i.e., kR=2.88 with f=25 MHz) and for the tube experiments, typically in Fig. 10 (i.e., kR=2.08). To conclude, the SFSAE performed well for kR<2.08 and for total attenuations between 0.115 and 0.411 dB∕MHz. In the following, these bounds will define the SFSAE validity domain, i.e., the domain where the SFSAE gives accurate estimates of W, D, and α0.
It is interesting to note that the limitations of the SFSAE can be used to interpret the attenuation quantitative images obtained in the tubular flow device (Fig. 9). Indeed, these images are less homogeneous compared to those obtained in the Couette device since the standard deviations for attenuation were between 0.052 and 0.082 dB MHz for the tube and between 0.033 and 0.063 dB∕MHz for the Couette. It is clearly linked with the presence of shear rates (<0.3 s−1) in the tube experiments that result in large aggregate sizes outside the validity domain of the SFSAE.
Comparison of the SFSAE and SFSE with compensation for attenuation
For the Couette experiments, relative errors for and were generally below 25% (except for one value) with the SFSAE (Fig. 6) and with the SFSE with attenuation-compensation (Fig. 8). For W at 5 s−1 and a 0.25% SC, the SFSAE was not in its validity domain. In the SFSAE validity domain, the accuracy of the estimates obtained with the SFSAE was thus as satisfactory as those obtained with the SFSE with attenuation-compensation. The SFSAE has the major advantage to be easily applicable in vivo contrary to the SFSE attenuation-compensation method, needing the attenuation and thickness of the tissue intervening layers to be known.
Rejected solutions
In Figs. 59, one can notice the rejected solutions represented in black pixels. These solutions were rejected because their estimated diameters were equal to 0 (whereas the estimated packing factors never vanish). One might think that these rejected solutions come from cost functions having several local minima. Several cases of rejected solutions were studied and their corresponding cost functions had always a unique global minimum (data not shown).
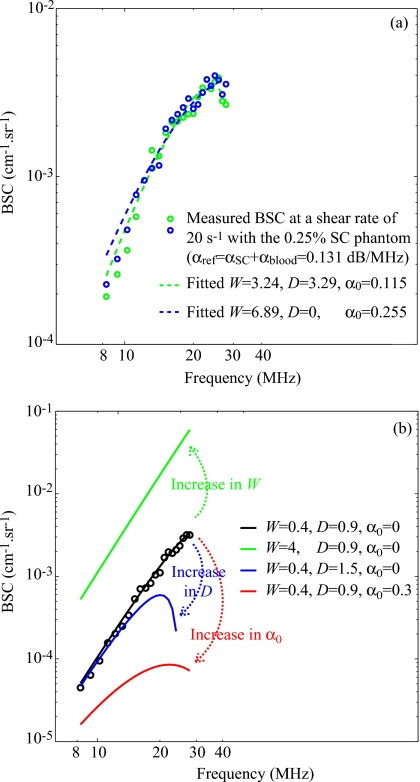
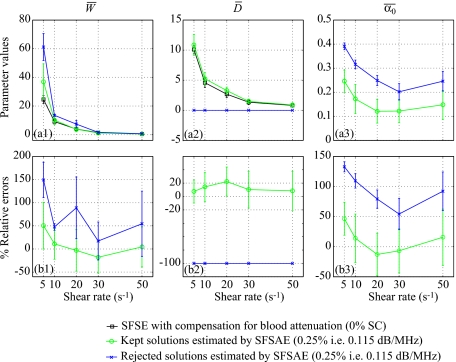
To better understand what happened in these special cases, Fig. 11a represents two backscatter coefficients for blood sheared at 20 s−1 in the Couette flow device and measured with the 0.25% SC concentration phantom. Although both experimental backscatter coefficient were quite similar, the corresponding fitted models with the SFSAE gave two very different estimates of W, D, and α0. One estimation corresponds to a kept solution and the other to a rejected solution with an estimate of D equal to 0. In Fig. 12 the mean values of , , and are summarized for the kept and rejected solutions estimated with the SFSAE for all shear rates and for the 0.25% SC concentration phantom. It can be observed, for the rejected solutions, that both and were overestimated. This phenomenon can be explained by the difficulty to evaluate simultaneously three parameters that have the same effect on the backscatter coefficient as explained below. Figure 11b illustrates the respective effect of varying W, D, and α0 on the backscatter coefficient. We arbitrarily selected a shear rate of 50 s−1 (i.e., a quasi-disaggregated case) and no SC attenuation. An increase in W has the effect of increasing the amplitude of the backscatter coefficient at all frequencies; whereas increasing D has an effect on the frequency dependence. But more interesting is to observe that an increase in α0 has the effect of decreasing the amplitude and also of modifying the frequency dependence of the backscatter coefficient. It is thus difficult to estimate simultaneously these three parameters, because a modification in α0 plays the same role (i.e., effects on the amplitude and the frequency dependence) that modifications in W (i.e., amplitude) and D (i.e., frequency dependence). The typical example given in Fig. 11a and parameter values presented in Fig. 12 can now be better understood. When the optimization method gives an unrealistic estimate of D equal to 0, the frequency dependence of the backscatter coefficient is only given by α0, which is overestimated. But since increasing α0 has also the effect of decreasing the amplitude of the backscatter coefficient, the overestimation of α0 goes with the overestimation of W.
Figure 11.
(a) Two backscatter coefficients for blood sheared at 20 s−1 in the Couette flow device and measured with the 0.25% SC phantom, and corresponding fitted models with the SFSAE. (b) Effect of increasing W, D, and α0 on the backscattering coefficient on the SFSAE model.
Figure 12.
(a) Values of , , and (in dB/MHz) for the kept and rejected solutions of the SFSAE for different residual shear rates and for the 0.25% SC concentration phantom in the Couette experiment (mean±standard deviation). (b) Corresponding relative errors of , , and .
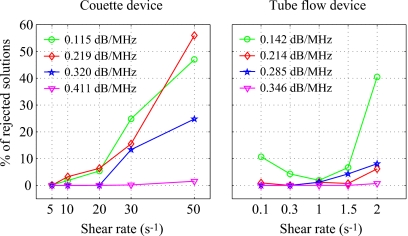
Figure 13 gives the percentage of rejected solutions in the ROIs (i.e., 20 depths and 180 rf lines for the Couette, as shown in Fig. 5, and three depths and 180 rf lines for the tube) at each shear rate for both Couette and tubular flow devices. For both devices, it can be clearly observed that percentages of rejected solutions are highest for experiments with the smallest attenuation (0.25% SC for the Couette and 1% SC for the tube) and with the highest shear rate, i.e., with quasi-disaggregated RBCs (50 s−1 for the Couette and 2 s−1 for the tube). The rejected solutions were thus more important when the frequency dependence was nearly Rayleigh. In our previous study,23 we did not reject solution, that is why bad estimates were obtained for quasi-disaggregated RBCs. The rejection of some solutions was vital for having accurate results in the cases of quasi-disaggregated RBCs and of small total attenuation.
Figure 13.
Percentage of rejected solutions in the ROIs: 20 depths and 180 RF lines for the Couette and 3 depths and 180 RF lines for the tube.
On the use of the SFSAE in vivo
The accuracy of the SFSAE was quantitatively demonstrated in a validity domain. One might question the use of this method in vivo. Although the SFSAE gave estimates with large errors for kR>2.08 and α0≤0.06 dB∕MHz, the estimated parameters presented in Figs. 610 show that the SFSAE gave qualitatively satisfactory estimates for all SC phantoms at all shear rates, since the estimates of and versus shear rates had the same behaviors as and . It means that the validity of estimates is possible for in vivo experiments, since the SFSAE is able to predict the aggregation state and attenuation tendencies.
CONCLUSION
Aggregating porcine RBCs were examined using US via in vitro experiments in Couette and tubular flow devices. Estimates of blood structural parameters and total attenuation were made from the frequency dependence of the US backscatter using the SFSAE model. This study revealed that the SFSAE provided accurate quantitative estimates of blood microstructure parameters W and D for kR<2.08 and for total attenuations between 0.115 and 0.411 dB∕MHz. In this validity domain, the results obtained with the SFSAE was quantitatively as satisfactory as those obtained with the SFSE with attenuation-compensation (i.e., when prior information on the attenuation is available). Outside this validity domain, the SFSAE was able to give the aggregation state tendency.
The SFSAE has been shown to be able of estimating blood backscattering properties in the presence of tissue intervening layers. This method is easily applicable in vivo because of the simultaneous estimation of the blood structural properties and total attenuation, contrary to the SFSE attenuation-compensation method, needing the attenuation and thickness of the tissue intervening layers to be known. Future works should focus on in vivo and in situ assessment of the pathophysiological impact of abnormal RBC aggregation on the cardiovascular system.
ACKNOWLEDGMENTS
This work was supported by the Canadian Institutes of Health Research (Grant Nos. MOP-84358 and CMI-72323), by the Heart and Stroke Foundation of Canada (Grant No. PG-05-0313), and by the National Institutes of Health of USA (Grant No. RO1HL078655).
References
- Lizzi F. L., Greenebaum M., Feleppa E. J., and Elbaum M., “Theoretical framework for spectrum analysis in ultrasonic tissue characterization,” J. Acoust. Soc. Am. 73, 1366–1373 (1983). 10.1121/1.389241 [DOI] [PubMed] [Google Scholar]
- Feleppa E. J., Lizzi F. L., Coleman D. J., and Yaremko M. M., “Diagnostic spectrum analysis in ophthalmology: A physical perspective,” Ultrasound Med. Biol. 12, 623–631 (1986). 10.1016/0301-5629(86)90183-3 [DOI] [PubMed] [Google Scholar]
- Lizzi F. L., Ostromogilsky M., Feleppa E. J., Rorke M. C., and Yaremko M. M., “Relationship of ultrasonic spectral parameters to features of tissue microstructure,” IEEE Trans. Ultrason. Ferroelectr. Freq. Control 33, 319–329 (1986). [DOI] [PubMed] [Google Scholar]
- Insana M. F., Wood J. G., and Hall T. J., “Identifying acoustic scattering sources in normal renal parenchyma in vivo by varying arterial and ureteral pressures,” Ultrasound Med. Biol. 18, 587–599 (1992). 10.1016/0301-5629(92)90073-J [DOI] [PubMed] [Google Scholar]
- Feleppa E. J., Liu T., Kalisz A., Shao M. C., Fleshner N., and Reuter V., “Ultrasonic spectral-parameter imaging of the prostate,” Int. J. Imaging Syst. Technol. 8, 11–25 (1997). [DOI] [Google Scholar]
- Oelze M. L., O’Brien W. D., Blue J. P., and Zachary J. F., “Differentiation and characterization of rat mammary fibroadenomas and 4T1 mouse carcinomas using quantitative ultrasound imaging,” IEEE Trans. Med. Imaging 23, 764–771 (2004). 10.1109/TMI.2004.826953 [DOI] [PubMed] [Google Scholar]
- Yu F. T. H. and Cloutier G., “Experimental ultrasound characterization of red blood cell aggregation using the structure factor size estimator,” J. Acoust. Soc. Am. 122, 645–656 (2007). 10.1121/1.2735805 [DOI] [PubMed] [Google Scholar]
- O’Donnell M., Mimbs J. W., and Miller J. G., “Relationship between collagen and ultrasonic backscatter in myocardial tissue,” J. Acoust. Soc. Am. 69, 580–588 (1981). 10.1121/1.385433 [DOI] [PubMed] [Google Scholar]
- Insana M. F., Hall T. J., and Fishback J. L., “Identifying acoustic scattering sources in normal renal parenchyma from the anisotropy in acoustic properties,” Ultrasound Med. Biol. 17, 613–626 (1991). 10.1016/0301-5629(91)90032-R [DOI] [PubMed] [Google Scholar]
- Wear K. A., Milunski M. R., Wickline S. A., Perez J. E., Sobel B. E., and Miller J. G., “Differentiation between acutely ischemic myocardium and zones of completed infarction in dogs on the basis of frequency-dependent backscatter,” J. Acoust. Soc. Am. 85, 2634–2641 (1989). 10.1121/1.397977 [DOI] [PubMed] [Google Scholar]
- Van Der Steen A. F. W., Thijssen J. M., Van Der Laak J. A. W. M., Ebben G. P. J., and de Wilde P. C. M., “Correlation of histology and acoustic parameters of liver tissue on a microscopic scale,” Ultrasound Med. Biol. 20, 177–186 (1994). 10.1016/0301-5629(94)90082-5 [DOI] [PubMed] [Google Scholar]
- Wear K. A., Garra B. S., and Hall T. J., “Measurements of ultrasonic backscatter coefficients in human liver and kidney in vivo,” J. Acoust. Soc. Am. 98, 1852–1857 (1995). 10.1121/1.413372 [DOI] [PubMed] [Google Scholar]
- Hall T. J., Insana M. F., Harrison L. A., and Cox G. G., “Ultrasonic measurement of glomerular diameters in normal adult humans,” Ultrasound Med. Biol. 22, 987–997 (1996). 10.1016/S0301-5629(96)00142-1 [DOI] [PubMed] [Google Scholar]
- Lu Z. F., Zagzebski J. A., and Lee F. T., “Ultrasound backscatter and attenuation in human liver with diffuse disease,” Ultrasound Med. Biol. 25, 1047–1054 (1999). 10.1016/S0301-5629(99)00055-1 [DOI] [PubMed] [Google Scholar]
- Goss S. A., Johnston R. L., and Dunn F., “Comprehensive compilation of empirical ultrasonic properties of mammalian tissues,” J. Acoust. Soc. Am. 64, 423–457 (1978). 10.1121/1.382016 [DOI] [PubMed] [Google Scholar]
- He P. and Greenleaf J. F., “Application of stochastic analysis to ultrasonic echoes—Estimation of attenuation and tissue heterogeneity from peaks of echo envelope,” J. Acoust. Soc. Am. 79, 526–534 (1986). 10.1121/1.393540 [DOI] [PubMed] [Google Scholar]
- Yao L. X., Zagzebski J. A., and Madsen E. L., “Backscatter coefficient measurements using a reference phantom to extract depth-dependent instrumentation factors,” Ultrason. Imaging 12, 58–70 (1990). 10.1016/0161-7346(90)90221-I [DOI] [PubMed] [Google Scholar]
- Oosterveld B. J., Thijssen J. M., Hartman P. C., Romijn R. L., and Rosenbusch G. J. E., “Ultrasound attenuation and texture analysis of diffuse liver disease: Methods and preliminary results,” Phys. Med. Biol. 36, 1039–1064 (1991). 10.1088/0031-9155/36/8/002 [DOI] [PubMed] [Google Scholar]
- Roberjot V., Bridal S. L., Laugier P., and Berger G., “Absolute backscatter coefficient over a wide range of frequencies in a tissue-mimicking phantom containing two populations of scatterers,” IEEE Trans. Ultrason. Ferroelectr. Freq. Control 43, 970–978 (1996). 10.1109/58.535501 [DOI] [Google Scholar]
- Bigelow T. A., Oelze M. L., and O’Brien W. D., “Estimation of total attenuation and scatterer size from backscatter ultrasound waveforms,” J. Acoust. Soc. Am. 117, 1431–1439 (2005). 10.1121/1.1858192 [DOI] [PubMed] [Google Scholar]
- Bigelow T. A. and O’Brien W. D., “Signal processing strategies that improve performance and understanding of the quantitative ultrasound SPECTRAL FIT algorithm,” J. Acoust. Soc. Am. 118, 1808–1819 (2005). 10.1121/1.2000752 [DOI] [PubMed] [Google Scholar]
- Bigelow T. A. and O’Brien W. D., “Evaluation of the Spectral Fit algorithm as functions of frequency range and Δkaeff,” IEEE Trans. Ultrason. Ferroelectr. Freq. Control 52, 2003–2010 (2005). 10.1109/TUFFC.2005.1561669 [DOI] [PubMed] [Google Scholar]
- Franceschini E., Yu F. T. H., and Cloutier G., “Simultaneous estimation of attenuation and structure parameters of aggregated red blood cells from backscatter measurements,” J. Acoust. Soc. Am. 123, EL85–EL91 (2008). 10.1121/1.2896115 [DOI] [PMC free article] [PubMed] [Google Scholar]
- Coleman T. F. and Li Y., “A reective Newton method for minimizing a quadratic function subject to bounds on some of the variables,” SIAM J. Optim. 6, 10401058 (1996). [Google Scholar]
- Mo L. Y. L. and Cobbold R. S. C., “Theoretical models of ultrasonic scattering in blood,” in Ultrasonic Scattering in Biological Tissues, edited by Shung K. K. and Thieme G. A. (CRC, Boca Raton, FL, 1993), Chap. 5, pp. 125–170. [Google Scholar]
- Twersky V., “Low-frequency scattering by correlated distributions of randomly oriented particles,” J. Acoust. Soc. Am. 81, 1609–1618 (1987). 10.1121/1.394513 [DOI] [Google Scholar]
- Shung K. K., “On the ultrasound scattering from blood as a function of hematocrit,” IEEE Trans. Ultrason. Ferroelectr. Freq. Control SU-26, 327–331 (1982). [Google Scholar]
- Wang S. H. and Shung K. K., “An approach for measuring ultrasonic backscattering from biological tissues with focused transducers,” IEEE Trans. Biomed. Eng. 44, 549–554 (1997). 10.1109/10.594895 [DOI] [PubMed] [Google Scholar]
- Nguyen L. C., Yu F. T. H., and Cloutier G., “Cyclic changes in blood echogenicity under pulsatile flow are frequency dependent,” Ultrasound Med. Biol. 34, 664–673 (2008). 10.1016/j.ultrasmedbio.2007.10.002 [DOI] [PubMed] [Google Scholar]
- Kuc R. and Schwartz M., “Estimating the acoustic attenuation coefficient slope for liver from reflected ultrasound signals,” IEEE Trans. Sonics Ultrason. SU-26, 353–362 (1979). [Google Scholar]
- Raju I. and Srinivasan M. A., “High-frequency ultrasonic attenuation and backscatter coefficients of in vivo normal human dermis and subcutaneous fat,” Ultrasound Med. Biol. 27, 1543–1556 (2001). 10.1016/S0301-5629(01)00456-2 [DOI] [PubMed] [Google Scholar]
- Shehada R. E. N. and Cobbold R. S. C., “Ultrasound methods for investigating the non-newtonian characteristics of whole blood,” IEEE Trans. Ultrason. Ferroelectr. Freq. Control 41, 96–104 (1994). 10.1109/58.265827 [DOI] [Google Scholar]


