

Abstract
Polypyrimidine tract binding protein (PTB) participates in a variety of functions in eukaryotic cells, including alternative splicing, mRNA stabilization, and internal ribosomal entry site (IRES) mediated translation initiation. Its mechanism of RNA recognition is determined in part by the novel geometry of its two C-terminal RNA Recognition Motifs (RRM3 and RRM4), which interact with each other to form a stable complex (PTB1:34). This complex itself is unusual among RRMs, suggesting that it performs a specific function for the protein. In order to understand the advantage it provides to PTB, the fundamental properties of PTB1:34 are examined here as a comparative study of the complex and its two constituent RRMs. Both RRM3 and RRM4 adopt folded structures that NMR data show to be similar to their structure in PRB1:34. The RNA binding properties of the domains differ dramatically. The affinity of each separate RRM for polypyrimidine tracts is far weaker than that of PTB1:34, and simply mixing the two RRMs does not create an equivalent binding platform. 15N-NMR relaxation experiments show that PTB1:34 has slow, microsecond motions throughout both RRMs including the interdomain linker. This is in contrast to the individual domains, RRM3 and RRM4, where only a few backbone amides are flexible on this timescale. The slow backbone dynamics of PTB1:34, induced by packing of RRM3 and RRM4, could be essential for high affinity binding to a flexible polypyrimidine tract RNA and also provide entropic compensation for its own formation.
Introduction
In recent years there has been a significant number of studies that relate molecular motions to the functions of biological molecules. Examples include such processes as enzyme catalysis, protein-ligand interactions, and both inter- and intra-molecular interactions between proteins1–8. Motions on a biologically relevant time-scale can vary from picoseconds to seconds, and occur both proximal and distal from a given interaction site. NMR relaxation methods are able to probe residue specific motions across this wide range of time scales, and thus are ideal techniques for gleaning detailed information about the importance of motions of biological molecules. The continuing challenge is to understand which molecular motions are functionally relevant, and for that assessment, there must be a means to compare and contrast motions with function.
RNA Recognition Motifs (RRMs, also known as RNA Binding Domains or RBDs) provide examples of how backbone dynamics and function might be related. The RRM is the most common eukaryotic RNA binding domain, with over 150 structures deposited in the PDB to date. A typical RRM has βαββαβ secondary structure folded into the α/β sandwich tertiary fold, with a four-stranded antiparallel β-sheet. Very little variation in three dimensional structure is seen across the family9. In addition, RRMs are characterized by conserved RNP1 and RNP2 sequences that contain several aromatic side chains displayed on the surface of the β-sheet (Fig. 1). In general, these amino acids stack with RNA bases during binding, and thus define the canonical RNA binding surface. The conservation of sequence and three dimensional structure leads to the obvious question of how an RRM selects a specific RNA target.
Figure 1. Features of a canonical RRM.

A typical RRM has an αβ-sandwich fold (a) that consists of a four stranded antiparallel β-sheet packed against two α-helices. Two RNP consensus sequences are important for protein function and reside in the center of the β-sheet, with the hexamer RNP2 sequence on β1, and the octamer RNP1 on β3. All four RRMs of PTB have RNP sequences which differ significantly from the RRM consensus (b). Important differences include a lack of aromatic side chains in both RNPs, which generally stack with RNA bases upon binding, as well as a lack of a glycine residue at the beginning of RNP1, thought to be important for mobility of the adjacent loop, a feature important for binding in other RRMs.
The most detailed studies of RRM binding have focused on the human U1A protein, which specifically binds with high affinity to an unstructured seven nucleotide RNA sequence. The U1A RRM has been shown to undergo rapid correlated motions that organize its RNA binding surface10, and mutations that perturb its dynamics have been shown to weaken its affinity for RNA11–13. The role of backbone dynamics in the RNA binding of other RRMs has not been investigated, so its generality remains to be established. However, for RRMs that recognize simple RNA sequences such as poly(A) binding protein14 or U2AF15 that also rely on several tandem RRMs to confer affinity and specificity, backbone dynamics could have little functional contribution to RNA binding.
The RNA sequences bound by Polypyrimidine tract binding protein (PTB) are simple: typically uridine-rich, with interspersed cytosines. The lengths of these sequences can vary enormously, yet PTB is able to bind to (U/C) tracts from tetramers to hundreds of nucleotides. PTB contains four RRMs, all of which differ significantly from canonical RRMs in terms of their RNP sequences 16,17 (Fig. 1). Specifically, PTB RRMs have hydrophobic side chains replacing the solvent accessible aromatic amino acids on the β-sheet surface. At the junction of β3 and loop 3, a highly conserved glycine, thought to act as a hinge for the loop, is replaced with a much larger amino acid18. The tertiary structures of RRM2 and RRM3 differ from the canonical RRM as well, for both have a fifth β-strand that packs against β2 via a long loop that spans the β-sheet surface connecting β5 to β4. This additional strand extends the canonical RNA binding surface 19, 20 at the same time as the connecting loop occludes it, presenting rather a conundrum regarding the β-sheet contribution to RNA binding. These noncanonical RRMs are phylogenetically conserved in PTB proteins, suggesting a novel mode of RNA recognition.
The four RRMs of PTB are not equivalent in their contributions to RNA binding, or in their relative geometry in the protein. RRM1 and RRM2 are separated by a 25 amino acid linker, and are each able to bind RNA as independent domains 19, 21. RRM2 and RRM3 are separated by an 80 – 100 amino acid linker, effectively separating the two N-terminal RRMs from the two C-terminal RRMs. The variation in this middle linker results from alternative splicing that produces three PTB isoforms: PTB1, PTB2, and PTB4, which have identical RRMs but insertions in the RRM2-RRM3 linker. The C-terminal RRM3 and RRM4 are separated by a 24 amino acid linker, but in this case, the two RRMs interact extensively 20, 22 and their linker is an intrinsic part of their structure. The interface between RRM3 and RRM4 involves both helices of RRM3, one helix and β4 of RRM4, and the linker. The orientation of RRM3 and RRM4 places their β-sheet surfaces in opposing directions and therefore imposes a length constraint on a single RNA strand that would bind to both surfaces.
Among characterized proteins with multiple RRMs, only hnRNPA1, Prp24, and PTB have been shown to exhibit RRM:RRM interactions that lead to stable intramolecular complexes 20, 22–25. PTB RRM3 and RRM4 together form a stable domain that constitutes the free and bound forms of the protein. RNAs preferentially bound by the two C-terminal RRMs (PTB1:34) contain unstructured (U/C)n tracts from n = 11 (GABAA γ2 intron) to n = 120 (HCV 3’ NTR)26. Short (U/C) tracts separated by poly(rA)n spacers of variable length were found to bind with highest affinity to PTB1:34 with a spacer of n=15 22. The variation in RNA targets implies a plastic binding surface of PB1:34 that may be necessary to accommodate their sequences, lengths, and structures, although the details of its interaction with long polypyrimidine tracts are not known.
To understand the intrinsic properties of PTB1:34, we compare it to its two RRM constituents using NMR and 15N-NMR relaxation experiments. We find that PTB1:34 has a uniquely configured pattern of microsecond motions, unlike that of either RRM alone. RNA binding properties of PTB RRM3 and RRM4 and PTB1:34 are compared using one of the known pre-mRNA targets of PTB. The physical juxtaposition of RRMs in the PTB1:34 construct produces a high affinity RNA binding platform. We suggest that part of its RNA binding affinity is due to its motions that unify its two RRMs.
RESULTS
Although the two C-terminal RRMs of human PTB interact with each other through a stable interface, they can be studied as separate RRMs. Constructs of each RRM including a section of the intervening linker were prepared such that when the RRMs were mixed, all but two residues of the entire linker sequence were present.
RNA Binding
The relative RNA binding affinities of PTB1:34 and the individual RRMs were compared using a 120 nucleotide RNA from the rat GABAA γ2 pre-mRNA (Figure 2), a natural target of PTB27, which has previously been shown to bind PTB1:34 with high affinity 28. This RNA is predicted to be single-stranded with no stable secondary structure, so that its two polypyrimidine tracts are accessible to the protein. Footprinting experiments showed that PTB1:34 protects both the 34-nt tract and the 11-nt tract of the RNA, even at 10 nM protein28.
Figure 2. Justaposition of RRMs in PTB1:34 increased RNA binding affinity.
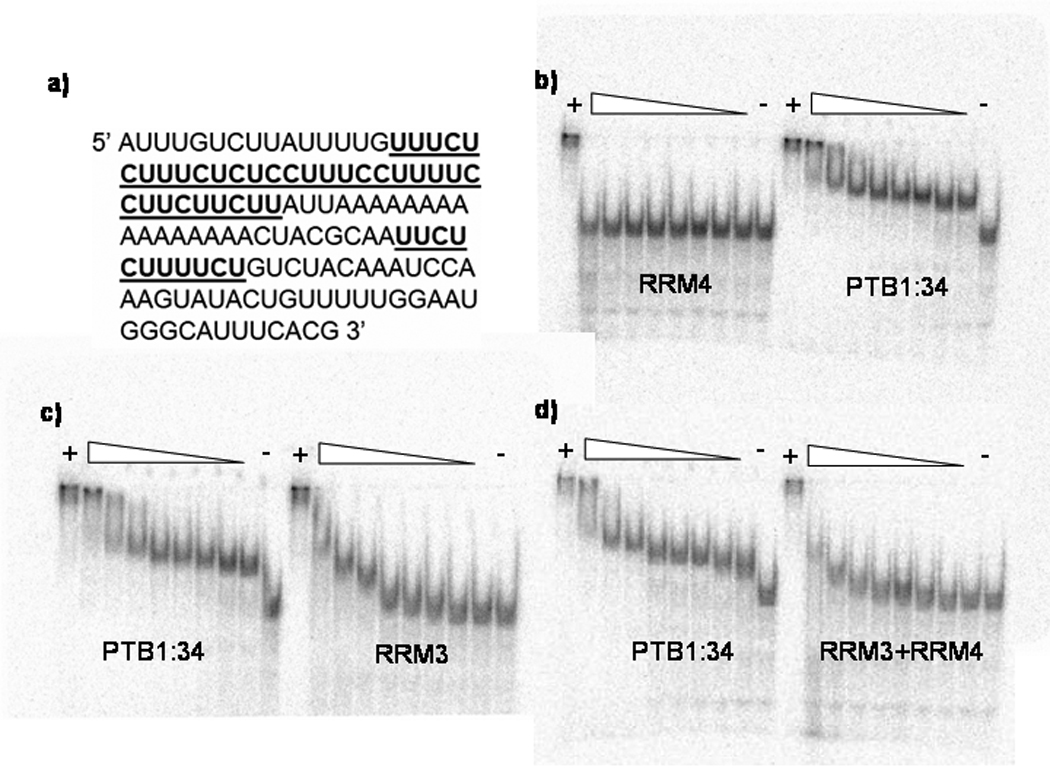
Electrophoretic mobility shift assays were used to compare the relative binding affinities of the GABAA γ2 pre-mRNA intron (a) to the PTB1:34 protein constructs. PTB1:34 binds at the lowest protein concentration tested, 10 nM, while RRM4 does not bind at all, even at the highest concentration tested, 10 µM (b). A similar comparison in (c) shows that RRM3 does bind to this RNA, but with around 50-fold lower affinity than PTB1:34, as the first significant band shift does not occur at protein concentrations less than 500 nM. Mixing RRM3 and RRM4 does not rescue the RNA binding (d), since an equimolar mixture of the two domains binds with affinity similar to that of RRM3 alone. All EMSAs were run at 4° C, and included a lane with RNA only as a negative control, and a lane with 800 nM full-length PTB, which is known to bind to this RNA with high affinity (KD ~ 1 nM for the first binding event in these solution conditions), as a positive control.
The stoichiometry of PTB binding to this RNA is not 1:1, so Electrophoretic Mobility Shift Assay (EMSA) was used to assess the relative binding affinities. As shown in Figure 2, PTB1:34 binds with high affinity to the RNA (binding is observed here at 10 nM protein), while RRM3 binding is approximately 50-fold weaker. The stoichiometry of RRM3 binding has not been determined, but as the gels show, several complexes are observed with higher concentrations of protein. Whether these higher order complexes result from protein:RNA or protein:protein interactions is not known. In contrast to RRM3, RRM4 does not bind to this RNA in 50 to 200 mM NaCl at concentrations up to 10 µM. In an attempt to restore affinity of RRM3, equimolar RRM3 and RRM4 constructs were mixed and bound to the RNA. Those data (Figure 2) show that the presence of RRM4 neither restores nor reduces the affinity of RRM3 for this RNA. The apparent affinity of PTB1:34 for RNA could come from the physical juxtaposition of the two RRMs. Estimating the KD of RRM4 at 10−3 M and that of RRM3 at 5×10⁻⁷ M, the affinity of PTB1:34 might be simply KD4*KD3 = 10−10 M. Our calculated affinity for the first complex of PTB1:34 formed on this RNA is ~1 nM28 which is certainly within error of the estimated affinity.
The properties of PTB1:34 that allow it to bind to this RNA could include a unique electrostatic potential surface that attracts the RNA strand. Certainly one feature of a polypyrimidine tract with a high proportion of uridines is its flexibility, and it could wrap around PTB1:34 to make contacts between its phosphate backbone and positively charged amino acid sidechains. Indeed, RNA binding is salt dependent over the range of 50 to 500 mM NaCl (although affinities have not been quantified) indicating that some electrostatic component does contribute to complex formation.
To characterize the surface electrostatics of PTB1:34, RRM3, and RRM4, each construct was analyzed using the adaptive Poisson-Boltzman solver (APBS) to calculate the electrostatic potential surface29. The results were mapped onto the solvent accessible surface area of each protein (Fig. 3), and show that the interaction between RRM3 and RRM4 creates a distribution of positive potential on PTB1:34 that could be a path for the RNA backbone, and may contribute to RNA binding. This path includes amino acids in the linker, and although direct interactions between RNA and linker residues have not been reported, they cannot be excluded especially when the RNA strand is long enough to wrap around the domain. Charge polarization of the PTB1:34 domain localizes a negative potential on one side of RRM4 and positive surfaces on RRM3 and RRM4 that could be important for organizing and arranging protein:protein interactions in multimeric complexes28.
Figure 3. Electrostatic potentials of PTB1:34 and the individual domains may contribute to their functional differences.

Electrostatic potential mapped onto the solvent accessible surface area of PTB1:34 (a), RRM3 (b), and RRM4 (c), with positive patches shown in blue, and negative patches in red, shows that the interaction between RRM3 and RRM4 organizes the charge distribution of the protein, and may be important to protein function.
Protein Structure
Structure and stability
The structure of PTB1:34 has been solved by NMR19, 21–23, but there are no structures of the individual RRMs. To compare the secondary structures of the proteins, CD spectra were measured (Figure S1). Each RRM has a stable secondary structure, suggesting that each has adopted the predicted tertiary fold. Two features of the constructs are worth noting, however. The first is that the spectrum of mixed RRM3 + RRM4 does not reproduce the spectrum of PTB1:34. In particular, the molar ellipticity per residue of PTB1:34 is lower than that of either RRM alone. The tertiary structure of PTB1:34 is rather notable for its low fraction of folded protein; only 35% of the residues are part of β-strand or α-helix22. A large fraction of PTB1:34 residues is found in the interdomain linker and loops.
The thermodynamic stability of the proteins was compared using chemical denaturation and thermal melting. Guanidine hydrochloride denaturation profiles of all protein constructs were measured by monitoring the CD signal at 222 nm (Figure S1). RRM3 denaturation can be fit by a two-state model, with an unfolding free energy of −6.3 ± 0.6 kcal/mol. However, RRM4 and PTB1:34 denaturation curves are more complex. In particular, the denaturation profile of RRM4 did not show a clear transition, but was non-cooperative from 0 to 7 M GndHCl. This type of denaturation profile has been reported for proteins that are “downhill folders”30. Such proteins are characterized by a broad landscape of incremental free energy wells that could allow the structure to be adaptable over a range of environments. The denaturation curve of PTB1:34 likewise cannot be fit by a two-state transition. We speculate that the initial increase in negative ellipticity could arise from separation of the two RRMs within PTB1:34, which then denature with their characteristic profiles. Thermal denaturation of the proteins did not provide additional thermodynamic characterization, since RRM3 and PTB1:34 thermal melts are not reversible at micromolar concentrations. RRM4 is not thermally denatured at 90 °C at pH 6.8, indicating again that RRM4 has distinctive properties that could be critical for formation of PTB1:34.
Tertiary structure and dynamics
The structure of PTB1:34 has been solved by NMR19–22, but under sufficiently different solution conditions that the NMR backbone assignments had to be repeated here. In experimental conditions used for RNA binding (20 mM potassium phosphate, pH 6.8, and 100 mM KCl), many backbone amide protons in the interdomain linker, the loop between β2 and β3 of both RRMs, and the loop between RRM3 β4 and β5 were not observable on the chemical shift time scale. A comparison of the published chemical shifts19 and our assignments for PTB1:34 indicates that the resonances are sensitive to solution conditions, but for subsequent experiments, the structure was assumed to be as reported.
For our experiments, the backbone 1H/15N resonances of RRM3 and RRM4 were assigned using standard NMR methods, but full structure determinations have not been done. However, the assigned portions of the constructs indicate that the two RRMs adopt similar structures alone and in PTB1:34, so the NMR structure20 of PTB1:34 is used as a template for further comparisons. The structure of the interdomain linker obviously differs in the two RRMs and in the PTB1:34 domain; in the two RRMs it is disordered but becomes more ordered in PTB1:34.
The 1H/15N-HSQC spectra of the protein constructs reveal several important features of their structure and stability (Figure S2). The 1H/15N-HSQC spectrum of RRM4 is consistent with that of a folded protein. Most resonances are assigned, with the exception of the β2–β3 loop. Notably, most resonances in the 1H/15N-HSQC spectrum of RRM4 are readily identified in the spectrum of PTB1:34, many of them being superimposable. The structure of RRM4 has clearly not been significantly perturbed in the context of PTB1:34.
The 1H/15N-HSQC spectrum of RRM3 is complex, and while the proton chemical shift dispersion is consistent with that of a folded protein, several residues have more than one resonance. These backbone amides are in slow exchange on the NMR chemical shift timescale, which indicates conformational heterogeneity of this RRM. The structural heterogeneity persists from 300 µM to 1 mM protein and from 4 to 37 °C in 100 mM KCl, 20 mM sodium phosphate pH 6.8. It is worth noting that the conformational sampling is not apparent in its two-state unfolding curve (Figure S1). Approximately 70% of RRM3 amides are assigned; most missing residues are those in and around loop3 between β2 and β3, and the loop that connects β4 with β5, where amides are in exchange with solvent and absent from the spectrum. In the context of PTB1:34, RRM3 loses its conformational heterogeneity and shows single amide resonances. It is not surprising that most of its backbone amide resonances are not superimposable with their PTB1:34 counterparts.
A comparison of the assigned resonances of RRM3 and RRM4 with those of PTB1:34 shows that the major chemical shift changes are within the extensive interface (Figure 4). Since the interface involves both helices of RRM3, those amide chemical shifts are expected to change due to their new environment, and as Figure 4 illustrates, there are also chemical shift changes in the amides of the one helix and β4 of RRM4. For RRM4 most chemical shift changes are minor, but for RRM3, more changes are significant, undoubtedly arising from stabilization of the RRM3 structure. We conclude that the RRMs free and in the PTB1:34 protein have the same global folds.
Figure 4. Changes in chemical shifts between the individual and interacting domains indicate only minor changes when the domains are separated.

The change in chemical shift, Δδ, in terms of proton ppm, show that the majority of differences are concentrated at the RRM3/RRM4 interface. Δδ is shown as bars with the protein secondary structure indicated by bars (α-helix) and arrows (β-strand) along the top of the plot. For visual clarity, these changes are mapped onto the structure of PTB1:34 (inset), where white shows the areas of the protein were no data were available, grey indicates no significant Δδ (< 0.25 ppm), blue indicates Δδ between 0.25 and 0.50 ppm, violet, Δδ between 0.50 and 0.75 ppm, purple between 0.75 and 1.00 ppm, and magenta shows the most significant Δδ of greater than 1.00 ppm. Many residues in the interdomain linker are expected to have significant chemical shift changes due to altered environment but could not be calculated since the linker region was largely unassignable for the individual domains.
The PTB1:34 interface is composed of both RRMs and the linker. The contribution of the linker to the physical connection of RRMs is clear from NMR experiments that mix the two RRMs. At concentrations up to 0.5 mM of each RRM, PTB1:34 was not spontaneously formed when the individual domains were mixed. In these solution conditions of 100 mM KCl, 20 mM sodium phosphate, pH 6.8, there was no evidence of complex formation at temperatures from 10–40 °C, and after eight months of incubation at room temperature. Conversely, heating PTB1:34 to 45 °C does not separate the two RRMs. The role of the 24 amino acid linker in stabilizing and orienting the two RRMs is clearly significant.
Protein Backbone Dynamics
Formation of the intricate interface between the two RRMs obviously led to the elimination of the conformational heterogeneity of RRM3 observed in the 1H/15N-HSQC, but could also have resulted in less apparent changes in the dynamics of the two RRMs. Since the dynamics of U1A RRMs have been implicated in their RNA binding mechanism11–13, 22, 31, 32, , the PTB constructs were compared to determine if their backbone dynamics differed.
Fast motions
Standard R1, R2 and 1H/15N heteronuclear NOE experiments33 were used to measure fast (ps-ns) backbone dynamics of RRM3, RRM4 and PTB1:34 at 25°C (Figure S3). The measured R2/R1 ratios were used to calculate the rotational correlation times of each molecule using ModelFree. Individual domains were best fit by an isotropic diffusion tensor to yield global tumbling times (τm) of 5.12 ± 0.05 ns for 300 µM RRM3 and 5.98 ± 0.02 ns for 1 mM RRM4. Each RRM retains a portion of the interdomain linker, which probably increases their global tumbling times, but fitting to an axially symmetric model did not converge. PTB1:34 was best fit with an axially symmetric tensor (D‖/D⊥ = 1.6 ± 0.2 ) to give τM = 9.6 ± 0.1 ns.
Collecting relaxation data on these proteins was complicated by their propensity to nonspecifically associate. Inspection of NMR linewidths in 1H/15N-HSQC experiments for protein concentrations from 100 µM to 1 mM shows that only RRM3 has a concentration-dependence. This construct appears to self-associate at the lowest concentrations measurable, as demonstrated by the average R2/R1 ratio for RRM3, which at 1 mM is approximately double that of the ratio at 300 µM. RRM3 15N relaxation data were collected at 300 µM and 1 mM protein, and while both data sets could be fit by FastModelFree, they gave strikingly different results. At 1 mM RRM3, best fits to nearly all backbone amides required the order parameter S2, local diffusion times τe, and an exchange term Rex. In contrast, most amides in the 300 µM sample were fit by S2 and no exchange term. We interpret this difference as evidence that RRM3 undergoes self-association, so subsequent experiments with RRM3 were done at 300 µM.
A comparison of linewidths at 300 µM and 1 mM for RRM4 and PTB1:34 failed to show a concentration dependence, suggesting that these two proteins behave as monomers in solution. However, using dynamic light scattering (DLS) to assess the homogeneity/heterogeneity of the proteins in solution strongly indicates that PTB1:34 is polydisperse in solution at concentrations from 10 µM to 1 mM. Its scattering profile cannot be fit to a single species, and although the data can’t be analyzed to describe populations of multiple species, it is clear that this protein has a propensity to self-associate. It is worth noting that PTB1:34 solution structure was solved in conditions of 20 mM phosphate buffer, pH 6.8, 100 mM KCl at a concentration of 1 mM. As expected, RRM3 also shows a complex DLS profile consistent with self-association. Rather surprisingly, RRM4 profiles also indicate the presence of larger species, even though its solution properties are otherwise those of a single species. The control BSA sample consistently gave a scattering profile of a monomer, so we must conclude that all constructs have a propensity to self-associate in this buffer.
To estimate the effect of self-association on the relaxation of PTB1:34, data were acquired for 300 µM and 1 mM protein at 700 MHz, and for 1 mM protein at 500 and 600 MHz. Results of Modelfree fits are shown in Figure 5, where it is clear that although the precise values of the Rex terms vary with the data set, nearly all amides required this parameter to fit the data. We conclude that fits of the data at protein concentrations of 300 µM and 1 mM did not differ substantially in either the order parameter or the exchange term. A lack of a concentration dependence of the data is also seen in the R2 values of PTB1:34, shown in Figure S5. Here, data for 300 µM protein acquired at 600 and 700 MHz, and 1 mM protein acquired at 500, 600, and 700 MHz are shown. There is not a systematic shift as a function of concentration, despite the overall variation in the R2 values. These results are in contrast to those for RRM3 alone, which clearly does show concentration dependence in measured R2 values and in fits of the relaxation data. Thus despite knowing that PTB1:34 does suffer some degree of self-association, the Modelfree fits do not appear to be subject to this property.
Figure 5. Fast and slow dynamics of PTB1:34.

Order parameters (S2, top panel) reflecting ps-ns motions and Rex terms (bottom panel) indicating slow (µs-ms) motions are similar for PTB1:34 at 300 µM (green triangles) and 1 mM (blue diamonds) at 700 MHz, and in a global fit of 1 mM PTB1:34 relaxation data at 500 and 600 MHz (red squares). Modelfree fits to T1, T2, and 1H/15N NOE data do show some variation for order parameters and Rex terms for the three parameter sets, but the trends are consistent. The two data sets at 700 MHz differ primarily in the properties of the residues flanking the loops, but most notably in the global tumbling times with τM= 7.2 ± 0.06 ns at 300 µM and τM = 9.2 ± 0.10 at 1mM. While protein self-association is likely to contribute to chemical exchange, we propose that it is not responsible for the extensive Rex terms that pervade PTB1:34 in all conditions here. Data are plotted against residue number (PDB ID: 2EVZ) with secondary structure elements indicated at the top.
Global tumbling
The overall correlation time (τm) is a critical parameter for fitting the relaxation data, as is the description of the diffusion tensor. To supplement the calculations from ModelFree, HYDRONMR34 calculations and TRACT35 experiments were used for all three proteins. Neither of these analyses was able to successfully determine tumbling times for all constructs.
HydroNMR is a software package which estimates the tumbling time of a molecule in solution based on beads packed around a rigid structure34. We used the smallest minibeads to model the domains: bead diameters of 1–2 Å were used for RRM3 and RRM4 and 1.5–3.0 Å for PTB1:34. This analysis yields a tumbling time of 6.1 ns for RRM4, in good agreement with the ModelFree fit. The tumbling time estimated for RRM3 was 7.5 ns, which is slightly more than the tumbling time extracted from ModelFree. This increase is likely due to the peripheral flexible loops in RRM3 that will cause an overestimation of tumbling time by HydroNMR when it makes these loops into rigid structures. This method roundly fails when applied to PTB1:34, giving a tumbling time of 32.3 ns. Clearly this is a nonsensical result, and again we attribute it to the substitution of flexible loops and tails with solid rigid structures by the formalism. HydroNMR also is able to back-calculate R1, R2 and heteronuclear NOE values. Its estimates agree reasonably well with experimental values for the individual RRMs, but not for PTB1:34 (data not shown).
Experimentally, NMR TRACT experiments can be used to measure overall correlation times35. This method also assumes a rigid molecule, but gives a lower bound. Tumbling times obtained from this method give 6.4 ns for 1 mM RRM4, again in good agreement with other methods and supporting the picture of RRM4 as a packed globular domain. However, the tumbling time of 1.5 ns for 300 µM RRM3 was much lower than expected, indicating that for this domain, the rigid molecule assumption fails. Global tumbling times of 7.0 ns and 10.8 ns for 300 µM and 1 mM PTB1:34, respectively were obtained from TRACT experiments, which is consistent with the values calculated from ModelFee. The values of the global tumbling times calculated by the different methods are summarized in Table 1.
Table 1. Comparison of global tumbling times for RRM3, RRM4 and PTB1:34.
Approximate tumbling times were calculated using the Stokes-Einstein relationship, τMSE, assuming all proteins were spherical. HYDRONMR calculates tumbling times based on hypothetical beads packed onto a three-dimensional structure (using coordinates from PDB ID:2EVZ). It will overestimate the tumbling time for flexible proteins. Data for 300 µM RRM3, 1 mM RRM4 as well as PTB1:34 at both 300 µM and 1 mM were collected to experimentally determine τM (ModelFree) and τM(TRACT). ModelFree fits R2, R1 and 1H/15N-heteronuclear NOE data using Lipari-Szabo formalism to extract a tumbling time, and is able to accommodate both isotropic and axially symmetric models. TRACT analysis averages a decay signal from all amide protons and assumes a spherical, rigid protein.
| Concentration | τMSE | τMModelFree | τMTRACT | τMHYDRONMR | |
|---|---|---|---|---|---|
| RRM3 | 0.3mM | 5.2ns | 5.13ns | 1.5ns | 7.5ns |
| RRM4 | 1.0mM | 4.5ns | 5.98ns | 6.4ns | 6.1ns |
| PTB1:34 | 0.3mM | 9.7ns | 7.2ns | 7.0ns | 32.3ns |
| PTB1:34 | 1.0mM | 9.7ns | 9.67ns | 10.8ns | 32.3ns |
Slow motions, fit and measured
To describe the domain motions, the NMR data were fit using the Lipari-Szabo formalism36,37 to give the order parameter, S2, and the exchange term, Rex. These parameters describe the local reorientation and slow motions, respectively, of each amide N-H vector. Order parameters range from 0 ≤ S2 ≤ 1, with S2 = 0 indicating isotropic free rotation and S2 = 1 indicating a rigid vector within the molecular frame. Whereas order parameters report on fast motions (ps-ns), exchange terms indicate µs-ms (slow) motions. Here we use S2 values to compare backbone amide mobility and Rex terms to indicate the presence of slow motions.
Fits of the relaxation data (Figure 5) make it clear that each protein has unique backbone dynamics. Of the two RRMs, the body of RRM4 has uniformly high order parameters (S2av = 0.85), indicating an overall rigid backbone. Only residues flanking the loop between β2 and β3 require Rex terms for fitting, indicating the presence of slower motions (µs – ms). Order parameters for RRM3 are also consistent with a stiff backbone, although several residues have order parameters greater than the theoretical limit (0.95), indicating that they could not be accurately fit. In addition to the residues that are not assignable under these conditions, several residues could not be described by any of the motional models. Given the slow conformational fluctuations of RRM3 that are apparent in its amide 1H/15N-HSQC spectrum, and the fact that this construct appears to self-associate even at concentrations as low as 10 µM, only a subset (about 40%) of all amide resonances yield reliable data for this protein construct.
The same analysis of PTB1:34 shows an overall change in the dynamics, for here both RRMs have greatly increased backbone flexibility. PTB1:34 order parameters are lower, and most of its amides require exchange terms to describe their motions. Modelfree analysis of the relaxation data indicates that slow motions are uniformly distributed throughout PTB1:34, including both RRMs and their interdomain linker. This is an unexpected result and required more extensive experiments for verification.
Pervasive Rex terms can arise as an artifact of an inappropriate diffusion tensor or from global motions of the molecule (such as flexing about the interface). In PTB1:34, we suspect that the diffusion tensor is time-dependent, given its large proportion of long loops and tails and the small fraction of residues that comprise stable secondary structures. The uncertainty in the appropriate description of the diffusion tensor led us to directly measure the exchange contribution to transverse relaxation using standard NMR relaxation experiments.
Relaxation interference experiments38 were used to determine the exchange free transverse relaxation rate of PTB1:34 (Figure 6). Data were collected at the highest static magnetic field strength available (700 MHz) in order to maximize the CSA effect. The scaling factor, κ, which takes into account autorelaxation effects, was calculated as the theoretical ratio of R2/ηxy for 1H/15N dipolar and 15N CSA relaxation pathways. Assuming that the dipolar and CSA principle axes are co-linear, and that the molecule is large enough so that only J(0) needs to be considered, κ=1.06 at 700 MHz. This method of calculating κ was selected for PTB1:34 because such a large fraction of the protein is loop and linker, neither of which has stable defined structure. A similar approach to characterizing motions was taken by Pervushin et al.39, where they were able to show pervasive motions throughout a molten globule-like protein. PTB1:34 is not a molten globule, but its core tertiary fold is not large in proportion to its loops which have complex motions on many timescales. These experiments do not allow characterization of the timescales of motions, but the data do provide a robust identification of residues which undergo exchange rates from µs-ms, thus confirming the presence of slow motions throughout the protein. The success of the analysis was apparent from recalculations of ModelFree analysis of PTB1:34 relaxation data using the exchange free transverse relaxation rate, κηxy, in place of the standard transverse relaxation rate, (R2). Without the weighting from the Rex terms, the calculations returned similar order parameters and overall tumbling time (τm), with now only a single residue in the RRM4 of PTB1:34 that suggested motion on a slow timescale. These data further support the conclusion that the Rex terms from fits to the data are reporting on slow global motions and are not an artifact of an inappropriate diffusion tensor.
Figure 6. ModelFree analysis suggests that slow protein motions throughout PTB1:34 occur as a consequence of the RRM3/RRM4 interaction.

Lipari-Szabo order parameters, S2, are given in the top panel for PTB1:34 (○), and the individual RRMs (■). Both RRM3 and RRM4 are much more rigid alone than in the context of PTB1:34, as evident upon comparison of the exchange contribution to transverse relaxation (Rex) for PTB1:34 (bottom) and RRM3/RRM4 (middle). While PTB1:34 has uniformly dispersed Rex terms of significant magnitude throughout the protein body, only a few residues in RRM3 and RRM4 require similar Rex terms. This analysis shows that the differences in dynamic properties of the protein constructs are slow (µs-ms) motions that arise as a consequence of the RRM3/RRM4 interaction. Data were collected in 20 mM potassium phosphate buffer, pH 6.8, and 100 mM KCl at 500 MHz for 1 mM RRM4 and 700 MHz for 300 µM RRM3. Data for 1 mM PTB1:34 were collected at 500, 600, and 700 MHz; R2 plots for PTB1:34 are shown in Figure S4.
Relaxation interference experiments were also performed for 1 mM RRM4 at 700 MHz. For these calculations, we used κ=1.35 obtained from the trimmed mean40 of the ratio of R2/ηxy. The core of RRM4 is relatively large and stable, most of its resonances are assigned, and the R1/R2 ratios are consistent throughout the domain. There are therefore enough resonances that can be analyzed to give a robust value of the trimmed mean. Note that this approach cannot be applied to PTB1:34. These experiments showed that only seven residues in RRM4 have Rex greater than 5 Hz (data not shown), consistent with the ModelFree predictions.
The Rex term from the Lipari-Szabo formalism cannot provide precise values of the exchange time; it only indicates that motions on the µs-ms timescales are required to fit the data. To measure the timescale of those slow motions in PTB1:34, NMR 15N-CPMG (to assess millisecond motions), and 15N-R1ρ (to assess microsecond motions) data were collected at 700 MHz. The higher field was used to maximize any exchange contribution to the transverse relaxation rate. Analysis of CPMG experiments showed no evidence of millisecond motions in the assignable regions of the protein at 25 °C or 10 °C. (data not shown).
15N-R1ρ relaxation experiments can be used to directly measure µs motions, and are not contingent on a description of the molecular tumbling time. To ensure that the motions detected in the relaxation interference experiments and the ModelFree fits are not artifacts of data analysis, transverse relaxation in the rotating frame was used to directly detect microsecond exchange. Here we use a modified approach to these experiments. We define the quantity ΔR1ρ as the difference between R1ρ relaxation rates at two different spin lock field strengths (Figure 7). We chose two field strengths, 350 and 1750 Hz, to represent the weak and strong field limits, and collected on-resonance transverse relaxation data for all amides by stepping through the spectral width every 5 ppm (15N). R1ρ experiments have been used to extract information about states of a molecule, including exchange rates, populations, and chemical shift differences. The working assumption in those analyses is that there are only two states, but we cannot make that assumption for PTB1:34. As a consequence, we cannot extrapolate the data to 0 Hz spin lock field strength, and so will underestimate the exchange contribution to R2. However, this method does robustly identify residues which experience exchange on a microsecond timescale. Residues throughout PTB1:34 were found to experience microsecond exchange, in qualitative agreement with the Rex terms from the ModelFree fits and relaxation interference experiments.
Figure 7. Relaxation interference experiments confirm the presence of slow motions throughout the body of PTB1:34.

Transverse relaxation rates from standard experiments, R2 (○), are compared to the exchange-free transverse relaxation rate, κηxy (■), in the top panel, plotted against residue number. The difference between the two rates, Rex, shown in the bottom panel, confirms the results obtained from ModelFree analysis of the relaxation data, and verify that slow motions persist throughout the body of PTB1:34. Data were collected at 700 MHz for 1 mM PTB1:34.
This reorganization of protein backbone dynamics of PTB RRM3 and RRM4 upon formation of PTB1:34 is striking and indicates that the motions are an important property of the functional complex. A visual comparison of the backbone dynamics of the RRMs in their free and complex states illustrates the extent of the changes (Figure 8). Although the interaction between RRM3 and RRM4 may contribute to protein function via modest structural reorganization, the biological implications of the motional reorganization are of particular interest. We propose that the microsecond dynamics of the PTB1:34 backbone have three possible functions: first to provide entropic compensation for the protein:protein association, another to prime the protein to select a very flexible RNA as a binding target, and a third to coordinate the two binding sites.
Figure 8. Residues which undergo microsecond exchange are identified by ΔR1ρ experiments, and are in qualitative agreement with the ModelFree results.

A schematic representation of ΔR1ρ is shown in (a) with dispersion curves for a residue with microsecond exchange (blue curve) and a residue with no microsecond exchange (grey curve). Importantly, this figure shows the propensity of the method to underestimate the exchange contribution to R2 because the R1ρ rates at the spin lock field strength of 0 Hz cannot be extrapolated for non-two-state systems. ΔR1ρ results are shown in (b), plotted against residue number, and mapped onto the 3-dimensional structure in (c) (PDB ID: 2EVZ). These results indicate that residues throughout PTB1:34 are in microsecond exchange, and substantiate the Rex terms obtained from ModelFree.
Discussion
PTB has been implicated in such a wide variety of biological functions41 that understanding its RNA selection mechanism is critical for predicting its role in a specific environment. Here, we focus on only the two C-terminal RRMs of PTB, yet this half of the protein has the capacity to act independently of its N-terminal domains due to the long, flexible linker that connects RRM3 to RRM220, 42. Indeed, there are reports that suggest a truly independent function for PTB1:34. The first showed that the polio protease 3Cpro can cleave the linker between RRM2 and RRM343. Since PTB has been shown to be required for translation initiation at the poliovirus IRES44, this cleavage event is intriguing in its implication of a separation of function. Recently a second report showed that Hepatitis Virus A protease 3C also cleaved PTB, with the result that translation initiating from an Internal Ribosome Entry Site was inhibited45. A third report identified a new alternative splicing event that produces an independent PTB1:34 protein46. The novel PTB1:34 is also curious in that it lacks the nuclear localization signal of PTB, making it exclusively cytoplasmic. Our studies of PTB1:34 are therefore quite relevant to its in vivo function.
PTB1:34 is a unique domain
This complex of RRM3 and RRM4 must be considered as a single protein entity. While there are no data that describe when during protein synthesis the two RRMs become inextricably one domain, their association must occur early during protein folding. That speculation is based on the inability of the two separate RRMs to associate in vitro, and on the durability of the PTB1:34 domain after its formation. Mixed RRM3 and RRM4 do not associate, even over a wide variety of solution conditions and temperatures, and at high protein concentrations, suggesting that the role of the 24 amino acid linker is not merely to connect the two RRMs, but to assist in formation of the final domain. Published NMR structures20, 22 of PTB1:34 reveal that 17 of the 24 amino acids in the linker are structured (consistent with our assignments). Energetically, tethering both RRMs decreases the entropy of their association and RRM interactions with linker residues stabilizes the complex.
The reorganization of backbone dynamics upon RRM3/RRM4 interaction could contribute to the energetics of RRM association. Formation of the RRM3/RRM4 complex restricts RRM3 to a single structure on the chemical shift timescale and anchors large parts of the linker. At the same time, RRM4 gains intrinsic backbone dynamics. It is tempting to conclude that its gain of flexibility is possible because RRM4 has low energy barriers between its conformational states. We hypothesize that part of its role in PTB1:34 is to reduce the conformational heterogeneity of RRM3 and the linker, which could be accomplished by either ‘capturing’ the correct structure or through an ‘induced-fit’ mechanism involving both RRMs. The result is that both RRMs are coupled through slow (microsecond) motions that provide the energetic basis for forming PTB1:34.
Changes in protein motions have been implicated in entropic compensation for complex formation in a variety of systems. Redistribution of backbone and side-chain dynamics49 has been observed for protein-protein interactions7,8, 47, but few have compared the backbone dynamics of the free proteins to that of their complex. Systems which report increased dynamics upon interaction of molecules are rare, but include the signal transduction protein Cdc42hs side chains49 when binding to PBD46, and the N-terminal domain of DnaJ7, where µs-ms motions are increased when the presence of a C-terminal unstructured region induces interaction between helices III and IV. Here, we show that formation of PTB1:34 results in a new profile of backbone dynamics that differs dramatically from that in either RRM alone. Although we show that all parts of PTB1:34 move on similar timescales and with similar amplitudes, we cannot describe the mechanism that results in this global change of backbone dynamics. We anticipate that details of the interface are critical for transduction of motions throughout both domains, but whether all interactions are equally important is not known. It seems likely that there is thermodynamic and physical coupling between interactions such that they do not operate independently.
PTB1:34 and RNA binding
A redistribution of backbone dynamics has also been observed for protein-ligand interactions5, 50, which is likely to occur when PTB1:34 binds to unstructured polypyrimidine tracts. Certainly the polypyrimidine tract will lose conformational flexibility, but parts of the RNA could remain free to move31, 51 and even sample bound conformations. The ubiquitin-SH3 interaction provides an example of the energetics of protein:ligand association that lead to two distinct bound conformations of both proteins48. By analogy, the energetics of PTB1:34-RNA interactions could result in several conformations of both RNA and protein, and suggest a possible mechanism for PTB1:34 binding to different RNA targets. The network of interactions between two RRMs facilitates communication between the domains and alters the backbone dynamics of each RRM constituent. When RNA is bound, the same network could facilitate redistribution of backbone dynamics to compensate for unfavorable binding entropy. We propose that the new range of motions of PTB1:34 is an intrinsic component of its mechanism of ligand selection.
The extent of motions throughout PTB1:34 suggests that the entire protein could move in concert. The analysis of low frequency protein motions using anisotropic normal modes (ANM)52 gives another picture of the global dynamics of PTB1:34, and provides a sense of how the motions might be transferred through the body of the protein. Applying ANM calculations (www.ccbb.pitt.edu/anm/) to the structure of PTB1:3420 predicts possible modes, some of which are very local. Of those that encompass the entire domain, several suggest a flexing about the interface, and a resulting pincer motion of loops from both RRMs (Fig. 8). If these large scale motions correspond to the measured microsecond dynamics, perhaps they are part of the RNA binding mechanism to bring the RNA strand into position on the surface of the domain.
We specifically propose that the changes in the dynamics of each separate RRM upon formation of PTB1:34 contribute to its RNA binding mechanism by priming the protein for binding to a flexible RNA. Experiments have shown that PTB1:34 has a much greater affinity for unstructured polypyrimidine tracts than for short tracts in a loop or bulge53. Furthermore, both experiment54 and simulation55 have shown that RRM4 binds RNA in the context of PTB1:34. PTB1:34 should be considered as an extended RRM with a complex RNA binding site, with coordinated motions that steer the flexible polypyrimidine tracts onto its surface. Motional coupling of the C-terminal RRMs is a unique feature of this domain, and intrinsic to its function. The redistribution of protein motions upon formation of the RRM3/RRM4 domain may explain both the driving force for the complex formation as well as the RNA selection mechanism of PTB1:34.
Methods
Protein production and purification
The human PTB1 gene cloned into the pET 28A vector was a generous gift from Professor D. Black (University of California, Los Angeles). PTB1:34 begins at amino acid [Met334]G335Asn336 and ends at Ile531. RRM4 starts at [Met]Gly442Ser443 and ends at Ile531. RRM3 begins at amino acid [Met334]G335Asn336 and ends at Lys339. Proteins were produced in E. Coli BL-21 DE3 gold cells grown at 37°C in M9 minimal media using 15NH4Cl for the sole nitrogen source for 15N labeled proteins, and [13C]6-glucose as the sole carbon source for the doubly labeled proteins. At OD600=0.9, 1 mM IPTG was used to induce protein overexpression. Cells were harvested after 4 hours, pelleted by centrifugation at 6500 rpm, washed with 20 mM Tris, pH 7.5, 20 mM NaCl, and 2 mM EDTA, repelleted and stored at −80°C overnight. Cells were resuspended in Buffer B (20mM Sodium Acetate, pH 5.3, 50–200 mM NaCl, 2 mM EDTA) with 20 µg/mL PMSF, 50 units/g DNase II, and Sigma protease inhibitor cocktail, and lysed using a French press. The lysate was spun down at 15,000 rpm and dialyzed against 1 L buffer B at 4°C for 3 hours. The dialysis product was cleared via centrifugation and loaded onto a CM-sepharose column equilibrated in buffer C (50 mM Tris, pH 7.5 (room temperature), 10–100 mM NaCl). After flow-through was discarded, the proteins were eluted with a NaCl gradient in buffer C. Fractions from the column were combined and concentrated using Vivaspin centrifugal concentrators, and then exchanged into NMR buffer (20 mM potassium phosphate, pH 6.8, 100 mM KCl, 0.05% NaN3.)
EMSA
Binding was measured using folded [α-32P]RNA in 10 mM KCl and 10 µg/µL yeast tRNA (Boehringer) mixed with the purified protein constructs (10 nM – 5 µM) in 10 mM sodium cacodylate, pH 7.5, 100 mM NaCl, 1 mM MgCl2, and 20 µg/mL BSA. All reactions were incubated for 30 minutes at room temperature. Glycerol loading dye was added and reactions were loaded on 8% polyacrylamide gels (37.5:1 acrylamide:bis) in 50 mM Tris-HCl/Glycine buffer. Gels were run at 7 V/cm at 4°C for 4–5 hours.
Circular Dichroism
CD spectra were collected using a Jasco-J600 spectropolarimeter and a 0.1 cm path length cuvette. Samples were 25 µM protein in 20 mM potassium phosphate, pH 6.8, and 100 mM KCl. Guanidine HCl samples were incubated for at least 12 hours and exact GndHCl concentrations were determined using refractive index. Unfolding curves were collected in duplicate, and fit to a 2-state model using Origin software.
NMR spectroscopy
NMR spectra were acquired on Varian Unity 500, 600 and 700 spectrometers equipped with Nalorac or Varian 5 mM triple resonance probes. Protein samples contained 100 µM-1 mM protein in 20 mM potassium phosphate, pH 6.8, 100 mM KCl, 0.005% NaN3, and 10% D2O. All data were collected at 25°C (unless otherwise noted), calibrated against 100% methanol. Data for backbone assignments were collected from standard 3D CBCA(CO)NH, HNCACB, HNCO, and HNCACO experiments, and processed using Felix (Accelyrs). Chemical shift comparisons were made using 1H/15N-HSQC experiments, and chemical shift differences were calculated as a single, weighted average. R1, R2, R1ρ and 1H/15N-NOE data were collected using standard methods21 with delay times of 17, 34*, 51, 68,85,118,152* and 186 ms for R2, and 11, 112*, 223, 335, 503, 670, 838* and 1005 ms for R1, with starred delays collected in duplicate for error analysis. ModelFree56 fitting was performed for data collected at 500 MHz for RRM4, 700 MHz for RRM3, and globally fit at 500 and 600 MHz for PTB1:34 (data were also collected at 700 MHz). Relaxation interference experiments were used to collect the exchange free transverse relaxation rate, ηxy, with delay times of 5, 10, 15, 20, 25, 30, 40 and 50 ms using a single, semi-constant time experiment40 at 700 MHz. Rex was then calculated as the difference between R2 and κηxy, where κ is a constant over all residues, under the assumption that the 1H-15N dipolar and the 15N CSA axes are co-linear. Determination of κ for RRM4 was taken as a trimmed mean of the ratio of measured R2/ηxy (at 700MHz) for residues not undergoing exchange, and was found to be 1.35. Since PTB1:34 is larger, and does not have a clear baseline of residues which do not undergo exchange, its κ was calculated as the theoretical ratio57,58 of R2/ηxy for dipolar and CSA relaxation pathways:
Where δ is the chemical shift anisotropy of the 15N nucleus,
And p is the 1H/15N dipole-dipole coupling:
Where γN and γH are the 1H and 15N gyromagnetic ratios, B0 is the static magnetic field strength, ΔδN is the difference of the two principal components of the 15N chemical shift tensor, μ0 is the permeability of free space, h is Planck’s constant, and rHN is the 1H/15N internuclear distance.
In TRACT experiments, ηxy was determined from the difference in the transverse relaxation rates between the α and β spin states of all amides in the range ωHN 6–10 ppm. The tumbling times were calculated assuming a rigid rotor. All relaxation data were processed using NMRPipe, and rates were calculated using NMRViewJ (Onemoon Scientific); TRACT data were fit using Origin 7.5. ModelFree56 analysis was performed with Fast ModelFree59, using both isotropic and axially symmetric models for calculation of rotational correlation times to determine the best fit.
Supplementary Material
Figure S1: Secondary structure analysis. Circular dichroism (CD) spectra of each protein construct, as well as an equimolar mixture of RRM3 and RRM4 are shown in (a), with PTB1:34 in blue, RRM3 in green, RRM4 in red, and the RRM3/RRM4 mixture in yellow, indicating that all species are folded, and confirms that mixing the individual RRMs does not form PTB1:34. GndHCl denaturations were monitored by CD at 222 nm, and fit with a 2-state unfolding model (red lines) for PTB1:34 (b), RRM3 (c), and RRM4 (d). While RRM3 can be fit with this model, RRM4 and PTB1:34 cannot, indicating that the thermodynamic properties of the constructs change as a consequence of the RRM3/RRM4 interaction.
Figure S2: 1H/15N-HSQC spectra comparisons show that all protein constructs are folded, but have different structural properties. A comparison of RRM3 and PTB1:34 (a), shows that almost none of the RRM3 peaks (green) are superimposable with the peaks from PTB1:34 (black), indicating global differences in environment. In addition, many of the RRM3 peaks are broadened, and several residues have multiple resonances (circles), indicating structural heterogeneity on the chemical shift time scale. Conversely, RRM4 (blue) has a single resonance for every amide (b), and the peaks are uniformly narrow. Most of the RRM4 peaks are superimposable onto the spectrum of PTB1:34. PTB1:34 displays neither the narrow line-widths of RRM4 nor the multiple resonances of RRM3, but rather behaves as a unique entity.
Figure S3: Differences in dynamic properties of PTB1:34, RRM3 and RRM4 are evident in the 1H/15N relaxation data. Backbone dynamics are shown for PTB1:34 (○), and individual RRMs (■), with protein secondary structure indicated along the top as bars (α-helix) and arrows (β-strand). The longitudinal relaxation rates, R1, are displayed in the middle panel, and show a clear difference in dynamic properties between RRM3, RRM4 and PTB1:34. PTB1:34 behaves as a single unit, even though separately RRM3 and RRM4 have distinctly different relaxation rates. A similar effect is observed for the transverse relaxation rates (R2) shown in the bottom panel. Heteronuclear NOEs (top panel) indicate significant ps-ns mobility for all protein constructs, particularly in the interdomain linker, and the residues adjacent to loop3 in both RRMs. Data were collected in 20 mM potassium phosphate buffer, pH 6.8, and 100 mM KCl at 500 MHz for 1 mM RRM4, and 1 mM PTB1:34, and 700 MHz for 300 µM RRM3 and 1 mM PTB1:34.
Figure S4. R2 data for 1 mM PTB1:34 at 500, 600, and 700 MHz, and 300 µM at 600 and 700 MHz at 25° C. 20 mM potassium phosphate buffer, pH 6.8, and 100 mM KCl. 1 mM 500 MHz filled blue  /1 mM 600 MHz brown
  300 µM
  /1 mM 700 MHz green
  300 µM
  .
.
Table S1: R1, R2 and 1H/15N NOE data for 1 mM PTB1:34 collected at 500, 600 and 700 MHz. Residue numbering is from PDB entry 2EVZ.
Table S2: R1, R2 and 1H/15N NOE data for individual domains. 300 µM RRM3 data were collected at 700 MHz and 1 mM RRM4 data were collected at 500 MHz. Residue numbering is from PDB entry 2EVZ.
Figure 9. The extensive slow motions throughout PTB1:34 are distinct from motions of RRM3 or RRM4 alone.

Slow motions mapped onto the three dimensional structures of PTB1:34 (a), RRM3 (b) and RRM4 (c) (PDB ID: 2EVZ) show striking differences in dynamic properties of the constructs. Grey areas depict residues where no data are available, either because the residue could not be assigned or could not be fit by ModelFree; black regions show residues were data are available, but no Rex term was needed to fit the data. Colored regions indicate Rex terms increasing in magnitude from blue (0–2 Hz), violet (2–5 Hz) to red (> 5 Hz). While PTB1:34 has significant Rex terms throughout the protein, RRM3 and RRM4 are much more rigid on this timescale, giving rise to only a handful of Rex terms indicative of slow motions.
Figure 10. Normal mode calculation of the fluctuations in PTB1:34.

This is mode 6 of the 20 modes calculated for structure PDB ID: 2EVZ. Red colors correspond to large fluctuations and blue colors to small fluctuations; the vectors indicate the direction of motion and their length corresponds to the amplitude of motion. RRM3 is on the left.
Acknowledgements
We thank Dr Greg DeKoster for his NMR advice and assistance. This work is supported by NIH GM077231 to KBH. CMM was supported in part by NIH T32 GM008492 and by a Sigma-Cori predoctoral fellowship.
Footnotes
Publisher's Disclaimer: This is a PDF file of an unedited manuscript that has been accepted for publication. As a service to our customers we are providing this early version of the manuscript. The manuscript will undergo copyediting, typesetting, and review of the resulting proof before it is published in its final citable form. Please note that during the production process errors may be discovered which could affect the content, and all legal disclaimers that apply to the journal pertain.
References
- 1.Boehr DD, McElheny D, Dyson HJ, Wright PE. The dynamic energy landscape of dihydrofolate reductase catalysis. Science. 2006;313:1638–1642. doi: 10.1126/science.1130258. [DOI] [PubMed] [Google Scholar]
- 2.Kempf JG, Jung J, Ragain C, Sampson NS, Loria JP. Dynamic requirements for a functional protein hinge. J. Mol. Biol. 2007;368:131–149. doi: 10.1016/j.jmb.2007.01.074. [DOI] [PMC free article] [PubMed] [Google Scholar]
- 3.Eisenmesser EZ, et al. Intrinsic dynamics of an enzyme underlies catalysis. Nature. 2005;438:117–121. doi: 10.1038/nature04105. [DOI] [PubMed] [Google Scholar]
- 4.Labeikovsky W, Eisenmesser EZ, Bosco DA, Kern D. Structure and dynamics of pin1 durin catalysis by NMR. J. Mol. Biol. 2007;367:1370–1381. doi: 10.1016/j.jmb.2007.01.049. [DOI] [PMC free article] [PubMed] [Google Scholar]
- 5.Bracken C, Carr PA, Cavanagh J, Palmer AG. Temperature dependence of intramolecular dynamics of the basic leucine zipper of GCN4: Implications for the entropy of association with DNA. J. Mol. Biol. 1999;285:2133–2146. doi: 10.1006/jmbi.1998.2429. [DOI] [PubMed] [Google Scholar]
- 6.Spyracopoulos L, Lewis MJ, Saltibus L. Main chain and side chain dynamics of the ubiquitin conjugating enzyme variant human Mms2 in the free and ubiquitin-bound states. Biochemistry. 2005;44:8770–8781. doi: 10.1021/bi050065k. [DOI] [PubMed] [Google Scholar]
- 7.Huang K, Ghose R, Flanangan JM, Prestegard JH. Backbone dynamics of the N-terminal domain in E. Coli DnaJ determined by 15N- and 13CO-relaxation measurements. Biochemistry. 1999;38:10567–10577. doi: 10.1021/bi990263+. [DOI] [PubMed] [Google Scholar]
- 8.Bouguet-Bonnet S, Buck M. Compensatory and long-range changes in picosecond-nanosecond main-chain dynamics upon complex formation: 15N relaxation analysis of the free and bound states of the ubiquitin-like domain of human plexin-B1 and the small GTPase Rac1. J. Mol. Biol. 2008;377:1474–1487. doi: 10.1016/j.jmb.2008.01.081. [DOI] [PMC free article] [PubMed] [Google Scholar]
- 9.Wang X, Tanaka Hall TM. Structural basis for recognition of AU-rich element RNA by the HuD protein. Nature Structural Biology. 2001;8:141–145. doi: 10.1038/84131. [DOI] [PubMed] [Google Scholar]
- 10.Showalter SA, Hall KB. A functional role for correlated motion in the N-terminal RNA-binding domain of Human U1A protein. J. Mol. Biol. 2002;322:533–542. doi: 10.1016/s0022-2836(02)00804-5. [DOI] [PubMed] [Google Scholar]
- 11.Kranz JK, Hall KB. RNA recognition by the human U1A protein is mediated by a network of local cooperative interactions that create the optimal RNA binding surface. J. Mol. Biol. 1999;285:215–231. doi: 10.1006/jmbi.1998.2296. [DOI] [PubMed] [Google Scholar]
- 12.Mittermaier A, Varani L, Muhandiram DR, Kay LE, Varani G. Changes in side-chain and backbone dynamics identify determinants of specificity in RNA recognition by human U1A protein. J Mol Biol. 1999;294:967–979. doi: 10.1006/jmbi.1999.3311. [DOI] [PubMed] [Google Scholar]
- 13.Showalter SA, Hall KB. Altering the RNA-binding mode of the U1A RBD1 protein. J. Mol. Biol. 2004;335:465–480. doi: 10.1016/j.jmb.2003.10.055. [DOI] [PubMed] [Google Scholar]
- 14.Khanam T, Muddashetty RS, Kahvejian A, Sonenberg N, Brosius J. Poly(A)-Binding Protein Binds to A-Rich Sequences via RNA-Binding Domains 1+2 and 3+4. RNA Biology. 2006;3:37–44. doi: 10.4161/rna.3.4.4075. [DOI] [PubMed] [Google Scholar]
- 15.Jenkins JL, Shen H, Green MR, Kielkopf CL. Solution conformation and thermodynamic characteristics of RNA binding by the splicing factor U2AF65. J Biol Chem. 2008;283(48):33641–33649. doi: 10.1074/jbc.M806297200. [DOI] [PMC free article] [PubMed] [Google Scholar]
- 16.Gil A, Sharp PA, Jamison SF, Garcia-Blanco MA. Characterization of cDNAs encoding the polypyrimidine tract binding protein. Genes Dev. 1991;5:1224–1232. doi: 10.1101/gad.5.7.1224. [DOI] [PubMed] [Google Scholar]
- 17.Ghetti A, Piňol-Roma S, Michael WM, Morandi C, Dreyfuss G. hnRNP I, the polypyrimidine tract binding protein: distinct nuclear localization and association with hnRNAs. Nucleic Acid Res. 1992;20:3671–3678. doi: 10.1093/nar/20.14.3671. [DOI] [PMC free article] [PubMed] [Google Scholar]
- 18.Birney E, Kumar S, Krainer AR. Analysis of the RNA-recognition motif and RS and RGG domains: conservation in metazoan pre-mRNA splicing factors. Nucleic Acids Res. 1993;21:5803–5816. doi: 10.1093/nar/21.25.5803. [DOI] [PMC free article] [PubMed] [Google Scholar]
- 19.Conte MR, et al. Structure of tandem RNA recognition motifs from polypyrimidine tract binding protein reveals novel features of the RRM fold. EMBO J. 2000;19:3132–3141. doi: 10.1093/emboj/19.12.3132. [DOI] [PMC free article] [PubMed] [Google Scholar]
- 20.Vitali F, et al. Structure of the two most C-terminal RNA recognition motifs of PTB using segmental isotope labeling. EMBO J. 2006;25:150–162. doi: 10.1038/sj.emboj.7600911. [DOI] [PMC free article] [PubMed] [Google Scholar]
- 21.Simpson PJ, et al. Structure and RNA interaction of the N-terminal RRM domains of PTB. Structure. 2004;12:1631–1643. doi: 10.1016/j.str.2004.07.008. [DOI] [PubMed] [Google Scholar]
- 22.Oberstrass FC, et al. Structure of PTB bound to RNA: specific binding and implications for splicing regulation. Science. 2005;309:2054–2057. doi: 10.1126/science.1114066. [DOI] [PubMed] [Google Scholar]
- 23.Xu RM, Jokhan L, Cheng X, Mayeda A, Krainer AR. Crystal structure of human Up1, the domain of hnRNP A1 that contains two RNA-recognition motifs. Structure. 1997;5:559–570. doi: 10.1016/s0969-2126(97)00211-6. [DOI] [PubMed] [Google Scholar]
- 24.Shamoo Y, Krueger U, Rice LM, Williams KR, Steitz TA. Crystal structure of the two RNA binding domain sof human hnRNP A1 and 1.75 Å resolution. Nat. Struct. Biol. 1997;4:215–222. doi: 10.1038/nsb0397-215. [DOI] [PubMed] [Google Scholar]
- 25.Bae E, et al. Structure and interactions of the first three RNA recognition motifs of splicing factor prp24. J. Mol. Biol. 2007;367:1447–1458. doi: 10.1016/j.jmb.2007.01.078. [DOI] [PMC free article] [PubMed] [Google Scholar]
- 26.Gontarek RR, et al. hnRNP C and polypyrimidine tract binding protein specifically interact with the pyrimidine-rich region within the 3’NTR of the HCV RNA genome. Nucleic Acids Res. 1999;27:1457–1463. doi: 10.1093/nar/27.6.1457. [DOI] [PMC free article] [PubMed] [Google Scholar]
- 27.Ashiya M, Grabowski PJ. A neuron-specific splicing switch mediated by an array of pre-mRNA repressor sites: evidence of a regulatory role for the polypyrimidine tract binding protein and a brain-specific PTB counterpart. RNA. 1997;3:996–1015. [PMC free article] [PubMed] [Google Scholar]
- 28.Clerte C, Hall KB. Characterization of multimeric complexes formed by the human PTB1 protein on RNA. RNA. 2006;12:457–475. doi: 10.1261/rna.2178406. [DOI] [PMC free article] [PubMed] [Google Scholar]
- 29.Baker NA, Sept D, Joseph S, Holst MJ, McCammon JA. Electrostatics of nanosystems: application to microtubules and the ribosome. Proc. Natl. Acad. Sci. USA. 2001;98:10037–10041. doi: 10.1073/pnas.181342398. [DOI] [PMC free article] [PubMed] [Google Scholar]
- 30.Garcia-Mira MM, Dadqi M, Fischer N, Sanchez-Ruiz JM, Munoz V. Experimental identification of downhill protein folding. Science. 2002;298:2191–2195. doi: 10.1126/science.1077809. [DOI] [PubMed] [Google Scholar]
- 31.Showalter WA, Hall KB. Correlated motions in the U1A snRNA stem/loop 2/RBD1 complex. Biophys. J. 2005;89:2046–2058. doi: 10.1529/biophysj.104.058032. [DOI] [PMC free article] [PubMed] [Google Scholar]
- 32.Lu J, Hall KB. Tertiary structure of RBD2 and backbone dynamics of RBD1 and RBD2 of the human U1A protein determined by NMR spectroscopy. Biochemistry. 1997;36:10393–10405. doi: 10.1021/bi9709811. [DOI] [PubMed] [Google Scholar]
- 33.Kay LE, Torchia DA, Bax A. Backbone dynamics of proteins as studied by 15N inverse detected heteronuclear NMR spectroscopy: Application to staphylococcal nuclease. Biochemistry. 1989;28:8972–8979. doi: 10.1021/bi00449a003. [DOI] [PubMed] [Google Scholar]
- 34.Garcia de la Torre J, Huertas ML, Carrasco B. HYDRONMR: Predication of NMR relaxation of globular protein from atomic-level structure and hydrodynamic calculations. J. Magn. Reson. 2000;147:138–146. doi: 10.1006/jmre.2000.2170. [DOI] [PubMed] [Google Scholar]
- 35.Lee D, Hilty C, Wider G, Wüthrich K. Effective rotational correlation times of proteins from NMR relaxation interference. J. Magn. Reson. 2006;178:72–76. doi: 10.1016/j.jmr.2005.08.014. [DOI] [PubMed] [Google Scholar]
- 36.Lipari G, Szabo A. Mode-free approach to the interpretation of nuclear magnetic resonance relaxation in macromolecules. 1. Theory and range of validity. J Am Chem Soc. 1982;104:4546–4559. [Google Scholar]
- 37.Lipari G, Szabo A. Mode-free approach to the interpretation of nuclear magnetic resonance relaxation in macromolecules. 2. Analysis of experimental results. J. Am. Chem. Soc. 1982;104:4559–4570. [Google Scholar]
- 38.Pervushin K, Vamvaca K, Vogeli B, Hilvert D. Structure and dynamics of a molten flobular enzyme. Nat. Str. Molec. Biol. 2007;14:1202–1206. doi: 10.1038/nsmb1325. [DOI] [PubMed] [Google Scholar]
- 39.Gardino AK, Kern D. Functional dynamics of response regulators using NMR relaxation techniques. Methods Enzymology. 2007;423:149–165. doi: 10.1016/S0076-6879(07)23006-X. [DOI] [PubMed] [Google Scholar]
- 40.Liu Y, Prestegard JH. Direct measurement of dipole-dipole/CSA cross-correlated relaxation by a constant-time experiment. J. Magn. Reson. 2008;193:23–31. doi: 10.1016/j.jmr.2008.03.013. [DOI] [PMC free article] [PubMed] [Google Scholar]
- 41.Sawicka K, Bushell M, Spriggs KA, Willis AE. Polypyrimidine tract binding protein: a multifunctional RNA-binding protein. Biochem. Soc. Trans. 2008;36:641–647. doi: 10.1042/BST0360641. [DOI] [PubMed] [Google Scholar]
- 42.Petoukhov MV, et al. I. Conformation of polypyrimidine tract binding protein in solution. Structure. 2006;14:1021–1027. doi: 10.1016/j.str.2006.04.005. [DOI] [PubMed] [Google Scholar]
- 43.Back SH, et al. Translation of poliovirus mRNA is inhibited by cleavage of polypyrimidine tract binding proteins executed by poliovirus 3Cpro. J. Virol. 2002;76:2529–2542. doi: 10.1128/jvi.76.5.2529-2542.2002. [DOI] [PMC free article] [PubMed] [Google Scholar]
- 44.Hellen CUT, et al. A cytoplasmic 57-kDa protein that is required for translation of picornavirus RNA by internal ribosome entry is identical to the nuclear pyrimidine tract binding protein. Proc. Natl. Acad. Sci. 1993;90:7642–7646. doi: 10.1073/pnas.90.16.7642. [DOI] [PMC free article] [PubMed] [Google Scholar]
- 45.Kanda T, Gauss-Muller V, COrdes S, Tamura R, Okitsu K, Shuang W, Nakamoto S, Fujiwara K, Imazeki F, Yokosuka O. Hepatitis A virus (HAV) proteinase 3C inhibits HAV IRES-dependent translation and cleaves the polypyrimidine tract binding protein. J Viral Hepat. 2009 doi: 10.1111/j.1365-2893.2009.01221.x. DOI:10.1111/j.1365-2893.2009.01221.x. [DOI] [PubMed] [Google Scholar]
- 46.Hamilton BJ, Genin A, Cron RQ, Rigby WFC. Delineation of a novel pathway that regulated CD154 (CD40 ligand) expression. Mol. Cell. Biol. 2003;23:510–525. doi: 10.1128/MCB.23.2.510-525.2003. [DOI] [PMC free article] [PubMed] [Google Scholar]
- 47.Arumugam S, et al. Increased backbone mobility in β-barrel enhances entropy gain driving binding of N-TIMP-1 to MMP-3. J. Mol. Biol. 2003;327:719–734. doi: 10.1016/s0022-2836(03)00180-3. [DOI] [PubMed] [Google Scholar]
- 48.Korzhnev DM, Bezsonova I, Lee S, Chalikian TV, Kay LE. Alternate binding modes for a ubiquitin-SH3 domain interaction studied by NMR spectroscopy. J. Mol. Biol. 2009;386:391–405. doi: 10.1016/j.jmb.2008.11.055. [DOI] [PubMed] [Google Scholar]
- 49.Loh AP, Pawley N, Nicholson LK, Oswald RE. An increase in side chain entropy facilitates effector binding: NMR characterization of the side chain methyl group dynamics in Cdc42Hs. Biochemistry. 2001;40:4590–4600. doi: 10.1021/bi002418f. [DOI] [PubMed] [Google Scholar]
- 50.Ferreon JC, Hilser VJ. Ligand-induced changes in dynamics in the RT loop of the C-terminal SH3 domain of Sem-5 indicate cooperative conformational coupling. Protein Sci. 2003;12:982–996. doi: 10.1110/ps.0238003. [DOI] [PMC free article] [PubMed] [Google Scholar]
- 51.Shajani Z, Drobny G, Varani G. Binding of U1A protein changes RNA dynamics as observed by 13C NMR relaxation studies. Biochemistry. 2007;46:5875–5883. doi: 10.1021/bi602658x. [DOI] [PubMed] [Google Scholar]
- 52.Atilgan AR, Durrell SR, Jernigan RL, Demirel MC, Keskin O, Bahar I. Anisotropy of fluctuation dynamics of proteins with an elastic network model. Biophys. J. 2001;80:505–515. doi: 10.1016/S0006-3495(01)76033-X. [DOI] [PMC free article] [PubMed] [Google Scholar]
- 53.Clerte & Hall. The domains of polypyrimidine tract binding protein have distinct RNA structural preferences. Biochemistry. 2009;48:2063–2074. doi: 10.1021/bi8016872. [DOI] [PMC free article] [PubMed] [Google Scholar]
- 54.Auweter SD, Oberstrass FC, Allain FH-T. Solving the structure of PTB in complex with pyrimidine tracts: An NMR study of protein-RNA complexes of weak affinities. J. Mol. Biol. 2007;367:174–186. doi: 10.1016/j.jmb.2006.12.053. [DOI] [PubMed] [Google Scholar]
- 55.Schmid N, Zagrovic B, van Gunsteren WF. Mechanism and thermodynamics of binding of the polypyrimidine tract binding protein to RNA. Biochemistry. 2007;46:6500–6512. doi: 10.1021/bi6026133. [DOI] [PubMed] [Google Scholar]
- 56.Mandel AM, Akke M, Palmer AG. Backbone dynamics of Escherichia coli ribonuclease H1 – correlations with structure and function in an active enzyme. J. Mol. Biol. 1995;246:144–163. doi: 10.1006/jmbi.1994.0073. [DOI] [PubMed] [Google Scholar]
- 57.Goldman M. Interference effects in the relaxation of a pair of unlike spin-½ nuclei. J Magnet Reson. 1984;60:437–452. [Google Scholar]
- 58.Tjandra N, Szabo A, Bax A. Protein backbone dynamics and 15N chemical shift anisotropy from quantitative measurement of relaxation interference effects. J. Am. Cehm. Soc. 1996;118:6986–6991. [Google Scholar]
- 59.Cole R, Loria JP. FAST-Modelfree: a program for rapid automated analysis of solution NMR spin-relaxation data. J. Biomol. NMR. 2003;26:203–213. doi: 10.1023/a:1023808801134. [DOI] [PubMed] [Google Scholar]
Associated Data
This section collects any data citations, data availability statements, or supplementary materials included in this article.
Supplementary Materials
Figure S1: Secondary structure analysis. Circular dichroism (CD) spectra of each protein construct, as well as an equimolar mixture of RRM3 and RRM4 are shown in (a), with PTB1:34 in blue, RRM3 in green, RRM4 in red, and the RRM3/RRM4 mixture in yellow, indicating that all species are folded, and confirms that mixing the individual RRMs does not form PTB1:34. GndHCl denaturations were monitored by CD at 222 nm, and fit with a 2-state unfolding model (red lines) for PTB1:34 (b), RRM3 (c), and RRM4 (d). While RRM3 can be fit with this model, RRM4 and PTB1:34 cannot, indicating that the thermodynamic properties of the constructs change as a consequence of the RRM3/RRM4 interaction.
Figure S2: 1H/15N-HSQC spectra comparisons show that all protein constructs are folded, but have different structural properties. A comparison of RRM3 and PTB1:34 (a), shows that almost none of the RRM3 peaks (green) are superimposable with the peaks from PTB1:34 (black), indicating global differences in environment. In addition, many of the RRM3 peaks are broadened, and several residues have multiple resonances (circles), indicating structural heterogeneity on the chemical shift time scale. Conversely, RRM4 (blue) has a single resonance for every amide (b), and the peaks are uniformly narrow. Most of the RRM4 peaks are superimposable onto the spectrum of PTB1:34. PTB1:34 displays neither the narrow line-widths of RRM4 nor the multiple resonances of RRM3, but rather behaves as a unique entity.
Figure S3: Differences in dynamic properties of PTB1:34, RRM3 and RRM4 are evident in the 1H/15N relaxation data. Backbone dynamics are shown for PTB1:34 (○), and individual RRMs (■), with protein secondary structure indicated along the top as bars (α-helix) and arrows (β-strand). The longitudinal relaxation rates, R1, are displayed in the middle panel, and show a clear difference in dynamic properties between RRM3, RRM4 and PTB1:34. PTB1:34 behaves as a single unit, even though separately RRM3 and RRM4 have distinctly different relaxation rates. A similar effect is observed for the transverse relaxation rates (R2) shown in the bottom panel. Heteronuclear NOEs (top panel) indicate significant ps-ns mobility for all protein constructs, particularly in the interdomain linker, and the residues adjacent to loop3 in both RRMs. Data were collected in 20 mM potassium phosphate buffer, pH 6.8, and 100 mM KCl at 500 MHz for 1 mM RRM4, and 1 mM PTB1:34, and 700 MHz for 300 µM RRM3 and 1 mM PTB1:34.
Figure S4. R2 data for 1 mM PTB1:34 at 500, 600, and 700 MHz, and 300 µM at 600 and 700 MHz at 25° C. 20 mM potassium phosphate buffer, pH 6.8, and 100 mM KCl. 1 mM 500 MHz filled blue /1 mM 600 MHz brown 300 µM /1 mM 700 MHz green 300 µM .
Table S1: R1, R2 and 1H/15N NOE data for 1 mM PTB1:34 collected at 500, 600 and 700 MHz. Residue numbering is from PDB entry 2EVZ.
Table S2: R1, R2 and 1H/15N NOE data for individual domains. 300 µM RRM3 data were collected at 700 MHz and 1 mM RRM4 data were collected at 500 MHz. Residue numbering is from PDB entry 2EVZ.