

Abstract
Mycobacteriophages are viruses that infect mycobacterial hosts. Expansion of a collection of sequenced phage genomes to a total of sixty – all infecting a common bacterial host – provides further insight into their diversity and evolution. Of the sixty phage genomes, 55 can be grouped into nine clusters according to their nucleotide sequence similarities, five of which can be further divided into subclusters; five genomes do not cluster with other phages. The sequence diversity between genomes within a cluster varies greatly; for example, the six genomes in cluster D share more than 97.5% average nucleotide similarity with each other. In contrast, similarity between the two genomes in Cluster I is barely detectable by diagonal plot analysis. The total of 6,858 predicted ORFs have been grouped into 1523 phamilies (phams) of related sequences, 46% of which possess only a single member. Only 18.8% of the phams have sequence similarity to non-mycobacteriophage database entries and fewer than 10% of all phams can be assigned functions based on database searching or synteny. Genome clustering facilitates the identification of genes that are in greatest genetic flux and are more likely to have been exchanged horizontally in relatively recent evolutionary time. Although mycobacteriophage genes exhibit smaller average size than genes of their host (205 residues compared to 315), phage genes in higher flux average only ∼100 amino acids, suggesting that the primary units of genetic exchange correspond to single protein domains.
Keywords: Bacteriophage, Genomics, Tuberculosis, Mycobacteriophage, Evolution
Introduction
Bacteriophages are the most numerous biological entities in the biosphere and their genetic diversity and abundant novel gene sequences suggest that they harbor the greatest unexplored reservoir of genetic information. 1; 2 The phage population is not only large (estimated as a total of 1031 particles), but also dynamic, with as many as 1024 phage infections per second on a global scale. 3; 4; 5; 6 Moreover, with a potentially early origin coinciding with the development of cellularity, phage evolution has likely been ongoing for at least three to four billion years. 7; 8 It is therefore perhaps not surprising that analysis of the approximately 600 sequenced bacteriophage genomes reveals them to have unusually high genetic diversity. 5; 9 The majority of bacteriophages are dsDNA tailed phages with genomes varying in size from ∼15kbp to ∼500kbp. 10; 11
Bacteriophages exhibit specificity for their bacterial hosts, although host-ranges vary enormously, from phages that infect only specific strains within a species, to those that infect bacteria of different genera, although usually phylogenetically similar ones. Phages infecting distantly-related bacterial hosts typically share little or no nucleotide sequence similarity, suggesting that host constraints present barriers to genetic exchange. 12 Nonetheless, in spite of a lack of any evident nucleotide sequence similarity, phages may encode protein products with significant amino acid sequence similarities, reflecting old but common origins. 4; 12 Because genes or groups of genes often have distinctly different phylogenetic relationships, phage genomes are typically architecturally mosaic, with each genome corresponding to a unique combination of exchangeable modules. 2; 12 However, the total number of such modules, the number of possible arrangements, and the factors constraining their exchange remain unclear.
Genome comparisons show that module boundaries commonly correlate with gene boundaries, and sometimes with domain boundaries of the encoded proteins. 12 While recombination could be targeted to gene borders via short, shared boundary sequences, 13; 14 the majority of exchange events probably occur by illegitimate recombination events using little or no sequence similarity. 1; 12 In this second model, any correspondence of exchange boundaries with gene extremities would result from selection for gene function, with most genetic exchange events generating genomic trash. 1 A role for lambda Red-like recombination systems has been proposed for mediating exchange events between diverse sequences to contribute to mosaic architectures. 15 Because illegitimate recombination is more likely to occur between phage genomes and the much larger bacterial genomes, phages acquire and transmit host genes and play major roles in the evolution of their bacterial hosts. 2; 16; 17
An additional view of phage diversity can be obtained by comparative genomic analysis of phages that infect a common bacterial host, and therefore have the potential to be in direct genetic interaction with each other. Collections of dsDNA tailed phages infecting Mycobacteria, 16 Pseudomonas, 18 Staphylococcus, 19 dairy bacteria 20 and enteric bacteria 21 have been described. Previously we reported the genomic comparison of 14 mycobacteriophages that can be propagated on Mycobacterium smegmatis, 2 as well as an expanded analysis of 30 genomes of mycobacteriophages. 16 Among the initial 14 phages, there was little identifiable similarity at the nucleotide sequence level, except between phages L5 and D29, and to a lesser extent, Bxz2. 2 Although the collection of 30 genomes showed a high level of genetic diversity, additional groups of genomes with some identifiable nucleotide sequence similarity could be recognized. 16 The putative gene products of these 30 phages were grouped into phamilies of related sequences, and the genomes examined by a gene content comparison. Six clusters of related genomes were revealed (Clusters A-F), encompassing 21 of the thirty genomes, plus nine that were singletons. 16 However, this clustering does not display the complete phylogenetic history of these phages, since each genome also contains examples of genes that have been exchanged horizontally between differently clustered phages. Lawrence et al. (2002) 22 have noted the need for a reticulate taxonomic approach that accommodates the pervasive mosaicism and a graph-based approach has been described to classify phage genomes in a reticulate manner. 23
Here we report an expansion of the collection of sequenced mycobacteriophage genomes to a total of 60. Each of the newly sequenced phages was isolated by direct plating of environmental samples on lawns of M. smegmatis mc2155, purified, sequenced, annotated and compared. We present four approaches to assort these sixty genomes into clusters and subclusters according to their relatedness and use these cluster relation ships to identify genes that are likely to be in more rapid genetic flux than others – either being more frequently lost from phage genomes or gained from genomes outside of their cluster. These rapid flux genes are unusually small – only about 50% the length of the average mycobacteriophage gene – suggesting that bacteriophage genes are on average only two-thirds the size of bacterial host genes because of the dominant role that horizontal genetic exchange plays in their evolution plus the propensity for these readily exchanged genes to be small.
Results and Discussion
Mycobacteriophage isolation and sequencing
Using M. smegmatis mc2155 as a host, we isolated new mycobacteriophages by direct plating of environmental samples (soil, compost, mulch etc.) on bacterial lawns, followed by plaque purification and amplification; samples were from various sources across the United States, although the majority were from the greater Pittsburgh, PA region (Table 1). The genomes of 28 of these were sequenced using a shotgun sequencing strategy and automated Sanger sequencing, which together with the previously described genomes 16; 24; 25 raises the total number of completely sequenced mycobacteriophages to 60, the largest collection of phages known to infect a common host, and more than 10% of the 554 (as of December, 2009) phage genomes deposited in the NCBI phage genome database (http://www.ncbi.nlm.nih.gov/genomes/genlist.cgi?taxid=10239&type=6&name=Phages). Average genome length (72.6kbp) and GC% content (63.4%) are not significantly different from previous analyses 2; 16 nor are the extremes of variance in length and GC% (genome lengths range from 41,901 to 164,602 bp and GC% from 56.3 to 69.1) (Table 1). Thirty-five of the 60 genomes have defined genome ends with 3′ single-stranded extensions from 4 bp to 14 bp, and 25 are circularly permuted and presumed to be terminally redundant (Table 1). Nineteen genomes encode tRNAs ranging from one to 41 genes, and seven of these genomes also encode a tmRNA. The average number of protein-coding genes per genome is 114 (Table 1) and the average gene length is 616bp, about two-thirds that of mycobacterial genes as reported previously. 16 Genome maps for all 60 genomes were created using the Phamerator program and annotated according to the comparative analyses and functional characterization described in further detail below. The complete genome maps are shown in Fig. S1.
Table 1.
Genometrics of 60 sequenced mycobacteriophage genomes
| Phage | Size (bp) | GC% | #ORFs | tRNA # | tmRNA # | % coding | Ends | Accession # | Cluster | Morphotype | Origins | Reference |
|---|---|---|---|---|---|---|---|---|---|---|---|---|
| Bethlehem | 52250 | 63.3 | 87 | 0 | 0 | 92.80 | 10-base 3′ | AY500153 | A1 | Siphovirus | Bethlehem, PA | Hatfull et al., 2006 |
| Bxb1 | 50550 | 63.7 | 86 | 0 | 0 | 91.90 | 9-base 3′ | AF271693 | A1 | Siphovirus | Bronx, NY | Mediavilla et al., 2001 |
| DD5 | 51621 | 63.4 | 87 | 0 | 0 | 94.04 | 10-base 3′ | EU744252 | A1 | Siphovirus | Upp. St. Clair, PA | This work |
| Jasper | 50968 | 63.7 | 94 | 0 | 0 | 94.86 | 10-base 3′ | EU744251 | A1 | Siphovirus | Lexington, MA | This work |
| KBG | 53572 | 63.6 | 89 | 0 | 0 | 93.31 | 10-base 3′ | EU744248 | A1 | Siphovirus | Kentucky | This work |
| Lockley | 51478 | 63.4 | 90 | 0 | 0 | 92.74 | 10-base 3′ | EU744249 | A1 | Siphovirus | Pittsburgh, PA | This work |
| Solon | 49487 | 63.8 | 86 | 0 | 0 | 94.58 | 10-base 3′ | EU826470 | A1 | Siphovirus | Solon, IA | This work |
| U2 | 51277 | 63.7 | 81 | 0 | 0 | 90.11 | 10-base 3′ | AY500152 | A1 | Siphovirus | Bethlehem, PA | Hatfull et al., 2006 |
| Bxz2 | 50913 | 64.2 | 86 | 3 | 0 | 91.73 | 10-base 3′ | AY129332 | A2 | Siphovirus | Bronx, NY | Pedulla et al., 2003 |
| Che12 | 52047 | 62.9 | 98 | 3 | 0 | 94.11 | 10-base 3′ | DQ398043 | A2 | Siphovirus | Chennai, India | Hatfull et al., 2006 |
| D29 | 49136 | 63.5 | 77 | 5 | 0 | 91.79 | 9-base 3′ | AF022214 | A2 | Siphovirus | California | Ford et al., 1998 |
| L5 | 52297 | 62.3 | 85 | 3 | 0 | 88.39 | 9-base 3′ | Z18946 | A2 | Siphovirus | Japan | Hatfull et al., 1993 |
| Pukovnik | 52892 | 63.3 | 88 | 1 | 0 | 93.11 | 10-base 3′ | EU744250 | A2 | Siphovirus | Ft. Bragg, NC | This work |
| Chah | 68450 | 66.5 | 104 | 0 | 0 | 94.99 | Circ Perm | FJ174694 | B1 | Siphovirus | Ruffsdale, PA | This work |
| Orion | 68427 | 66.5 | 100 | 0 | 0 | 94.34 | Circ Perm | DQ398046 | B1 | Siphovirus | Pittsburgh, PA | Hatfull et al., 2006 |
| PG1 | 68999 | 66.5 | 100 | 0 | 0 | 94.55 | Circ Perm | AF547430 | B1 | Siphovirus | Pittsburgh, PA | Hatfull et al., 2006 |
| Qyrzula | 67188 | 69.0 | 81 | 0 | 0 | 92.33 | Circ Perm | DQ398048 | B2 | Siphovirus | Pittsburgh, PA | Hatfull et al., 2006 |
| Rosebush | 67480 | 69.0 | 90 | 0 | 0 | 95.55 | Circ Perm | AY129334 | B2 | Siphovirus | Latrobe, PA | Pedulla et al., 2003 |
| Phaedrus | 68090 | 67.6 | 98 | 0 | 0 | 94.65 | Circ Perm | EU816589 | B3 | Siphovirus | Pittsburgh, PA | This work |
| Pipefish | 69059 | 67.3 | 102 | 0 | 0 | 95.66 | Circ Perm | DQ398049 | B3 | Siphovirus | Pittsburgh, PA | Hatfull et al., 2006 |
| Cooper | 70654 | 69.1 | 99 | 0 | 0 | 96.44 | Circ Perm | DQ398044 | B4 | Siphovirus | Pittsburgh, PA | Hatfull et al., 2006 |
| Nigel | 69904 | 68.3 | 94 | 1 | 0 | 96.48 | Circ Perm | EU770221 | B4 | Siphovirus | Pittsburgh, PA | This work |
| Bxz1 | 156102 | 64.8 | 225 | 35 | 1 | 92.00 | Circ Perm | AY129337 | C1 | Myovirus | Bronx, NY | Pedulla et al., 2003 |
| Cali | 155372 | 64.7 | 222 | 35 | 1 | 93.19 | Circ Perm | EU826471 | C1 | Myovirus | Santa Clara, CA | This work |
| Catera | 153766 | 64.7 | 218 | 35 | 1 | 92.22 | Circ Perm | DQ398053 | C1 | Myovirus | Pittsburgh, PA | Hatfull et al., 2006 |
| Rizal | 153894 | 64.7 | 220 | 35 | 1 | 93.52 | Circ Perm | EU826467 | C1 | Myovirus | Pittsburgh, PA | This work |
| Scott McG | 154017 | 64.8 | 221 | 35 | 1 | 93.01 | Circ Perm | EU826469 | C1 | Myovirus | Pittsburgh, PA | This work |
| Spud | 154906 | 64.8 | 222 | 35 | 1 | 93.19 | Circ Perm | EU826468 | C1 | Myovirus | Pittsburgh, PA | This work |
| Myrna | 164602 | 65.4 | 229 | 41 | 0 | 94.90 | Circ Perm | EU826466 | C2 | Myovirus | Upp. St. Clair, PA | This work |
| Adjutor | 64511 | 59.7 | 86 | 0 | 0 | 96.03 | Circ Perm | EU676000 | D | Siphovirus | Pittsburgh, PA | This work |
| Butterscotch | 64562 | 59.7 | 86 | 0 | 0 | 96.30 | Circ Perm | FJ168660 | D | Siphovirus | Pittsburgh, PA | This work |
| Gumball | 64807 | 59.6 | 88 | 0 | 0 | 96.11 | Circ Perm | FJ168661 | D | Siphovirus | Pittsburgh, PA | This work |
| P-lot | 64787 | 59.7 | 89 | 0 | 0 | 96.38 | Circ Perm | DQ398051 | D | Siphovirus | Pittsburgh, PA | Hatfull et al., 2006 |
| PBI1 | 64494 | 59.7 | 81 | 0 | 0 | 93.73 | Circ Perm | DQ398047 | D | Siphovirus | Pittsburgh, PA | Hatfull et al., 2006 |
| Troll4 | 64618 | 59.6 | 88 | 0 | 0 | 90.92 | Circ Perm | FJ168662 | D | Siphovirus | Silver Springs, MD | This work |
| 244 | 74483 | 62.9 | 142 | 2 | 0 | 95.03 | 9-base 3′ | DQ398041 | E | Siphovirus | Pittsburgh, PA | Hatfull et al., 2006 |
| Cjw1 | 75931 | 63.1 | 141 | 2 | 0 | 94.28 | 9-base 3′ | AY129331 | E | Siphovirus | Pittsburgh, PA | Pedulla et al., 2003 |
| Kostya | 75811 | 62.9 | 143 | 2 | 0 | 92.74 | 9-base 3′ | EU816591 | E | Siphovirus | Washington, DC | This work |
| Porky | 76312 | 62.8 | 147 | 2 | 0 | 93.51 | 9-base 3′ | EU816588 | E | Siphovirus | Concord, MA | This work |
| Boomer | 58037 | 61.1 | 105 | 0 | 0 | 94.37 | 10-base 3′ | EU816590 | F1 | Siphovirus | Pittsburgh, PA | This work |
| Che8 | 59471 | 61.3 | 112 | 0 | 0 | 95.59 | 10-base 3′ | AY129330 | F1 | Siphovirus | Chennai, India | Pedulla et al., 2003 |
| Fruitloop | 58471 | 61.8 | 102 | 0 | 0 | 92.68 | 10-base 3′ | FJ174690 | F1 | Siphovirus | Latrobe, PA | This work |
| Llij | 56852 | 61.5 | 100 | 0 | 0 | 95.46 | 10-base 3′ | DQ398045 | F1 | Siphovirus | Pittsburgh, PA | Hatfull et al., 2006 |
| Pacc40 | 58554 | 61.3 | 101 | 0 | 0 | 96.82 | 10-base 3′ | FJ174692 | F1 | Siphovirus | Pittsburgh, PA | This work |
| PMC | 56692 | 61.4 | 104 | 0 | 0 | 94.60 | 10-base 3′ | DQ398050 | F1 | Siphovirus | Pittsburgh, PA | Hatfull et al., 2006 |
| Ramsey | 58578 | 61.2 | 108 | 0 | 0 | 96.79 | 10-base 3′ | FJ174693 | F1 | Siphovirus | White Bear, MN | This work |
| Tweety | 58692 | 61.7 | 109 | 0 | 0 | 95.78 | 10-base 3′ | EF536069 | F1 | Siphovirus | Pittsburgh, PA | Pham et al., 2007 |
| Che9d | 56276 | 60.9 | 111 | 0 | 0 | 95.41 | 10-base 3′ | AY129336 | F2 | Siphovirus | Chennai, India | Pedulla et al., 2003 |
| BPs | 41901 | 66.6 | 63 | 0 | 0 | 98.74 | 10-base 3′ | EU568876 | G | Siphovirus | Pittsburgh, PA | Sampson et al., '09 |
| Halo | 42289 | 66.7 | 64 | 0 | 0 | 99.56 | 10-base 3′ | DQ398042 | G | Siphovirus | Pittsburgh, PA | Hatfull et al., 06 |
| Konstantine | 68952 | 57.3 | 95 | 0 | 0 | 92.26 | Circ Perm | FJ174691 | H1 | Siphovirus | Pittsburgh, PA | This work |
| Predator | 70110 | 56.3 | 92 | 0 | 0 | 91.84 | Circ Perm | EU770222 | H1 | Siphovirus | Donegal, PA | This work |
| Barnyard | 70797 | 57.3 | 109 | 0 | 0 | 94.97 | Circ Perm | AY129339 | H2 | Siphovirus | Latrobe, PA | Pedulla et al., 2003 |
| Brujita | 47057 | 66.8 | 74 | 0 | 0 | 96.61 | 11-base 3′ | FJ168659 | I | Siphovirus | Virginia | This work |
| Che9c | 57050 | 65.4 | 84 | 0 | 0 | 94.75 | 10-base 3′ | AY129333 | I | Siphovirus | Chennai, India | Pedulla et al., 2003 |
| Corndog | 69777 | 65.4 | 99 | 0 | 0 | 95.00 | 4-base 3′ | AY129335 | Single | Siphovirus | Pittsburgh, PA | Pedulla et al., 2003 |
| Giles | 53746 | 67.5 | 78 | 0 | 0 | 94.45 | 14-base 3′ | EU203571 | Single | Siphovirus | Pittsburgh, PA | Morris et al., 2008 |
| Omega | 110865 | 61.4 | 237 | 2 | 0 | 94.68 | 4-base 3′ | AY129338 | Single | Siphovirus | Upp. St. Clair, PA | Pedulla et al., 2003 |
| TM4 | 52797 | 68.1 | 89 | 0 | 0 | 92.64 | 10-base 3′ | AF068845 | Single | Siphovirus | Colorado | Ford et al., 1998b |
| Wildcat | 78296 | 56.9 | 148 | 24 | 1 | 92.19 | 11-base 3′ | DQ398052 | Single | Siphovirus | Latrobe, PA | Hatfull et al., 2006 |
| TOTAL | 4,354,974 | 6834 | 301 | |||||||||
| AVERAGE | 72,582.9 | 63.4 | 113.9 | 5.02 | 94.18 | |||||||
Mycobacteriophage virion morphologies
The virion morphologies of all 60 phages for which genome sequences have been obtained were examined by electron microscopy (Fig. 1; Fig. S2). All 60 are tailed phages belonging to either the Siphoviridae (53 examples) or Myoviridae (7 examples) morphotypes; none are Podoviruses. Fifty of the siphoviruses contain isometric heads with diameters varying from 55 to 60 nm, while three (Corndog, Che9c and Brujita) have prolate heads (Fig. S2, Table S1); all seven myoviruses have similarly sized isometric heads (85.9nm diameter) (Fig. S2, Table S1). Tail lengths are highly variable, spanning greater than a two-fold range from (135nm to 350nm) (Table S1). In general, capsid volumes predicted from transmission electron microscopy correlate with genome size, indicating similar DNA packaging densities.
Figure 1. Mycobacteriophage morphotypes.
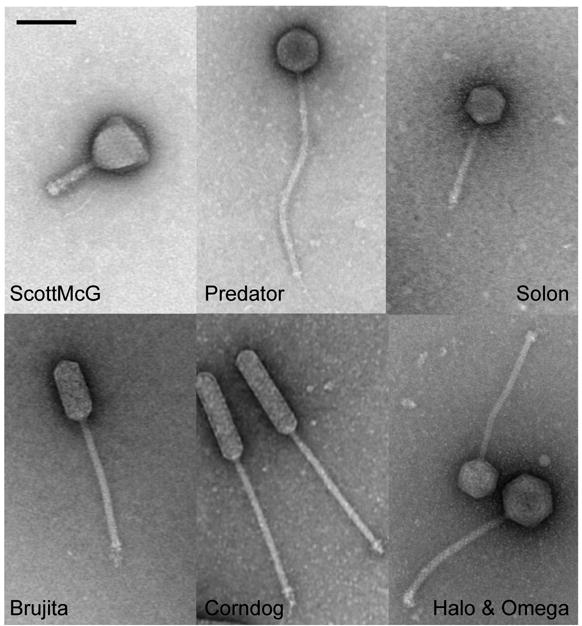
Representatives of each of the different mycobacteriophage morphotypes are shown. Of the 60 sequenced phages, seven phages exhibit myoviral morphotypes with isometric heads (e.g. ScottMcG), and the other 53 all have siphoviral morphotypes. Three of the siphoviruses contain prolate heads, ranging from a length:width ratio of ∼2.5:1 (e.g. Brujita) to 4:1 (Corndog). Tail lengths also vary by greater than two-fold, from the Cluster A phages (e.g. Solon, tail shaft average 113nm) to the Cluster H phages (e.g. Predator, tail shaft average 293nm). Bar corresponds to 100nm. Morphotypes of all 60 phages are shown in Fig. S2 and virion dimensions are listed in Table S1.
Assembly of ORFs into Phamilies
We previously described the assembly of mycobacteriophage ORFs into phamilies (phams) of related sequences 16. We performed phamily assembly of all 6,858 putative ORFs encoded by the 60 mycobacteriophage genomes using an automated program, Phamerator, (Cresawn, Bogel, Hendrix and Hatfull, manuscript in preparation). All ORFs were compared with all other mycobacteriophage ORFs using both ClustalW and BlastP, and any two ORFs with a score of 25% amino acid identity or an E value of 0.0001 or better respectively were grouped into the same pham. This generated a total of 1,523 phams, similar to the 1,536 reported for 30 mycobacteriophages 16 and although the numbers and sizes of the phams has not changed significantly with the doubling of the numbers of genomes, the proportion of Orphams (the 699 phams containing only a single gene) is somewhat lower (reduced from 50.4% to 46.1%) (see below for further explanation). A complete table of phamily assignments and other phamily characteristics is included in Table S2.
Automated pham assembly results in the generation of several very large phamilies primarily due to the modular construction of some ORFs as noted previously, 16 because inclusion of an ORF into a phamily requires only that it share significant similarity to one other ORF. Thus gene A may match gene B, and gene B may match gene C, but gene A and C may share no direct relationship. This situation arises for phams with genes containing inteins or homing domains, or combinations of domains with distinct evolutionary histories.
Three phams (Phams1406, 1410 and 1396) have more than 250 members. These were manually deconvoluted into subphams (Pham 1406-1 etc) with each gene assigned to no more than a single subpham (Table S3). The largest phamily, Pham 1406 (454 members), was deconvoluted into a total of 40 subphams, of which the largest is Pham1406-11, containing 39 members (Table S3). Pham 1406 is of special interest, since it contains mostly virion structural proteins, including putative tail fibers, whose genetic modularity has been noted previously. 26 However, it also contains capsid and major tail subunit proteins, because in some genomes (e.g. Bxb1) these contain common C-terminal extensions. 27; 28 Pham 1410 is the second largest phamily (292 members) – some of which appear to contain HNH motifs that are expected to have greater mobility throughout the phage population – and was deconvoluted into a total of 62 subphams, of which 20 are orphams, apparently included because of similarity scores close to the threshold level (Table S3). Pham 1396 (269) was deconvoluted to a total of 86 subphams, some of which (e.g. Pham 1396-53) are known to function as Recombination Directionality Factors for tyrosine integrases (Table S3). We identified nine additional but smaller phams that warranted similar deconvolution (Phams12, 13, 66, 86, 1219, 1429, 1944, 2292 and 2330), and these are also shown in Table S3. Considering these deconvolutions, the total number of phams and subphams is 1723; the total number of orphams is 773 (44.8% of the total).
Genome clustering
The 60 mycobacteriophage genomes are clearly not uniformly diverse, and we have assorted them into clusters of related genomes. Because three classes of relationships were observed, this sorting is not simple, however. The first two cases reflect the extremes of the relationships, where genomes are either very closely related and clearly belong to the same cluster, or those for which no relationship is seen and can be considered in different clusters. The third class includes those with more complex relationships, and these fall into three main subclasses: where nucleotide similarity is detected across large genome segments but the relationship is very weak, where short segments of very high sequence similarity are found, and where there is little or no evident nucleotide sequence in common, but they share a large number of genes encoding proteins with detectably related amino acid sequences.
A primary utility of clustering the genomes is to facilitate identification of genes and modules that have been exchanged between genomes by lateral gene transfer in recent evolutionary time and which contribute to the mosaic architectures of phage genomes. Because of the prominent role of horizontal genetic exchange 2, this clustering does not represent a phylogenetic or taxonomic grouping but rather provides a framework for reflecting their overall genome relationships and for identifying genes that have been recently exchanged and their genomic context. Clustering does not substitute for a reticulate taxonomy, which more accurately describes their global relationships. 22; 23
We have used four approaches to assort the 60 genomes into clusters according to their relatedness: dotplot comparison of all genomes with each other, pairwise average nucleotide identities, pairwise genome map comparisons, and gene content analysis.
Genome clustering: Dotplot analyses
The primary criterion we have chosen for placing two genomes in the same cluster is that they show evident sequence similarity in a dotplot that spans more than 50% of the smaller of the two genomes (Fig. 2A). This generates nine clusters (Clusters A-I) that incorporate 55 of the 60 genomes; five phages (TM4, Wildcat, Giles, Omega and Corndog) are not closely related to any of the other phage genomes by this comparison and are included in a single category of singleton genomes (Table 2). The dotplot analysis shown in Figure 2A reveals that even the relationships within a cluster are often non-uniform, and we have further subdivided five clusters (A, B, C, F, H) into a total of 12 subclusters; the total number of groupings (clusters and subclusters, including each of the five singleton genomes) is twenty-one (Table 2), a reflection of the overall high degree of diversity of these phages. The additional analyses below support these cluster/subcluster assignments.
Figure 2. Nucleotide sequence comparisons of mycobacteriophage genomes.

A. Dotplot of all 60 sequenced mycobacteriophage genomes displayed using Gepard. 64 Individual genome sequences were concatenated into a single sequence arranged such that related genomes were adjacent to each other. The assignment of Clusters and Subclusters are shown at the top. B. Dotplot of Omega and Tweety showing a segment of ∼6.5kbp that is very similar. Omega and Tweety have not been grouped in the same Cluster, because the similarity does not span >50% of the genomes. C. Dotplot analysis of Cluster H genomes. Predator and Konstantine are more closely related to each other than to Barnyard or other phages and constitute subcluster H1. Barnyard (subcluster H 2) is included within the H cluster because its similarity to other cluster H spans more than 50% of the genome even though its relationship to Konstantine and Predator is weak. D. Dotplot of Konstantine (subcluster H 1) and PBI1 (Cluster D) showing a weak relationship that does not warrant inclusion in the same cluster.
Table 2.
Assignment of mycobacteriophage genomes into clusters and subclusters
| A | B | C | D | E | F | G | H | I | Singletons |
|---|---|---|---|---|---|---|---|---|---|
| A1 | B1 | C1 | F1 | H1 | |||||
| Bxb1 | Chah | Bxz1 | PBI1 | Cjw1 | Che8 | Halo | Predator | Che9c | Corndog |
| Bethlehem | Orion | Catera | Plot | 244 | PMC | BPs | Konstantine | Brujita | Omega |
| U2 | PG1 | Cali | Adjutor | Kostya | Llij | TM4 | |||
| DD5 | Rizal | Butterscotch | Porky | Boomer | H2 | Wildcat | |||
| Jasper | B2 | ScottMcG | Gumball | Fruitloop | Barnyard | Giles | |||
| KBG | Rosebush | Spud | Troll4 | Pacc40 | |||||
| Lockley | Qyrzula | Ramsey | |||||||
| Solon | C2 | Tweety | |||||||
| B3 | Myrna | ||||||||
| A2 | Pipefish | F2 | |||||||
| D29 | Phaedrus | Che9d | |||||||
| L5 | |||||||||
| Bxz2 | B4 | ||||||||
| Che12 | Cooper | ||||||||
| Pukovnik | Nigel | ||||||||
Phages are color-coded according to their order of isolation as follows:
 sequenced mycobacteriophage genomes
 sequenced mycobacteriophage genomes
 sequenced mycobacteriophage genomes
Genome clustering: Average Nucleotide Identities
The second clustering approach we have used is comparison of average nucleotide identities (ANI) (Table 3), and this agrees well with the dotplot analyses. First, it should be noted that genomes that are not clustered together in the dotplot analyses exhibit ANI values in the range of 53-59% (a complete set of all 3,600 ANI values is shown in Table S4), with these relatively high values reflecting in part the high GC% content (Table 1). In contrast, intra-subcluster values can be as high as 99.8% (Table 3), although the ANI values vary greatly for different clusters and subclusters.
Table 3.
Average Nucleotide Sequence Identities (ANI) shared by mycobacteriophages.
| Cluster A | |||||||||||||
|---|---|---|---|---|---|---|---|---|---|---|---|---|---|
| Bethlehem | Bxb1 | DD5 | Jasper | KBG | Lockley | U2 | Solon | Che12 | D29 | L5 | Pukovnik | Bxz2 | |
| Bethlehem | 100 | 89.4 | 92.6 | 90.7 | 93.8 | 92.4 | 94.5 | 94.4 | 61.9 | 61.6 | 61.2 | 61.5 | 63.1 |
| Bxb1 | 100 | 88.5 | 86.4 | 88.9 | 89.0 | 89.7 | 90.7 | 63.7 | 63.0 | 62.8 | 62.8 | 64.6 | |
| DD5 | 100 | 91.8 | 91.8 | 91.1 | 92.5 | 93.0 | 61.5 | 61.4 | 61.4 | 61.6 | 63.1 | ||
| Jasper | 100 | 88.6 | 92.2 | 90.2 | 90.7 | 61.9 | 61.5 | 61.0 | 61.8 | 62.6 | |||
| KBG | 100 | 91.3 | 93.4 | 93.8 | 62.5 | 61.5 | 61.5 | 61.1 | 63.7 | ||||
| Lockley | 100 | 92.2 | 92.5 | 61.9 | 61.5 | 61.5 | 61.5 | 62.9 | |||||
| U2 | 100 | 93.1 | 61.8 | 61.6 | 62.1 | 61.6 | 63.5 | ||||||
| Solon | 100 | 62.4 | 62.0 | 62.1 | 61.7 | 63.3 | |||||||
| Che12 | 100 | 79.4 | 81.3 | 75.1 | 67.3 | ||||||||
| D29 | 100 | 94.4 | 76.0 | 67.8 | |||||||||
| L5 | 100 | 75.6 | 67.5 | ||||||||||
| Pukovnik | 100 | 67.3 | |||||||||||
| Bxz2 | 100 | ||||||||||||
| Cluster B | |||||||||
|---|---|---|---|---|---|---|---|---|---|
| Chah | Orion | PG1 | Qyrzula | Rosebush | Phaedrus | Pipefish | Cooper | Nigel | |
| Chah | 100 | 99.7 | 99.6 | 62.3 | 64.3 | 62.7 | 62.6 | 67.2 | 66.5 |
| Orion | 100 | 99.8 | 62.2 | 64.3 | 62.8 | 62.6 | 66.8 | 66.4 | |
| PG1 | 100 | 62.1 | 64.3 | 62.6 | 62.5 | 66.7 | 66.3 | ||
| Qyrzula | 100 | 97.9 | 65.3 | 65.5 | 65.1 | 64.6 | |||
| Rosebush | 100 | 64.7 | 64.7 | 65.2 | 64.5 | ||||
| Phaedrus | 100 | 96.6 | 63.1 | 62.7 | |||||
| Pipefish | 100 | 63.3 | 62.8 | ||||||
| Cooper | 100 | 87.2 | |||||||
| Nigel | 100 | ||||||||
| Cluster C | |||||||
|---|---|---|---|---|---|---|---|
| Bxz1 | Cali | Catera | Rizal | ScottMcG | Spud | Myrna | |
| Bxz1 | 100 | 98.2 | 98.2 | 98.9 | 98.2 | 98.8 | 66.6 |
| Cali | 100 | 98.3 | 98.8 | 98.1 | 98.4 | 66.6 | |
| Catera | 100 | 99.2 | 99.2 | 98.9 | 66.5 | ||
| Rizal | 100 | 98.7 | 99.2 | 66.7 | |||
| ScottMcG | 100 | 99.2 | 66.7 | ||||
| Spud | 100 | 66.8 | |||||
| Myrna | 100 | ||||||
| Cluster D | ||||||
|---|---|---|---|---|---|---|
| Adjutor | PBI1 | PLot | Butterscotch | Troll4 | Gumball | |
| Adjutor | 100 | 99.9 | 98.2 | 99.5 | 98.5 | 98.1 |
| PBI1 | 100 | 98.3 | 99.5 | 98.6 | 98.1 | |
| Plot | 100 | 98.4 | 98.0 | 97.6 | ||
| Butterscotch | 100 | 98.7 | 98.0 | |||
| Troll4 | 100 | 97.6 | ||||
| Gumball | 100 | |||||
| Cluster E | ||||
|---|---|---|---|---|
| 244 | Cjw1 | Kostya | Porky | |
| 244 | 100 | 98.7 | 95.0 | 98.1 |
| Cjw1 | 100 | 95.0 | 97.9 | |
| Kostya | 100 | 95.1 | ||
| Porky | 100 | |||
| Cluster F | |||||||||
|---|---|---|---|---|---|---|---|---|---|
| Boomer | PMC | Llij | Che8 | Tweety | Fruitloop | Ramsey | Pacc40 | Che9d | |
| Boomer | 100 | 94.2 | 90.4 | 85.2 | 87.1 | 86.7 | 91.0 | 88.6 | 71.2 |
| PMC | 100 | 97.6 | 88.3 | 90.2 | 89.6 | 90.4 | 92.8 | 71.6 | |
| Llij | 100 | 88.0 | 89.5 | 89.3 | 88.9 | 91.4 | 68.5 | ||
| Che8 | 100 | 85.4 | 83.1 | 86.5 | 88.0 | 78.2 | |||
| Tweety | 100 | 94.1 | 88.8 | 88.8 | 68.0 | ||||
| Fruitloop | 100 | 87.6 | 87.8 | 65.9 | |||||
| Ramsey | 100 | 90.0 | 71.8 | ||||||
| Pacc40 | 100 | 73.7 | |||||||
| Che9d | 100 | ||||||||
| Cluster G | ||
|---|---|---|
| BPs | Halo | |
| BPs | 100 | 99.0 |
| Halo | 100 | |
| Cluster H | |||
|---|---|---|---|
| Predator | Konstantine | Barnyard | |
| Predator | 100 | 73.4 | 57.9 |
| Konstantine | 100 | 58.4 | |
| Barnyard | 100 | ||
| Cluster I | ||
|---|---|---|
| Che9c | Brujita | |
| Che9c | 100 | 76.8 |
| Brujita | 100 | |
| Singletons | |||||
|---|---|---|---|---|---|
| Corndog | Giles | TM4 | Wildcat | Omega | |
| Corndog | 100 | 57.1 | 59.0 | 55.5 | 57.0 |
| Giles | 100 | 58.4 | 53.9 | 54.7 | |
| TM4 | 100 | 55.6 | 56.9 | ||
| Wildcat | 100 | 53.7 | |||
| Omega | 100 | ||||
Subcluster A1; Yellow. Subcluster A2; Turquoise
Average Nucleotide Identity determined by DNA Master Genome Comparison function.
Subcluster B1: Red. Subcluster B2: Purple. Subcluster B3: Green. Subcluster B4: Yellow
Subcluster C1: Green. Subcluster C2: Purple
Subcluster F1: Turquoise. Subcluster F2: Yellow
Subcluster H1: Yellow. Subcluster H2: Red
Average Nucleotide Identities determined by DNA Master Genome Comparison function.
In Cluster A, eight of the genomes (Bethlehem, Bxb1, DD5, Jasper, KBG, Lockley, U2 and Solon) have pairwise ANI values between 88.5% and 94.5%, and four of the genomes (Che12, D29, L5, and Pukonvik) share ANI values between 75.1% and 94.4%. However, none of the pairwise ANI of genomes across the two groups exceed 63.7% ANI, and these values thus support the division of cluster A into at least two subclusters (A1 and A2). The positioning of Bxz2 in subcluster A2 represents a conundrum; it shares higher ANI values for the A2 cluster (67.3 – 67.8%) than for the A1 phages (62.6 – 64.6%), and all of these are substantially lower than the pairwise ANI values among Che12, D29, L5 and Pukovnik (75.1 – 94.4%). Bxz2 could conceivably be placed into a third subcluster, but we have currently placed it within the A2 subcluster to which it is most closely related. This situation is a good illustration of the somewhat arbitrary nature of this clustering process; it usefully reflects the fact that some genomes are close relatives of others, but clustering is an imperfect process with the boundaries between groups of phages being ill-defined because of the prominent role of horizontal genetic exchange in phage genome evolution.
The use of ANI values also introduces additional complexities. For example, although the singleton Omega genome is not closely related to other mycobacteriophages, it shares a 6.1-8.3 kbp segment that is very closely related (95% identical to Tweety) with the Cluster F genomes (Fig. 2B) and clearly represents a relatively recent exchange event. As a consequence, the overall ANI values between Omega and the Cluster F genomes are fairly high (65.6-74.3%) even though they do not fulfill the criterion of sharing evident sequence similarity spanning 50% of the genomes. Next, although Predator and Konstantine (subcluster H1) are closely related and share 73.4% ANI, Barnyard (subcluster H2) shares only 57.9% and 58.4% ANI with Predator and Konstantine (subcluster H1) respectively (Fig. 2C). These values are within the range observed for unrelated genomes (Table S4), but the inclusion of Barnyard in cluster H is justified by dotplot analysis (Fig. 2C) showing that, although the relationship to Konstantine and Predator is weak, it spans >50% of the genomes. In contrast, while Konstantine has a similar ANI value to Cluster D phages (57.0% with PBI1), the dotplot relationship is extremely weak (Fig. 2D).
Genome clustering: Gene content analysis
A third approach to genome clustering is a gene content analysis based on scoring whether the genomes contain a member of each of the protein phamilies and representing them using the program Splitstree as described previously 16 (Fig. 3). The resulting pattern is in good agreement with the analyses from dotplot and ANI comparisons and supports the overall cluster and subcluster groupings (Table 2). The subdivision of clusters A, B, C, and F is clearly delineated, and the more distant relationships between cluster D, H1 and H2 described above are further substantiated. We note further that while Bxz1, Spud, Catera, Rizal, Cali, ScottMcG and Myrna warrant being in the same cluster (C), Myrna (cluster C2) is a distant relative of the C1 phages.
Figure 3. Splitstree representation of mycobacteriophage relationships.

All 6,858 mycobacteriophage predicted protein products were assorted into 1,523 phamilies according to shared sequence similarities. Each genome was then assigned a value reflecting the presence or absence of a pham member, and the genomes compared and displayed using Splitstree67. The clusters and subclusters derived from dotplot analyses are annotated. The scale bar indicates 0.01 substitutions/site.
Genome clustering: Pairwise genome analyses
The fourth approach to representing the genome relationships of clusters is pairwise alignment and correlation of regions of genome similarity with gene location (Fig. 4). This is especially useful for displaying segments of similarity between more distantly related genomes, as well as revealing departures among more closely related genomes. For example, the subclustering of the cluster B genomes is clearly illustrated, and the locations of genome differences within each subcluster are delineated (Fig. 4). In addition, one example of a relatively recent exchange of genes between one subcluster (B1; PG1 genes 33-35) and another (B2; Rosebush genes 33-35) is evident. Overall, these comparisons show the closeness of relationships within Clusters C1, D, E and G, as well the relatively weaker ones within Clusters F, H, I. The obvious disadvantage of this approach is that the presentation is limited to pairwise display comparisons, and thus only a subset of the interesting and complex relationships between phages such as in cluster F can be shown in a single representation (Fig. 4).
Figure 4. Pairwise alignment of clustered mycobacteriophages genomes.


Each of the mycobacteriophage genome clusters are displayed showing segments of nucleotide sequence similarity between adjacently displayed genomes. The strength of the relationship is represented by shading according to the color spectrum, with purple being the highest. The order of the genomes displayed within each subcluster is as follows: A1: Bethlehem, U2, DD5, Jasper, KBG, Lockley, Solon, Bxb1; A2: Bxz2, Che12, L5, D29, Pukovnik; B1: Chah, Orion, PG1; B2: Rosebush, Qyrzula; B3, Phaedrus, Pipefish; B4: Nigel, Cooper; C1: Bxz1, Cali, Catera, Rizal, Spud, ScottMcG; C2: Myrna; D: Adjutor, Butterscotch, PBI1, Plot, Gumball, Troll4; E: Cjw1, 244, Porky, Kostya; F1: Ramsey, Pacc40, Fruitloop, PMC, Boomer, Llij, Tweety, Che8; F2: Che9d; G: BPs, Halo; H1: Predator, Konstantine; H2: Barnyard; I: Che9c, Brujita; Singletons: TM4, Giles, Wildcat, Corndog, Omega. Detailed maps of individual genomes are shown in Fig. S1.
Revision of prior genome cluster designations
The specific cluster designations closely reflect those reported previously based on the comparative analysis of 30 of these genomes. 16 One notable departure occurs in Cluster F, which previously included only PMC and Llij, but did not include Che8 or Che9d. The methods described here all justify inclusion of both Che8 and Che9d in Cluster F, although Che9d is clearly a more distant relative than the other Cluster F phages, justifying its placement into a separate subcluster (F2) (Fig. 4; Table 3). Cluster F is one of the more diverse groups in this set and the combination of methods described here offers greater reliability in the cluster assignments.
Seven other phages (Barnyard, Corndog, Che9c, Halo, Omega, TM4, and Wildcat were previously classified as singletons, and Corndog, Omega, TM4 and Wildcat remain in this category even though the number of sequenced genomes has doubled. Clustering relatives of Barnyard (Konstantine, Predator) and Che9c (Brujita) have now been identified, and we presume that increased sampling will eventually identify relatives of all the currently singleton genomes. A notation of the representation of cluster members at different stages in their discovery is summarized in Table 2.
Cluster diversity
The pairwise ANI values show that some clusters are much more diverse than others. To quantify the extent of diversity within clusters and subclusters, we have determined the proportion of cluster-universal phams – those phams represented in a cluster/subcluster that are present in all of the constituent genomes in that cluster/subcluster (blue bars, Fig. 5A). This value ranges from cluster G in which 98% of the phams are present in both of the constituent genomes, to the F1 subcluster, in which only 25% of phams are shared (Fig. 5A). Clusters/subclusters A1, I, A2 and F1 each share fewer than 50% of all phams (48%, 38%, 30% and 25% respectively), while B1, B2, B4, D, B3, C1, E and H1 all have values greater than 50% (97%, 92%, 88%, 84%, 84%, 78%, 70% and 69% respectively) (Fig. 5A). A rank ordering of the clusters/subclusters (containing two or more genomes, from least to most diverse) is thus G>B1>B2>B4>B3>D>C1>E>H2>A1>I>A2>F1.
Figure 5. Cluster diversity and inter-cluster relationships.


A. Distribution of cluster-universal, cluster-unique, and cluster-identifier phams. Cluster-universal phams (blue bars) are defined as those that are present within all genome members within a cluster or subcluster (as shown below the x-axis with the numbers of genomes), and their proportion of the total number of phams in that cluster or subcluster is shown as a percentage. Cluster-unique phams (red bars) are defined as those that are present within that cluster or subcluster and are not present in other mycobacteriophages, and their proportion of the total number of phams in that cluster or subcluster is shown as a percentage. Cluster -identifier phams (yellow bars) are defined as those that are found in all genomes within a cluster or subcluster, but absent from all other mycobacteriophages.
B. Some phams are present in only one genome within a cluster/subcluster, and these are candidates for being acquired relatively recently by horizontal genetic exchange. A subset of these has one or more relatives in other cluster/subcluster genomes as illustrated for the four subclusters (A1, A2, C1 and F1) that contain at least five genome members (see Table 2). Along the x-axis each of the phams (grouped by the subcluster containing just the single member) is shown, with bars above indicating which other genomes contain homologues and to which cluster they belong. The sixty genomes are listed vertically and arranged into clusters as shown on the right. The locations of the relatives of these putative newly acquired genes are distributed among the mycobacteriophages genomes suggesting that they have been acquired from multiple sources and not from any single prominent genome cluster. It is noteworthy that no relatives are seen in Cluster G, and Cluster D only has relatives for the Pham992 member present in one A2 cluster member (D29). Gene members of each Pham and their specific genome and cluster locations are listed in Table S2.
C. Average protein size of phams distributed in different numbers of genomes within clusters/subclusters A1, A2, C1, D and F1. For each pham, the average protein length (in amino acid residues) is plotted as a function of how many genomes the pham is present in. The total number of genomes within each cluster/subcluster is shown in parentheses. The average length of all mycobacteriophage predicted proteins is shown by the horizontal bar. Note that phams present in only a subset of the cluster genomes are substantially smaller, with the exception of one category in Cluster F1. However, there is only a single gene member in this category.
The pairwise comparison maps (Fig. 4) provide information about the distribution of intra-cluster diversity within the genomes. In the highly diverse cluster F1, for example, it is evident that the diversity is not uniform throughout the genomes, with the leftmost regions containing the virion structure and assembly genes being better conserved than the rightmost genomic segments (Fig. 4). This reflects previous studies describing strong conservation of the order of virion structure and assembly genes in the Siphoviridae and the paucity of horizontal exchange within the groups of structural genes. This has been ascribed to their co-evolution resulting from close interaction of the protein products. 29 In contrast, the units contributing to the mosaic architecture of the non-structural genes are commonly just single genes. 2 Other examples for which the virion structure and assembly genes are more highly conserved than the non-structural genes are provided in clusters/subclusters A1, A2, B4, I. It is noteworthy that the extent of cluster diversity does not simply reflect the number of genomes present. For example the six genomes in cluster D share 84% of the total phams, while the five genomes of cluster A2 share only 30% (Fig. 5A).
Inter-Cluster relationships
An alternative perspective on cluster relationships is provided by considering not just which phams are common to all cluster members, but also the proportion of phams that are cluster-unique – those present only within one cluster or subcluster and not present in other mycobacteriophages. For example, in clusters D and E – both of which have modest diversity levels (83% and 70% of phams present in all genome constituents, respectively) – 50% of the total phams represented are cluster-unique and not found in other mycobacteriophage genomes (red bars, Fig. 5A). In general, all of the cluster/subcluster groups contain a minimum of 20% of total phams that are specific to that cluster/subcluster, and no obvious relationship appears between cluster diversity and the proportion of cluster-specific phams.
In each cluster/subcluster, there are subsets of phams that are cluster-identifiers – those phams that are present in all genomes within a cluster and are not found elsewhere (yellow bars, Fig. 5A). In some subclusters, such as A1, A2 and F1, these are quite rare (<6%), in part reflecting the relatively high diversity of those subclusters. In contrast, 40% of the total phams in clusters D and G are cluster-identifiers.
Identification and characterization of newly acquired genes
A principal feature of genome clustering described above is that it facilitates the identification and characterization of those genes that are most likely to have been exchanged horizontally in their relatively recent evolutionary history. While each cluster contains a number of phams that are present in all cluster members as discussed above (Fig. 5A), the remaining phams are present in only a subset of the genomes. These correspond to genes that are in greatest evolutionary flux. The lack of full representation could result from loss of a gene from one or more genomes, or alternatively from recent acquisition by horizontal genetic exchange. While both explanations could account for phams that are present in only one genome, these are strong candidates for recent acquisition events.
A subset of the phams that are present in only a single member genome of a cluster/subcluster also have one or more pham members in other cluster/subclusters. We have examined these more closely to explore whether there are patterns of exchange that might reveal the origins of these genes (Fig. 5B). Interestingly, the genomes and clusters containing related phamily members are broadly represented, supporting the idea that all of these genomes have been in genetic communication, albeit in more distant evolutionary history. For example, the 23 phams represented by a single gene within cluster F1 have relatives within most of the other cluster/subcluster and singleton genomes (Fig. 5B). However, we note that although about one half of the 17 phams represented by a single gene in subcluster A2 are also found in subcluster A1, but only one of the 7 Phams of this type present in one of the A1 genomes is also present in the A2 cluster (Fig. 5B). Furthermore Clusters G and D are notably underrepresented in that there are no relatives of any of the genes in this classification in the cluster G genomes, and Cluster D contains relatives of just one of the phams, Pham992 (Fig. 5B). Genomes in these clusters might thus enjoy a higher degree of isolation than other mycobacteriophages, perhaps as a result of host specificity or geographical or environmental influences.
It was reported previously that genes within the SPO1 family of phage genomes that are not related to other members are in general smaller than those that are, with the implication that genes that are moving between genomes on a rapid time scale are small. 30 The clustering of mycobacteriophage genomes enables us to extend this type of analysis to multiple genome sets. Specifically, we have grouped phams within clusters/subclusters according to their extent of representation within that cluster or subcluster – i.e. whether they are present in all or just a subset of genomes within that cluster/subcluster – and determined their average lengths (Fig. 5C). This analysis shows that phams that are present in all members of a cluster/subcluster are at or close to the average number of codons for all 1,523 genes (205 codons), but phams represented in a subset of the cluster genomes are substantially smaller (Fig. 5C). This is certainly true of phams represented in only a single genome within a cluster, and thus more likely to have been acquired by recent horizontal genetic exchange, but this is also observed for all phams not present in all cluster genomes. This is consistent with the hypothesis that all genes active in genetic flux – both loss from a genome as well as acquisition – are smaller than the average gene. Furthermore, the size differences are substantial, with the sub-represented phams being generally at least 25% smaller than the average of those represented in all cluster/subcluster members (Fig. 5C).
Genomic architectural features of mycobacteriophage clusters
The grouping of genomes into clusters enables simpler representations of overall genome architectural features. First, the Cluster C virions all have myoviral morphotypes, relatively large capsids, and longer genomes (Table 1). The C1 subcluster genomes are extremely similar to each other with greater than 98% pairwise ANI values (Table 3), and yet the single C2 subcluster phage, Myrna, is clearly a distant relative. A plausible explanation is that Myrna only relatively recently acquired the ability to infect M. smegmatis, and it remains to be seen if other C cluster genomes that are distinct from the C1 subcluster are isolated in the future. The virion structural genes are not well defined in any of the C cluster phages, but they do not appear to enjoy the tight linkage and synteny seen with siphoviral virion structure genes. Furthermore, it is not obvious from the pairwise map representations that structural genes are better conserved between the C1 and C2 genomes than the non-structural genes.
All of the other 53 mycobacteriophages have siphoviral morphotypes, and the virion structure and assembly genes are arranged in the highly conserved arrangements found in all such phages. One of the most obvious components is the tapemeasure gene, typically readily identifiable as the longest gene in the genome, reflecting the relatively long phage tails (Table S1). While there is strong synteny of the structural genes, the sequence diversity is high, and mosaic relationships are evident. For example, when the pham assignments are presented along with their putative functional roles, the use of different functional cassettes is evident (Table 4). There are, for example, as many as ten different phams/subphams encoding putative capsid subunits, even though viral capsid proteins – including HK97, T4, P22, φ29 and Herpes Virus share a common fold. 31; 32; 33; 34; 35; 36 There are also seven different phams encoding major tail subunit genes, and there is little or no correspondence between the particular capsid and MTS phams in each cluster/subcluster (Table 4). The diversity among putative large terminase subunits is not so great, with only three phams used (Phams2, 394, and 891) (Table 4), and there is a good correlation between the Pham distribution and the types of genome ends as noted previously. 37 For example, all of the genomes encoding members of Pham394 and Pham891 have terminally redundant ends, while most members of Pham 2 have defined cohesive ends. The exceptions to this are the genes encoded by the terminally redundant Cluster C genomes, which only assemble into Pham 2 because some members (Catera, Rizal, ScottMcG and Spud) contain an intein that is also present in Omega gp11, Kostya gp9, and Cjw1 gp8. The Cluster C Pham2 extein sequences are not, however, related to terminases. A phylogenetic reconstruction of the mycobacteriophage terminases is shown in Figure 6. Finally, we note that there are six different phams encoding portal proteins (Table 4) and like the MTS phams, these do not correlate closely within cluster/subclusters with the capsid subunits. It has been noted previously that the genes encoding the DNA packaging system (terminase and portal) are among the best conserved of the tailed-phage encoded proteins, 11 and it is therefore notable that such extensive variation is seen within these mycobacteriophage genomes.
Table 4.
Pham assignments of virion structure and assembly genes in mycobacteriophage clusters.
| Cluster | Small Ter | Large Ter | Portal | Protease | Scaffold | Capsid | MTS | ‘G’ | ‘T’ | Tmp |
|---|---|---|---|---|---|---|---|---|---|---|
| Cluster A | Pham2 | Pham3 | Pham1433 | Pham5 | Pham1406-1 | Pham1406-2 | Pham12-1 | Pham12-2 | Pham13 | |
| Cluster B | Pham931 | Pham394 | Pham347 | ? | Pham1406-18 | Pham1406-19 | ?? | ?? | Pham13 | |
| Cluster C1 | Pham13 | |||||||||
| C2 | Pham511 | Pham13 | ||||||||
| Cluster D | Pham891 | Pham901 | Pham857 | Pham862? | Pham86-1 | Pham1439 | Pham1440 | Pham13 | ||
| Cluster E | Pham209 | Pham2 | Pham147 | ? | Pham164 | Pham86-2 | Pham2330-1 | Pham2330-2 | Pham13 | |
| Cluster F1 - B&R* | Pham512 | Pham2 | Pham3 | Pham1433 | Pham1517 | Pham1406-1 | Pham86-2 | Pham2330-1 | Pham2330-3 | Pham13 |
| - Others^ | Pham74 | Pham2 | Pham3 | Pham100 | Pham1517 | Pham118 | Pham86-2 | Pham2330-1 | Pham2330-3 | Pham13 |
| Cluster F2 | Pham512 | Pham2 | Pham3 | Pham1433 | Pham1517 | Pham1406-1 | Pham509 | Pham510 | Pham511 | Pham13 |
| Cluster G | Pham456 | Pham2 | Pham3 | Pham1433 | Pham1517 | Pham1406-1 | Pham509 | Pham1429-1 | Pham1429-2 | Pham13 |
| Cluster H | Pham891 | Pham901 | Pham857 | Pham862? | Pham86-1 | Pham1439 | Pham1440 | Pham13 | ||
| Cluster I - Che9c | Pham294 | Pham2 | Pham147 | Pham315 | Pham322 | Pham86-2 | Pham2330-1 | Pham2330-5 | Pham13 | |
| Cluster I - Brujita | Pham74 | Pham2 | Pham147 | Pham315 | Pham322 | Pham86-2 | Pham2330-1 | Pham2330-4 | Pham13 | |
| Corndog | Pham456 | Pham2 | Pham457 | Pham459 | Pham462 | Pham86-2 | Pham2330-1 | Pham2330-3 | Pham13 | |
| Giles | Pham2 | Pham1311 | Pham150 | Pham1326 | ?? | Pham12-2 | Pham13 | |||
| TM4 | Pham456 | Pham2 | Pham3 | Pham1433 | Pham1517 | Pham1406-1 | Pham509 | Pham1429-1 | Pham1429-2 | Pham13 |
| Omega | Pham2 | Pham457 | Pham315 | Pham748 | Pham86-2 | Pham2330-1 | Pham2330-3 | Pham13 | ||
| Wildcat | Pham2 | Pham3 | Pham1216 | Pham1517 | Pham1219-1 | Pham1219-2 | Pham1224? | Pham1225? | Pham13 |
Mycobacteriophages Boomer and Ramsey
Cluster F1 phages other than Boomer and Ramsey
Ter: Terminase; MTS: Major Tail Subunit; Tmp: Tapemeasure protein; ‘G’ and ‘T’ refer to putative analogues of phage
lambda gpG and gpT that are expressed via a programmed translational frameshift.
Figure 6. Phylogenetic relationships of mycobacteriophage terminases.

The protein sequences of all members of Phams 2, 394, and 891 were aligned using ClustalX 68 and the tree represented by Njplot. 69 The members of Phams 2, 394 and 891 are shown in red, green and blue boxes respectively. Cluster designations of individual genomes are shown on the right; singleton phages are notated as Sin. Phage genes corresponding to genomes with defined cohesive termini are shown in bold type and those with terminally redu ndant ends are shown in italic type. Note that the Cluster C phages are only included in Pham 2 because of the presence of an intein that is related to inteins in other Pham 2 members. Bootstrap values are derived from 1000 iterations. Scale bar represents the estimated number of changes per site.
Mycobacteriophage Gene Functions
We noted previously that only 15% of the phams identified in the comparative analysis of 30 mycobacteriophage genomes matched existing database entries. 16 Because of expansion of the extant sequence databases and the increase in the number of mycobacteriophage genomes, we have repeated the database searches. Using the set of 1,523 phams, we found that 287 (18.8%) matched at least one non-mycobacteriophage entry at an E-value greater than 0.001 (Table S2). Forty percent of these match proteins of unknown functions that are annotated as conserved hypotheticals (many of which may be prophage-encoded genes in sequenced bacterial genomes), such that only 11.3% of all 1523 phams currently can be assigned putative functions based on sequence similarity to proteins of known functions. We have identified another 20 phamilies that do not match database entries above the E-value threshold but do match a conserved domain. An additional 21 phams were assigned putative functions according to their positions within structural gene operons.
In view of the high genetic diversity, abundance of genes of unknown function, and mosaic architectures, we re-evaluated the mycobacteriophage genomes for evidence of mobile genetic elements. Recently we described a new class of ultra small elements, Mycobacteriophage Mobile Elements (MPMEs), present in many of the mycobacteriophages, 38 but are completely absent from the host genomes. Likewise, there is a notable absence of any of the transposons identified in mycobacterial genomes in the phage genomes. We note that although mobile elements are not typically associated with phage genomes, there are numerous examples. 19; 29; 39; 40; 41; 42; 43; 44; 45 Analysis of the mycobacteriophage phams revealed two (Phams789 and 1062) that have sequence similarity to putative transposases and likely correspond to additional mobile elements. There are two members of Pham789 (Bethlehem gp71 and Omega gp21) with weak sequence similarity to IS110-like elements, although the ORFs are small (∼250 codons) relative to other IS110 family transposases (∼400aa). Pham1062 has only a single member (Llij gp83) and contains Transposase-2 and Transposase-35 superfamily conserved motifs with strong similarity to members of the large IS200 family; the closest relative is a putative transposase in Nocardia farcinica with which Llij gp83 shares 73% amino acid identity. With only three genes out of a total of 6,858 mycobacteriophages ORFs with identifiable sequence similarity to the multitude of known prokaryotic transposons, this would appear to be a highly under-represented class. A more abundant group of elements are proteins containing HNH homing endonucleases domains, and at least six phams/subphams have these motifs (members of Phams/Subphams453, 154, 1410-24, 1421, 126 and 2292-1) including over 50 genes in total. We note that HNH-containing proteins are common residents of phage genomes including the T-even myoviruses. 46
There are three phams (Pham2, 394, and 1944) in which one or more member contains an intein. Two of these (Pham2 and 394) encode large terminase subunits. Within Pham2, six of the 43 members contain an intein although they are distributed across different clusters [one in A1 (Bethlehem gp2), two in E (Cjw1 gp8, Kostya gp9), two in C1 (Catera gp206, ScottMcG gp208), and one singleton (Omega gp11)]; as noted above, the extein components of the Cluster C Pham2 entries are not terminases (Fig. 6). Only one of the nine members of Pham394 (Pipefish gp6) contains an intein, although it is quite distinct in sequence from any of those in Pham2. Pham1944 includes the recombination directionality factor of Bxb1 (gp47), 47 and three relatives contain inteins (Bethlehem gp51, KBG gp53, U2 gp50); these are grouped into the subpham 1944-1 (Table S3). A related intein is also present in Cali gp3 (Cluster C), which likely encodes a nucleotidyltransferase; similar genes lacking this intein are present in the other Clu ster C genomes and Wildcat gp58; these constitute subpham1944-2 (Table S3). The mycobacteriophage intein profile in general reflects that of the broader phage population (the intein database currently lists 36 phage-encoded inteins; http://www.neb.com/neb/inteins.html) in which phage-encoded inteins are predominantly found in DNA polymerase, ribonucleotide reductase, primase/helicase, thymidylate synthase, and terminase genes. 48 49 50 The Bethlehem gp51 intein has recently been shown to be the prototype member of a new class III group of inteins. 51 Finally, we note that we have yet to identify introns in any of the mycobacteriophage genomes even though there are many examples of introns in bacteriophages of other hosts. 30; 52; 53; 54
Conclusions
The increase in the number of available mycobacteriophage genomes to sixty gives a better understanding of the genetic diversity of the phages that infect M. smegmatis, but it also begins to reveal information about the genetic structure of the population of these phages. The most obvious feature of our sample of the population is its grouping into clusters. The fact that the different methods we used to define the clusters give similar (though not identical) groupings argues that the clusters have a degree of biological reality, but in that context, there is a large number of genes that do not follow the clustering, owing to their horizontal mobility between the clusters, or into one or more of the clusters from outside sources. Thus the clusters, though biologically meaningful, are separated by boundaries that are not very sharply defined and, we suspect, are intrinsically incapable of being sharply defined. This situation is reminiscent of what is seen in phages of enteric hosts, where distinct types (analogous to our clusters) can be recognized (e.g., T4, λ, Mu, T7, P22, etc.), but as more genome sequences are determined the individual types become more diverse, and more examples of horizontal exchange of genes are seen. It is perhaps surprising that we do not see, among the sixty mycobacteriophages, any examples of large scale hybrids of the established clusters, analogous to enteric phages N15 (head and tail genes like phage λ, early genes like a non-integrating plasmid) 55 or SfV (head genes and early genes like lambdoid phage HK97, tail genes like Mu), 22 but we think it is likely that such “hybrids” will be seen as more sequences are determined.
Previously, in grouping 30 sequenced mycobacteriophages, we placed them into six clusters, with nine being singletons. 16 A doubling of the number of sequenced genomes has increased the number of major Clusters to nine, as a result of newly discovered relatives of three genomes that were previously singletons. Furthermore, because no new singletons were discovered this would suggest that most of the major clusters have been identified. Alternatively, the observation that the fraction of protein phamilies that have only one member has decreased only incrementally with a doubling in population size argues that we have only begun to scratch the surface of sequence diversity in these phages.
It is not yet clear to what degree this population of 60 phages – phages that grow on one strain of M. smegmatis and that were mostly isolated from one geographical location – is representative of mycobacteriophages as a whole. Most of the group we examined (37/60) were isolated in the vicinity of Pittsburgh, PA, but the remaining 23 were isolated from India, Japan or nine different states in the US. This latter group all fit into the clusters discussed here, and we are not able to detect any features of their sequences or genome organization that would distinguish them from the Pittsburgh phages. Thus we favor the view that the phage types defined by the clusters have a global distribution, as has been suggested earlier for phage sequences found in four widely separated marine environments. 56 A separate question is how widely the clusters we define here for phages that grow on a particular strain of M. smegmatis are shared with phages that infect other hosts. Of the 60 phages examined here, only those in Cluster A1 and TM4 also efficiently infect M. tuberculosis, 38 arguing that there are some similarities in the kinds of phages that infect these two m ycobacterial species. Somewhat further afield, we have compared the sequences of the 60 mycobacteriophages to some of the sequenced phages of Streptomyces (RWH, GFH & M. Smith, unpublished observations). In pairwise comparisons, we typically find a small number of genes that match weakly between the two phages, but their orders on the genome maps are often not preserved. Mycobacterium and Streptomyces are both members of the actinomycetes, and so are not very distant from each other phylogenetically, but preliminary comparisons suggest that the phages that infect Streptomyces are unlikely to fit into the same clusters as the mycobacterial phages considered here.
The observation that genes in greater genetic flux than the majority of genes are relatively small is consistent with a model in which the majority of horizontal exchange events between phage genomes involve illegitimate recombination events. Because such events require little sequence specificity, most will occur within coding sequences (especially since most of the genome space is protein-coding), and there will be a strong tendency towards acquisition of the smallest independent functional domains. Structural studies suggest that protein domains are commonly as small as 60 residues, 57 in reasonable agreement with our finding that genes with the greatest likelihood of recent acquisition average less than 100 amino acids (Fig. 5C). The finding that the exchange of genes primarily involves small segments corresponding perhaps to a single domain helps to explain a long-standing yet puzzling feature of phage genomes – that the average phage gene size is only about two-thirds that of their bacterial hosts.
Comparative genomics of the T-even phages has identified a number of highly divergent hyperplastic regions (HPRs) that contain large numbers of genes of unknown function but may confer adaptations to the host. 58 These phages have a core of commonly conserved genes with which there are no obvious counterparts in the mycobacteriophages. However, the multitude of small genes – especially those populating the right arms of the siphoviral phages (in all clusters except for cluster C) is reminiscent of the HPR genes, and it seems likely that they share the property of relatively recent acquisition and the functions of host adaptations.
The proposal that phage genomic mosaicism may be mediated by lambda red-like recombinases catalyzing homeologous recombination events raises the question as to what mycobacteriophages encode related enzymes. 15 As reported previously, Che9c gp61 is a RecT-like protein that catalyzes recombination between relatively short DNA segments, 59; 60 and a total of five mycobacteriophage encode related enzymes (Pham324: Che9c gp61, Brujita gp43; Pham1304: BPs gp43, Halo gp43, Giles gp53); an Erf-like protein also is encoded by the singleton Wildcat (gp64). Eleven mycobacteriophages encode RecA-related proteins (Pham161), all within Clusters C and E. Nearly two-thirds of the mycobacteriophages therefore do not have genes encoding identifiable recombinases, and the question arises as to whether there are new classes of these enzymes that remain to be discovered.
Finally, while this genome-wide view of these mycobacteriophage genomes provides a broad look at their comparative relationships and structures, the large number of different genes, the high genetic diversity, and the abundance of genes of unknown functions means that there is a wealth of information in the detailed genome structures that has yet to be analyzed. With the development of tools for functional genomic dissection, 61 the prospects are good for positioning this genomic information in the context of the biology of these bacteriophages.
Materials and Methods
Phage isolation, genome sequencing, and analysis
Phages were isolated from various environmental sources as listed in Table 1. Samples were extracted with phage buffer, plated directly on solid overlays containing 0.35% agar and Mycobacterium smegmatis mc2155, and incubated at 37°C for 24 hrs as described previously. 16 Individual plaques were picked, passaged through several rounds, amplified and purified using a CsCl equilibrium density gradient centrifugation. DNA preparation, genome sequencing, and bioinformatic analysis were performed as previously described. 16
During analysis, two previously reported genome sequences were revised. Mycobacteriophage Wildcat was corrected by removal of 145 nucleotides that was errantly included at one end of the genome; the corrected genome length is 78,296. There are no changes in gene annotation. The reported sequence of Mycobacteriophage Giles contained a 766bp region errantly included at one end of the genome; the revised sequence is 53,746 bp and lacks the previously annotated gene 79. Genbank files for both genomes have been corrected.
Genome annotation used a variety of programs including DNA Master (available from http://cobamide2.bio.pitt.edu/), Genemark, 62 Glimmer, 63 and Gepard. 64 tRNA and tmRNA genes were identified using tRNAscan-SE (with a relaxed Cove cut-off score of 2) and ARAGORN. 65; 66 Table 1 excludes tRNA matches to the attP site of F1 cluster phages and a putative attP site in Che9c. The default Aragorn settings were used for tRNA and tmRNA searches. The program Phamerator (S. Cresawn, M. Bogel, RWH, and GFH, unpublished data) was used to assemble ORFs into phamilies using both a ClustalW cutoff value of 27.5% amino acid identity and BlastP score of 0.0001. An output showing the assignments of ORFs to phamilies is shown in Table S2, along with the summaries of BlastP searches of all phamilies against the Genbank database and putative functional assignments. Twelve phams were identified that contained large numbers of genes, and which upon inspection were complex, and did not all correspond to a single sequence type. This situation typically arose from one or more genes being hybrids, matching two or more genes that are not related to each other. These complex phams were manually deconvoluted using BlastP searches and grouping genes into subphamilies, placing the hybrid genes into a single, randomly designated subp ham.
The Pham number designations differ from those reported previously, 16; 24; 25 reflecting a transition from a manual organization into phamilies into a fully automated system using Phamerator. The Phamerator program is written to maintain the present Pham designations when additional genomes are added to the database. However, some renumbering is unavoidable due to circumstances where genes previously placed in different Phams may be joined into new Phams (SGW, RWH and GFH, unpublished observations).
Electron microscopy was performed by placing a suspension of virion purified through a CsCl gradient on to a sample grid with a carbon-coated nitrocellulose film, staining with 2% uranyl acetate, and examining he grid in a FEI Morgagni 268 transmission electron microscope equipped with an AMT digital camera system.
Accession numbers
Accession numbers for phages are: L5 (Z18946), D29 (AF022214), Bxb1 (AF271693), TM4 (AF068845), Barnyard (AY129339), Bxz1 (AY129337), Bxz2 (AY129332), Che8 (AY129330), Che9c (AY129333), Che9d (AY129336), Corndog (AY129335), Cjw1 (AY129331), Omega (AY129338), Rosebush (AY129334), Catera (DQ398053), Halo (DQ398042), Wildcat (DQ398052), Pipefish (DQ398049), 244 (DQ398041), Cooper (DQ398044), Llij (DQ398045), Orion (DQ398046), PMC (DQ398050), Qyrzula (DQ398048), Bethlehem (AY500153), U2 (AY500152), Che12 (DQ398043), PBI1 (DQ398047), PG1 (AF547430), P-Lot (DQ398051), Adjutor (EU676000), Boomer (EU816590), BPs (EU203571), Brujita, (FJ168659), Butterscotch (FJ168660), Cali (EU826471), Chah (FJ174694), DD5 (EU744252), Fruitloop (FJ174690), Giles (EU203571), Gumball (FJ168661), Jasper (EU744251), KBG (EU744248), Konstantine (FJ174691), Kostya (EU816591), Lockley (EU744249), Myrna (EU826466), Nigel (EU770221), Pacc40 (FJ174692), Phaedrus (EU816589), Porky (EU816588), Predator (EU770222), Pukovnik EU744250), Ramsey (FJ174693), Rizal (EU826467), ScottMcG (EU826469), Solon (EU826470), Spud (EU826468), Troll4 (FJ168662), and Tweety (EF536069).
Supplementary Material
Table S1. Sizes of mycobacteriophage virion capsids and tail lengths.
Table S2. Tabulation of phamilies, genes, and their distributions.
Table S3. Pham deconvolutions. The division of Phams into SubPhams is shown with each Pham on a separate database Tab.
Table S4. Complete set of all 3,600 Average Nucleotide Identities values.
Figure S1. Annotated maps of mycobacteriophage genomes.
Genome maps for each of the sequenced mycobacteriophage genomes were generated by Phamerator and grouped according to cluster. Each gene is represented by a colored box, with colors corresponding to phamilies. The number shown above the box is the Pham designation, and phams that have been deconvoluted into subphamilies show both the numbers of subphamily and phamily members. Gene functions are shown where it is either known or strongly predicted from BlastP searches of Genbank databases.
Figure S2. Electron micrographs of sixty genomically characterized mycobacteriophages. Representative images of each of the sixty mycobacteriophages is shown.
Acknowledgments
We thank Christina Ferreira for superb technical assistance. We also acknowledge the following students and teachers who contributed to genome annotation and analysis: 1) Anand Naranbhai, Melisha Sukkhu (Brujita), Natasha Pillay, Reevanan Naidoo (Gumball), and Fortunate Ndlandla, Karnishree Govender, Mantha Makume (Butterscotch). All were participants in a KwaZulu-Natal Research Institute for TB and HIV (K-RITH) Phage Discovery Workshop (2008) at the Nelson R. Mandela School of Medicine led by GFH, DJS, William R. Jacobs Jr., Michelle Larsen, and A. Wilhelm Sturm, 2) Tom Bogen, Gary Osowick, Greg King (Fruitloop), Rachael Becker, Beth Smyder, Sandy Breitenbach (Pacc40), Sue Glennon, Susan Offner, Carol Seemuller, Sandy Wardell (Ramsey), Kathy VanHoeck, Jen Gordinier, Chris Bogiages, Blair Buck (Solon), Jerry Fuelling, Joan-Beth Gow, Su e Lentz, Bill Welch (Troll4), all participated in a Teacher Phagehunting Workshop (2008) at the University of Pittsburgh, 3) Roger Chambers and Dalton Paluzzi (Lockley) and Chris Lyons and Dan Altman (Adjutor) who participated in the Science Education Alliance Pilot Course (2008) at the University of Pittsburgh, 4) Sam Miake-Lye and Dr. Susan Offner (KBG) at Lexington High School, Lexington MA.
We would also like to thank high school teachers and their classroom phagehunters for isolation of the following phages: 1) Upper St. Clair High School, Pittsburgh, PA (DD5 and Myrna), Greater Latrobe Junior High School, Latrobe, PA (Fruitloop), Lexington High School, Lexington MA (Jasper), Champlin Park High School, Champlin Park, MN (Ramsey), York Community High School, Elmhurst, IL (Solon), and St. Andrew's Episcopal School Rockville, MD (Troll 4). This work was supported in part by a grant to the University of Pittsburgh by the Howard Hughes Medical Institute (HHMI) in support of G.F.H. under HHMI's Professors program. Support was also provided by grants from NIH to R.W.H. (GM51975) and G.F.H. (AI28927).
Footnotes
Publisher's Disclaimer: This is a PDF file of an unedited manuscript that has been accepted for publication. As a service to our customers we are providing this early version of the manuscript. The manuscript will undergo copyediting, typesetting, and review of the resulting proof before it is published in its final citable form. Please note that during the production process errors may be discovered which could affect the content, and all legal disclaimers that apply to the journal pertain.
References
- 1.Hendrix RW. Bacteriophages: evolution of the majority. Theor Popul Biol. 2002;61:471–80. doi: 10.1006/tpbi.2002.1590. [DOI] [PubMed] [Google Scholar]
- 2.Pedulla ML, Ford ME, Houtz JM, Karthikeyan T, Wadsworth C, Lewis JA, Jacobs-Sera D, Falbo J, Gross J, Pannunzio NR, Brucker W, Kumar V, Kandasamy J, Keenan L, Bardarov S, Kriakov J, Lawrence JG, Jacobs WR, Hendrix RW, Hatfull GF. Origins of highly mosaic mycobacteriophage genomes. Cell. 2003;113:171–82. doi: 10.1016/s0092-8674(03)00233-2. [DOI] [PubMed] [Google Scholar]
- 3.Brussow H, Hendrix RW. Phage genomics: small is beautiful. Cell. 2002;108:13–6. doi: 10.1016/s0092-8674(01)00637-7. [DOI] [PubMed] [Google Scholar]
- 4.Hendrix RW. Bacteriophage genomics. Curr Opin Microbiol. 2003;6:506–11. doi: 10.1016/j.mib.2003.09.004. [DOI] [PubMed] [Google Scholar]
- 5.Hatfull GF. Bacteriophage genomics. Curr Opin Microbiol. 2008;11:447–53. doi: 10.1016/j.mib.2008.09.004. [DOI] [PMC free article] [PubMed] [Google Scholar]
- 6.Wilhelm SW, Jeffrey WH, Suttle CA, Mitchell DL. Estimation of biologically damaging UV levels in marine surface waters with DNA and viral dosimeters. Photochem Phot obiol. 2002;76:268–73. doi: 10.1562/0031-8655(2002)076<0268:eobdul>2.0.co;2. [DOI] [PubMed] [Google Scholar]
- 7.Hendrix RW, Hatfull GF, Smith MC. Bacteriophages with tails: chasing their origins and evolution. Res Microbiol. 2003;154:253–7. doi: 10.1016/S0923-2508(03)00068-8. [DOI] [PubMed] [Google Scholar]
- 8.Hendrix RW, Lawrence JG, Hatfull GF, Casjens S. The origins and ongoing evolution of viruses. Trends Microbiol. 2000;8:504–8. doi: 10.1016/s0966-842x(00)01863-1. [DOI] [PubMed] [Google Scholar]
- 9.Casjens SR. Diversity among the tailed-bacteriophages that infect the Enterobacteriaceae. Res Microbiol. 2008;159:340–8. doi: 10.1016/j.resmic.2008.04.005. [DOI] [PMC free article] [PubMed] [Google Scholar]
- 10.Hendrix RW. Jumbo bacteriophages. Curr Top Microbiol Immunol. 2009;328:229–40. doi: 10.1007/978-3-540-68618-7_7. [DOI] [PubMed] [Google Scholar]
- 11.Casjens SR. Comparative genomics and evolution of the tailed-bacteriophages. Curr Opin Microbiol. 2005;8:451–8. doi: 10.1016/j.mib.2005.06.014. [DOI] [PubMed] [Google Scholar]
- 12.Hendrix RW, Smith MC, Burns RN, Ford ME, Hatfull GF. Evolutionary relationships among diverse bacteriophages and prophages: all the world's a phage. Proc Natl Acad Sci U S A. 1999;96:2192–7. doi: 10.1073/pnas.96.5.2192. [DOI] [PMC free article] [PubMed] [Google Scholar]
- 13.Susskind MM, Botstein D. Molecular genetics of bacteriophage P22. Microbiol Rev. 1978;42:385–413. doi: 10.1128/mr.42.2.385-413.1978. [DOI] [PMC free article] [PubMed] [Google Scholar]
- 14.Clark AJ, Inwood W, Cloutier T, Dhillon TS. Nucleotide sequence of coliphage HK620 and the evolution of lambdoid phages. J Mol Biol. 2001;311:657–79. doi: 10.1006/jmbi.2001.4868. [DOI] [PubMed] [Google Scholar]
- 15.Martinsohn JT, Radman M, Petit MA. The lambda red proteins promote efficient recombination between diverged sequences: implications for bacteriophage genome mosaicism. PLoS Genet. 2008;4:e1000065. doi: 10.1371/journal.pgen.1000065. [DOI] [PMC free article] [PubMed] [Google Scholar]
- 16.Hatfull GF, Pedulla ML, Jacobs-Sera D, Cichon PM, Foley A, Ford ME, Gonda RM, Houtz JM, Hryckowian AJ, Kelchner VA, Namburi S, Pajcini KV, Popovich MG, Schleicher DT, Simanek BZ, Smith AL, Zdanowicz GM, Kumar V, Peebles CL, Jacobs WR, Jr, Lawrence JG, Hendrix RW. Exploring the mycobacteriophage metaproteome: phage genomics as an educational platform. PLoS Genet. 2006;2:e92. doi: 10.1371/journal.pgen.0020092. [DOI] [PMC free article] [PubMed] [Google Scholar]
- 17.Lawrence JG, Hendrickson H. Lateral gene transfer: when will adolescence end? Mol Microbiol. 2003;50:739–49. doi: 10.1046/j.1365-2958.2003.03778.x. [DOI] [PubMed] [Google Scholar]
- 18.Kwan T, Liu J, Dubow M, Gros P, Pelletier J. Comparative genomic analysis of 18 Pseudomonas aeruginosa bacteriophages. J Bacteriol. 2006;188:1184–7. doi: 10.1128/JB.188.3.1184-1187.2006. [DOI] [PMC free article] [PubMed] [Google Scholar]
- 19.Kwan T, Liu J, DuBow M, Gros P, Pelletier J. The complete genomes and proteomes of 27 Staphylococcus aureus bacteriophages. Proc Natl Acad Sci U S A. 2005;102:5174–9. doi: 10.1073/pnas.0501140102. [DOI] [PMC free article] [PubMed] [Google Scholar]
- 20.Brussow H. Phages of dairy bacteria. Annu Rev Microbiol. 2001;55:283–303. doi: 10.1146/annurev.micro.55.1.283. [DOI] [PubMed] [Google Scholar]
- 21.Casjens S. Prophages and bacterial genomics: what have we learned so far? Mol Microbiol. 2003;49:277–300. doi: 10.1046/j.1365-2958.2003.03580.x. [DOI] [PubMed] [Google Scholar]
- 22.Lawrence JG, Hatfull GF, Hendrix RW. Imbroglios of viral taxonomy: genetic exchange and failings of phenetic approaches. J Bacteriol. 2002;184:4891–4905. doi: 10.1128/JB.184.17.4891-4905.2002. [DOI] [PMC free article] [PubMed] [Google Scholar]
- 23.Lima-Mendez G, Van Helden J, Toussaint A, Leplae R. Reticulate representation of evolutionary and functional relationships between phage genomes. Mol Biol Evol. 2008;25:762–77. doi: 10.1093/molbev/msn023. [DOI] [PubMed] [Google Scholar]
- 24.Morris P, Marinelli LJ, Jacobs-Sera D, Hendrix RW, Hatfull GF. Genomic characterization of mycobacteriophage Giles: evidence for phage acquisition of host DNA by illegitimate recombination. J Bacteriol. 2008;190:2172–82. doi: 10.1128/JB.01657-07. [DOI] [PMC free article] [PubMed] [Google Scholar]
- 25.Pham TT, Jacobs-Sera D, Pedulla ML, Hendrix RW, Hatfull GF. Comparative genomic analysis of mycobacteriophage Tweety: evolutionary insights and construction of compatible site-specific integration vectors for mycobacteria. Microbiology. 2007;153:2711–23. doi: 10.1099/mic.0.2007/008904-0. [DOI] [PMC free article] [PubMed] [Google Scholar]
- 26.Desplats C, Krisch HM. The diversity and evolution of the T4-type bacteriophages. Res Microbiol. 2003;154:259–67. doi: 10.1016/S0923-2508(03)00069-X. [DOI] [PubMed] [Google Scholar]
- 27.Hatfull GF. Mycobacteriophages. In: Calendar R, editor. The Bacteriophages. Oxford University Press; New York, N Y: 2006. pp. 602–620. [Google Scholar]
- 28.Fraser JS, Yu Z, Maxwell KL, Davidson AR. Ig-like domains on bacteriophages: a tale of promiscuity and deceit. J Mol Biol. 2006;359:496–507. doi: 10.1016/j.jmb.2006.03.043. [DOI] [PubMed] [Google Scholar]
- 29.Juhala RJ, Ford ME, Duda RL, Youlton A, Hatfull GF, Hendrix RW. Genomic sequences of bacteriophages HK97 and HK022: pervasive genetic mosaicism in the lambdoid bacteriophages. J Mol Biol. 2000;299:27–51. doi: 10.1006/jmbi.2000.3729. [DOI] [PubMed] [Google Scholar]
- 30.Stewart CR, Casjens SR, Cresawn SG, Houtz JM, Smith AL, Ford ME, Peebles CL, Hatfull GF, Hendrix RW, Huang WM, Pedulla ML. The genome of Bacillus subtilis bacteriophage SPO1. J Mol Biol. 2009;388:48–70. doi: 10.1016/j.jmb.2009.03.009. [DOI] [PMC free article] [PubMed] [Google Scholar]
- 31.Morais MC, Choi KH, Koti JS, Chipman PR, Anderson DL, Rossmann MG. Conservation of the capsid structure in tailed dsDNA bacteriophages: the pseudoatomic structure of phi29. Mol Cell. 2005;18:149–59. doi: 10.1016/j.molcel.2005.03.013. [DOI] [PubMed] [Google Scholar]
- 32.Wikoff WR, Liljas L, Duda RL, Tsuruta H, Hendrix RW, Johnson JE. Topologically linked protein rings in the bacteriophage HK97 capsid. Science. 2000;289:2129–33. doi: 10.1126/science.289.5487.2129. [DOI] [PubMed] [Google Scholar]
- 33.Fokine A, Leiman PG, Shneider MM, Ahvazi B, Boeshans KM, Steven AC, Black LW, Mesyanzhinov VV, Rossmann MG. Structural and functional similarities between the capsid proteins of bacteriophages T4 and HK97 point to a common ancestry. Proc Natl Acad Sci U S A. 2005;102:7163–8. doi: 10.1073/pnas.0502164102. [DOI] [PMC free article] [PubMed] [Google Scholar]
- 34.Duda RL, Hendrix RW, Huang WM, Conway JF. Shared architecture of bacteriophage SPO1 and herpesvirus capsids. Curr Biol. 2006;16:R11–3. doi: 10.1016/j.cub.2005.12.023. [DOI] [PubMed] [Google Scholar]
- 35.Hendrix RW. The long evolutionary reach of viruses. Curr Biol. 1999;9:914–7. doi: 10.1016/s0960-9822(00)80103-7. [DOI] [PubMed] [Google Scholar]
- 36.Krupovic M, Bamford DH. Does the evolution of viral polymerases reflect the origin and evolution of viruses. Nat Rev Microbiol. 2009;7:250. doi: 10.1038/nrmicro2030-c1. author reply 250. [DOI] [PubMed] [Google Scholar]
- 37.Casjens SR, Gilcrease EB. Determining DNA packaging strategy by analysis of the termini of the chromosomes in tailed-bacteriophage virions. Methods Mol Biol. 2009;502:91–111. doi: 10.1007/978-1-60327-565-1_7. [DOI] [PMC free article] [PubMed] [Google Scholar]
- 38.Sampson T, Broussard GW, Marinelli LJ, Jacobs-Sera D, Ray M, Ko CC, Russell D, Hendrix RW, Hatfull GF. Mycobacteriophages BPs, Angel and Halo: comparative genomics reveals a novel class of ultra-small mobile genetic elements. Microbiology. 2009;155:2962–77. doi: 10.1099/mic.0.030486-0. [DOI] [PMC free article] [PubMed] [Google Scholar]
- 39.Iida S, Meyer J, Arber W. The insertion element IS1 is a natural constituent of coliphage P1 DNA. Plasmid. 1978;1:357–65. doi: 10.1016/0147-619x(78)90051-3. [DOI] [PubMed] [Google Scholar]
- 40.Gertman E, White BN, Berry D, Kropinski AM. IS222, a new insertion element associated with the genome of Pseudomonas aeruginosa. J Bacteriol. 1986;166:1134–6. doi: 10.1128/jb.166.3.1134-1136.1986. [DOI] [PMC free article] [PubMed] [Google Scholar]
- 41.Walter TM, Aronson AI. Transduction of certain genes by an autonomously replicating Bacillus thuringiensis phage. Appl Environ Microbiol. 1991;57:1000–5. doi: 10.1128/aem.57.4.1000-1005.1991. [DOI] [PMC free article] [PubMed] [Google Scholar]
- 42.Woods DE, Jeddeloh JA, Fritz DL, DeShazer D. Burkholderia thailandensis E125 harbors a temperate bacteriophage specific for Burkholderia mallei. J Bacteriol. 2002;184:4003–17. doi: 10.1128/JB.184.14.4003-4017.2002. [DOI] [PMC free article] [PubMed] [Google Scholar]
- 43.Lo TC, Shih TC, Lin CF, Chen HW, Lin TH. Complete genomic sequence of the temperate bacteriophage PhiAT3 isolated from Lactobacillus casei ATCC 393. Virology. 2005;339:42–55. doi: 10.1016/j.virol.2005.05.022. [DOI] [PubMed] [Google Scholar]
- 44.Casjens S, Winn-Stapley DA, Gilcrease EB, Morona R, Kuhlewein C, Chua JE, Manning PA, Inwood W, Clark AJ. The chromosome of Shigella flexneri bacteriophage Sf6: complete nucleotide sequence, genetic mosaicism, and DNA packaging. J Mol Biol. 2004;339:379–94. doi: 10.1016/j.jmb.2004.03.068. [DOI] [PubMed] [Google Scholar]
- 45.Chibani-Chennoufi S, Dillmann ML, Marvin-Guy L, Rami-Shojaei S, Brussow H. Lactobacillus plantarum bacteriophage LP65: a new member of the SPO1-like genus of the family Myoviridae. J Bacteriol. 2004;186:7069–83. doi: 10.1128/JB.186.21.7069-7083.2004. [DOI] [PMC free article] [PubMed] [Google Scholar]
- 46.Nolan JM, Petrov V, Bertrand C, Krisch HM, Karam JD. Genetic diversity among five T4-like bacteriophages. Virol J. 2006;3:30. doi: 10.1186/1743-422X-3-30. [DOI] [PMC free article] [PubMed] [Google Scholar]
- 47.Ghosh P, Wasil LR, Hatfull GF. Control of Phage Bxb1 Excision by a Novel Recombination Directionality Factor. PLoS Biol. 2006;4:e186. doi: 10.1371/journal.pbio.0040186. [DOI] [PMC free article] [PubMed] [Google Scholar]
- 48.Gogarten JP, Senejani AG, Zhaxybayeva O, Olendzenski L, Hilario E. Inteins: structure, function, and evolution. Annu Rev Microbiol. 2002;56:263–87. doi: 10.1146/annurev.micro.56.012302.160741. [DOI] [PubMed] [Google Scholar]
- 49.Lazarevic V, Soldo B, Dusterhoft A, Hilbert H, Mauel C, Karamata D. Introns and intein coding sequence in the ribonucleotide reductase genes of Bacillus subtilis temperate bacteriophage SPbeta. Proc Natl Acad Sci U S A. 1998;95:1692–7. doi: 10.1073/pnas.95.4.1692. [DOI] [PMC free article] [PubMed] [Google Scholar]
- 50.Perler FB. InBase: the Intein Database. Nucleic Acids Res. 2002;30:383–4. doi: 10.1093/nar/30.1.383. [DOI] [PMC free article] [PubMed] [Google Scholar]
- 51.Tori K, Dassa B, Johnson MA, Southworth MW, Brace LE, Ishino Y, Pietrokovski S, Perler FB. Splicing of the Mycobacteriophage Bethlehem DnaB intein: identification of a new mechanistic class of inteins that contain an obligate block F nucleophile. J Biol Chem. 2009 doi: 10.1074/jbc.M109.069567. [DOI] [PMC free article] [PubMed] [Google Scholar]
- 52.Sandegren L, Sjoberg BM. Distribution, sequence homology, and homing of group I introns among T-even-like bacteriophages: evidence for recent transfer of old introns. J Biol Chem. 2004;279:22218–27. doi: 10.1074/jbc.M400929200. [DOI] [PubMed] [Google Scholar]
- 53.Haugen P, Simon DM, Bhattacharya D. The natural history of group I introns. Trends Genet. 2005;21:111–9. doi: 10.1016/j.tig.2004.12.007. [DOI] [PubMed] [Google Scholar]
- 54.Tourasse NJ, Kolsto AB. Survey of group I and group II introns in 29 sequenced genomes of the Bacillus cereus group: insights into their spread and evolution. Nucleic Acids Res. 2008;36:4529–48. doi: 10.1093/nar/gkn372. [DOI] [PMC free article] [PubMed] [Google Scholar]
- 55.Ravin V, Ravin N, Casjens S, Ford ME, Hatfull GF, Hendrix RW. Genomic sequence and analysis of the atypical temperate bacteriophage N15. J Mol Biol. 2000;299:53–73. doi: 10.1006/jmbi.2000.3731. [DOI] [PubMed] [Google Scholar]
- 56.Angly FE, Felts B, Breitbart M, Salamon P, Edwards RA, Carlson C, Chan AM, Haynes M, Kelley S, Liu H, Mahaffy JM, Mueller JE, Nulton J, Olson R, Parsons R, Rayhawk S, Suttle CA, Rohwer F. The marine viromes of four oceanic regions. PLoS Biol. 2006;4:e368. doi: 10.1371/journal.pbio.0040368. [DOI] [PMC free article] [PubMed] [Google Scholar]
- 57.Veretnik S, Bourne PE, Alexandrov NN, Shindyalov IN. Toward consistent assignment of structural domains in proteins. J Mol Biol. 2004;339:647–78. doi: 10.1016/j.jmb.2004.03.053. [DOI] [PubMed] [Google Scholar]
- 58.Comeau AM, Bertrand C, Letarov A, Tetart F, Krisch HM. Modular architecture of the T4 phage superfamily: a conserved core genome and a plastic periphery. Virology. 2007;362:384–96. doi: 10.1016/j.virol.2006.12.031. [DOI] [PubMed] [Google Scholar]
- 59.van Kessel JC, Hatfull GF. Efficient point mutagenesis in mycobacteria using single-stranded DNA recombineering: characterization of antimycobacterial drug targets. Mol Microbiol. 2008;67:1094–107. doi: 10.1111/j.1365-2958.2008.06109.x. [DOI] [PubMed] [Google Scholar]
- 60.van Kessel JC, Hatfull GF. Recombineering in Mycobacterium tuberculosis. Nature Methods. 2007;4:147–52. doi: 10.1038/nmeth996. [DOI] [PubMed] [Google Scholar]
- 61.Marinelli LJ, Piuri M, Swigonova Z, Balachandran A, Oldfield LM, van Kessel JC, Hatfull GF. BRED: a simple and powerful tool for constructing mutant and recombinant bacteriophage genomes. PLoS ONE. 2008;3:e3957. doi: 10.1371/journal.pone.0003957. [DOI] [PMC free article] [PubMed] [Google Scholar]
- 62.Borodovsky M, McIninch J. Recognition of genes in DNA sequence with ambiguities. Biosystems. 1993;30:161–71. doi: 10.1016/0303-2647(93)90068-n. [DOI] [PubMed] [Google Scholar]
- 63.Delcher AL, Harmon D, Kasif S, White O, Salzberg SL. Improved microbial gene identification with GLIMMER. Nucleic Acids Res. 1999;27:4636–41. doi: 10.1093/nar/27.23.4636. [DOI] [PMC free article] [PubMed] [Google Scholar]
- 64.Krumsiek J, Arnold R, Rattei T. Gepard: a rapid and sensitive tool for creating dotplots on genome scale. Bioinformatics. 2007;23:1026–8. doi: 10.1093/bioinformatics/btm039. [DOI] [PubMed] [Google Scholar]
- 65.Lowe TM, Eddy SR. tRNAscan-SE: a program for improved detection of transfer RNA genes in genomic sequence. Nucleic Acids Res. 1997;25:955–64. doi: 10.1093/nar/25.5.955. [DOI] [PMC free article] [PubMed] [Google Scholar]
- 66.Laslett D, Canback B. ARAGORN, a program to detect tRNA genes and tmRNA genes in nucleotide sequences. Nucleic Acids Res. 2004;32:11–6. doi: 10.1093/nar/gkh152. [DOI] [PMC free article] [PubMed] [Google Scholar]
- 67.Huson DH. SplitsTree: analyzing and visualizing evolutionary data. Bioinformatics. 1998;14:68–73. doi: 10.1093/bioinformatics/14.1.68. [DOI] [PubMed] [Google Scholar]
- 68.Larkin MA, Blackshields G, Brown NP, Chenna R, McGettigan PA, McWilliam H, Valentin F, Wallace IM, Wilm A, Lopez R, Thompson JD, Gibson TJ, Higgins DG. Clustal W and Clustal X version 2.0. Bioinformatics. 2007;23:2947–8. doi: 10.1093/bioinformatics/btm404. [DOI] [PubMed] [Google Scholar]
- 69.Perriere G, Gouy M. WWW-query: an on-line retrieval system for biological sequence banks. Biochimie. 1996;78:364–9. doi: 10.1016/0300-9084(96)84768-7. [DOI] [PubMed] [Google Scholar]
Associated Data
This section collects any data citations, data availability statements, or supplementary materials included in this article.
Supplementary Materials
Table S1. Sizes of mycobacteriophage virion capsids and tail lengths.
Table S2. Tabulation of phamilies, genes, and their distributions.
Table S3. Pham deconvolutions. The division of Phams into SubPhams is shown with each Pham on a separate database Tab.
Table S4. Complete set of all 3,600 Average Nucleotide Identities values.
Figure S1. Annotated maps of mycobacteriophage genomes.
Genome maps for each of the sequenced mycobacteriophage genomes were generated by Phamerator and grouped according to cluster. Each gene is represented by a colored box, with colors corresponding to phamilies. The number shown above the box is the Pham designation, and phams that have been deconvoluted into subphamilies show both the numbers of subphamily and phamily members. Gene functions are shown where it is either known or strongly predicted from BlastP searches of Genbank databases.
Figure S2. Electron micrographs of sixty genomically characterized mycobacteriophages. Representative images of each of the sixty mycobacteriophages is shown.