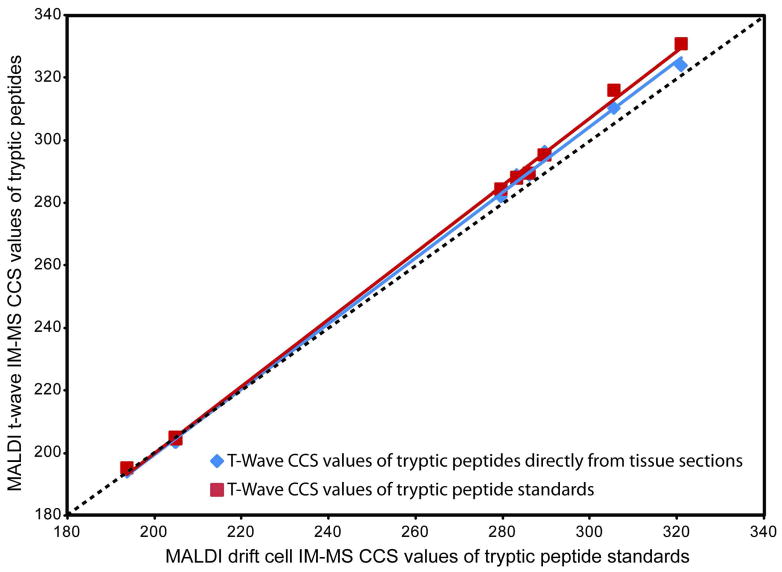
Abstract
Ion mobility-mass spectrometry (IM-MS) provides rapid two-dimensional separations based on analyte apparent surface area or collision cross section (CCS, Å2) and mass-to-charge, respectively. Recently, traveling-wave (t-wave) IM-MS was developed which uses electrodynamic rather than electrostatic fields commonly used in drift cell IM-MS instruments. The underlying theory for obtaining CCS data is well developed for drift cell IM-MS, while strategies for obtaining CCS values from t-wave IM-MS data remains an active area of research. In this report, methods were developed and validated to obtain CCS values of phospholipids and peptides directly from thin tissue sections by MALDI t-wave IM-MS using CCS calibrants measured by MALDI drift cell IM-MS. Importantly, the average percent difference between t-wave and drift cell CCS measurements is minimized by calibrating with the same biomolecular class. Calibrating t-wave phospholipid CCS values with drift cell peptide CCS measurements results in an average percent difference of ca. 7% between the same lipids measured using t-wave and drift cell IM-MS, while this improves to <0.5% when drift cell phospholipid CCS values are used for calibrating t-wave data. A suite of CCS values are reported for lipids and peptides that were determined directly from tissue, i.e. without the need for tissue extraction and further purification steps.
Keywords: ion mobility, ion mobility-mass spectrometry, collision cross section, traveling-wave ion mobility, phospholipids
INTRODUCTION
Ion mobility-mass spectrometry (IM-MS) provides rapid (μs – ms) two-dimensional gas-phase separations based on analyte apparent surface area or collision cross section (CCS, Å2) in the mobility cell and mass-to-charge (m/z) in the MS analyzer, respectively.1–4 By performing an ion mobility separation before MS analysis, isobaric species can be resolved based on structure, and chemical noise can be separated from analytes of interest before entering the MS. These rapid two-dimensional separations are especially applicable for the analysis of complex samples such as human plasma and thin mammalian tissue sections without additional sample preparation or a significant increase in analysis time.5–8 IM-MS also provides qualitative information of biomolecular class based-on preferences in the prevailing intramolecular folding forces, which yields characteristic CCS versus m/z correlations for different classes of molecules.1, 9, 10 For example, phospholipids typically have larger CCS values than peptides of the same m/z and these two molecular classes are easily resolved when analyzing biological samples such as thin animal tissue sections.5, 6, 9
Ion mobility provides the capability to elucidate structural information on the basis of the ion-neutral CCS, which is calculated by measuring the drift time (td) of the ions across the drift cell and using molecular dynamics simulations to interpret structures consistent with the empirical results. Analyte CCS values obtained by IM-MS have provided information on carbohydrate branching,11, 12 peptide secondary structure,13, 14 protein tertiary structure,15, 16 and protein complexes.17–19 Additionally, a recent report has presented a suite of CCS values for biologically relevant phospholipids.10 The structural information provided by IM-MS can be acquired directly from complex samples and can be utilized prior to technologies which provide high structural resolution (e.g. x-ray crystallography and nuclear magnetic resonance) but require large sample amounts of high purity.14, 20–22
While the physical principles behind classical drift cell IM-MS separations are well studied and understood, theory behind the recently developed traveling-wave (t-wave) IM-MS is currently being developed.23 Ion mobility drift cells utilize a static electric field to guide analytes through a neutral gas (He, N2, CO2, Ar, ect.). At a given electrostatic field strength the ion td is inversely proportional to the ion mobility, which in turn is related to an absolute CCS that can be directly calculated. In contrast, t-wave ion mobility consists of a series of stacked ring electrodes where a continuous wave of DC pulses guides ions through the cell.24 Even though t-wave IM-MS is unable to measure CCS values directly from td using the same equations as classical drift cell ion mobility, estimated CCS values can be obtained using calibrants of known CCS values obtained by drift cell IM-MS. Several examples of estimated CCS values have been obtained for protein complexes,19, 25 proteins,26, 27 and peptides28 by t-wave IM-MS using CCS calibrants.
In this report, we discuss estimating peptide and phospholipid CCS values directly from rat brain tissue sections by MALDI t-wave IM-MS. Methods were optimized and validated to use CCS values measured by drift cell IM-MS to calibrate MALDI t-wave IM-MS CCS values. Previously, ESI and DESI ionization sources have been used to estimate CCS values by t-wave IM-MS.19, 26, 28, 29 Here, it is demonstrated that t-wave CCS values of phospholipids are more accurate when calibrated using phospholipid CCS values than when calibrated using peptide CCS values measured by drift cell IM-MS. Additionally, it is demonstrated that estimating phospholipid CCS values using CCS calibrants measured by MALDI drift cell IM-MS provided more accurate values than calibrants measured by ESI drift cell IM-MS. This indicates that for determining accurate t-wave CCS values, calibrants should have similar m/z to CCS correlations (e.g. the same chemical class) instead of only similar CCS values.
EXPERIMENTAL
Materials
Bovine and mouse myelin basic protein (MBP), bovine actin, bovine serum albumin (BSA), buckminsterfullerene (C60), ammonium bicarbonate, 2–5 dihydroxybenzoic acid (DHB), dithiothreitol (DTT), and iodoacetamide (IOA) were purchased from Sigma Chemical Co. (St. Louis, MO) and used without further purification. HPLC grade methanol, trifluoroacetic acid (TFA), reagent grade ethanol, and glacial acetic acid were purchased from Fisher Scientific (Pittsburgh, PA). Bradykinin was purchased from American Peptide (Sunnyvale, CA) and trypsin gold was purchased from Promega (Madison, WI).
Sample preparation
Brains from adult Sprague-Dawley rats were dissected, flash-frozen, and stored at -80°C until analysis. Rat brain tissue was cut into 12 μm coronal sections using a cryostat and thaw-mounted onto gold-coated MALDI targets. The targets were then placed in a desiccator for at least 20 min. To prepare rat brain tissue sections for phospholipids analysis, 500 nl of 40 mg/ml DHB in 50% MeOH and 0.1% TFA was hand-spotted onto the tissue section three consecutive times allowing 5 min between iterations. To prepare rat brain tissue sections for tryptic peptide analysis, a series of ethanol/water wash steps as described by Aerni et al were performed.30 Directly after washing the tissue sections were dried and stored in a vacuum desiccator until application of trypsin solution and matrix which were applied using a procedure described by Groseclose et al.31 Briefly, trypsin was diluted in 200 μl of 50 mM acetic acid to obtain a final concentration of 0.5 μg/μl for the stock solution. A 40 μl aliquot of this stock solution was activated by adding 200 μl of 100 mM ammonium bicarbonate to reach a final trypsin concentration of 0.083 μg/μl at a pH of 8. Selected areas of the tissue sections were spotted three consecutive times with 500 nl of a 0.083 μg/μl trypsin solution using a micropipette, with each spot being allowed to dry between trypsin solution applications. After drying, three drops of 500 nl DHB in 50% MeOH and 0.1% TFA were deposited at the same positions, allowing each spot to dry before the application of consecutive drops.
Measuring CCS by T-Wave IM-MS
The CCS values of phospholipid and peptide species were obtained using a MALDI-IM-TOFMS (SYNAPT HDMS Waters Corporation, Manchester, UK) with MassLynx version 4.1 and calibrated using previously published CCS values measured by linear potential gradient drift cell IM-MS with either a MALDI or ESI ion source.10, 22, 32 The td of phospholipids and tryptic peptides was measured with a mobility pressure of 0.46 mbar N2 using five different linear wave voltages (wave heights) to ensure that separations were preformed under the low-field limit. To determine the CCS of phospholipids, spectra were collected with wave heights of 7.5 to 9.5V in 0.5V steps while wave heights between 10 to 12 V in 0.5V steps were used to acquire spectra of tryptic peptides. Several methods to calibrate CCS values using t-wave IM-MS td values in reference to drift cell IM-MS calibrants have been reported. 19, 29 For this study, a slightly modified procedure reported by Williams et. al. was used. In contrast with using a linear regression for calibrating normalized CCS versus effective drift time, a power curve was used. Briefly, the td and CCS values of calibrants measured by drift cell IM-MS were normalized to charge state (z) and the square root of the reduced mass (μ). The resulting effective drift time (td′) was plotted against the normalized drift cell CCS and fitted to a power curve in the form of y=axb. The T-Wave CCS values are then calculated using the formula:
To determine the CCS values of phospholipids directly from tissue sections using MALDI t-wave IM-MS, either reported CCS values of BSA tryptic peptides ranging from m/z 545 to 1305, or sphingomyelin (SM) and phosphatidylcholine (PC) lipid species from m/z 731 to 896 measured by drift cell IM-MS were used.10, 22, 32 Calibration of phospholipids was performed as an internal standard using endogenous PC and SM measured directly from tissue sections, while BSA peptide CCS values were used as external calibrants. Furthermore, the effects of calibrating MALDI t-wave CCS values using drift cell CCS values measured by both ESI and MALDI are compared. To calibrate CCS values of tryptic peptides directly from tissue sections, reported CCS values of BSA tryptic peptides ranging from m/z 689 to 2045 measured by MALDI drift cell IM-MS were used.22 The precision of CCS values that are reported generally range from 1–4% over repeated measurements on separate days. Although the ion mobility resolution on this platform ranges from 10–15, the peak shapes and positions remain largely unchanged in repeated measurements. While these peaks are potentially an integrated combination of structurally similar isomers that are unresolved at this resolution, the CCS values reported are determined at the apex of the ion mobility peak. Note that at higher ion mobility resolution, the potential separation of additional structural isomers may yield slight differences to the CCS values reported herein.
Phospholipid Identification
Species were identified directly from tissue sections using accurate mass measurement acquired from an FTICR (9.4 T Apex Qe, Bruker Daltonics, Billerica MA) and by performing tandem MS using MALDI-IM-CID-TOFMS equipped with an 8 kHz quadrupole with a parent ion window of 3 Da. Tandem MS of phospholipids was performed using DHB matrix doped with 100 mM LiCl providing fragmentation of the sn1 and sn2 fatty acid tails which has been described elsewhere.33 We report only CCS values of phospholipid species with no overlapping peaks in spectra obtained by MALDI-FTICR so that multiple isobaric species from tissue sections are not measured and reported with a single CCS values.
Tryptic Peptide Sequencing
An accurate mass measurement was obtained of tryptic peptides directly from tissue sections by MALDI-FTICR, and peptide sequencing was performed directly from tissue sections by MS/MS using MALDI-IM-CID-TOFMS. To match peptide sequences to their respective intact proteins, the MS/MS generated spectra were submitted into a MASCOT (Matrix Science, Boston, MS) search engine and run against the NCBI database. The MS/MS spectrum search was performed with a peptide tolerance of ± 0.3 Da and a fragment tolerance of ± 0.5 Da. The search criteria included up to three missed cleavages and variable modifications including lysine acetylation, N-terminus acetylation, C-terminus amidation, and methionine oxidation. Stringent criteria for reported peptide CCS values include: complete sequence coverage by tandem MS, no isobaric species observed by MALDI-FTICR, and multiple peptides must be identified from a single protein.
Peptide Standards
Bovine MBP, mouse MBP, and bovine actin were each dissolved in 100 mM ammonium bicarbonate to a final concentration of 1 mg/ml. DTT was added to a final concentration of 2 mM, and the samples were incubated at 50°C for 15 min. After cooling to room temperature, IOA was added to a final concentration of 20 mM, and the samples were incubated in the dark at room temperature for 15 min. Trypsin was added to a final concentration of 83 ng/μl, and the samples were incubated overnight at 37°C. To stop the reaction, TFA was added until an acidic pH was reached. Before MS analysis, protein digests were desalted and purified by C18 reverse-phase “Zip-Tip” pipette tips (Millipore Corp., Billerica, MA) following the manufacturer’s instructions. The peptide samples were then co-crystallized with 40 mg/ml DHB 50:50 MeOH:H2O and 0.1% TFA on a stainless steel MALDI target and analyzed by both MALDI drift cell IM-MS and MALDI t-wave IM-MS.
MALDI Drift Cell IM-MS
For validation of peptide t-wave CCS values, a MALDI drift cell IM-TOFMS similar to those previously described was used to measure tryptic peptide CCS values for comparison.1 Briefly, MALDI is performed by a solid-state frequency-tripled Nd:YLF (349 nm) MALDI laser (Explorer, Newport/Spectra-Physics Corp., Mountain View, CA). After ionization, analyte ions are introduced into a 13.9 cm ion mobility drift cell maintained at a pressure of ca. 3.8 Torr He and at room temperature (~298 K). Ions are subsequently analyzed by m/z in an orthogonal reflectron TOFMS. Internal calibration of the mass spectrometer was performed using C60. The two-dimensional IM-MS spectra were acquired and processed using custom software developed in the IDL programming environment (Ionwerks, Inc.). The ion-neutral CCS (Ω) was calculated by determining the td of the ion packet across the ion mobility drift cell maintained at low-field conditions. The td of an ion through the ion mobility drift cell depends on the temperature (T) and pressure (p) of the neutral drift gas, ion charge and shape, and the strength of the applied electric field (E, ~20–30 V cm−1 Torr−1). All MALDI drift cell IM-MS measurements were performed using 5 electrostatic field strengths to estimate t0, the time ions reside in the instrument outside of the drift cell, i.e. tmeasured− t0 = td.34, 35 Drift cell CCS values were calculated using:
where e is the elementary charge, kb is Boltzmann’s constant, L is the length of the drift cell, z is the charge state of the ion, N0 is the drift gas number density at STP, and mi and mn are the masses of the ion and the neutral drift gas, respectively.36
RESULTS AND DISCUSSION
The aim of this study was to develop and validate methods to determine CCS values of phospholipids and peptides directly from animal tissue sections using MALDI t-wave IM-MS. It had yet to be determined whether CCS values measured using ESI drift cell IM-MS could be successfully used as calibrants to estimate MALDI t-wave CCS values, or if peptide CCS values can be used to calibrate phospholipid CCS values. Here, we compared the results of estimating CCS values of PC species measured directly from tissue sections using either reported values of tryptic peptides measured by both MALDI and ESI drift cell IM-MS or PC species measured by MALDI drift cell IM-MS. Additionally, obtaining accurate CCS values of tryptic peptides directly from tissue sections was validated by comparison to CCS values obtained from tryptic peptide standards measured by both drift cell and t-wave IM-MS.
CCS Calibration of T-wave IM-MS
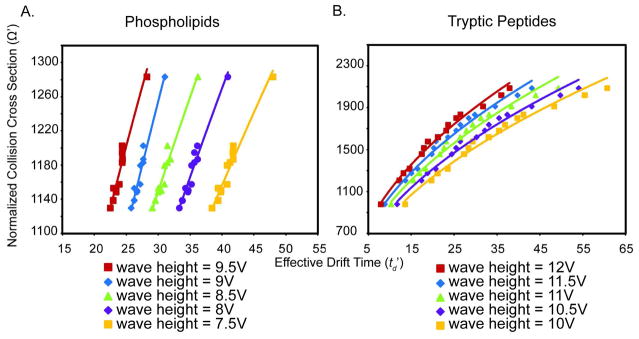
Although progress is being made in the theory of ion mobility separations by t-wave IM-MS, currently CCS values cannot be directly determined from a measure of td. Rather, a calibration curve of drift cell CCS standards analyzed under the same conditions is used to estimate t-wave CCS values of the analytes of interest. Here, reported CCS values measured by MALDI drift cell IM-MS are used as calibrants to obtain CCS values of species measured directly from rat brain tissue sections by MALDI t-wave IM-MS (Tables S1 and S2). A typical two-dimensional td versus m/z plot of data collected directly from a rat brain tissue section is displayed in Figure 1. The calibration curves for phospholipids (Figure 2A) and BSA tryptic peptides (Figure 2B) were each measured at five different wave heights over two days (n=10). Both linear and power fits of the phospholipid calibration curve provided R2 values greater than 0.95. Additionally, the functional form of the m/z to CCS correlations do not change as the effective electrodynamic field is increased suggesting that the separations are performed under low-field conditions.
FIGURE 1.
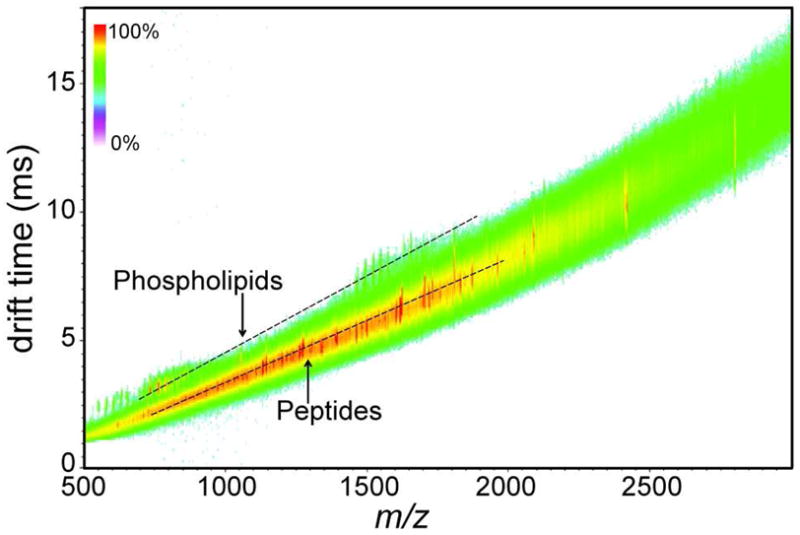
Measuring CCS values of phospholipids and tryptic peptides directly from rat brain tissue sections by MALDI t-wave IM-MS. A typical two-dimensional td versus m/z plot of a rat brain tissue section after trypsin application collected by MALDI t-wave IM-MS. The predicted correlation of drift time versus m/z for phospholipids and tryptic peptides at these experimental conditions are indicated by dashed lines for visualization purposes. Signal intensity is indicated by the displayed false color scale.
FIGURE 2.
Calibration curves of normalized CCS versus effective drift time used to estimate CCS values of (A) phospholipids and (B) tryptic peptides directly from tissue sections. Data from 5 different wave heights are each plotted whereby the correlation line represents a power fit to the data. Since t-wave IM-MS CCS values were calculated using the td values obtained directly from a complex sample, only td values for peaks containing a single species when analyzed by FTICR were used. Calibration curves of phospholipid standards have R2 values > 0.95 and calibration curves of BSA tryptic peptides have R2 values > 0.98.
Analysis of Phospholipids by T-wave Ion Mobility Directly from Tissue
The aim of this work is the optimization of CCS calibration strategies to estimate t-wave CCS values of phospholipids directly from tissue sections. Specifically, the utility of drift cell CCS values in terms of the ion source used and the class of molecule used was probed for calibrating t-wave phospholipid CCS data. This optimization evaluates two calibration parameters: (i) the effectiveness of using MALDI derived drift cell peptide CCS values for calibrating MALDI derived t-wave phospholipid CCS values and (ii) the utility of drift cell CCS values obtained using ESI for calibrating t-wave CCS values obtained using MALDI. All reported values are compared relative to absolute CCS values measured using MALDI-drift tube IM-MS.
When tryptic peptide values were used to calibrate endogenous PC species, the resulting estimated t-wave CCS values of PC species were systemically larger by an average of 6.4% and 1.2% when MALDI and ESI peptide drift cell values were used, respectively (Figure 3).10 The correlation is significantly improved when phospholipid drift cell CCS values were used to calibrate endogenous PC t-wave CCS values with an average percent difference less than 0.5%. These results suggest that t-wave CCS values can only be accurately measured using calibrants of the same biomolecular class. This observation supports the theoretical treatment of t-wave CCS values by Shvartsburg et al., which indicates that t-wave CCS values are most accurate when drift cell values of similar mobility are used.23 Thus, because biomolecules of different molecular classes exhibit distinct correlations of mobility versus m/z, this implies that drift tube CCS values should be used that are of the same class as those to be calibrated. The use of similar mass peptide drift cell CCS values for calibrating lipids should be avoided.
FIGURE 3.
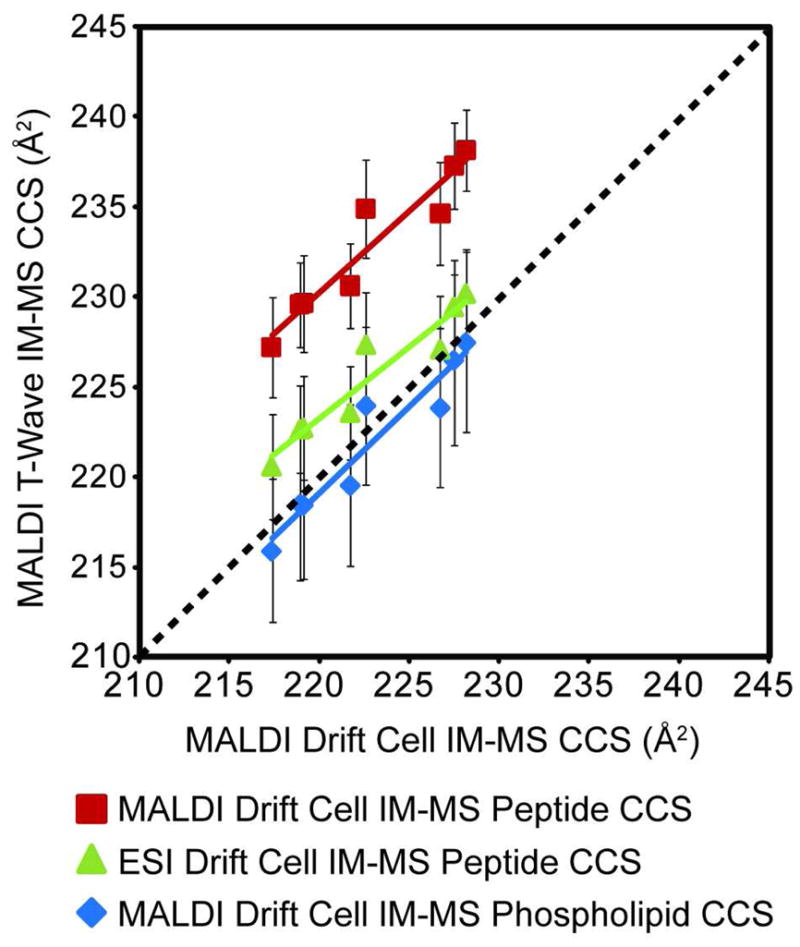
Comparison of PC CCS results based on using tryptic peptide CCS and phospholipids CCS values as calibrants. MALDI t-wave IM-MS CCS values for PC species that were calibrated using either tryptic peptide CCS values (red) or phospholipid CCS values (blue) measured using MALDI drift cell IM-MS or CCS values (green) measured by ESI drift cell IM-MS.10, 22, 32 Error bars represent ± 1σ for 5 different wave heights collected over 2 days (n=10).
The effect of the ion source used in the generation of drift tube CCS values to calibrate t-wave data is also apparent in Figure 3. When either peptide or phospholipid data obtained using MALDI is used to calibrate t-wave MALDI data, the slopes of the correlation between t-wave and drift cell CCS values are similar and near unity. The slopes for peptide and phospholipid calibrants are 0.90 and 0.95, respectively. The primary difference between the two calibrations is a systematic offset to higher values using peptide data. When ESI values are used to calibrate t-wave MALDI data, the slope of the correlation is 0.79, where the net result is that larger deviations for t-wave values are observed as the CCS decreases.
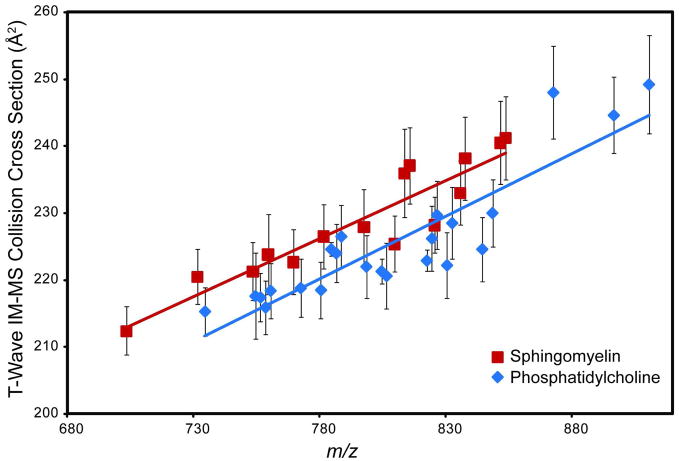
The CCS values of PC and SM species obtained directly from rat brain tissue sections and calibrated using the phospholipid correlations are shown in Figure 4. The specific molecular species identified and their calculated CCS values are presented in Table 1. These results indicate that SM species typically have larger CCS values than PC species of the same m/z which is consistent with previous reports.10, 37
FIGURE 4.
MALDI t-wave IM-MS CCS values of phospholipids obtained directly from tissue sections. Specific phospholipid species were identified by FTICR and MS/MS directly from tissue sections. MALDI t-wave IM-MS CCS values were determined using drift cell IM-MS phospholipid CCS values as calibrants. Error bars represent ± 1σ for 5 different wave heights collected over 2 days (n=10). The two SM species which fall on the PC trend-line were identified as [SM 22:0 + Na]+ and [SM 22:0 + K]+.
Table 1.
Phospholipids identified directly from tissue sections by accurate mass measurement and MS/MS analysis.
| Class | Molecular species (C1 acyl chain/C2 acyl chain) | Ion type | m/za | Lithium induced MS/MS peaksb | CCS (Å2)c |
|---|---|---|---|---|---|
| SM | 16:0 | [M + H]+ | 703.575 | 212.4 ± 3.6 | |
| SM | 18:0 | [M + H]+ | 731.606 | 220.5 ± 4.1 | |
| [M + Na]+ | 753.588 | 221.3 ± 4.3 | |||
| [M + K]+ | 769.562 | 222.7 ± 4.8 | |||
| PC | 32:0(16:0/16:0) | [M + H]+ | 734.569 | 425, 657, 478, 552, 429 | 215.3 ± 3.6 |
| [M + Na]+ | 756.551 | 217.4 ± 3.6 | |||
| [M + K]+ | 772.525 | 218.8 ± 4.3 | |||
| PC | 34:4 | [M + H]+ | 754.537 | 217.6 ± 6.4 | |
| PC | 34:2 | [M + H]+ | 758.570 | 215.9 ± 4.0 | |
| [M + Na]+ | 780.552 | 218.5 ± 4.2 | |||
| SM | 20:0 | [M + H]+ | 759.638 | 223.8 ± 6.0 | |
| [M + Na]+ | 781.619 | 226.5 ± 4.8 | |||
| [M + K]+ | 797.594 | 227.9 ± 5.6 | |||
| PC | 34:1(16:0/18:1) | [M + H]+ | 760.585 | 583, 451, 425, 577, 504, 478 | 218.4 ± 4.1 |
| [M + K]+ | 798.541 | 222.0 ± 4.7 | |||
| PC | 36:3 | [M + H]+ | 784.584 | 224.6 ± 1.0 | |
| [M + K]+ | 822.541 | 222.9 ± 1.6 | |||
| PC | 36:2(18:1/18:1) | [M + H]+ | 786.600 | 609, 451 | 224.0 ± 4.3 |
| [M + K]+ | 824.557 | 226.2 ± 4.8 | |||
| PC | 36:1(18:0/18:1) | [M + H]+ | 788.616 | 611, 451, 453 | 226.5 ± 4.7 |
| PC | 36:4(16:0/20:4) | [M + Na]+ | 804.551 | 629, 497, 425 | 221.3 ± 1.9 |
| PC | 38:6(16:0/22:6) | [M + H]+ | 806.570 | 220.6 ± 4.9 | |
| [M + K]+ | 844.525 | 224.6 ± 4.8 | |||
| SM | 22:0 | [M + Na]+ | 809.651 | 225.4 ± 4.2 | |
| [M + K]+ | 825.625 | 228.2 ± 4.2 | |||
| SM | 24:1 | [M + H]+ | 813.683 | 235.9 ± 6.6 | |
| [M + Na]+ | 835.666 | 233.0 ± 4.8 | |||
| [M + K]+ | 851.640 | 240.5 ± 6.2 | |||
| SM | 24:0 | [M + H]+ | 837.682 | 237.1 ± 5.7 | |
| [M + Na]+ | 837.682 | 238.2 ± 6.2 | |||
| [M + K]+ | 853.656 | 241.2 ± 6.2 | |||
| PC | 38:5 | [M + Na]+ | 830.567 | 222.2 ± 4.9 | |
| PC | 38:4(18:0/20:4) | [M + Na]+ | 832.584 | 633, 473, 453 | 228.5 ± 5.4 |
| [M + K]+ | 848.556 | 230.0 ± 5.0 | |||
| PC | 42:1 | [M + H]+ | 872.711 | 248.0 ± 6.9 | |
| [M + K]+ | 910.664 | 249.2 ± 7.3 | |||
| PC | 42:0 | [M + Na]+ | 896.709 | 244.6 ± 5.7 |
Data acquired by MALDI-FTICR mass spectrometer.
Fragment ions are arranged with the highest intensity ion (left) to lowest intensity ion in the MS/MS spectra (decimal values not included).
CCS values are reported as the average of 10 replicate measurements using phospholipids as internal calibrants (reported in table S1).
Analysis of Peptides by T-wave Ion Mobility Directly from Tissue
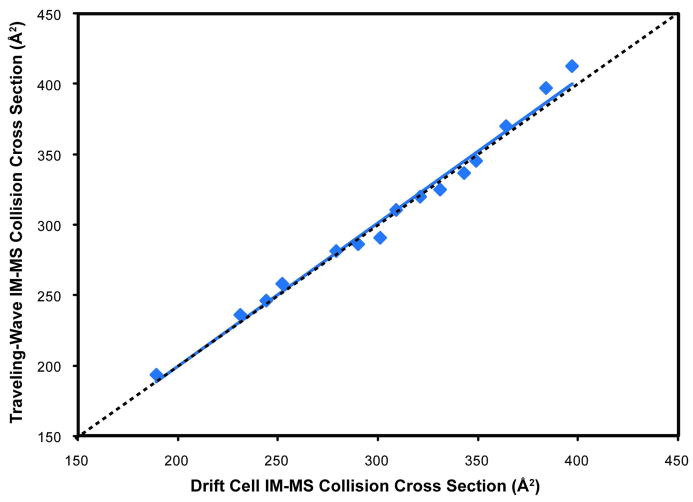
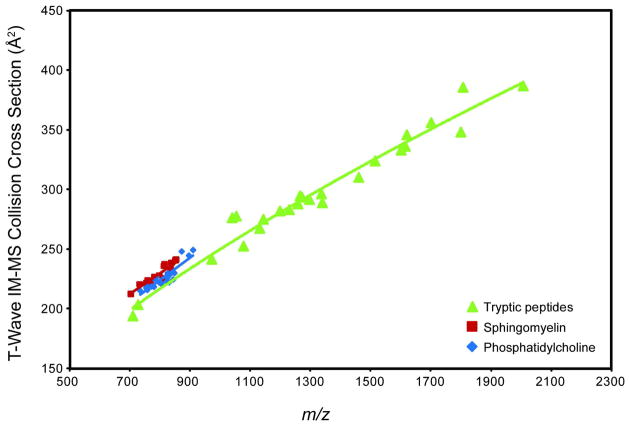
Determining the CCS values of tryptic peptides directly from tissue sections can potentially provide information on the peptide secondary structure and the presence of post-translational modifications.14, 28, 38 Tryptic peptide CCS values from BSA over a mass range of ca. 500 to 2000 m/z were measured using a MALDI drift cell IM-MS and used as external calibrants to estimate tryptic peptide CCS values by MALDI t-wave IM-MS. The correlation between values obtained from the two ion mobility platforms yields an R2 > 0.98 and in all cases the percent difference is less than 4% (Figure 5). The larger percent difference of peptide CCS values than lipid values is expected, because the residuals to the peptide correlation are larger than that for the lipid correlation (Figure 2) and the calibration is performed over a wider range of m/z values, from ~500 to 2000 m/z and ~700 to 900 m/z for peptides and lipids, respectively. The calibration curves displayed in Figure 2 for these BSA tryptic peptide values were used to estimate the CCS of tryptic peptides directly from rat brain tissue sections (Figure 6, Table 2). Note that peptide CCS values are only reported for those m/z values that contain only one peak when analyzed by MALDI-FTICR, i.e. no peaks with concomitant nominally isobaric species were used. For reference, the endogenous phospholipid CCS values reported in Figure 4 are displayed which are larger than tryptic peptide CCS values at the same m/z and correlates with previous reports.5, 6, 9, 10
FIGURE 5.
MALDI t-wave IM-MS tryptic peptide CCS values from an in-solution digest. T-wave IM-MS CCS values of tryptic peptides from a BSA digest were determined using BSA tryptic peptide CCS values measured by MALDI drift cell IM-MS as calibrants. The error bars (all are < 2.0%) represent ± 1σ for 5 different wave heights collected over 2 days (n=10). Correlation between MALDI drift cell IM-MS and MALDI t-wave IM-MS CCS values result in an R2 value > 0.98, where the dashed line represents a 1:1 correlation.
FIGURE 6.
MALDI t-wave IM-MS CCS values of tryptic peptides measured directly from tissue sections. CCS values were calibrated using MALDI drift tube IM-MS CCS values of BSA tryptic peptides as calibrants. Only the CCS values of confidently identified tryptic peptides sequenced by high mass accuracy and MS/MS directly from tissue sections are displayed (Table 3). Error bars (average error is < 1.5%) represent ± 1σ for 5 different wave heights collected over 2 days (n=10). For reference, SM and PC trend-lines are plotted illustrating that peptides have a lower CCS than phospholipid species of the same m/z.
Table 2.
Assignment of tryptic peptide sequences and reported CCS values.
| Protein | Observed [M + H]+a | [M + H]+calc | Δppm | Sequenceb | CCS (Å2)c |
|---|---|---|---|---|---|
| actin | 1198.70 | 1198.706 | −5.0 | AVFPSIVGRPR | 282.0 ± 2.2 |
| 1515.74 | 1515.7497 | −6.4 | IWHHTFYNELR | 323.93 ± 2.8 | |
| myelin basic protein | 709.34 | 709.3422 | −3.1 | FSWGGR | 193.9 ± 2.4 |
| 726.40 | 726.4051 | −7.0 | HGFLPR | 203.4 ± 2.2 | |
| 1131.57 | 1131.5798 | −8.6 | TTHYGSLPQK | 267.4 ± 2.0 | |
| 1336.63 | 1336.6319 | −1.4 | YLATASTMDHAR | 296.3 ± 2.5 | |
| 1339.70 | 1339.7082 | −6.1 | HRDTGILDSIGR | 288.8 ± 1.9 | |
| 1460.71 | 1460.7174 | −5.0 | TQDENPVVHFFK | 310.2 ± 1.7 | |
| 1800.84 | 1800.8458 | −3.2 | FSWGAEGQKPGFGYGGR | 348.2 ± 2.8 | |
| neurofilament protein | 1265.65 | 1265.6563 | −4.9 | MALDIEIAAYR | 294.7 ± 5.4 |
| 1296.70 | 1296.5682 | −6.3 | NMQNAEEWFK | 291.6 ± 2.1 | |
| tubulin, alpha | 1701.90 | 1701.9063 | −3.7 | AVFVDLEPTVIDEVR | 356.1 ± 1.7 |
| 1807.87 | 1807.8834 | −7.4 | AVCMLSNTTAIAEAWAR | 385.7 ± 2.2 | |
| 2006.89 | 2007.8936 | −1.7 | TIGGGDDSFNTFFSETGAGK | 386.9 ± 3.1 | |
| tubulin, beta | 971.49 | 971.4984 | −8.6 | TAVCDIPPR | 241.5 ± 1.5 |
| 1039.59 | 1039.594 | −3.8 | YLTVAAVFR | 276.3 ± 1.5 | |
| 1053.60 | 1053.6097 | −9.2 | YLTVAAIFR | 277.7 ± 1.7 | |
| 1077.53 | 1077.5328 | −2.5 | IREEYPDR | 252.5 ± 2.2 | |
| 1143.63 | 1143.6348 | −4.1 | LAVNMVPFPR | 275.0 ± 2.5 | |
| 1229.59 | 1229.5988 | −7.1 | ISEQFTAMFR | 283.1 ± 1.7 | |
| 1258.68 | 1258.6908 | −8.5 | FPGQLNADLRK | 287.9 ± 1.9 | |
| 1271.72 | 1271.7298 | −7.7 | KLAVNMVPFPR | 293.6 ± 1.8 | |
| 1601.81 | 1601.8209 | −6.8 | AVLVDLEPGTMDSVR | 333.0 ± 2.4 | |
| 1615.83 | 1615.8365 | −4.0 | AILVDLEPGTMDSVR | 336.2 ± 2.7 | |
| 1620.83 | 1620.8361 | −3.7 | LHFFMPGFAPLTSR | 345.9 ± 2.2 | |
Data acquired by MALDI-FTICR mass spectrometer.
MALDI MS/MS analysis of tryptic peptides directly from tissue sections acquired by MALDI Q-TOFMS.
CCS values are reported as the average of 10 replicate measurements using BSA tryptic peptides as external calibrants (reported in table S2).
Validation of Peptide CCS Values from Solution and Tissue
Tryptic peptide CCS values obtained directly from tissue sections were compared to the same tryptic peptide CCS values obtained from in solution enzymatic digests of purified proteins and analyzed using MALDI t-wave IM-MS and MALDI drift cell IM-MS (Figure 7, Table 3). While CCS values obtained by MALDI t-wave IM-MS of in solution tryptic digests and tissue sections were similar (less than 2.5% difference in all cases), CCS values obtained between MALDI t-wave IM-MS and MALDI drift cell IM-MS additionally had a high correlation with the highest percentage difference between the two techniques being less than 3.5%. These results indicate that tryptic peptide CCS values can be obtained directly from thin tissue sections and other complex samples using MALDI t-wave IM-MS when appropriate CCS calibrants are used.
Figure 7.
Validation of MALDI t-wave IM-MS CCS values directly from tissue in comparison with those from an in solution digest. Both MALDI t-wave IM-MS and MALDI drift cell IM-MS CCS values are an average of 5 different wave heights and electrostatic fields, respectively, over two days (n = 10). Error bars represent ± 1σ. The dashed line represents a 1:1 correlation between MALDI t-wave IM-MS and MALDI drift cell IM-MS CCS values.
Table 3.
Typtic peptide CCS values determined from standards using drift cell and t-wave IM-MS.
| Mammalian Species | Protein | Tryptic Peptide Sequence | m/z | Drift Cell IM-MS CCS (Å2)a | T-Wave IM-MS CCS (Å2)b |
|---|---|---|---|---|---|
| Mouse | Myelin Basic Protein | FSWGGR | 709.3 | 193.7 ± 2.8 | 193.9 ± 2.3 |
| HGFLRP | 726.4 | 204.7 ± 3.1 | 203.4 ± 2.2 | ||
| YLATASTMDHAR | 1336.6 | 289.5 ± 9.5 | 296.4 ± 2.5 | ||
| HRDTGILDSIGR | 1339.7 | 283.1 ± 8.0 | 288.9 ± 2.0 | ||
| TQDENPVVHFFK | 1460.7 | 305.5 ± 8.0 | 310.3 ± 1.8 | ||
| Bovine | Myelin Basic Protein | HGFLRP | 726.4 | 205.0 ± 2.3 | 203.4 ± 2.2 |
| HRDTGILDSIGR | 1339.7 | 286.1 ± 8.1 | 288.9 ± 2.0 | ||
| Actin | AVFPSIVGRPR | 1198.7 | 279.5 ± 6.8 | 282.0 ± 2.3 | |
| IWHHTFYNELR | 1515.9 | 320.9 ± 7.7 | 323.9 ± 2.9 |
CCS values are reported as the average of 10 replicate measurements.
CCS values are reported as the average of 10 replicate measurements using external BSA tryptic peptides as calibrants.
CONCLUSIONS
Phospholipid and tryptic peptide CCS values were determined by MALDI t-wave IM-MS directly from tissue sections. These results indicate that t-wave IM-MS values must be calibrated using CCS values measured by drift cell IM-MS for the same biomolecular class and by using the same type of ionization source to obtain accurate results. Although at present CCS values obtained by t-wave IM-MS can only be accomplished using drift cell CCS values as calibrants, the commercial availability of t-wave technology makes it an important instrumental platform. Through proper calibration this provides a high-throughput structural analysis tool for sampling directly from complex samples such as tissue extracts and thin tissue sections.
Supplementary Material
Acknowledgments
The authors thank D. Shannon Cornett for assistance with MALDI-FTICR analysis, Satu Puolitaival for assistance with phospholipid identification, and Emmanuelle Claude, Marten Snel, and Ian Campuzano from Waters Corporation for their support in using the MALDI SYNAPT HDMS. WBR and RMC acknowledge support from the Department of Defense Grant (W81XWH-05-01-0179) and NIH/NIGMS 5R01GM58008-10. MK and JAM acknowledge support from Vanderbilt University College of Arts and Sciences, Vanderbilt Institute of Chemical Biology, Vanderbilt Institute of Integrative Biosystems Research and Education, Ionwerks Inc., and the Defense Threat Reduction Agency (HDTRA1-09-1-0013).
References
- 1.McLean JA, Ruotolo BT, Gillig KJ, Russell DH. International Journal of Mass Spectrometry. 2005;240:301–315. [Google Scholar]
- 2.Valentine SJ, Liu XY, Plasencia MD, Hilderbrand AE, Kurulugama RT, Koeniger SL, Clemmer DE. Expert Review of Proteomics. 2005;2:553–565. doi: 10.1586/14789450.2.4.553. [DOI] [PubMed] [Google Scholar]
- 3.Wyttenbach T, Bowers MT. Annual Review of Physical Chemistry. 2007;58:511–533. doi: 10.1146/annurev.physchem.58.032806.104515. [DOI] [PubMed] [Google Scholar]
- 4.Kanu AB, Dwivedi P, Tam M, Matz L, Hill HH., Jr Journal of Mass Spectrometry. 2008;43:1–22. doi: 10.1002/jms.1383. [DOI] [PubMed] [Google Scholar]
- 5.Jackson SN, Ugarov M, Egan T, Post JD, Langlais D, Schultz JA, Woods AS. Journal of Mass Spectrometry. 2007;42:1093–1098. doi: 10.1002/jms.1245. [DOI] [PMC free article] [PubMed] [Google Scholar]
- 6.McLean JA, Ridenour WB, Caprioli RM. Journal of Mass Spectrometry. 2007;42:1099–1105. doi: 10.1002/jms.1254. [DOI] [PubMed] [Google Scholar]
- 7.Kurulugama RT, Valentine SJ, Sowell RA, Clemmer DE. Journal of Proteomics. 2008;71:318–331. doi: 10.1016/j.jprot.2008.06.010. [DOI] [PMC free article] [PubMed] [Google Scholar]
- 8.Valentine SJ, Kurulugama RT, Bohrer BC, Merenbloom SI, Sowell RA, Mechref Y, Clemmer DE. International Journal of Mass Spectrometry. 2009;283:149–160. [Google Scholar]
- 9.Fenn LS, McLean JA. Analytical and Bioanalytical Chemistry. 2008;391:905–909. doi: 10.1007/s00216-008-1951-x. [DOI] [PubMed] [Google Scholar]
- 10.Fenn LS, Kliman M, Mahsut A, Zhao SR, McLean JA. Analytical and Bioanalytical Chemistry. 2009;394:235–244. doi: 10.1007/s00216-009-2666-3. [DOI] [PMC free article] [PubMed] [Google Scholar]
- 11.Lee S, Wyttenbach T, Bowers MT. International Journal of Mass Spectrometry. 1997;167:605–614. [Google Scholar]
- 12.Fenn LS, McLean JA. Chemical Communications. 2008:5505–5507. doi: 10.1039/b810421b. [DOI] [PubMed] [Google Scholar]
- 13.Hudgins RR, Mao Y, Ratner MA, Jarrold MF. Biophysical Journal. 1999;76:1591–1597. doi: 10.1016/S0006-3495(99)77318-2. [DOI] [PMC free article] [PubMed] [Google Scholar]
- 14.Ruotolo BT, Verbeck GF, Thomson LM, Gillig KJ, Russell DH. Journal of the American Chemical Society. 2002;124:4214–4215. doi: 10.1021/ja0178113. [DOI] [PubMed] [Google Scholar]
- 15.Clemmer DE, Hudgins RR, Jarrold MF. Journal of the American Chemical Society. 1995;117:10141–10142. [Google Scholar]
- 16.Shelimov KB, Clemmer DE, Hudgins RR, Jarrold MF. Journal of the American Chemical Society. 1997;119:2240–2248. [Google Scholar]
- 17.Ruotolo BT, Hyung SJ, Robinson PM, Giles K, Bateman RH, Robinson CV. Angewandte Chemie International Edition. 2007;46:8001–8004. doi: 10.1002/anie.200702161. [DOI] [PubMed] [Google Scholar]
- 18.Lorenzen K, Olia AS, Uetrecht C, Cingolani G, Heck AJ. Journal of Molecular Biology. 2008;379:385–396. doi: 10.1016/j.jmb.2008.02.017. [DOI] [PMC free article] [PubMed] [Google Scholar]
- 19.Ruotolo BT, Benesch JL, Sandercock AM, Hyung SJ, Robinson CV. Nature Protocols. 2008;3:1139–1152. doi: 10.1038/nprot.2008.78. [DOI] [PubMed] [Google Scholar]
- 20.Wyttenbach T, vonHelden G, Bowers MT. Journal of the American Chemical Society. 1996;118:8355–8364. [Google Scholar]
- 21.Sawyer HA, Marini JT, Stone EG, Ruotolo BT, Gillig KJ, Russell DH. Journal of the American Society of Mass Spectrometry. 2005;16:893–905. doi: 10.1016/j.jasms.2005.03.002. [DOI] [PubMed] [Google Scholar]
- 22.Tao L, McLean JR, McLean JA, Russell DH. Journal of the American Society for Mass Spectrometry. 2007;18:1232–1238. doi: 10.1016/j.jasms.2007.04.003. [DOI] [PubMed] [Google Scholar]
- 23.Shvartsburg AA, Smith RD. Analytical Chemistry. 2008;80:9689–9699. doi: 10.1021/ac8016295. [DOI] [PMC free article] [PubMed] [Google Scholar]
- 24.Giles K, Pringle SD, Worthington KR, Little D, Wildgoose JL, Bateman RH. Rapid Communications in Mass Spectrometry. 2004;18:2401–2414. doi: 10.1002/rcm.1641. [DOI] [PubMed] [Google Scholar]
- 25.Ruotolo BT, Giles K, Campuzano I, Sandercock AM, Bateman RH, Robinson CV. Science. 2005;310:1658–1661. doi: 10.1126/science.1120177. [DOI] [PubMed] [Google Scholar]
- 26.Scarff CA, Thalassinos K, Hilton GR, Scrivens JH. Rapid Communications in Mass Spectrometry. 2008;22:3297–3304. doi: 10.1002/rcm.3737. [DOI] [PubMed] [Google Scholar]
- 27.Scarff CA, Patel VJ, Thalassinos K, Scrivens JH. Journal of the American Society of Mass Spectrometry. 2009;20:625–631. doi: 10.1016/j.jasms.2008.11.023. [DOI] [PubMed] [Google Scholar]
- 28.Thalassinos K, Grabenauer M, Slade SE, Hilton GR, Bowers MT, Scrivens JH. Analytical Chemistry. 2009;81:248–254. doi: 10.1021/ac801916h. [DOI] [PubMed] [Google Scholar]
- 29.Williams JP, Scrivens JH. Rapid Communications in Mass Spectrometry. 2008;22:187–196. doi: 10.1002/rcm.3346. [DOI] [PubMed] [Google Scholar]
- 30.Aerni HR, Cornett DS, Caprioli RM. Analytical Chemistry. 2006;78:827–834. doi: 10.1021/ac051534r. [DOI] [PubMed] [Google Scholar]
- 31.Groseclose MR, Andersson M, Hardesty WM, Caprioli RM. Journal of Mass Spectrometry. 2007;42:254–262. doi: 10.1002/jms.1177. [DOI] [PubMed] [Google Scholar]
- 32.Valentine SJ, Counterman AE, Clemmer DE. Journal of the American Society for Mass Spectrometry. 1999;10:1188–1211. doi: 10.1016/S1044-0305(99)00079-3. [DOI] [PubMed] [Google Scholar]
- 33.Jackson SN, Wang HY, Woods AS. Journal of the American Society of Mass Spectrometry. 2005;16:2052–2056. doi: 10.1016/j.jasms.2005.08.014. [DOI] [PubMed] [Google Scholar]
- 34.Ruotolo BT, McLean JA, Gillig KJ, Russell DH. Journal of the American Society of Mass Spectrometry. 2005;16:158–165. doi: 10.1016/j.jasms.2004.10.006. [DOI] [PubMed] [Google Scholar]
- 35.Verbeck GF, Ruotolo BT, Gillig KJ, Russell DH. Journal of the American Society of Mass Spectrometry. 2004;15:1320–1324. doi: 10.1016/j.jasms.2004.06.005. [DOI] [PubMed] [Google Scholar]
- 36.Mason EA, McDaniel EW. Transport Properties of Ions in Gases. John Wiley and Sons; Indianapolis, IN, USA: 1988. [Google Scholar]
- 37.Jackson SN, Ugarov M, Post JD, Egan T, Langlais D, Schultz JA, Woods AS. Journal of the American Society of Mass Spectrometry. 2008;19:1655–1662. doi: 10.1016/j.jasms.2008.07.005. [DOI] [PMC free article] [PubMed] [Google Scholar]
- 38.Ruotolo BT, Verbeck GFt, Thomson LM, Woods AS, Gillig KJ, Russell DH. Journal of Proteome Research. 2002;1:303–306. doi: 10.1021/pr025516r. [DOI] [PubMed] [Google Scholar]
Associated Data
This section collects any data citations, data availability statements, or supplementary materials included in this article.


