

Abstract
For most of us the foundations of our understanding of genetics were laid by considering Mendelian diseases in which familial recurrence risks are high and mutant alleles are both necessary and sufficient. One consequence of this deterministic teaching is that our conceptualisation of genetics tends to be dominated by the notion that the genetic aspects of disease are caused by rare alleles exerting large effects. Unfortunately the preconceptions that flow from this training are frequently erroneous and misleading in the context of common traits, where familial recurrence risks are modest and for the most part the relevant alleles are neither rare, nor necessary or sufficient. For these common traits the genetic architecture is far more “complex” with susceptibility rather than causality resulting from the combined effects of many alleles each exerting only a modest effect on risk. None of these alleles are sufficient to cause disease on their own and none are essential for the development of disease. Furthermore most are carried by large sections of the population the vast majority of whom don’t develop the disease. One consequence of our innate belief in the Mendelian paradigm is that we have an inherent expectation that knowledge about the genetic basis for a disease should allow genetic testing and thereby accurate risk prediction. There is an inevitable feeling that the same should be true in complex disease, but is it?
What is the underlying genetic architecture in a complex trait?
The enormous size of the human population coupled with the extreme length of the genome sequence means that even though any two individuals typically only differ by 0.1% at the genomic level there are still billions of variants prevalent in the population as a whole.1 International efforts to identify and catalogue human genetic variation, such as Hapmap (http://www.hapmap.org) and the 1000 genome project (http://www.1000genomes.org), have provided empirical support for the expected inverse relationship between the frequency of a variant allele and the number of variant alleles with the same frequency. Common variants, where both alleles have a frequency of greater than 1%, are far less numerous than rare variants. On the other hand common variants account for most (90%) of the difference between any two individuals.1 With approximately 10–15 million common variants and billions of rare variants in the human population, identifying which are relevant in any given disease has proven to be extremely challenging.2
In principle each and every genetic variant is likely to have some effect upon function and thereby upon the risk of disease; under this ultimate polygenic/biometric model3 all variants are expected to exert some effect on risk. However, the effects attributable to individual variants are likely to differ greatly with some exerting much larger effects than others, and most exerting little or no meaningful effect. Under this model we expect that both rare and common variants will influence the risk of a disease, with the relative contributions varying between diseases.4 At a population level the prevalence and familial recurrence risks of a disease are a reflection of the combined effects of the prevailing risk allelic architecture (see BOX 1).5, 6 In this context Mendelian disease can be seen to represent an unusual extreme in which a few rare variants exert profound effects and familial recurrence risks are maximal.
BOX 1.
Consider three populations that differ only in terms of the frequency of a single risk allele and are equivalent in all other respects (see Fig B1a). In accordance with the number of individuals carrying the risk allele the prevalence of disease will be highest in population C and lowest in population A. On the other hand, for reasons which are perhaps less intuitively obvious, familial recurrence risk will be greatest in population B and uninfluenced by this particular risk allele in the other two populations. In population A no-one carries the risk allele, while in population C everyone is homozygous for the allele. In these populations then the rate of risk allele carriage is unrelated to disease status and therefore the frequency of this risk allele is no greater in the relatives of affected individuals than it is for unaffected individuals. In population B, on the other hand, affected individuals are more likely to carry the risk allele than unaffected individuals and therefore the recurrence risk will be increased in the relatives of affected individuals who will necessarily also have a higher rate of carrying this allele. In short while prevalence reflects the combined burden of risk alleles in the population as a whole, familial recurrence risk is a reflection of the variation in the risk burden between individuals. The greater the extent to which individuals vary in terms of their genetically determined risk the greater will be the extent of familial clustering. For example in a Mendelian dominant trait the risk varies considerably between individuals, being effectively zero in individuals who don’t carry the risk allele and complete in those who do. In this situation disease is effectively only seen in the relatives of affected individuals. The extent of familial clustering is thus a reflection of the extent to which genetic risk varies between individuals.
Clayton22 and Pharoah et al.35 have shown that under a biometric model log(risk) in the population will be approximately normally distributed with a mean (μ) and a variance (σ2) that are determined by the population prevalence (K) and the sibling recurrence risk (λs) according to the formulae shown below
The figures in this paper are plotted using these approximations to estimate the distribution of risk in the population. It is worth noting that the distribution of risk in cases has the same variance but a mean of loge(K) + σ2/2. The risk profiles of the cases and controls thus overlap to an extent which is dependent upon λs. Even if λs for multiple sclerosis were > 40 there would still be a substantial proportion of cases (14%) that had levels of risk below the 95th percentile risk seen in the general population (see Fig B1b). The percentage of lower risk cases would only fall below 10% for diseases where λs was > 72. At a λs of 10 almost a third of cases have a level of risk below the 95th percentile of risk seen in the general population.
Risch suggested that λs, the relative recurrence risk in the siblings of an affected individual, was a useful way to summarise the amount of familial clustering in a disease5 and showed that this value could easily be partitioned between relevant loci5 and was predictive of the power to identify linkage.7 By definition λs is the ratio between the lifetime risk of the disease in the siblings of an affected individual and the lifetime risk of the disease in the general population. Both of these risks are difficult to measure reliably and Guo has pointed out that in general the denominator will be underestimated while the numerator will be overestimated.8 As a result estimates of λs are almost always positively biased. Review articles frequently specify λs but rarely provide much guidance to the data behind these quoted values. These data are often remarkably difficult to track down and invariably associated with wide confidence intervals which are rarely, if ever, acknowledged in reviews. As epidemiological studies have become larger and more discriminating the value of λs has fallen in almost all complex traits, including multiple sclerosis (see Fig 1).9–15 In a recent attempt to integrate available epidemiological evidence relating to multiple sclerosis Butterworth found that the lifetime incidence in multiple sclerosis is likely to be higher than previously estimated, a fact which would further reduce the λs.16 The real value for λs seems likely to be very much less than 10 if not less than 5.
Figure 1.

The figure shows how estimates of λs in multiple sclerosis have tended to decline over time. In chronological order the studies shown have come from Sadovnick et al.9, Robertson et al.10, Carton et al.11, Prokopenko et al.12, Willer et al.13, Nielsen et al.14 and Hemminki et al.15
Mathematical model of risk
The relationship between recurrence risk and the degree of relatedness can provide a useful guide to the mathematical model which most closely reflects the underlying genetic risk architecture.5 In multiple sclerosis such segregation analysis suggests that a multiplicative model with one major risk allele and many minor alleles provides the optimal fit.5, 17 This result is unsurprising given the biometric notion that susceptibility is likely to be determined by multiple variants, if not to some extent by all variants. In this situation we would expect log(risk) to be normally distributed, since a normal distribution results from the sum of a large number of random variables (see BOX 1). In multiple sclerosis the relationship between relative recurrence risk and relatedness is decidedly non-linear (see Fig 2).10, 12, 13, 18 These data are consistent with a multiplicative model and imply that significant heterogeneity is unlikely.4 The linkage data in multiple sclerosis concords with these predictions confirming that there is just one major risk allele in the disease, DRB1*1501.19 Based on the linkage data the locus specific λs for the MHC region as a whole is 1.5 while all other loci of relevance in multiple sclerosis have a λs of ≪1.2.19
Figure 2.

This figure shows the relative recurrence risks in relation to the degree of relatedness as observed in three population based studies UK (green line),10 Sardinia (red line)12, 18 and Canada (blue line).13
Predicting disease
Prior to any form of assessment all individuals in a population have the same risk of disease (the population prevalence). In multiple sclerosis this prior risk is low (0.001).20 Although susceptibility loci have only modest individual effect on this prior probability the ability to discriminate those who will, from those who will not, develop the disease inevitably increases with each additional relevant locus considered.21 It turns out, however, that even if all relevant loci were known and tested disease can only be reliably predicted in relatively few individuals, unless λs is very large.22 For multiple sclerosis λs is at best 10 indicating that very few individuals (<0.1%) would have a risk of greater than 10% (see Fig 3). The distribution of risk shown in the figure reflects the combined effects of all risk alleles (known and as yet unknown) and thus represents the maximum level of information that could possibly be defined genetically. It is clear that the vast majority of the population have a very similar level of risk, indeed on average the relative risk of the disease between any two individuals is just 11.3, a rather limited value in the context of a disease with a prevalence of 0.001. In other words most of the population carry risk alleles but only a very few individuals carry a substantially larger than average number of these alleles. In principle an individual could be homozygous for all known risk alleles and thereby have a very high risk of disease. However, such individuals are extremely uncommon. Most individuals carry similar levels of genetically determined risk and relatively few individuals can have their ultimate disease status accurately predicted from genetic testing (see BOX 2).23
Figure 3.
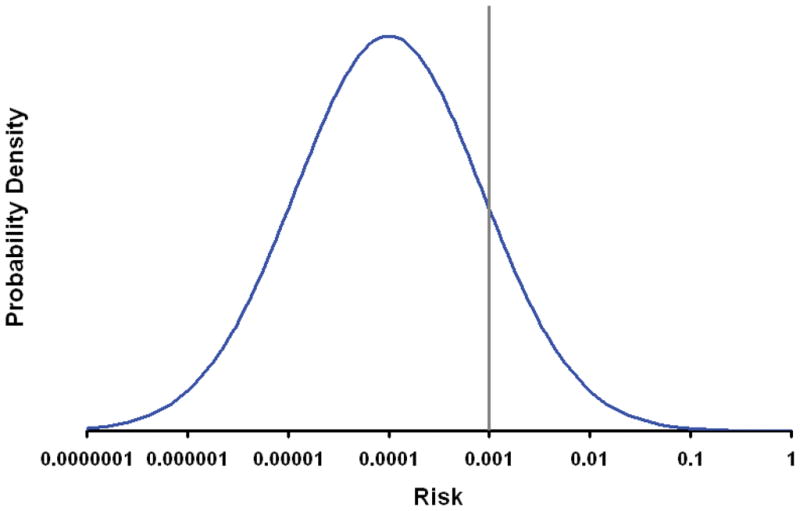
The figure shows the probability density (frequency) for differing levels of genetically determined risk of developing multiple sclerosis. Risk is plotted on the x-axis on a log scale. In keeping with the assumption that risk is determined by a very large number of independent risk alleles each exerting a modest multiplicative effect the curve is plotted with log(risk) normally distributed with a mean determined by the population prevalence (0.001) and a variance determined by λs (here taken to be 10, a value which is likely to be an overestimate),22, 35 see BOX 1. The vertical line indicates the risk of disease in all individuals prior to genotyping, i.e. the prior probability (the population prevalence). As can be seen from the curve only a very small proportion (<0.1%) of the population have a risk of greater than 10%. It should be remembered that the approximation to a normal distribution will breakdown at the extremes where the distribution will become binomial.
BOX 2.
It seems reasonable to expect that the ability to predict who will develop multiple sclerosis would have meaningful clinical benefits, such as allowing expensive, invasive or potentially dangerous preventative strategies to be reserved for those at greatest risk. At first sight it also seems possible, if not probable, that genetic testing might enable such prediction. If all variants influencing susceptibility to multiple sclerosis had been defined then in principle a “diagnostic chip” could be created which would accurately genotype all these variants, determine an individual’s genetic risk (genetic profile39) and thereby discriminate between those who will and those who will not develop the disease. Unfortunately although this is a seductive logic in practice this approach would be unlikely to be useful in multiple sclerosis (see Fig 3).
For example if we used this chip to screen a population of 100,000 newborns then on average we would identify just 64 individuals with a risk of ≥ 10%. Ultimately only 14 of these would actually develop the disease. Since 100 of the screened individuals would ultimately be expected to develop multiple sclerosis it is also clear that this genetic screening effort would have missed most of the eventual cases (86/100). Including gender in our assessment adds very little extra, in a population of 100,000 (50,000 males and 50,000 females) we would expect to identify 61 females with a risk of ≥ 10% and 10 males with a risk of ≥ 10%. This total of 71 at risk individuals is greater than the 64 we were able to identify based on genetics alone, reflecting the extra information we gained by including gender in the assessment.
The relative proportion of false positives and false negatives clearly depends upon the threshold we choose to define people as being “at risk”. The Receiver Operating Characteristic (ROC) curve provides a useful way to summarise such data,40 (see Fig B2). Considering the ROC for the hypothetical chip described above shows that 50% of the cases occur amongst the 1.6% of the population that are at greatest risk. At first sight these figures seem appealing and suggest that perhaps genetic profiling might provide a useful way to identify a significant proportion of those at risk. However the low absolute risk of multiple sclerosis (the prevalence, 0.001) implies a low positive predictive value, meaning that even within this high risk group, those who will ultimately develop the disease constitute only 3% of the total. If a preventative strategy were applied in this setting the majority of those treated would be exposed unnecessarily (97%) and the cost per case prevented would be >30 times the unit cost of the intervention. In considering these numbers it is worth remembering that this level of risk (3%) is approximately the same as the familial recurrence risk in close relatives of affected individuals suggesting that a program in which preventative treatments were simply given to those with a family history of the disease might be as effective, and would of course completely avoid the need for genotyping. In other words in multiple sclerosis genetic profiling would add very little beyond that which could already be deduced from family history, as with other traits with strong familial clustering.24
For interventions that are safe, non-invasive and cheap (i.e. cost less per person than the cost of genotyping) screening would be pointless since it would be far more cost effective to simply apply such interventions to the whole population in an unselected fashion. If the cost of an intervention were high, then the absolute cost of a preventative programme would be prohibitive even if screening by genotyping were free. Clearly there is a middle ground where a program might be affordable (particularly when weighed against the full cost of the disease prevented) in this situation screening might provide a means to maximise the benefit from any investment by identifying those at greater risk. However the health and financial costs to the large numbers of false positives (treated) and false negative (un-treated) individuals would have to be very low if this were to be a useful approach.
In considering the issue of prediction it is also worth remembering that most of the individuals at very high risk will have a family history of the disease (even if they don’t eventually develop multiple sclerosis), and thus to some extent this genetic analysis is adding relatively little additional information that cannot already be inferred from family history.24 In some sense then this logic has come full circle, those individuals with the highest genetic risk will largely declare themselves ahead of typing by virtue of the fact that they will have affected relatives.
To date nine non-MHC susceptibility alleles have been established in multiple sclerosis (see Table)25–28 with many more expected to follow in the next few years. Together with the risk attributable to the MHC all known loci account for a λs of approximately 1.6. The distribution of risk attributable to the currently known susceptibility alleles (MHC and non-MHC) is considerably more limited than that due to all loci (see Fig 4). It is clear from this figure that based on current knowledge genetic screening would only be able to identify a very few individuals with at worst a modest 1% risk of developing the disease.
Table.
Established non-MHC multiple sclerosis risk alleles
| SNP | Allele | Gene | RAF/% | OR | λs | PAF/% |
|---|---|---|---|---|---|---|
| rs6897932 | C | IL7Ra | 75 | 1.18 | 1.0047 | 14 |
| rs2104286 | T | IL2Ra | 75 | 1.19 | 1.0052 | 15 |
| rs12708716 | A | CLEC16A | 69 | 1.18 | 1.0055 | 14 |
| rs2300747 | A | CD58 | 88 | 1.30 | 1.0060 | 23 |
| rs34536443 | G | TYK2 | 97 | 1.32 | 1.0020 | 24 |
| rs1800693 | C | TNFRSF1A | 45 | 1.20 | 1.0083 | 12 |
| rs17445836 | G | ICSBP1 | 81 | 1.25 | 1.0067 | 19 |
| rs17824933 | G | CD6 | 25 | 1.18 | 1.0056 | 7 |
| rs703842 | A | METTL1 | 71 | 1.23 | 1.0081 | 17 |
RAF = Risk Allele Frequency (%), OR = Odds Ratio, PAF = Population Attributable Fraction (%). The third column indicates the closest mapped gene; while this is the most logical candidate the relevance of these specific genes has not yet been confirmed. The sixth column indicates the locus specific λs value. The PAFs in column 7 sum to > 100% as the implicated cases inevitably overlap.
Figure 4.
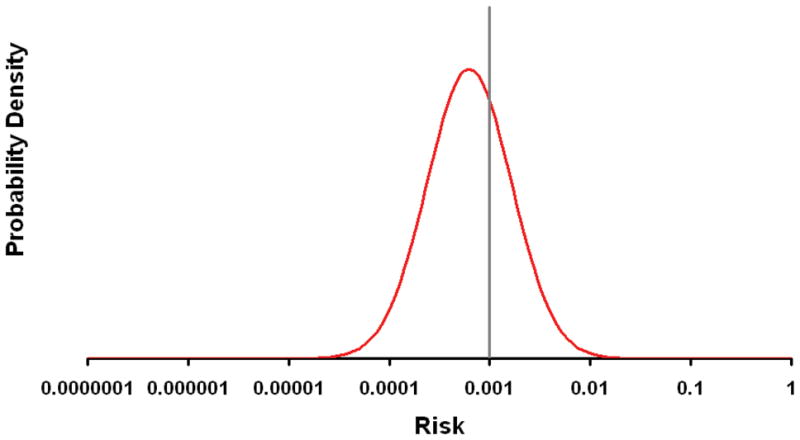
The figure shows the probability density (frequency) for differing levels of genetically determined risk attributable to currently known multiple sclerosis susceptibility loci (MHC plus those in the table). The vertical line indicates the population prevalence (0.001). The variance in the normal distribution of the plotted curve is based on a λs of 1.6, see BOX 1.
Can genetic testing help with differential diagnosis or prognosis?
Once an individual develops symptoms consistent with multiple sclerosis the prior probability of the disease goes up significantly, and we could therefore imagine that genetic testing might be more useful in helping to refine diagnosis rather than predict disease. However, in this setting the utility of the testing depends on typing SNPs which differentiate multiple sclerosis from the alternate diagnoses rather than from the general background population. It is not clear that susceptibility SNPs will achieve this unless the pathogenesis of the alternate diagnoses are clearly distinct (have a different underlying genetic architecture). In the case of clinically isolated syndromes (CIS) for example it seems likely that those cases which do not progress to multiple sclerosis are simply milder versions of the same disease process. In this setting it is unlikely that the genetic architecture underlying cases that do not relapse will be significantly different from that underlying multiple sclerosis itself. Thus although the prior probability of multiple sclerosis must be higher in Neurology outpatient clinics the utility of testing susceptibility SNPs is likely to be reduced. The more distinct the alternate diagnosis the easier it will be to differentiate them from multiple sclerosis on clinical grounds. In other words in those settings where genetic testing might help with differential diagnosis it is likely that this will not be so challenging clinically. Whenever genetic testing might help it seems likely that it won’t be needed.
Once the diagnosis of multiple sclerosis is established we might ask if genetic testing could help in predicting disease features such as course or severity. Unfortunately available evidence suggests that the genetic influences on clinical features are significantly less marked than those influencing susceptibility.29 It is thus unsurprising that there has been little if any progress in identifying genetic variants that influence the course or the severity of the disease. It remains possible that such variants could be identified but unless they were unexpectedly more influential than the effects determining susceptibility it seems unlikely that testing will be any more productive than in the case of susceptibility.
One consequence of the biometric model is that affected individuals are inevitably highly heterogeneous in terms of the particular set of susceptibility alleles they carry.23 In this setting high levels of clinical heterogeneity might simply reflect the underlying heterogeneity in the distribution of risk alleles amongst cases. For example severity might simply correlate with the absolute level of genetic risk. Once sufficient risk alleles are identified it should be possible to test this theory. If this were confirmed then genetic testing might contribute some information distinguishing CIS from multiple sclerosis.
Additional non-genetic risk factors
Even without genotyping we know of a number of factors which influence the risk of developing multiple sclerosis. Gender is the most obvious example. Compared with the population as a whole (see Fig 3) the risk for females is shifted to the right while that for males is shifted to the left (see Fig 5). These shifts are modest and have little effect on the number of individuals at the extreme of risk. In other words supplementing the risk assessment on the basis of non-genetic risk factors such as gender has little effect on the extent to which useful inferences about absolute risk can be made. It is clear that combining extra information from demographic and perhaps ultimately environmental risk factors (e.g. past history of infectious mononucleosis or smoking) is sure to improve risk prediction but it seems unlikely that this will compensate for the effects of the low prior probability of developing multiple sclerosis unless considerable risk could be accounted for or there was some form of strong interaction between genetic and environmental risk factors.
Figure 5.
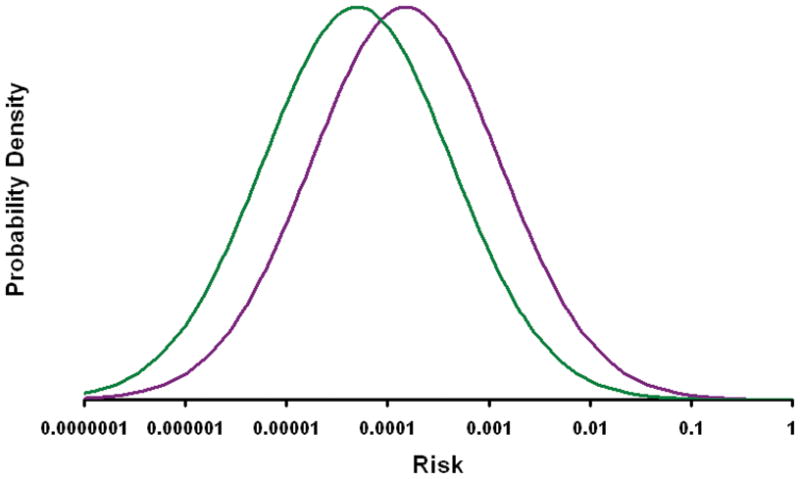
The figure shows the probability density (frequency) for differing levels of risk (as determined genetically and by gender) separately for males (green line) and female (purple line). These curves were calculated by assuming that the prevalence of disease is 0.0015 in females and 0.0005 in males. This effectively treats the risk attributable to gender as if it were due to a known set of “pseudo genetic” factors. This assumes that there is no interaction between gender and genetically determined risk, i.e. that risk allele frequencies and odds ratios are the same in males and females, a condition which seems likely to hold.41
Conclusion
The logic and conclusions outlined above are probably applicable to most complex traits. For most λs has almost certainly been over-estimated in the past and is in reality likely to be ≪ 10. In this setting the multiplicative biometric model indicates that very few individuals will carry a level of genetically determined risk that would allow confident prediction. This situation is common in medicine where we are familiar with the fact that for many conditions the majority of cases arise in the very large number of people at modestly increased risk rather than the few people who are at very high risk (c.f. blood pressure in stroke or coronary heart disease).30 Of course the utility of genetic testing could be very much better if in fact susceptibility to multiple sclerosis is determined by a multitude of very rare alleles each exerting very large effect. However, the available data makes this extremely unlikely. Segregation analysis is against significant heterogeneity,5, 17 large extended families are practically unheard31 of and there is no significant evidence for linkage outside of the MHC.19 Indirect evidence from Genome-Wide Association Studies suggests that the polygenic/biometric model is likely the most relevant.32 Given the phenomenal progress made in the genetic analysis of complex disease over the last few years33 it was inevitable, and appropriate, that researchers should consider what role this new knowledge might play in matters such as disease prediction. It was equally inevitable that some would anticipate great benefits34–36 and others recommend caution.22, 23, 37 In multiple sclerosis our analysis suggests that the relatively low prevalence and modest levels of familial clustering seen in this disease mean that genetic profiling is unlikely to be of clinical benefit except in unusual circumstances. It seems to us that we should not be distressed by the fact that no matter how completely we understand the genetic basis for susceptibility to multiple sclerosis we will rarely be able to predict who will develop disease: this was never the primary goal of these endeavours. The extent to which these discoveries influence an individual’s risk of developing disease is only one, rather unimportant as it turns out, dimension in which their relevance might be measured. In terms of the Population Attributable Fraction (PAF) (the proportion of cases which would disappear if a risk factor were removed from a population38) these loci can be seen to represent enormous effects (see table). In considering the value of these new discoveries we should also remember that to date virtually all that have been identified are associated anonymous variants, and it will take considerable further work to understand these associations. Efforts at fine mapping to establish the causal variants and functional studies to fully understand how these variants are involved in pathogenesis are only just beginning. Ultimately it is these aspects that are likely to be the most rewarding and enlightening. It is too soon to judge what value these discoveries will ultimately yield but these benefits seem likely to be profound.
Our discourse is not intended to undermine the entire notion of genetic profiling, only to put this issue into a more pragmatic and realistic context. For a disease like multiple sclerosis, where prevalence and λs are modest, it seems unlikely that risk profiling will find any meaningful role in clinical practice; on the other hand such profiling could prove to be of much greater value in a research setting. The power of functional studies could be enhanced by concentrating on controls with lower levels of risk and cases with higher levels of risk. Similarly unaffected individuals with high risk and affected individuals with low risk could be especially informative when trying to understand the role of the environment. As genetic factors influencing natural history and response to treatment emerge, prognostic and pharmacogenomic profiling might have far more clinical utility. For other diseases with much higher prevalence or considerably greater λs risk profiling might have clinical utility especially if prediction could be focused on higher risk subgroups as defined by additional information from non-genetic testing or demographic features.35
Figure B1.
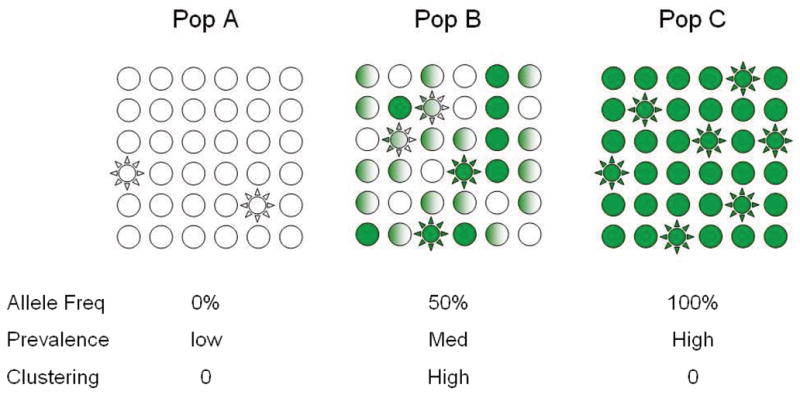

Figure B1a. The figure depicts three populations which are equivalent in all respects except for the frequency of a single risk allele which is absent from Population A, has a frequency of 50% in population B and a frequency of 100% in population C. Plain circles indicated unaffected individuals while stars indicate affected individuals. Empty shapes are homozygous for the wild type allele, while full shaded shapes are homozygous for the risk allele and half shaded shapes are heterozygous. Note within populations A and C this risk allele would show no evidence of association even if the effect it exerted were enormous (the allele frequency is the same in cases and controls in these populations). This is an illustration of why allele frequency is so important in association studies.
Figure B1b. The figure shows the % of cases which will have a risk at or above the 95th percentile risk seen in the background population for differing levels of λs.
Figure B2.
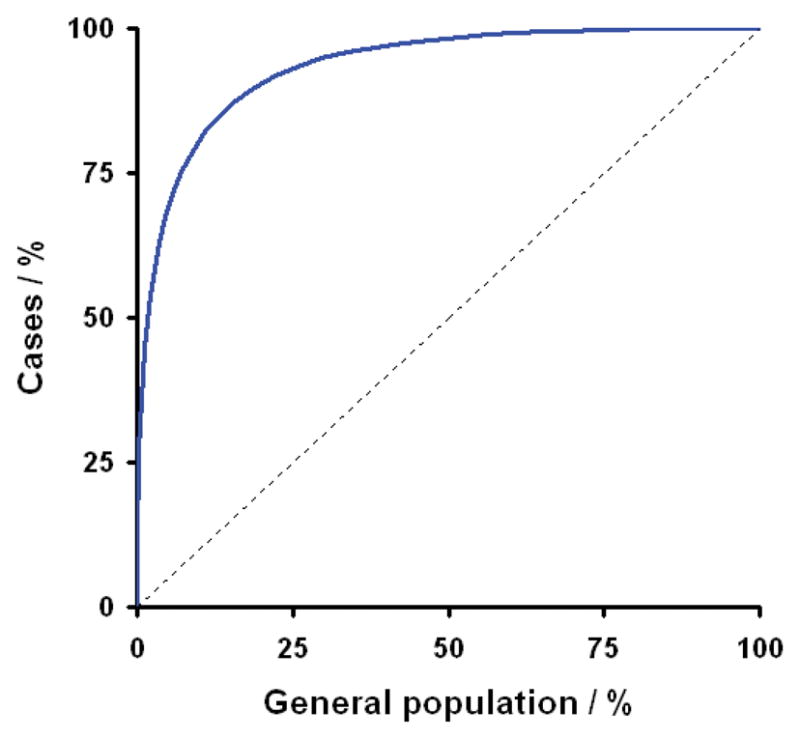
This figure shows the ROC for a hypothetical “diagnostic chip” capable of accurately genotyping all relevant multiple sclerosis susceptibility loci; in terms of prediction this represents the best scenario we could hope to achieve. This curve indicates how sensitivity and specificity vary as the threshold for defining individuals as being at risk is changed from extremely high risk on the left through to extremely low risk at the right. Sensitivity is the proportion of individuals who will eventually develop the disease that are correctly labelled as being at risk (plotted on the y-axis). While specificity is the proportion of individuals who will not develop the disease that are correctly labelled as not being at risk (1-specificity is plotted on the x-axis). In considering this curve it is important to remember that the population prevalence of multiple sclerosis is only 0.001. Thus in a population like the UK the x-axis covers some 60million individuals while the y-axis covers just the 60,000 affected individuals. The dotted line indicates the null relationship that would occur if the genetic data had no ability to predict risk of developing disease.
Acknowledgments
This work was supported by the Wellcome Trust (084702/Z/08/Z), the Medical Research Council (G0700061 and U.1052.00.012.00001.01), the National Institute of Health (RO1 NS049477) and the Cambridge NIHR Biomedical Research Centre. We would like to thank all our colleagues in the International Multiple Sclerosis Genetics Consortium (IMSGC) and the Wellcome Trust Case Control Consortium (WTCCC) for their support and tireless efforts to move the genetics of multiple sclerosis forward.
References
- 1.Kruglyak L, Nickerson DA. Variation is the spice of life. Nat Genet. 2001;27:234–236. doi: 10.1038/85776. [DOI] [PubMed] [Google Scholar]
- 2.Sawcer S. The complex genetics of multiple sclerosis: pitfalls and prospects. Brain. 2008;131:3118–3131. doi: 10.1093/brain/awn081. [DOI] [PMC free article] [PubMed] [Google Scholar]
- 3.Fisher RA. The correlation between relatives on the supposition of Mendelian inheritance. Philos Trans R Soc Edinb. 1918;52:399–343. [Google Scholar]
- 4.Wang WY, Barratt BJ, Clayton DG, Todd JA. Genome-wide association studies: theoretical and practical concerns. Nat Rev Genet. 2005;6:109–118. doi: 10.1038/nrg1522. [DOI] [PubMed] [Google Scholar]
- 5.Risch N. Linkage strategies for genetically complex traits. I. Multilocus models. Am J Hum Genet. 1990;46:222–228. [PMC free article] [PubMed] [Google Scholar]
- 6.Pritchard JK, Cox NJ. The allelic architecture of human disease genes: common disease-common variant…or not? Hum Mol Genet. 2002;11:2417–2423. doi: 10.1093/hmg/11.20.2417. [DOI] [PubMed] [Google Scholar]
- 7.Risch N. Linkage strategies for genetically complex traits. II. The power of affected relative pairs. Am J Hum Genet. 1990;46:229–241. [PMC free article] [PubMed] [Google Scholar]
- 8.Guo SW. Inflation of sibling recurrence-risk ratio, due to ascertainment bias and/or overreporting. Am J Hum Genet. 1998;63:252–258. doi: 10.1086/301928. [DOI] [PMC free article] [PubMed] [Google Scholar]
- 9.Sadovnick AD, Baird PA, Ward RH. Multiple sclerosis: updated risks for relatives. Am J Med Genet. 1988;29:533–541. doi: 10.1002/ajmg.1320290310. [DOI] [PubMed] [Google Scholar]
- 10.Robertson NP, Fraser M, Deans J, et al. Age-adjusted recurrence risks for relatives of patients with multiple sclerosis. Brain. 1996;119 (Pt 2):449–455. doi: 10.1093/brain/119.2.449. [DOI] [PubMed] [Google Scholar]
- 11.Carton H, Vlietinck R, Debruyne J, et al. Risks of multiple sclerosis in relatives of patients in Flanders, Belgium. J Neurol Neurosurg Psychiatry. 1997;62:329–333. doi: 10.1136/jnnp.62.4.329. [DOI] [PMC free article] [PubMed] [Google Scholar]
- 12.Prokopenko I, Montomoli C, Ferrai R, et al. Risk for relatives of patients with multiple sclerosis in central Sardinia, Italy. Neuroepidemiology. 2003;22:290–296. doi: 10.1159/000071192. [DOI] [PubMed] [Google Scholar]
- 13.Willer CJ, Dyment DA, Risch NJ, et al. Twin concordance and sibling recurrence rates in multiple sclerosis. Proc Natl Acad Sci U S A. 2003;100:12877–12882. doi: 10.1073/pnas.1932604100. [DOI] [PMC free article] [PubMed] [Google Scholar]
- 14.Nielsen NM, Westergaard T, Rostgaard K, et al. Familial risk of multiple sclerosis: a nationwide cohort study. Am J Epidemiol. 2005;162:774–778. doi: 10.1093/aje/kwi280. [DOI] [PubMed] [Google Scholar]
- 15.Hemminki K, Li X, Sundquist J, et al. Risk for multiple sclerosis in relatives and spouses of patients diagnosed with autoimmune and related conditions. Neurogenetics. 2009;10:5–11. doi: 10.1007/s10048-008-0156-y. [DOI] [PubMed] [Google Scholar]
- 16.Butterworth A. Family history as a risk factor for common, complex disease. Cambridge: Public Health Genetics Unit, University of Cambridge; 2007. [Google Scholar]
- 17.Sadovnick AD, Dyment D, Ebers GC. Genetic epidemiology of multiple sclerosis. Epidemiol Rev. 1997;19:99–106. doi: 10.1093/oxfordjournals.epirev.a017951. [DOI] [PubMed] [Google Scholar]
- 18.Rosati G. The prevalence of multiple sclerosis in the world: an update. Neurol Sci. 2001;22:117–139. doi: 10.1007/s100720170011. [DOI] [PubMed] [Google Scholar]
- 19.The International Multiple Sclerosis Genetics Consortium (IMSGC) A high-density screen for linkage in multiple sclerosis. Am J Hum Genet. 2005;77:454–467. doi: 10.1086/444547. [DOI] [PMC free article] [PubMed] [Google Scholar]
- 20.Compston A, Confavreux C, Lassmann H, et al. McAlpine’s Multiple Sclerosis. 4. London: Churchill Livingstone; 2006. [Google Scholar]
- 21.Wray NR, Goddard ME, Visscher PM. Prediction of individual genetic risk to disease from genome-wide association studies. Genome Res. 2007;17:1520–1528. doi: 10.1101/gr.6665407. [DOI] [PMC free article] [PubMed] [Google Scholar]
- 22.Clayton DG. Prediction and interaction in complex disease genetics: experience in type 1 diabetes. PLoS Genet. 2009;5:e1000540. doi: 10.1371/journal.pgen.1000540. [DOI] [PMC free article] [PubMed] [Google Scholar]
- 23.Janssens AC, van Duijn CM. Genome-based prediction of common diseases: advances and prospects. Hum Mol Genet. 2008;17:R166–173. doi: 10.1093/hmg/ddn250. [DOI] [PubMed] [Google Scholar]
- 24.Aulchenko YS, Struchalin MV, Belonogova NM, et al. Predicting human height by Victorian and genomic methods. Eur J Hum Genet. 2009;17:1070–1075. doi: 10.1038/ejhg.2009.5. [DOI] [PMC free article] [PubMed] [Google Scholar]
- 25.The International Multiple Sclerosis Genetics Consortium (IMSGC) Risk Alleles for Multiple Sclerosis Identified by a Genomewide Study. N Engl J Med. 2007;357:851–862. doi: 10.1056/NEJMoa073493. [DOI] [PubMed] [Google Scholar]
- 26.Wellcome Trust Case Control Consortium (WTCCC) Association scan of 14,500 nonsynonymous SNPs in four diseases identifies autoimmunity variants. Nat Genet. 2007;39:1329–1337. doi: 10.1038/ng.2007.17. [DOI] [PMC free article] [PubMed] [Google Scholar]
- 27.De Jager PL, Jia X, Wang J, et al. Meta-analysis of genome scans and replication identify CD6, IRF8 and TNFRSF1A as new multiple sclerosis susceptibility loci. Nat Genet. 2009;41:776–782. doi: 10.1038/ng.401. [DOI] [PMC free article] [PubMed] [Google Scholar]
- 28.Australia and New Zealand Multiple Sclerosis Genetics Consortium (ANZgene) Genome-wide association study identifies new multiple sclerosis susceptibility loci on chromosomes 12 and 20. Nat Genet. 2009;41:824–828. doi: 10.1038/ng.396. [DOI] [PubMed] [Google Scholar]
- 29.Hensiek AE, Seaman SR, Barcellos LF, et al. Familial effects on the clinical course of multiple sclerosis. Neurology. 2007;68:376–383. doi: 10.1212/01.wnl.0000252822.53506.46. [DOI] [PubMed] [Google Scholar]
- 30.Rose G. Sick individuals and sick populations. Int J Epidemiol. 1985;14:32–38. doi: 10.1093/ije/14.1.32. [DOI] [PubMed] [Google Scholar]
- 31.Willer CJ, Dyment DA, Cherny S, et al. A genome-wide scan in forty large pedigrees with multiple sclerosis. J Hum Genet. 2007;52:955–962. doi: 10.1007/s10038-007-0194-6. [DOI] [PubMed] [Google Scholar]
- 32.Purcell SM, Wray NR, Stone JL, et al. Common polygenic variation contributes to risk of schizophrenia and bipolar disorder. Nature. 2009;460:748–752. doi: 10.1038/nature08185. [DOI] [PMC free article] [PubMed] [Google Scholar]
- 33.Manolio TA, Brooks LD, Collins FS. A HapMap harvest of insights into the genetics of common disease. J Clin Invest. 2008;118:1590–1605. doi: 10.1172/JCI34772. [DOI] [PMC free article] [PubMed] [Google Scholar]
- 34.Bell J. The new genetics in clinical practice. Bmj. 1998;316:618–620. doi: 10.1136/bmj.316.7131.618. [DOI] [PMC free article] [PubMed] [Google Scholar]
- 35.Pharoah PD, Antoniou A, Bobrow M, et al. Polygenic susceptibility to breast cancer and implications for prevention. Nat Genet. 2002;31:33–36. doi: 10.1038/ng853. [DOI] [PubMed] [Google Scholar]
- 36.Wray NR, Goddard ME, Visscher PM. Prediction of individual genetic risk of complex disease. Curr Opin Genet Dev. 2008;18:257–263. doi: 10.1016/j.gde.2008.07.006. [DOI] [PubMed] [Google Scholar]
- 37.Vineis P, Schulte P, McMichael AJ. Misconceptions about the use of genetic tests in populations. Lancet. 2001;357:709–712. doi: 10.1016/S0140-6736(00)04136-2. [DOI] [PubMed] [Google Scholar]
- 38.Rockhill B, Newman B, Weinberg C. Use and misuse of population attributable fractions. Am J Public Health. 1998;88:15–19. doi: 10.2105/ajph.88.1.15. [DOI] [PMC free article] [PubMed] [Google Scholar]
- 39.Khoury MJ, Yang Q, Gwinn M, et al. An epidemiologic assessment of genomic profiling for measuring susceptibility to common diseases and targeting interventions. Genet Med. 2004;6:38–47. doi: 10.1097/01.gim.0000105751.71430.79. [DOI] [PubMed] [Google Scholar]
- 40.Kraft P, Wacholder S, Cornelis MC, et al. Beyond odds ratios--communicating disease risk based on genetic profiles. Nat Rev Genet. 2009;10:264–269. doi: 10.1038/nrg2516. [DOI] [PubMed] [Google Scholar]
- 41.Wellcome Trust Case Control Consortium (WTCCC) Genome-wide association study of 14,000 cases of seven common diseases and 3,000 shared controls. Nature. 2007;447:661–678. doi: 10.1038/nature05911. [DOI] [PMC free article] [PubMed] [Google Scholar]