

Abstract
Magnesium translocation across cell membranes is essential for numerous physiological processes. Three recently reported crystal structures of the CorA magnesium transport system revealed a surprising architecture, with a bundle of giant α-helices forming a 60-Å-long pore that extends beyond the membrane before widening into a funnel-shaped cytosolic domain. The presence of divalent cations in putative intracellular regulation sites suggests that these structures correspond to the closed conformation of CorA. To examine the nature of the conduction pathway, we performed 110-ns molecular-dynamics simulations of two of these structures in a lipid bilayer with and without regulatory ions. The results show that a 15-Å-long hydrophobic constriction straddling the membrane-cytosol interface constitutes a steric bottleneck whose location coincides with an electrostatic barrier opposing cation translocation. In one of the simulations, structural relaxation after the removal of regulatory ions led to concerted changes in the tilt of the pore helices, resulting in iris-like dilation and spontaneous hydration of the hydrophobic neck. This simple and robust mechanism is consistent with the regulation of pore opening by intracellular magnesium concentration, and explains the unusual architecture of CorA.
Introduction
Ion channels have evolved to provide cells with appropriate concentrations of ions by transferring them across the low-dielectric membrane. The magnesium ion plays a vital role in a number of important physiological processes. It is a critical cofactor for over 300 enzymes and an essential element in the cardiovascular system. It regulates contractile proteins; modulates membrane transport of Ca2+, Na+, and K+; and influences DNA and protein synthesis (1,2). In addition, intracellular Mg2+ levels have an inverse correlation with blood pressure (3). Compared to the other three major biological cations, Mg2+ transport and homeostasis are the most poorly understood. However, the recent determination of the three-dimensional structures of the CorA and MgtE proteins by x-ray crystallography (4–7) provides an unprecedented opportunity to examine the structural basis of Mg2+ transport. CorA is the primary Mg2+ uptake system in most prokaryotes and can also substitute for the major Mg2+ transporters found in the plasma and inner mitochondrial membranes of yeast, plants, and mammals (8). Three independent crystal structures of CorA from the thermophilic Gram-negative bacterium Thermotoga maritima (TmCorA), all in an apparently closed conformation, were recently reported (4–6). These structures are similar and of only moderate resolution (2.9–3.9 Å). In this work, we use molecular-dynamics (MD) simulations to better characterize the structure and function of this transport system.
TmCorA is a homopentamer composed of a small transmembrane (TM) domain and a large funnel domain located in the cytosol. Five giant “stalk” helices line both the funnel and the unusually long pore lumen, which extends 20 Å beyond the membrane (Fig. 1). Also intriguing is the fact that despite the presence of two divalent-cation-binding sites, the ionic permeation pathway is largely hydrophobic. The presence of 10 Mg2+-binding sites at the interface between neighboring cytosolic domains suggests that these domains may play a role in the allosteric regulation of Mg2+ transport, whereby a drop in intracellular Mg2+ concentration controls channel opening (4–6). The presence of divalent ions in these presumed regulatory binding sites suggests that the pore is in its closed state. These findings raise many questions regarding the control of ion selectivity and the mechanisms of ion transport and regulation. However, the moderate resolution of the crystallographic structures precludes a detailed analysis of the lumen structure, hydration, and transport properties.
Figure 1.

Structural features of the TmCorA protein. (a) The Cα trace of two protomers of CorA are shown, with the pore-forming α7 helices (red), outer TM (α8) helices (green), EC loop (blue), and cytosolic part (orange) excluding the α7 helices i.e., the MBD. The MM stretch, the E316 residues at the EC mouth, the basic ring of lysine residues at the membrane-cytosol interface, and the only titratable pore-lining residue (D277) are also highlighted along with lumen-bound (blue near G309 and D277) and regulatory cations (green) as circles. (b) Top view of the pentamer from the EC side, colored by monomer.
With the goal of answering these questions, we used atomistic MD simulations to examine the structural relaxation of TmCorA in a lipid bilayer, successively with and without regulatory ions. The two crystallographic models with the highest resolution (PDB codes 2IUB (5) and 2HN2 (6), refined at 2.9 and 3.7 Å, respectively) were studied. Three factors are expected to contribute to structural relaxation of the protein. First, the atomistic resolution of the simulations should help determine whether the crystallographic models correspond to the closed state of the channel. Second, the explicit, native-like lipid bilayer should alleviate any nonnative structural constraints induced by crystallographic conditions. Third, the removal of divalent ions from the regulatory binding sites may result in functional motions involved in the regulation and gating of the pore.
In this study, the putative Mg2+ conduction pathway of TmCorA is characterized. The simulations show that a 15-Å-long hydrophobic constriction at the membrane-cytosol interface corresponds to both a steric bottleneck and an electrostatic barrier, and indicate that the pores are initially closed. In one of the simulations, removal of the regulatory ions led to concerted structural changes resulting in an iris-like dilation of the pore, suggesting a plausible mechanism of pore opening.
Materials and Methods
We performed three atomistic 110-ns MD simulations of TmCorA embedded in a hydrated DMPC lipid bilayer, starting from the two crystallographic structures with the highest resolution, 2IUB (5) and 2HN2 (6). In two simulations (referred to as 2IUB and 2HN2), all metal ions were removed from their binding sites, and in the third simulation all 10 regulatory metal ions were present (2HN2∗). The missing extracellular (EC) loops were modeled for realistic, unconstrained simulations.
Modeling the missing EC loop
In both the 2IUB and 2HN2 structures of TmCorA, there were residues missing at both the N- and C-terminals (5,6). We modeled the crystallographically available first and last residues as neutral −NH2 and −COOH, respectively. In each of the five protomers of structure 2HN2, residues 316–325 were missing in the EC loop region connecting the stalk helix (α7) with the second TM helix (α8). The EC loop is required for realistic unconstrained simulations. We modeled the EC loops with the sequence EYMPELRWKW using the loop prediction program Loopy (9). The resulting 2HN2 protein structure was comprised of 1705 residues (341 from each protomer). In structure 2IUB, the EC loops had a variable number of residues missing in different protomers (5). The missing loop residues, with sequences NFE (314–316), PEL (319–321), NFEYMP (314–319), NFE (314–316), and EYMPELRWK (316–324), were modeled as stated above in chains F, G, H, I, and J, respectively. The resulting 2IUB model system was comprised of 1722 residues, with 345, 345, 344, 343, and 345 residues from chains F, G, H, I, and J, respectively.
Insertion of the protein into a lipid bilayer
The protein was inserted into a lipid bilayer to mimic its biological environment. The channel axis was first aligned with the membrane normal axis, z, and inserted into a preequilibrated hydrated bilayer of 1,2-dimyristoyl-sn-glycero-3-phosphocholine (DMPC) lipids (10) using the procedure described by Faraldo-Gómez et al. (11). The position of the membrane was determined from the data shown by Payandeh and Pai (6). Specifically, residues K324 and K346 were vertically aligned with the average z-positions of the phosphorus atoms of the DMPC membrane. A hole was first made in the center of the lipid bilayer by removing the lipid molecules overlapping with a cylinder of 23 Å radius corresponding to the narrowest part of the TM domain of TmCorA. In the second step, a molecular surface of the protein created with the program GRASP (12) was used to carve a hole in the lipid bilayer as implemented in the macromolecular simulation package GROMACS (13,14). Insertion of the protein into the bilayer was followed by hydration and energy minimization.
MD simulations
Each simulation system consisted of a periodic simulation box containing the TmCorA channel, 537 molecules of DMPC lipids in a bilayer, and ∼71,000 water molecules, for a total of ∼270,000 atoms. We added Na+ counterions (45 ions in the 2HN2 system, and 42 in 2IUB) to neutralize the simulation cell. Differences in the number of missing terminal residues in the two crystallographic structures are reflected in the number of Na+ ions needed to neutralize the system. In the random initial placement of ions, a minimum distance of 10 Å between the ions was maintained, and the ions were placed in bulk water and away from the protein. A typical simulation cell is shown in Fig. S1 of the Supporting Material. The protein, Na+ counterions, and Mg2+ ions were modeled with the OPLS all-atom force field (15,16), and the TIP3P model (17) was used for water molecules. The parameters for DMPC lipids (10) were the united atom representation first proposed by Egberts et al. (18), with charges from Chiu et al. (19) adjusted by Berger et al. (20), and with the additional scaling of 1-4 coulombic terms introduced by Lindahl and Edholm (21). We mixed the OPLS-AA protein force field with the Berger lipid parameters consistently by applying the half-ɛ double-pairlist method introduced in this work. This method avoids reparameterization (22) and retains the original parameters with greater fidelity. Specifically, the ɛ-values of the 1-4 Lennard-Jones (LJ) parameters of the lipids are divided by two in the pair types section of the GROMACS input file, and the list of 1-4 interactions is duplicated in the topology file of each lipid. The regular OPLS combination rules are then applied. In this way, the lipidic LJ and Coulombic 1-4 parameters are both cut in half and then included twice to yield properly scaled 1-4 interactions for both lipids and OPLS protein. All MD simulations were carried out in the NPT ensemble, using GROMACS 3.3.1 (13,14). Coulombic interactions were calculated explicitly within 9 Å, beyond which particle-mesh Ewald summation (23,24) was used with a grid spacing of 1.2 Å and fourth-order B-spline interpolation. LJ interactions were cut off at 1.4 nm. The SETTLE algorithm (25) was used to constrain the geometry of water molecules, and LINCS (26) was used to constrain all other bond lengths, allowing an integration time step of 2 fs. The simulation temperature was kept constant using the Berendsen algorithm (27) by weakly (τt = 0.1 ps) coupling the protein, lipids, and solvent separately to temperature baths of 300 K. Likewise, the pressure was kept constant by isotropically coupling the system to a pressure bath of 1 bar, with a coupling constant τp = 4 ps and a compressibility of 4.5 × 10⁻⁵ bar−1. The efficiency of parallel computations was enhanced by sorting the atomic coordinates along the x axis during simulation and desorting coordinates using our in-house code. Each simulation took 30 h/ns on 16 CPUs.
We performed 110-ns-long simulations for both the 2HN2 and 2IUB systems. The root mean-square deviation (RMSD) was computed for the Cα atoms of different structural elements of the protein. Because the RMSD of the pore-forming stalk helices reached a plateau within the first 10 ns of the two simulations (see Results), we defined this interval as the equilibration phase and restricted subsequent analysis of the structural and energetic properties of the channel lumen to the last 100 ns of the simulation, unless otherwise noted. The radius of the CorA pore was computed using the program HOLE (28). The axial density of water inside the lumen, ρw(z), was computed from 20,000 snapshots spaced 5 ps apart. A cylindrical volume centered at the so-called MM (M291–M302) stretch of the pore and big enough to encompass the entire pore (6 Å radius) was considered over the 110-ns-long trajectory and the contents of the pore lumen were identified. The z-positions of those water molecules were binned and the resulting histogram was normalized with respect to the amount of bulk water contained within the same volume. The total number of water molecules occupying the MM stretch of the pore was calculated from 110 time windows of 10 ps spread over the 110-ns trajectory, with the mean axial positions of the Cα atoms of M291 and M302 defining the boundaries of the stretch.
Electrostatic calculations
We computed the electrostatic energy for the passage of a probe divalent cation through the TmCorA pore by solving the Poisson-Boltzmann (PB) equation using the PBEQ module of CHARMM version 31 (29,30) together with a set of optimized atomic radii for amino acids (31). The regions occupied by membrane, protein, and water were assigned dielectric constants of 2, 4, and 80, respectively. The calculations were performed on 51 snapshots taken from each simulation and spaced 2 ns apart. All explicit water molecules, ions, and lipids were removed from the snapshots. Each electrostatic energy profile was calculated with a probe cation placed at successive positions along the channel pore. The total electrostatic energy of a permeating cation can be expressed as the sum of two contributions: the static field energy and the reaction field energy. The former arises from charge-charge interactions, whereas the latter is due to dielectric boundaries (32). The PB equation was solved on a grid of 255 × 255 × 315 with an initial cell size of 1.0 Å, followed by focusing on a finer grid of 0.5 Å. In reaction field energy calculations, a further focusing calculation was performed with a grid size of 0.3 Å. The implicit membrane was assigned a thickness of 38 Å and centered on the axial position of the Cα of A308. We use a radius of 0.65 Å as an approximative representation of Mg2+ (2), although, given the large amplitude of reaction field fluctuations in the lumen of CorA, these calculations are comparatively insensitive to ionic radii. In fact, similar results are obtained with a larger radius (not shown); accordingly, the electrostatic profiles are merely indicative of a probe divalent cation and should not be taken as specific to Mg2+. In the calculation of static field energies, a salt concentration of 100 mM was used for bulk water. To assess the effect of a membrane potential, a separate set of calculations was performed for the 2HN2 structure with a membrane potential of −100 mV.
Results and Discussion
Structural features of TmCorA
The TmCorA channel is a homopentamer with five 100-Å-long α7 “stalk” helices extending 60 Å beyond the TM region and lining a 60-Å-long pore (Fig. 1). The major part of the protein forms a funnel-shaped domain located in the intracellular (IC) space, with the narrow lumen extending 20 Å into the cytosol (Fig. 1 a). Three clusters of charged residues are found near the putative ion transfer pathway: E316 forms a negative ring at the EC entry to the lumen, and two concentric positive rings of 10 (α7) and 20 (α8) lysine residues spread over the membrane-cytosol interface; the D277 ring, which is located at the cytosolic mouth, is the only charged group inside the lumen. Together with G309 in the TM region, D277 forms one of two divalent cation-binding sites within the pore. Most of the other residues lining the lumen are nonpolar. In particular, a 15-Å-long hydrophobic region, the MM stretch, straddles the membrane-cytosol interface. Ten presumed regulatory cations are found at the interface between neighboring protomers in the IC domain of both x-ray structures (Fig. 1 b).
Structural relaxation of TmCorA
In the remainder of this work, we compare the outcome of three 110-ns MD simulations, denoted 2IUB, 2HN2, and 2HN2∗ (where the code refers to the initial PDB structure and the asterisk denotes the presence of 10 Mg2+ ions in the regulatory binding sites in a control simulation). The RMSD of the whole protein is dominated by the Mg2+-binding domains (MBDs) (Table 1) and indicates continuing structural divergence from the starting x-ray structure at the end of the simulations (Fig. 2), providing evidence for the slow relaxation of the soluble domain. By contrast, the five pore-forming α7 helices stabilize ∼2 Å RMSD within the first 10 ns of each simulation (Fig. 2). Importantly, both the extent of deviations and the magnitude of fluctuations are consistently smaller in the presence of regulatory ions than in the other two simulations, suggesting that the removal of regulatory ions leads to significant changes in the structural and dynamical properties of the protein. Nevertheless, pairwise comparisons of the three average MD structures and the two crystallographic models (Table 1) show that the average MD structures are almost as close to their starting structure and to each other as the two x-ray structures are to each other, regardless of ionic occupancy. Together, these findings suggest that all five models are in the same conformational basin, especially with regard to the pore itself. For this reason, hereafter we focus our analysis on the structure and properties of the ion conduction pathway.
Table 1.
RMSD (Å) for the structure of TmCorA, excluding the EC loops between the two reference crystal structures and the three average MD structures
| 2HN2 x-ray | 2IUB x-ray | 2HN2 MD | 2IUB MD | |
|---|---|---|---|---|
| 2IUB x-ray | 2.3 (1.6) | |||
| 2HN2 MD | 3.5 (1.9) | 2.4 (1.6) | ||
| 2IUB MD | 2.9 (1.8) | 3.4 (2.2) | 3.0 (2.0) | |
| 2HN2∗ MD | 2.6 (1.5) | 2.6 (1.7) | 3.1 (1.8) | 3.1 (1.9) |
The values shown between parentheses represent the RMSD for α7 helices only.
Figure 2.

Time evolution of the RMSDs of the Cα atoms of the stalk helices (light red) and the full protein (dark black) for the 2HN2 structure (a) without and (b) with regulatory ions, and (c) the 2IUB structure without ions. The EC loops, which are missing in the reference x-ray structures, are excluded from the analysis. (Color online).
Fluctuations of pore diameter
The diameter of the pore varies along the channel axis (Fig. 3). In all three simulations, the pore diameter relaxes with respect to the initial x-ray structures. The profiles are similar in all three simulations, with four narrow constrictions at L280, M291, M302, and N314. In the control simulation 2HN2∗, the latter constriction is narrower than in the other two simulations. On average, the methionine constrictions are narrower in the 2IUB simulation than in their 2HN2 counterparts, whereas the reverse is true at L280 (Fig. 3 b). The narrower conformation of each of these two bottlenecks is the only part of the pore that is small enough in principle to sterically exclude water. The diameters of a bare Mg2+ (∼1.30 Å) (2) and an optimally hydrated Mg2+ (6.8 Å) are also compared with average pore diameters. Although a dehydrated Mg2+ could fit through the pore, stripping all tightly bound water molecules off the divalent cation would be prohibitive. Inversely, substantial relaxation in all three simulations leads to the opening of an hourglass-shaped cavity near G309 in the upper half of the TM stretch, which is the only place where [Mg(H2O)6]2+ could fit. In accord with this finding, this location was previously found to correspond to a metal-binding site, and it was proposed that divalent cations may bind fully solvated (6).
Figure 3.
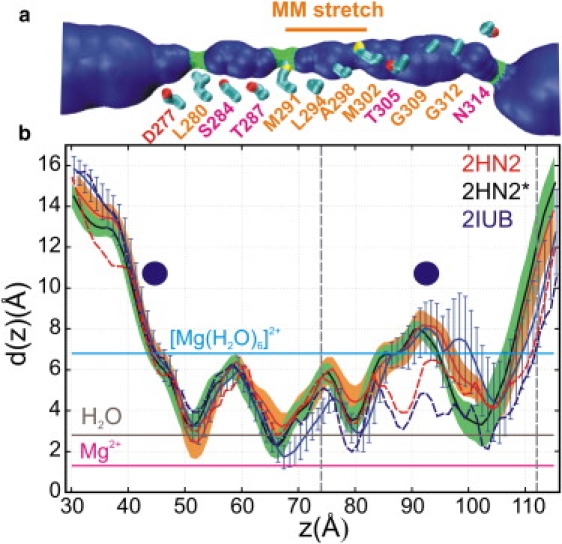
Average pore diameter. (a) Rendering of lumen volume from the average MD structure from the 2HN2 model without regulatory ions, shown together with residues lining the pore. (b) Average pore diameters from MD simulations of 2HN2 without (solid red) and with (solid black) regulatory Mg2+ ions, and 2IUB simulations (solid blue). Pore diameters of the x-ray reference structures are included for 2HN2 (broken red) and 2IUB (broken blue). Also shown are the diameters of a hydrated magnesium ion, a water molecule, and a bare Mg ion. Two dashed vertical lines denote the membrane-water interface with cytoplasm and periplasm. The two disks indicate the location of crystallographic metal binding sites inside the lumen.
Pore hydration
We monitor pore hydration as a presumably essential prerequisite to ion permeation. The average water distribution along the channel axis shows that the hydration states of the two models are in good overall agreement (Fig. 4 b). However, consistent with the above analysis of pore diameter, two dehydrated bottlenecks are found at L280 (5 Å) and in the MM stretch, respectively, in the simulations originating from the 2HN2 and 2IUB structures. Although differences in pore diameter among the three simulations are small, the pore of the 2HN2∗ control is consistently the least hydrated of the three throughout the length of the lumen. The persistence of the 15-Å-long dehydrated stretch in the 2HN2∗ and 2IUB trajectories contrasts with the small but significant water density observed in 2HN2, and suggests that the pores in the 2IUB and 2HN2∗ runs are closed, whereas the MM stretch in the 2HN2 pore is in the process of opening. This analysis is corroborated by a late snapshot of the 2HN2 trajectory, where the entire MM stretch is hydrated (Fig. 4 a).
Figure 4.
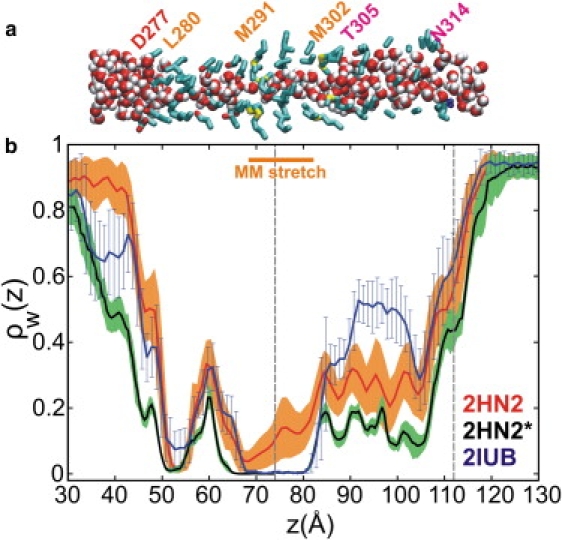
Axial distribution of water molecules in the channel lumen. (a) Representative snapshot from the end of the 2HN2 simulation without regulatory Mg2+ ions. (b) Average distribution of lumen water molecules along the channel axis from MD simulations of 2IUB (blue) and 2HN2 without (red) and with (black) regulatory Mg2+ ions. The average density was normalized with respect to the bulk water density.
Accordingly, the time evolution of water content of the MM stretch in the 2HN2 simulation reveals two distinct hydration states: “dry” (i.e., partially hydrated, with < 9 water molecules) and “wet” (fully hydrated otherwise). Several reversible wetting transitions occur in the first 50 ns, after which the MM bottleneck opens over a 10-ns period centered at t = 65 ns and remains hydrated for the rest of the 110-ns simulation (Fig. 5 a). Coincidentally, the average distance of stalk helices from the pore center in the MM stretch, , a measure of pore radius, gradually increases from 7.8 to 8.2 Å (Fig. 5 b). Likewise, the average lateral tilt of α7 helices on the pore surface in the MM stretch undergoes a small but systematic increase from 16° to 21° over the course of the simulation (Fig. 5 c). In addition, the radial tilt of the funnel part of the stalk helices changes from −50° at 30 ns to −44° at 110 ns (Fig. 5 d). Finally, the distance between adjacent MBDs increases from 37.4 to 39.4 Å, and a state is reached in which all five MBDs are arranged identically after symmetry-breaking fluctuations occur during the first 80 ns (Fig. 5 e). (Note that although the structure of the homopentameric protein maintains an ∼5-fold symmetry around the central pore axis, it is not expected to be perfectly symmetric due to thermal fluctuations.) The coincidence of these five events in run 2HN2 suggests a correlation between bottleneck hydration and changes in the global conformation of the pore, which is analyzed in Fig. 6.
Figure 5.

Global structural changes and opening of the channel bottleneck in the 2HN2 system without regulatory ions. (a) , water count of the MM stretch of the pore (thin orange) and its running average (thick red). (b) Average distance of the axis of five α7 helices (MM stretch) from the center of the pore, . (c) Lateral tilt () of the five α7 helices in the MM stretch only. (d) Radial tilt () of the five α7 helices in the IC domain (below the G274 kink). (e) Distance between the centers of mass of neighboring IC MBDs (). In panels c–e, data for five protomers and their average are shown in multicolor and thick red, respectively. (Color online).
Figure 6.

Molecular mechanism of pore dilation. (a) Correlation of with , (b) correlation of with , (c) correlation of with , and (d) correlation of with . In all four panels, the green circles and red squares denote the results from the first 10 ns and 10–110 ns of the MD simulation trajectory, respectively. The running average (blue line) traces the temporal sequence from the initial (I) to the final (F) conformation. Symbols are defined in the caption of Fig. 5. The Pearson correlation coefficients (which range from −1 to 1) for 10–110 ns results are shown. The correlations for the full 0–110 ns trajectory are shown in brackets. (Color online).
Mechanism of pore dilation
As suggested by Fig. 5, the increase in water content in the MM stretch, , is quantitatively correlated to an increase in the average distance of stalk helices from the central pore axis, (Fig. 6 d), which is itself correlated to increments in the average lateral tilt of α7 stalk helices, (Fig. 6 c). In turn, these changes are themselves coupled to structural relaxation in the funnel domain of the protein. Thus, is correlated to a decrease in the radial tilt of the stalk helices in the IC domain, (Fig. 6 b), which is itself linked to the rearrangement in the packing of MBDs, as evidenced by the average separation of the center of mass of nearest neighbors, (Fig. 6 a). The correlation between and is −0.80 (Fig. 6 a). Note that these concerted changes occur after a rapid initial relaxation of the system during the first 10 ns of the simulation, which is likely due in part to the self-adjustment of tertiary structure to correct for inaccuracies in the initial model, as well as, possibly, to the release of crystal packing constraints as the funnel domain equilibrates in the aqueous environment. Taken together, these results establish a compelling linkage between the arrangement of the MBD domains and the hydration state of the pore, with a correlation coefficient of 0.58 (data not shown).
In contrast, the presence of regulatory ions leads to consistently smaller structural relaxation and fluctuations for all five structural metrics in the structure of 2HN2∗ (Fig. S2 and Fig. S3). Equally as important, the correlations between these structural metrics vanish in that control simulation (Fig. S4). By contrast, partial relaxation of the funnel domain was observed in the 2IUB trajectory, even though the pore remained dry and constricted throughout the simulation (Fig. S5 and Fig. S6). (Although one cannot preclude the possibility that hydration would not occur in a longer simulation, this difference between the 2HN2 and 2IUB simulations could be due to a significant departure from symmetry in the 2IUB system (Fig. S5)). In any event, the large anticorrelation between and observed in the absence of ions in both the 2HN2 and 2IUB simulations drops from −0.80 and −0.78, respectively, to −0.16 in the control simulation 2HN2∗ (Fig. 6 a, Fig. S4 a, and Fig. S6 a). Further, the correlation coefficient between the arrangement of the MBD domains and the hydration state of the pore in the 2HN2∗ simulation is −0.0003 (data not shown). Taken together, these findings demonstrate that the presence of magnesium in the regulatory sites locks the stalk helices into place, and strongly suggest that the structural changes triggered by IC domain movement are needed for gating.
The above results suggest a simple model for the regulation of pore gating by changes in the IC concentration of Mg2+ ions: binding/unbinding events modulate the arrangement of the five MBDs, and the stalk helices transmit these structural changes to the pore bottleneck in an iris-like mechanism (Fig. 7). In this mechanism, a drop in the IC concentration of Mg2+ results in the vacation of the 10 low-affinity magnesium-binding sites located at the interface between adjacent MBDs (5,6). As a result, the MBDs are free to relax from each other, leading to an umbrella-like closure of the stalk helices within the funnel part of the IC domain. Because of the helical kink located at residue G274, the stalk helices wrap around the MM segment in a left-handed fashion. As a consequence, a radial closing of the IC-domain translates into an increase in lateral tilt of the stalk helices on the surface of the cylindrical MM pore segment. This process induces a shortening and widening of the pore bottleneck in a three-dimensional analogy of iris-like dilation.
Figure 7.

Schematic representation of the iris-like mechanism of pore dilation. Side and top views are shown at the top and bottom for the closed state (left) and open state (right). For clarity, only one stalk helix is shown in the side view. A decrease of radial tilt in the conical IC domain (green) results in an increase in lateral tilt in the cylindrical MM stretch (red), leading to iris-like dilation of the pore. (Color online).
Although the amplitude of these structural changes is small, our results demonstrate that it is sufficient to control hydration of the hydrophobic bottleneck. Specifically, a 0.8 Å increase in diameter (Fig. 5 b) leads to the sharp and reversible hydration of the narrow part of the pore (Fig. 6 d). This finding is consistent with simulation studies of the acetylcholine receptor, in which a 1.5 Å increase in the radius of a hydrophobic bottleneck induces functional opening of the pore (33,34). The sharpness of the transition in pore hydration apparent in Fig. 6 d is consistent with a gating process, whereby a linear signal switches a biological process on or off. To determine whether these structural changes are consistent with the functional regulation of TmCorA, we now examine the energy profiles for the permeation of a divalent cation.
Energetics of ion permeation
A full-fledged calculation of the free-energy profile or potential of mean force for the permeation of a Mg2+ cation is computationally demanding for a system of ∼270,000 atoms. To determine whether the channel is open or closed, we first seek to determine whether the structural changes uncovered above are consistent with the functional opening of the channel. To this end, we perform electrostatic calculations with a continuum representation of the solvent, which have been shown to help capture the essential features of ion permeation and blockage in membrane channels (32,35). The total electrostatic energy of the probe cation can be expressed as the sum of two contributions: the static field energy arising from the distribution of charges in the channel, and the reaction field energy, which is due to dielectric boundaries (32). PB calculations on multiple conformations spanning the length of the MD simulations show that the static field (ϕ(z)) for the permeation of a divalent cation consists of two wells located in the funnel and TM domains, respectively (Fig. 8 a). Importantly, the locations of the two wells are in excellent agreement with those of the two experimentally determined lumen-binding sites (6). The wells are separated by a broad barrier coinciding with the MM stretch and the IC membrane-water interface. The two models differ by 5 kcal/mol in the TM well depth (Fig. S7), reflecting structural fluctuations in the TM domain (Fig. 3), and are qualitatively consistent with the x-ray structures (Fig. S7). Structural relaxation results in a moderate decrease in both the wells and the barrier in the 2HN2 profile compared to the 2HN2∗ control.
Figure 8.

Average electrostatic energy profiles for permeation of a probe divalent cation. (a) The static field energy profiles for the wild-type channel (2HN2 structure) and its three hypothetical variants, with the charges of E316, basic ring (BR), and D277 sequentially turned off, are illustrated in solid red with orange shade, and green, blue, and black solid lines, respectively. Standard deviations in the static field profiles of hypothetical variants are very similar to that for wild-type and are omitted for clarity. (b) The average total electrostatic energy profiles for the 2HN2 system with (black) and without (red and green) regulatory ions. Comparatively wide (W; > 9) and narrow (N; ≤ 9) states, from the 2HN2 system without regulatory ions, are shown in green and red, with gray and orange shading, respectively. Two blue circles represent the two crystallographic divalent cation binding sites (near D277 and G309) in the lumen (6), and two dashed vertical lines denote the location of the membrane. Analogous results for the wild-type 2IUB model are shown in Fig. S7 and Fig. S8.
To probe the physical basis of the static-field profile, we repeated the PB calculations after selectively turning off the charges of the three clusters of residues proximal to the permeation pathway. Neutralizing the E316 and D277 residues destabilized the TM and IC wells by 13 and 18 kcal/mol, respectively, replacing them with a barrier (Fig. 8 a). Inversely, neutralizing the basic ring formed by the cluster of 30 Lys residues resulted in a 7-kcal/mol decrease in the energy barrier spanning the membrane-cytosol interface. The relatively small magnitude of this effect is likely due to the fact that these groups are at least partly hydrated and face away from the pore. Together, these results suggest that the simple double-well profile of the static field energy is essentially determined by the three charged clusters located in or near the lumen.
A total electrostatic energy profile combining the effect of static and reaction fields for a probe divalent cation is provided in Fig. 8 b and Fig. S8. Because the reaction field contribution is overly sensitive to the narrowest part of the pore (36), the total electrostatic profile contains significant energy barriers at both the L280 and MM constrictions, although the latter drops by 3 kcal/mol as a result of pore dilation during the 2HN2 simulation (Fig. 8 b). The TM binding site becomes a shallow well, indicating that the static field effectively cancels out the adverse effect of the membrane dielectric. In contrast, the IC binding site is a 8 kcal/mol well that would be further stabilized by a membrane potential (Fig. 8 b, Fig. S8, and Fig. S9). With additional PB calculations we have seen that ionic occupancy of the ten regulatory binding sites had no effect on the electrostatic profiles (data not shown). Importantly, in all three simulations, the total electrostatic energy profile contains significant barriers of at least 12–13 kcal/mol at the L280 and MM constrictions (Fig. 8 b and Fig. S8), suggesting that the pore did not reach a conducting state in any of the simulations.
Taken together, the above results suggest that the conformational changes analyzed in Fig. 6 are linked to channel gating. Specifically, this study reveals the presence of a hydration bottleneck and energetic barrier at the MM stretch that is spatially and energetically decoupled from the TM core, and whose dilation is controlled by concerted changes in the relative spatial arrangement of the five pore helices induced by changes in the concentration of regulatory ions inside the cell.
Consistent with this study, experimental evidence suggests that a subtle rearrangement of TM helices exploits the steep dependence of ion and water conduction on the diameter of a hydrophobic pore in the gating of the nicotinic acetylcholine receptor (nAchR) (37). Hydrophobic gating models involving changes in helix tilt have been proposed for several channels (38,39), among which nAchR (40) and MscL mechanosensitive channels (41) are also five-helix pores. Such geometry seems well suited for iris-like mechanisms.
Conclusions
In this study, MD simulations of the TmCorA transport system embedded in a hydrated bilayer led to the spontaneous relaxation of one of two crystallographic models toward a putative open state, providing a mechanism linking pore hydration to the removal of regulatory Mg2+ ions. We do not claim that the protein reaches its conducting state within the course of the simulation, or even that our simulations are converged (in fact, we show in Fig. 2 that they are not). Rather, we postulate that pore hydration is a prerequisite for ionic conduction, we show that the structural changes leading to the hydration of the pore are related to the ionic occupancy of the regulatory binding sites, and we infer that these changes are likely to be involved in the gating mechanism. In this mechanism, the long, rigid, and kinked stalk helices provide the allosteric linkage between the Mg2+-sensing domains and the principal bottleneck of the pore. These findings suggest how the unusual overall architecture of the channel, rather than a small number of interfacial or lumen residues, controls the concerted structural changes required to open and close the channel by means of an iris-like mechanism.
Our energetic analysis confirms that the MM stretch plays a central role in controlling the ionic conduction profile, since this segment of the pore represents both a hydration and an electrostatic bottleneck for Mg2+ translocation. It is striking that the location of this barrier does not coincide with the membrane region, but instead straddles the membrane-cytosol interface, apparently decoupling the burden of crossing the low-dielectric membrane region from that of permeating through a narrow pore.
This study demonstrates that MD can be used as a tool to gain insight into ion permeation mechanisms from static structures of closed channels obtained at moderate resolutions. Although additional studies are needed to determine whether further structural changes are required for Mg2+ permeation, it is likely that the dilation mechanism uncovered here forms the basis of functional gating of the TmCorA channel. Although it is consistent with our previous model (6,8), the opening mechanism proposed here rests on motions of surprisingly limited amplitude. It is conceivable that similar mechanisms are at play in the gating of other pore proteins composed of five-helix bundles, such as acetylcholine receptors (37).
Supporting Material
Nine figures are available at http://www.biophysj.org/biophysj/supplemental/S0006-3495(09)01735-4.
Supporting Material
Acknowledgments
We thank John Holyoake for insightful discussions and the Centre for Computational Biology at The Hospital for Sick Children and the Shared Hierarchical Academic Research Computing Network for generous allocations of computing resources.
C.N. was funded by the Research Training Centre at The Hospital for Sick Children and the University of Toronto. This work was supported in part by Canadian Institutes of Health Research grant MOP-43949 to R.P. E.F.P. received funding from the National Sciences and Engineering Research Council of Canada, Canadian Institutes of Health Research (MOP-86548), and Ontario Research and Development Challenge Fund. E.F.P. and R.P. are Canada Research Chair Programme chairholders.
Footnotes
Jian Payandeh's present address is Department of Pharmacology, University of Washington, Seattle, Washington.
References
- 1.Touyz R.M. Magnesium and hypertension. Curr. Opin. Nephrol. Hypertens. 2006;15:141–144. doi: 10.1097/01.mnh.0000214773.34480.d4. [DOI] [PubMed] [Google Scholar]
- 2.Maguire M.E., Cowan J.A. Mg2+ chemistry and biochemistry. Biometals. 2002;15:203–210. doi: 10.1023/a:1016058229972. [DOI] [PubMed] [Google Scholar]
- 3.Whelton P.K., Klag M.J. Magnesium and blood pressure: review of the epidemiologic and clinical trial experience. Am. J. Cardiol. 1989;63:26G–30G. doi: 10.1016/0002-9149(89)90215-4. [DOI] [PubMed] [Google Scholar]
- 4.Lunin V.V., Dobrovetsky E., Koth C.M. Crystal structure of the CorA Mg2+ transporter. Nature. 2006;440:833–837. doi: 10.1038/nature04642. [DOI] [PMC free article] [PubMed] [Google Scholar]
- 5.Eshaghi S., Niegowski D., Nordlund P. Crystal structure of a divalent metal ion transporter CorA at 2.9 Ångstrom resolution. Science. 2006;313:354–357. doi: 10.1126/science.1127121. [DOI] [PubMed] [Google Scholar]
- 6.Payandeh J., Pai E.F. A structural basis for Mg2+ homeostasis and the CorA translocation cycle. EMBO J. 2006;25:3762–3773. doi: 10.1038/sj.emboj.7601269. [DOI] [PMC free article] [PubMed] [Google Scholar]
- 7.Hattori M., Tanaka Y., Nureki O. Crystal structure of the MgtE Mg2+ transporter. Nature. 2007;448:1072–1076. doi: 10.1038/nature06093. [DOI] [PubMed] [Google Scholar]
- 8.Payandeh J., Li C., Pai E.F. Probing structure-function relationships and gating mechanisms in the CorA Mg2+ transport system. J. Biol. Chem. 2008;283:11721–11733. doi: 10.1074/jbc.M707889200. [DOI] [PubMed] [Google Scholar]
- 9.Xiang Z., Soto C.S., Honig B. Evaluating conformational free energies: the colony energy and its application to the problem of loop prediction. Proc. Natl. Acad. Sci. USA. 2002;99:7432–7437. doi: 10.1073/pnas.102179699. [DOI] [PMC free article] [PubMed] [Google Scholar]
- 10.Gurtovenko A.A., Patra M., Vattulainen I. Cationic DMPC/DMTAP lipid bilayers: molecular dynamics study. Biophys. J. 2004;86:3461–3472. doi: 10.1529/biophysj.103.038760. [DOI] [PMC free article] [PubMed] [Google Scholar]
- 11.Faraldo-Gómez J., Smith G.R., Sansom M.S.P. Setting up and optimization of membrane protein simulations. Eur. Biophys. J. 2002;31:217–227. doi: 10.1007/s00249-002-0207-5. [DOI] [PubMed] [Google Scholar]
- 12.Nicholls A., Sharp K.A., Honig B. Protein folding and association: insights from the interfacial and thermodynamic properties of hydrocarbons. Proteins. 1991;11:281–296. doi: 10.1002/prot.340110407. [DOI] [PubMed] [Google Scholar]
- 13.Lindahl E., Hess B., van der Spoel D. GROMACS 3.0: a package for molecular simulation and trajectory analysis. J. Mol. Model. 2001;7:306–317. [Google Scholar]
- 14.van der Spoel D., Lindahl E., Berendsen H.J.C. GROMACS: fast, flexible, and free. J. Comput. Chem. 2005;26:1701–1718. doi: 10.1002/jcc.20291. [DOI] [PubMed] [Google Scholar]
- 15.Jorgensen W.L., Maxwell D.S., Tirado-Rives J. Development and testing of the OPLS all-atom force field on the conformational energetics and properties of organic liquids. J. Am. Chem. Soc. 1996;118:11225–11236. [Google Scholar]
- 16.Kaminski G.A., Edholm O., Jorgensen W.L. Evaluation and reparameterization of the OPLS-AA force field for proteins via comparison with accurate quantum chemical calculations on peptides. Biophys. J. 2001;72:2002–2013. [Google Scholar]
- 17.Jorgensen W.L., Chandrasekhar J., Klein M.L. Comparison of simple potential functions for simulating liquid water. J. Chem. Phys. 1983;79:926–935. [Google Scholar]
- 18.Egberts E., Marrink S.J., Berendsen H.J.C. Molecular dynamics simulation of a phospholipid membrane. Eur. Biophys. J. 1994;22:423–436. doi: 10.1007/BF00180163. [DOI] [PubMed] [Google Scholar]
- 19.Chiu S.W., Clark M., Jakobsson E. Incorporation of surface tension into molecular dynamics simulation of an interface: a fluid phase lipid bilayer membrane. Biophys. J. 1995;69:1230–1245. doi: 10.1016/S0006-3495(95)80005-6. [DOI] [PMC free article] [PubMed] [Google Scholar]
- 20.Berger O., Edholm O., Jahnig F. Molecular dynamic simulations of a fluid bilayer of dipalmitoylphosphatidylcholine at full hydration, constant pressure, and constant temperature. Biophys. J. 1997;72:2002–2013. doi: 10.1016/S0006-3495(97)78845-3. [DOI] [PMC free article] [PubMed] [Google Scholar]
- 21.Lindahl E., Edholm O. Mesoscopic undulations and thickness fluctuations in lipid bilayers from molecular dynamics simulations. Biophys. J. 2000;79:426–433. doi: 10.1016/S0006-3495(00)76304-1. [DOI] [PMC free article] [PubMed] [Google Scholar]
- 22.Tieleman D.P., Maccallum J.L., Monticelli L. Membrane protein simulations with a united-atom lipid and all-atom protein model: lipid-protein interactions, side chain transfer free energies and model proteins. J. Phys. Condens. Matter. 2006;18:S1221–S1234. doi: 10.1088/0953-8984/18/28/S07. [DOI] [PubMed] [Google Scholar]
- 23.Darden T., York D., Pedersen L.G. Particle mesh Ewald: an N log(N) method for Ewald sums in large systems. J. Chem. Phys. 1993;98:10089–10092. [Google Scholar]
- 24.Essmann U., Perera L., Pedersen L.G. A smooth particle mesh Ewald potential. J. Chem. Phys. 1995;103:8577–8592. [Google Scholar]
- 25.Miyamoto S., Kollman P.A. SETTLE: an analytical verson of the SHAKE and RATTLE algorithms for rigid water models. J. Comput. Chem. 1992;13:952–962. [Google Scholar]
- 26.Hess B., Bekker H., Fraaije J.G.E.M. LINCS: a linear constraint solver for molecular simulations. J. Comput. Chem. 1997;18:1463–1472. [Google Scholar]
- 27.Berendsen H.J.C., Postma J.P.M., Haak J.R. Molecular dynamics with coupling to an external bath. J. Chem. Phys. 1984;81:3684–3690. [Google Scholar]
- 28.Smart O.S., Goodfellow J.M., Wallace B.A. The pore dimensions of Gramicidin A. Biophys. J. 1993;65:2455–2460. doi: 10.1016/S0006-3495(93)81293-1. [DOI] [PMC free article] [PubMed] [Google Scholar]
- 29.Brooks B.R., Bruccoleri R.E., Karplus M. CHARMM—a program for macromolecular energy, minimization, and dynamics calculations. J. Comput. Chem. 1983;4:187–217. [Google Scholar]
- 30.MacKerell A.D., Bashford D., Karplus M. All-atom empirical potential for molecular modeling and dynamics studies of proteins. J. Phys. Chem. B. 1998;102:3586–3616. doi: 10.1021/jp973084f. [DOI] [PubMed] [Google Scholar]
- 31.Nina M., Beglov D., Roux B. Atomic radii for continuum electrostatics calculations based on molecular dynamics free energy simulations. J. Phys. Chem. B. 1997;101:5239–5248. [Google Scholar]
- 32.Jogini V., Roux B. Electrostatics of the intracellular vestibule of K+ channels. J. Mol. Biol. 2005;354:272–288. doi: 10.1016/j.jmb.2005.09.031. [DOI] [PubMed] [Google Scholar]
- 33.Cory B. An energy-efficient gating mechanism in the acetylcholine receptor channel suggested by molecular and Brownian dynamics. Biophys. J. 2006;90:799–810. doi: 10.1529/biophysj.105.067868. [DOI] [PMC free article] [PubMed] [Google Scholar]
- 34.Beckstein O., Biggin P.C., Sansom M.S.P. A hydrophobic gating mechanism for nanopores. J. Phys. Chem. B. 2001;105:12902–12905. [Google Scholar]
- 35.Chakrabarti N., Roux B., Pomès R. Structural determinants of proton blockage in aquaporins. J. Mol. Biol. 2004;343:493–510. doi: 10.1016/j.jmb.2004.08.036. [DOI] [PubMed] [Google Scholar]
- 36.Roux B., Allen T., Im W. Theoretical and computational models of biological ion channels. Q. Rev. Biophys. 2004;37:15–103. doi: 10.1017/s0033583504003968. [DOI] [PubMed] [Google Scholar]
- 37.Cymes G.D., Grosman C. Pore-opening mechanism of the nicotinic acetylcholine receptor evinced by proton transfer. Nat. Struct. Mol. Biol. 2008;15:389–396. doi: 10.1038/nsmb.1407. [DOI] [PMC free article] [PubMed] [Google Scholar]
- 38.Vásquez V., Sotomayor M., Perozo E. A structural mechanism for MscS gating in lipid bilayers. Science. 2008;321:1210–1214. doi: 10.1126/science.1159674. [DOI] [PMC free article] [PubMed] [Google Scholar]
- 39.Gandhi C.S., Rees D.C. Opening the molecular floodgates. Science. 2008;321:1166–1167. doi: 10.1126/science.1162963. [DOI] [PubMed] [Google Scholar]
- 40.Cheng X., Ivanov I., McCammon J.A. Nanosecond-timescale conformational dynamics of the human α7 nicotinic acetylcholine receptor. Biophys. J. 2007;93:2622–2634. doi: 10.1529/biophysj.107.109843. [DOI] [PMC free article] [PubMed] [Google Scholar]
- 41.Yefimov S., van der Giessen E., Marrink S.J. Mechanosensitive membrane channels in action. Biophys. J. 2008;94:2994–3002. doi: 10.1529/biophysj.107.119966. [DOI] [PMC free article] [PubMed] [Google Scholar]
Associated Data
This section collects any data citations, data availability statements, or supplementary materials included in this article.