

Abstract
Ionic gradients are found across a variety of tissues and organs. In this report, we apply the phasor representation of fluorescence lifetime imaging data to the quantitative study of ionic concentrations in tissues, overcoming technical problems of tissue thickness, concentration artifacts of ion-sensitive dyes, and calibration across inhomogeneous tissue. We used epidermis as a model system, as Ca2+ gradients in this organ have been shown previously to control essential biologic processes of differentiation and formation of the epidermal permeability barrier. The approach described here allowed much better localization of Ca2+ stores than those used in previous studies, and revealed that the bulk of free Ca2+ measured in the epidermis comes from intracellular Ca2+ stores such as the Golgi and the endoplasmic reticulum, with extracellular Ca2+ making a relatively small contribution to the epidermal Ca2+ gradient. Due to the high spatial resolution of two-photon microscopy, we were able to measure a marked heterogeneity in average calcium concentrations from cell to cell in the basal keratinocytes. This finding, not reported in previous studies, calls into question the long-held hypothesis that keratinocytes increase intracellular Ca2+, cease proliferation, and differentiate passively in response to changes in extracellular Ca2+. The experimental results obtained using this approach illustrate the power of the experimental and analytical techniques outlined in this report. Our approach can be used in mechanistic studies to address the formation, maintenance, and function of the epidermal Ca2+ gradient, and it should be broadly applicable to the study of other tissues with ionic gradients.
Introduction
Ionic fluxes signal essential physiologic processes. Ionic gradients across or within kidney (1,2), bone (3) and the sinoatrial node (4) all have been postulated or reported to control essential processes of these tissues. By far the best studied ionic gradients in intact organs, however, have been found in the epidermis. Probes that measure changes in ionic concentration—such as Ca2+, K+, Na+, or pH—have revolutionized the study of ionic flux in isolated single cells. However, measurement of ionic flux in intact living organs has been much more challenging. Here, we present an approach to determining [Ca2+] in tissue based on the phasor representation (5,6) of fluorescence lifetime imaging (FLIM) measurements, and a discussion of its application to the measurement of [Ca2+] gradients in human epidermis.
Ca2+ concentrations change within different strata of epidermis. In turn, intracellular Ca2+ increased in response to raised extracellular Ca2+ directly controls essential differentiation processes in keratinocytes and epidermis, including synthesis of differentiation-specific proteins, establishment of cell-to-cell adhesion, and inhibition of lamellar body secretion from stratum granulosum (SG) cells. This Ca2+ gradient is absent in a number of diseases characterized by impaired differentiation, implying that the gradient may be important in normal epidermal growth and differentiation (7–9). Several components establish the Ca2+ gradient, including epidermal structural components, such as the epidermal permeability barrier, and endogenous Ca2+ stores contained in the endoplasmic reticulum (ER) and Golgi. The Ca2+ gradient is not present early in fetal epidermal development, but it becomes established as the epidermal permeability barrier is formed near term (10,11). Likewise, the gradient is altered, with a dramatic decrease in the amount of total epidermal Ca2+, after the barrier is experimentally perturbed (12). Thus, at least part of epidermal Ca2+ distribution seems to be controlled by the presence of a functional epidermal permeability barrier. Yet, Ca2+ contained within the intracellular organelles also contributes substantially to the total epidermal Ca2+, as the epidermal Ca2+ gradient also is abrogated in nonlesional skin from Hailey-Hailey disease, an autosomal dominant condition in which the Golgi Ca2+ ATPase ATP2C1 is mutated and Golgi Ca2+ stores are depleted (13).
Several aspects of the epidermal Ca2+ gradient can be recreated in vitro. Early differentiation, including the commitment to differentiation, synthesis of differentiation-specific proteins, and formation of cell-to-cell adhesion, can be mimicked via the “Ca2+ switch”, which occurs when extracellular Ca2+ is increased (14). The epidermal Ca2+ gradient has been studied using a variety of techniques, including ion-capture cytochemistry, microbeam proton-induced x-ray emission (PIXE), and Ca2+-sensitive fluorescent dyes (12,15–17). The studies cited here demonstrate a total (bound plus free) Ca2+ gradient that is lowest in the basal epidermal layer, increases progressively to the SG, and then drops precipitously in the stratum corneum (SC). However, although they yield important qualitative information about epidermal Ca2+, these previous efforts have not been able to answer essential questions because of several technical shortcomings. Ca2+ precipitation and PIXE studies measure total Ca2+, not free Ca2+, and they require dehydrated or fixed tissue for measurement and thus cannot measure molar Ca2+ concentrations in tissue. Moreover, the use of these methods does not allow morphological analysis of the sample, which is desirable for localization of the calcium stores inside the tissue. Previous studies based on fluorescence intensity and using fluorescent Ca2+-sensitive dyes (16,17) are subject to dye concentration artifacts, do not have high spatial resolution, and require the use of sectioned tissue.
Although previous attempts to remove dye-concentration artifacts using ratiometric dyes (18) were unsuccessful, concentration artifacts can be eliminated by using FLIM, which derives ionic concentration from the decay of the ion-sensitive dye lifetime rather than from its intensity (19–21). We successfully used this approach to measure pH gradients in the thinner, more homogeneous uppermost portion of the epidermis, the SC (22,23). FLIM has recently been used in mouse brain to quantify the difference in basal calcium levels between control and Alzheimer mouse model (24). We therefore used FLIM to measure calcium variations as detected by the fluorescence lifetime of Calcium Green 5N (CG5N). The use of fluorescence microscopy coupled with two-photon excitation allowed us to have high spatial resolution and deep tissue imaging through the entire epidermis. Imaging the Ca2+ gradient in the SC and viable epidermis adds the additional impediment of calibrating the dye in a thick (∼100 μm) and inhomogeneous tissue with varying viscosity, ionic strength, pH, etc. This report introduces a new method of calibration based on the phasor approach to FLIM data analysis, introduced by Digman et al. (5). This method allows direct calibration of the dye response to [Ca2+] in the tissue and global analysis of data from different samples. It does not require analytical fitting of the decay histograms, and provides immediate visual access to the lifetime data. Using these techniques, we confirmed that Ca2+ concentrations were much higher in the viable epidermis than in the SC in unperturbed epidermis.
The study described here allowed much better localization of Ca2+ stores than was achieved in previous studies, and revealed that the bulk of free Ca2+ measured in the epidermis comes from intracellular Ca2+ stores, such as the Golgi and the ER, with extracellular Ca2+ stores contributing relatively little to overall Ca2+ concentrations. Finally, due to the high spatial resolution of two-photon microscopy, we were able to measure a marked heterogeneity in average calcium concentrations from cell to cell in the upper basal layers that to our knowledge had not been reported in previous studies, a finding that may correlate to the proliferative or differentiative potential of individual cells. These experimental results illustrate the power of the new experimental and analysis techniques outlined in this report, and should be broadly applicable to other tissues with ionic gradients.
Materials and Methods
Calcium Green 5N (CG5N) and fluorescein were purchased from Invitrogen (Carlsbad, CA). Solutions of 1 μM fluorescein in TRIS buffer at pH 10 were used as a standard reference for the phasor analysis to account for the instrument response. Fluorescein was used because it has known single-exponential fluorescence decay with a lifetime of 4.05 ns, which in the phasor language indicates that the fluorescein phasor will lie in the universal circle.
Truncal skin samples were obtained from the Dermatology surgical units under protocols approved by the University of California, San Francisco, and San Francisco Veterans Affairs Medical Center and in accordance with the principles expressed in the Declaration of Helsinki. A total of three samples were used. To measure and localize Ca2+ concentrations and gradients in unperturbed skin, each sample was submerged in a 50-μM solution of CG5N in 0.06 mM [Ca+2] (Epilife, Cascade, OR) in such a way that both the SC and the dermal side were in contact with the dye solution, then incubated overnight at 4°C to insure dye penetration in the deeper layers of the tissue. Variations in both the calcium concentrations in the incubation media (0.06, 1, and 2 mM) and the incubation times (2, 6, and 16 h) did not change the observed epidermal Ca2+ distribution or morphology. About 2 h before imaging, the samples were rinsed in dye-free Epilife to remove the excess dye and placed with the dermal side in contact with media. Control samples were prepared by adding 260 μM EGTA to the incubation media. The specimens were mounted with the SC in contact with a glass coverslip and secured on the stage of an inverted Zeiss Axiovert 200 microscope (Carl Zeiss, Oberkochen, Germany).
Two-photon excitation FLIM measurements
Time domain FLIM measurements were performed using the TCSPC SPC-830 module (Becker and Hickl, Berlin, Germany).
Two-photon excitation was obtained using an optically pumped (Verdi, Coherent) mode-locked, tunable laser (Mira 900, Coherent) with a repetition frequency of 80 MHz. The wavelength of the emitted excitation light was tuned to 800 nm. The emitted fluorescence was detected by a H7422P-40 photomultiplier (Hamamatsu, Hamamatsu City, Japan) mounted on the nondescanned port of a Zeiss LSM 510 Meta NLO system.
The use of two-photon excitation microscopy makes possible the study of calcium distribution at different depths of ex vivo nonfixed epidermis, at the same time allowing high spatial resolution (<400 nm laterally and <1 μm axially). The typical excitation volume for two-photon excitation is on the order of 1 fl. We used a Plan Apochromat 40× oil-immersion objective (Zeiss) with a numerical aperture of 1.3. For every sample, a z-stack of 256 × 256 pixel FLIM images was collected at 2-, 5-, or 10-μm intervals using the SPCM data acquisition program (Becker and Hickl). Integration times for each frame ranged from 2 to 3 min.
Data analysis
The lifetime data were analyzed using the program SimFCS (Laboratory for Fluorescence Dynamics, University of California, Irvine). A fluorescein solution (pH 10) was used to reference the data, thus accounting for the instrument response function of the system. When they are loaded into SimFCS, the data are Fourier transformed, referenced, and displayed on a polar (phasor) plot. On the phasor plot, each fluorescent species, independent of the number of exponentials needed to determine its decay, is represented by a point (phasor) whose coordinates are the sine and cosine moments of the Fourier transform of the fluorescence decay.
pf and pb are determined as the cursor center positions in the phasor plot giving the highest score (i.e., encompassing the highest number of phasors) for the samples with lowest and highest calcium, respectively (in the case of epidermis, the EGTA-treated samples and dermis, respectively).
Once pf and pb for a given sample are identified by the user, the program calculates the fraction of the dye bound to calcium (Fb) after correcting for the relative quantum yield of the calcium bound and free species determined directly in the sample from pf and pb. Calcium concentrations are then calculated using the dye Kd, which is determined by fitting the data from buffered solutions of known calcium concentration. We determined a Kd = 3.64 μM. The in-tissue Kd must be approximated using the Kd found in buffered solutions, since known Ca2+ concentrations are not obtainable in tissue. The data analysis program makes it possible to visualize the spatial calcium concentration distribution by highlighting the pixels with a given calcium concentration in each image. In the data presented, the pixels with the selected calcium concentration are highlighted in red. The calcium concentration distribution at each layer of the sample was calculated by binning the calcium range into four intervals: I1, concentrations <3 μM; I2, concentrations between 3 and 7 μM; I3, concentrations between 7 and 15 μM; and I4, concentrations >20 μM. For each layer, the number of pixels with calcium concentration in each of the intervals was counted and normalized by the total number of pixels (frequency).
The fraction of pixels with a given calcium concentration (or converted to pf and pb) of free and bound is obtained by sliding a circle of a given radius along the calibration line (from the minimum phasor to the maximum phasor). The radius of the circle is calculated to be two standard deviations. For each point in the calibration line, we count the pixels that have phasors that can be statistically attributed (within two standard deviations) to a given value of calcium concentration. Although the value of Fb is obtained as a ratio, it arises from the decomposition of the pixel distribution from the pixel histogram curve in two fractions. Therefore, the Fb value is not obtained as the ratio of intensities in pixels, but from the ratio of fitted areas under the pixel histogram along the calibration line (Eq. 1). The tailed distributions do not arise because of statistical effects in calculating intensity ratios.
Morphological measurements
Because the use of FLIM makes possible visualization of both epidermal morphology and CG5N lifetime in the same samples, it was possible to confirm the location of calcium stores in the epidermis both by measuring depth and by examining the characteristic morphology of each epidermal layer.
Results
The phasor plot approach
The phasor plot approach described by Digman et al. (5) was used to analyze the FLIM data using the data analysis program SimFCS (LFD, Irvine, CA). This approach is based on the transformation of the fluorescence decay histogram, I(t), into its sine and cosine components and does not require fitting of the data to exponential decays. The data are displayed in a polar plot (phasor plot), where each fluorescent species, independent of the number of exponentials needed to determine its decay, is represented by a point (phasor):
Single-exponential decays on the phasor plot will fall on the universal circle (5). In the case of FLIM data, each pixel of the image is represented by a single phasor, for a total of 216 phasors for each 256 × 256-pixel image. Because phasors follow simple vector algebra, decomposition of the decay into single components, as well as background subtraction, can be attained using simple rules.
Although originally engineered for intensity-based calcium measurements, here we exploit the sensitivity of CG5N lifetime to calcium concentration (25). The calcium-bound and calcium-free forms of the CG5N dye have different brightness and lifetime decays and they can be clearly resolved on the phasor plot and identified by two distinct phasors, pb and pf, respectively (Fig. 1 A). Fig. 1 A shows the phasor distribution for solutions of different known calcium concentrations buffered at pH 7.2. All points are linearly distributed in the phasor plot, indicating that they represent a combination of two species, which we identify with the calcium-bound and calcium-free species represented by pb and pf. Any combination of the two species (due to calcium concentrations) will be represented on the phasor plot by a phasor p resulting from a linear combination of pb and pf weighted by the relative brightness of the bound and free states (ɛb and ɛf, respectively) and relative concentrations ([Ca2+CG5N] and [CG5N], respectively):
| (1) |
Figure 1.
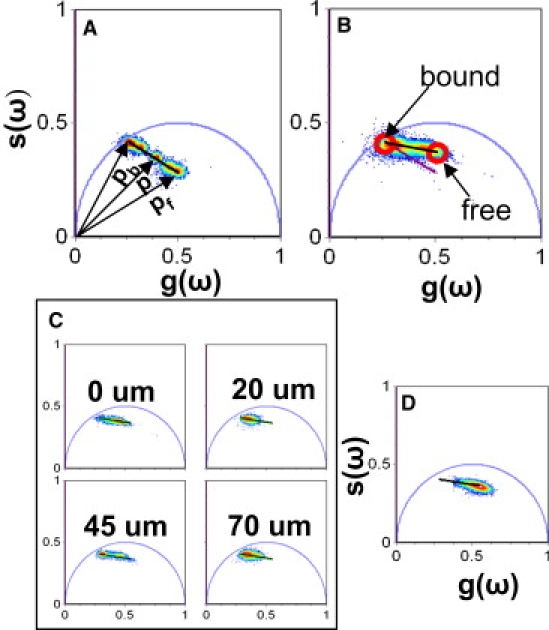
Calcium calibration in tissue. (A) Phasor representation of FLIM acquired from buffered solutions of known calcium concentrations. (B) CG5N phasor distribution from three different human skin samples. The calibration curve in the tissue (black line) and the comparison with the calibration curve in solution (purple line) are shown. (C) CG5N lifetime distribution at different depths of adult truncal skin. (D) CG5N lifetime distribution of adult truncal skin treated with 260 μM EGTA overnight. The same lifetime distribution is observed at all depths in the EGTA-treated samples. The broadness of the distribution is due to the fact that the EGTA does not homogeneously chelate the sample at all depths.
Calculating the calcium concentration
At equilibrium,
where the calcium dissociation constant is defined as
| (2) |
the fraction of dye molecules bound to calcium is defined as
| (3) |
From Eqs. 1 and 2,
| (4) |
and
| (5) |
The calcium concentration corresponding to the generic phasor p can be calculated once pb and pf, and K, are known. The phasor plot has the advantage of allowing pb and pf to be determined directly in the sample, whereas measurements of standard calcium solutions are still needed for the determination of Kd. Fitting the data in Fig. 1 A to a Hills function using Globals (LFD), we determined that Kd = 3.64 μM. (see Fig. S1 in the Supporting Material)
The CG5N binding curve can be derived from the data in Fig. 1 A using Eq. 4. The dye is saturated at calcium concentrations on the order of ∼20 μM or higher, and it is not sensitive to calcium concentrations <∼0.5 μM.
Calcium calibration: determination of pb and pf in skin samples
In the measurement of ion concentration, the main experimental challenge is the calibration of the dye response to ion concentration inside the tissue. For fluorescence lifetime measurements, the lifetime value must first be calibrated for the free and bound species, pf and pb, respectively. The pf and pb measured from calcium calibration kits in buffers with precise amounts of calcium could be different from those found inside the tissue studied here. This is a consequence of the fact that the conditions inside cells (ionic strength, pH, viscosity, etc.) and the extracellular matrix are different from those in buffer, as discussed in Jameson et al. (6). Although in single cells or homogenous tissues, the problem is solved by trying to mimic the cell internal conditions and account for viscosity pH, salt concentration, etc., this traditional approach is inadequate in a thick, inhomogeneous tissue such as the epidermis. This is highlighted in Fig. 1 B, where the phasor distribution from three different unperturbed adult skin samples stained with CG5N is plotted together with the calibration curve (purple) relative to the dye in buffered solutions derived in Fig. 1 A. Fig. 1 B clearly shows that the data from the tissue samples are also linearly distributed, but on a different line than that of the calcium solutions. The phasor approach allows us to calibrate the fluorescence response of CG5N to calcium internally to the sample, provided that calcium concentrations outside both the higher and lower ends of the dye sensitivity range exist in the sample, since the calibration curve is represented in the experimental phasor plot, as discussed below. Three different skin samples from three separate patients were analyzed to determine the phasors corresponding to the calcium-free and calcium-bound species.
We identify pb and pf as the extremes of the distribution and use them to calculate the calibration curve represented by the superimposed black line in Fig. 1. Fig. 1 C shows the phasor distributions found at different depths in the epidermis. At all depths, the phasors align along the calibration curve. Moreover, the fact that at different depths we observe phasor distributions that stretch across the entirety of the calibration curve (0 and 45 μm points) implies that the same calibration curve can be used for all depths. To further validate our calibration, we added 260 μM EGTA to the incubation media of a fourth skin sample overnight. Fig. 1 D shows that the lifetime distribution measured for this sample lies at the lower extreme of the calibration curve. We find the same phasor distribution at all depths from 0 to 50 μm.
The phasor plot allows easy identification of the autofluorescence contribution to the lifetime signal
Skin contains autofluorescent components, such as keratin, melanin, NADH, and flavins, among others. To test whether this imaging and analytic approach can distinguish between CG5N signal and skin autofluorescence, we analyzed the autofluorescence distribution of skin components using the phasor approach (Fig. 2 A). We found that the autofluorescence phasor distributes outside the CG5N calibration curve, thus allowing us to visually distinguish the autofluorescence contribution from the CG5N signal. This means that when the autofluorescence becomes a significant component of the overall signal, the resulting phasor “cloud” will distribute between the calibration line and the autofluorescence phasor, and the phasor corresponding to a pixel with a generic calcium concentration will lie in a triangle defined by pb, pf, and the autofluorescence phasor. This is illustrated in Fig. 2 B, where we analyzed the phasor distribution measured from two different depths (5 μm and 40 μm) in a sample that was incubated with the dye for only 2 h. This shortened incubation time ensures good staining of the top layers of the epidermis (Fig. 2 B, 5-μm section), but does not allow the dye to efficiently penetrate into the deeper area of the tissue (Fig. 2 B, 40-μm section). As a result, the autofluorescence contribution to the signal is negligible (compared to that of the dye) in the 5-μm section and the phasors align along the calibration curve. On the other hand, the phasor distribution relative to the 40-μm section in Fig. 2 B clearly deviates from the calibration curve due to the strong autofluorescence contribution to the signal in the deeper areas of this sample.
Figure 2.

Autofluorescence lifetime of adult skin samples. (A) Lifetime distribution of adult skin autofluorescence. (B) Lifetime distribution of adult skin incubated with CG5N for 2 h measured at 0 μm and 40 μm. The figure shows how the phasor analysis allows immediate distinction of autofluorescence contribution in deeper tissue layers from the CG5N signal.
The visual access to multiple data sets, combined with the ability to perform a global comparison, allows immediate identification of contributions from other fluorescent species. This minimizes artifactual interpretation of the data analysis more effectively than can the traditional exponential fitting approach of lifetime components.
To further minimize possible artifacts due to autofluorescence, we assigned a threshold for the fluorescence intensity such that only pixels with an autofluorescence contribution of <5% were analyzed. The error in the Ca2+ concentration introduced by a 5% background is negligible, because the deviation in phasor position caused by such a background can be calculated, using vector algebra, to be <1% (well within the calcium intervals we used for the analysis of our data (see Figs. 5 and 6)).
Figure 5.
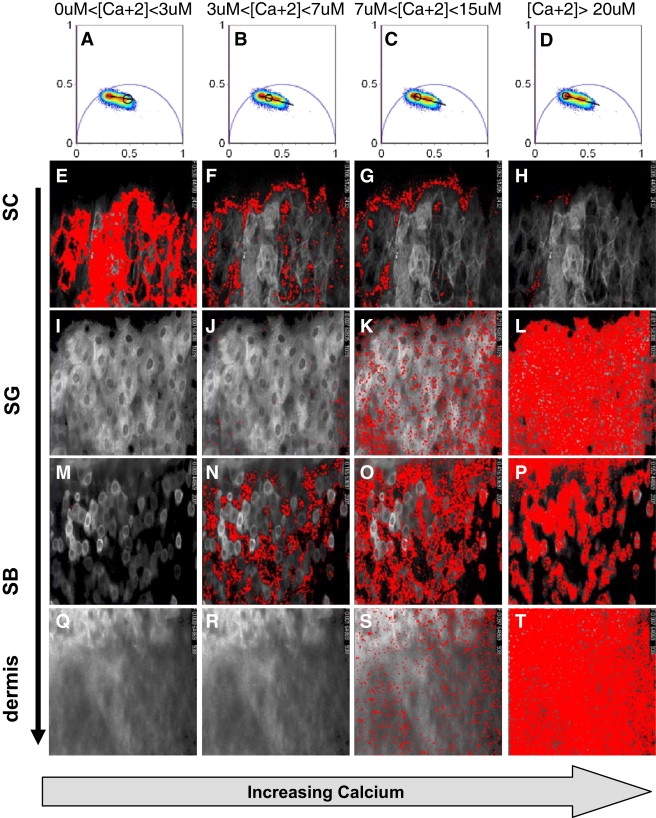
Calculation of calcium concentration in unperturbed adult skin distribution using the phasor approach. A specific calcium range is selected by moving a circular cursor along the calibration curve as shown in A–D. The pixels with a calcium concentration in the selected range are highlighted in red in the fluorescence images. This figure shows that low calcium concentrations are only found in the SC (E) of adult unperturbed skin. In the SB, we observe both regions with intermediate calcium concentration (N and O) and regions with high calcium (P). In both the SG and dermis, we find a homogeneous high calcium concentration (L and T, respectively).
Figure 6.
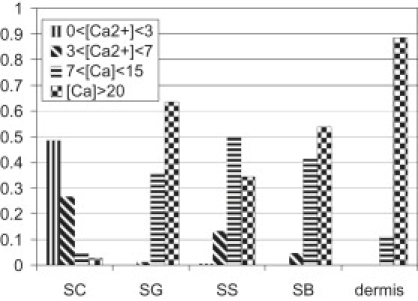
Calcium distributions in different layers of adult skin sample. The sensitivity range of CG5N to calcium was divided into four calcium intervals and the fraction of pixels with a calcium concentration in each interval was plotted.
Morphology of adult epidermis
Because different skin samples vary in both overall thickness and thickness of each stratum, a simple measure of the depth does not yield accurate localization within the epidermis. We were able to compare Ca2+ concentrations among different skin samples by simultaneously measuring the depth and examining the morphological characteristics of each stratum (Fig. 3). Morphology was examined from the fluorescence intensity of CG5N. The typical morphology of each different epidermal stratum is shown in Fig. 3. The SC is characterized by large anuclear refractile cells (Fig. 3 A). In this layer, the dye preferentially concentrates in the extracellular space. In the SG, we observe large nucleated cells with bright perinuclear granules (Fig. 3 B). In the stratum spinosum (SS)/stratum basale (SB) (Fig. 3, C and D), the cells become smaller and cuboidal. In this stratum, we also observe heterogeneity in fluorescence intensity from cell to cell. Nuclei and organelles still are visualized, which suggests that all cells are viable. No melanin was visualized in these cells, which suggests that all cells were keratinocytes. The dermis (Fig. 3 E) is visualized as a relatively acellular layer filled with uniform fibrillar collagen material. In unperturbed and nonfixed adult skin samples, the observed thickness of the SC is on the order of 25 ± 10 μm, that of the SG is ∼15 ± 5 μm, and that of the SS/SB is ∼45 ± 5 μm. These values were calculated as the average of four different adult skin samples and are comparable to those previously observed using other methods (13).
Figure 3.
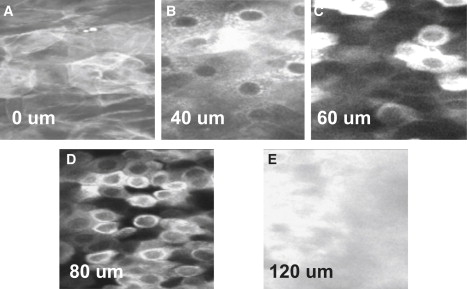
Human skin morphology. Optical coronal sections of adult skin sample stained with CG5N allow us to identify different strata of the epidermis in living samples. (A) 0 μm, stratum corneum. (B) 40 μm, stratum granulosum. (C) 60 μm, stratum spinosum. (D) 80 μm, stratum basale. (E) 120 μm, dermis.
Nonfixed epidermis contains very little extracellular space
Similar to our previous studies (22), the imaging techniques used in this report detect the nonesterified CG5N dye in both intracellular and extracellular compartments (Fig. 3 A). In the upper SC, we can distinguish the extracellular space outlined by the CG5N dye (Fig. 3 A). In the SG and SS (Fig. 3, B and C), the cells are tightly packed and the extracellular space between them is below the lateral spatial resolution of our system (<400 nm). The extracellular space in the SB (Fig. 3 D) is slightly less than a micron, larger than in the SS/SG, but smaller than the SC. To confirm these measurements, electron microscopy images of human epidermis stained with the water-soluble tracer lanthanum were used to estimate the space between adjacent cells in different nucleated epidermal layers and the fractional volume occupied by the cells (data not shown). We calculated that the extracellular space occupies 2% of the total volume in the SG and 7% in the SB.
Calcium Green phasor distribution at different depths in human skin
FLIM data were acquired every 2, 5, and 10 μm, starting from the SC. We calculated the spatial distribution of the CG5N bound fraction (Fb) from FLIM data at different epidermal strata (Fig. 4 A). Fb is closer to 0 in the SC, moves toward 1 in the SG, and then broadens toward 0 in the SS/SB before again migrating toward 1 in the dermis, denoting Ca2+ concentrations that are low in the SS/SB, increase in the SG, and then drop in the SC. Although the distributions in the SC, SG, and dermis are narrow and single-peaked, denoting uniform Ca2+ concentrations in these strata, we find a previously unknown bimodal distribution in the SB stratum, indicating that there are two distinct populations of cells in this proliferative layer. It should be noted that, for each given experimental set-up, the error in determination of a phasor position depends only on the number of photons collected per pixel. The data presented here were acquired such that approximately the same average number of photons is collected at each depth of the viable epidermis, and only pixels with >200 counts are included in the analysis to avoid artifacts due to poor statistics.
Figure 4.
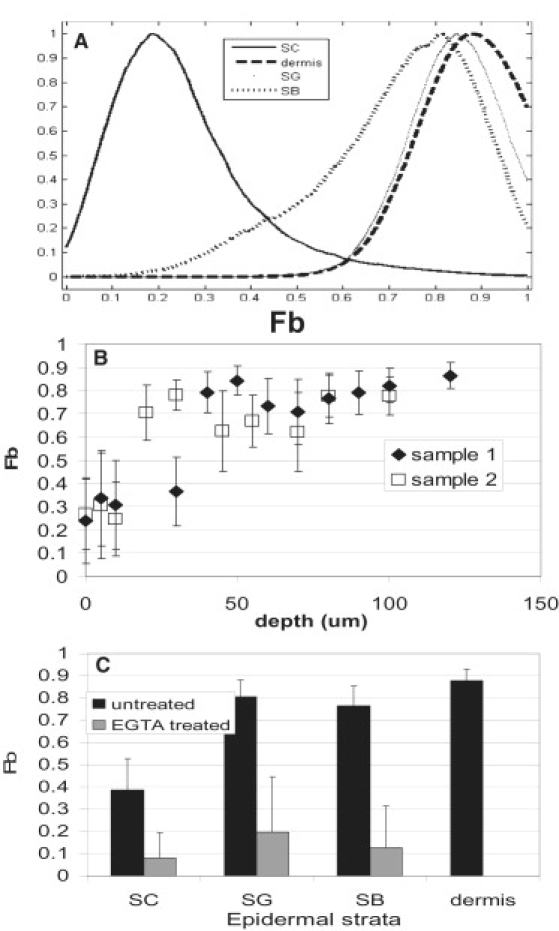
The distributions of the fraction of CG5N bound to calcium (Fb) at different depths in the epidermis show statistically significant differences in calcium concentration at different epidermal strata. (A) Fb distribution at different epidermal layers; B) average Fb as a function of depth in samples 1 (solid diamonds) and 2 (open squares). (C) Average Fb from unperturbed skin samples 1–3 (black bars) and from EGTA-treated skin (gray bars).
Fig. 4 B plots the average CG5N bound fraction (Fb) as a function of depth for two different skin samples. Although the two samples display similar behavior, sample 2 is shifted to the left with respect to sample 1, consistent with a thinner SC. By analyzing three different skin samples simultaneously, we find a clear increase in Fb from the SC to the SG (Fig. 4 C), a slight decrease in the SS/SB, and the maximum value in the dermis. As a control, we used 260 μM EGTA in the incubation media to chelate all free Ca2+. The average Fb measured in different strata (Fig. 4 C, gray bars) is significantly lower than that observed in unperturbed epidermis and remains constant throughout the sample. The clear shift of the phasor distributions from different epidermal strata indicates that there is a significant gradient of free Ca2+ in epidermis, supporting the results of previous studies (15,17).
Spatial distribution of calcium concentration in human epidermis
We used the phasor approach described above to quantify calcium concentration and visualize the spatial distribution of calcium concentrations in skin samples.
Fig. 5 shows the spatial distribution of ionized calcium concentrations in adult skin sample 1. Binning the Ca2+ into the four distinct calcium ranges indicated in the uppermost row of the figure, allowed us to track the Ca2+ gradient from the dermis through the SC. Fig. 5, A–D, shows how the chosen calcium ranges are selected by moving a circular cursor along the calcium calibration curve. The pixels with a calcium concentration in the range encompassed by the position of the cursor are highlighted in red in the fluorescence image.
In the SC (Fig. 5, E–H), we observe predominantly calcium concentrations of <3 μM (Fig. 5 E). In this layer, we are able to resolve the extracellular space and we observe a lower calcium concentration in the extracellular space than in the intracellular space (Fig. 5, E and F, respectively). In the SG (Fig. 5, I–L), a peak in the calcium concentration is observed as the dye saturation limit ([Ca2+] > 20 μM) is reached homogeneously over the whole image (Fig. 5 L), and no pixels with low calcium are observed (Fig. 5, I and J). In the SB (Fig. 5, M–P), we observe a spatially heterogeneous calcium distribution. The dye saturation limit is reached only in some of the cells (Fig. 5 P), whereas lower average calcium concentrations [Ca2+] = 5 ± 2 μM and [Ca2+] = 11 ± 4 μM are observed in other parts of the image (Fig. 5, N and O, respectively). Low calcium contributes negligibly to the overall signal in the SB (Fig. 5 M). In the dermis (Fig. 5, Q–T), the dye reaches its saturation limit homogeneously. We can summarize the results shown in Fig. 5 by building calcium distribution histograms for each layer (Fig. 6). Fig. 6 clearly shows that high (dye-saturating or >20 μM Ca2+) calcium is the predominant component of the calcium signal in the dermis. This high calcium component decreases through the SB and SS, increases to a local maximum in the SG, and dramatically drops in the SC. In contrast, low calcium is the predominant component of the calcium signal in the SC and drastically drops in the viable epidermis and dermis.
Discussion
The data presented above show that we were able to visualize and quantify the spatial distribution of calcium concentration in unfixed, unsectioned, ex vivo human epidermis using a minimally invasive experimental approach that relies on the sensitivity of the lifetime of the fluorescent dye CG5N to changes in calcium concentration.
Epidermal calcium gradient
The phasor approach described above allowed us to visualize the spatial location of the various calcium concentrations and to calculate the calcium concentration distributions found at different epidermal strata (Fig. 6). Several of our findings confirm those from previous studies of the Ca2+ gradient in unperturbed epidermis. We found that Ca2+ concentrations in the upper layers of the viable epidermis were higher than those in the unperturbed SC but lower than those seen in the dermis, in agreement with previous studies using PIXE (13). These findings imply that there are specific mechanisms that sequester Ca2+ in the viable epidermis, both preventing it from diffusing to the SC and concentrating the Ca2+ that diffuses from the dermis into the epidermis. Possible mechanisms that may prevent Ca2+ diffusion from the SG to the SC include both the lipid barrier and the tight junctions that are found in the SG (26,27). However, the fact that the viable epidermis contains higher Ca2+ concentrations than the SC but lower ones than the dermis argues against the single passive mechanism proposed by Elias et al. (26) of the epidermal permeability barrier acting as a sieve, and selectively allowing water, but not Ca2+, to leave the viable epidermis, as this single mechanism also would produce higher Ca2+ concentration in the epidermis than the dermis.
We find a much shallower Ca2+ gradient than previously reported in human epidermis. There are several possible explanations for this finding. First, previous studies measured total (i.e., free or ionized plus bound) Ca2+ concentrations, whereas this technique measures only free Ca2+. It may be that total Ca2+ concentrations continue to increase throughout the SS and SG, as Ca2+ is bound to proteins that constitute the cornified envelopes (28) and keratinohyalin granules (29), whereas free Ca2+ remains about the same. As an alternative, some free Ca2+ concentrations found in the epidermis may exceed the saturation point of the Ca2+ Green dye, leading us to underestimate the highest possible Ca2+ concentrations in the upper epidermis. However, the technique described in this article allows us to visualize a clear increase in average Ca2+ concentrations in the SG versus the SS and SB, and a clear decrease in Ca2+ concentrations in the SC versus the viable epidermal layers. Thus, we do not believe that dye saturation alone can explain these findings.
The most likely cause for the shallower Ca2+ gradient observed here is the marked heterogeneity in calcium distribution in the SB. Although some SB cells contain low Ca2+ concentrations, others display Ca2+ levels that overlap the relatively uniform high Ca2+ concentrations seen in the SG. Because intracellular Ca2+ in vitro predicts keratinocyte differentiation, this finding in vivo suggests that SB cells (but not SG cells) are in different stages of differentiation or proliferation. These data further suggest that the “Ca2+ switch” theory (14), according to which keratinocytes are stimulated to differentiate simply by responding to extracellular Ca2+, may require revision. Instead, keratinocytes may change their ability to respond to extracellular Ca2+ by changing the composition of plasma membrane ion channels that control Ca2+ permeability or by changing intracellular or plasma membrane Ca2+-sensing capacity (30,31).
The average free Ca2+ value is an average of extracellular, cytosolic, and organelle free Ca2+. If extracellular Ca2+ is close to serum (1 mM), we would expect much of the signal to come from this compartment. Thus, it initially was surprising that we measured little signal from the extracellular space. However, further morphologic studies using another water-soluble dye, BCECF, and lanthanum penetration electron microscopy studies also confirmed that there is very little space between adjacent keratinocytes, particularly as the cells progress from the SB to the SG (data not shown). This is consistent with studies reported previously using a different technique, the line-intersect method (32).
The contribution of the various extra- and intracellular compartments to the average total free calcium concentration can be expressed as
| (6) |
where Vi and [Ca2+]i indicate the volume and calcium concentration in the ith compartment. The subscripts “ex”, “or”, and “cy” indicate the extracellular space, the intracellular calcium stores, and the cytosol, respectively. We estimated Vex to range from 2% of the epidermal volume in the SG to 7% in the SB. Because of the small fractional volume it occupies, the extracellular space is unlikely to be responsible for the fourfold increase in total epidermal calcium observed in previous studies (15). We therefore conclude that the calcium gradient reported in this study and previous studies is generated by variations in the calcium concentration found in intracellular calcium stores. This interpretation of the measurements presented above agrees qualitatively well with the theoretical calculations of a previous report (33). This work ascribes the epidermal calcium gradient to a fourfold increase in the concentration of bound calcium (defined as the sum of nonionized calcium and calcium stored in organelles) between the proliferative and the granular layers of the epidermis, at the same time showing how the extracellular calcium concentration in intact epidermis is constant throughout the viable epidermis and does not significantly contribute to the epidermal calcium gradient. It should be noted that the “bound” Ca2+, as defined in the study by Cornelissen et al. (33), encompasses both nonionized Ca2+ and Ca2+ sequestered within organelles. Since our data imply that most of the ionized Ca2+ is in fact found within organelles, some of the gradient seen here as “free” Ca2+ would be encompassed within the Ca2+ classified as “bound” in their calculations. Although a more quantitative comparison between our findings and the Cornelissen et al. model is not possible at this time, because the saturation of the dye does not allow us to calculate average Ca2+ concentrations in the granular and basal layers, we believe that by demonstrating how the observed calcium gradient is attributable to variation in intracellular stores of Ca2+, our data support the proposed model.
Dynamic range of CG lifetime
Our approach is limited mainly by the narrow dynamic range of the calcium-sensitive dyes available commercially. CG5N was chosen because of its lifetime sensitivity to calcium changes in the low micromolar range. Fig. 1 shows that the dynamic range of the CG5N lifetime goes from ∼0.5 μM to 20 μM. CG5N lifetime increases with increasing calcium concentration. The dynamic range of CG5N lifetime is lower than that observed in fluorescence intensity measurements due to the difference in relative brightness between the calcium-bound and calcium-free species. The calcium concentration in biologic tissue, and specifically in human epidermis, has a much wider range, from hundreds of nanomolar in the cell cytosol to hundreds of micromolar in cellular calcium stores such as the ER and Golgi, to millimolar in the extracellular space. We therefore expected that the dye saturation limit would be reached in several regions of our samples and that consequently we would not be able to calculate the average calcium concentration in those areas. However, the Fb versus depth curves shown in Fig. 5, B and C, reflect the changes in average calcium concentration with depth. In the SG, the saturation limit of the dye is reached homogeneously throughout the image, indicating an average calcium concentration >20 μM. The fact that we detect such a high calcium concentration intracellularly in both the SG and some of the cells in the SB indicates that we are measuring a calcium signal from intracellular calcium stores such as the ER and the Golgi, as well.
Error propagation in the determination of calcium concentrations
We note that like all indicators, CG5N has a region of maximum sensitivity around the Kd value, which is given by the shape of the equilibrium curve. At the extremes of the equilibrium curve, the error in determination of Ca2+ concentration is large. However, the phasor approach has the additional advantages that the phasors are additive and the errors propagate in a predictable way all along the calibration curve, in contrast to the decomposition of the decay curve in exponential components, in which case the values of the exponentials and their fractional contributions show errors that are not independent. Furthermore, we note that the determination of the extreme values of the calibration curve is done using a large number of phasor points. This is equivalent to the center-of-mass determinations of the phasor positions, which is done with great precision. This consideration allowed us to confidently determine the concentration of Ca2+ at the extremes of the calibration curve.
Conclusions
We have presented an experimental approach to the study of calcium gradients in living tissue based on a combination of two-photon microscopy, FLIM, and phasor analysis of the data. We show that this experimental approach allows us to measure calcium variations in different strata of human epidermis with subcellular resolution, thus revealing heterogeneity in average intracellular calcium in the lower epidermal layers, which has not previously been reported. This approach reveals that the extracellular space in epidermis is much narrower than previously thought, localizes most epidermal Ca2+ to intracellular ER and Golgi stores, and detects a previously unknown bimodal distribution of Ca2+ concentrations in the proliferative epidermal basal layer which might be related to different stages of cellular differentiation or proliferation. These new experimental data suggest that long-held hypotheses about how Ca2+ signaling controls epidermal differentiation may require revision. The phasor approach to the study of ion concentrations, described above, provided immediate visual access to the raw FLIM data, thus allowing global analysis of multiple data sets without requiring analytical fitting of the fluorescence decays. This in turn results in a solid, in-tissue dye calibration and identification of contributions to the signal from other fluorescent species, which are crucial to minimizing artifactual interpretation of the data.
We believe the approach described here to be generally applicable to the study of ionic gradients in living tissue.
Supporting Material
One figure is available at http://www.biophysj.org/biophysj/supplemental/S0006-3495(09)01736-6.
Supporting Material
Acknowledgments
The authors thank Debra Crumrine for expert technical assistance.
This work was supported by National Institutes of Health grants AR051930 (T.M.), P41-RR003155, and P50 GM076516-029001 (E.G.).
References
- 1.Zou A.P., Cowley A.W. Reactive oxygen species and molecular regulation of renal oxygenation. Acta Physiol. Scand. 2003;179:233–241. doi: 10.1046/j.0001-6772.2003.01206.x. [DOI] [PubMed] [Google Scholar]
- 2.Zalyapin E.A., Bouley R., Ausiello D.A. Effects of the renal medullary pH and ionic environment on vasopressin binding and signaling. Kidney Int. 2008;74:1557–1567. doi: 10.1038/ki.2008.412. [DOI] [PMC free article] [PubMed] [Google Scholar]
- 3.van Donkelaar C.C., Janssen X.J., de Jong A.M. Distinct developmental changes in the distribution of calcium, phosphorus and sulphur during fetal growth-plate development. J. Anat. 2007;210:186–194. doi: 10.1111/j.1469-7580.2006.00680.x. [DOI] [PMC free article] [PubMed] [Google Scholar]
- 4.Boyett M.R., Honjo H., Kodama I. The sinoatrial node, a heterogeneous pacemaker structure. Cardiovasc. Res. 2000;47:658–687. doi: 10.1016/s0008-6363(00)00135-8. [DOI] [PubMed] [Google Scholar]
- 5.Digman M.A., Caiolfa V.R., Gratton E. The phasor approach to fluorescence lifetime imaging analysis. Biophys. J. 2008;94:L14–L16. doi: 10.1529/biophysj.107.120154. [DOI] [PMC free article] [PubMed] [Google Scholar]
- 6.Jameson D.M., Gratton E., Alpert B. Oxygen distribution and migration within Mbdes Fe and Hbdes Fe. Multifrequency phase and modulation fluorometry study. Biophys. J. 1984;45:795–803. doi: 10.1016/S0006-3495(84)84224-1. [DOI] [PMC free article] [PubMed] [Google Scholar]
- 7.Bunse T., Steigleder G.K., Gonsior B. PIXE analysis in uninvolved skin of atopic patients and aged skin. Acta Derm. Venereol. 1991;71:287–290. [PubMed] [Google Scholar]
- 8.Menon G.K., Elias P.M. Ultrastructural localization of calcium in psoriatic and normal human epidermis. Arch. Dermatol. 1991;127:57–63. [PubMed] [Google Scholar]
- 9.Pallon J., Malmqvist K.G., Forslind B. Pixe analysis of pathological skin with special reference to psoriasis and atopic dry skin. Cell Mol. Biol. (Noisy-le-grand) 1996;42:111–118. [PubMed] [Google Scholar]
- 10.Lee S.H., Elias P.M., Feingold K.R. Calcium and potassium are important regulators of barrier homeostasis in murine epidermis. J. Clin. Invest. 1992;89:530–538. doi: 10.1172/JCI115617. [DOI] [PMC free article] [PubMed] [Google Scholar]
- 11.Elias P.M., Nau P., Feingold K.R. Formation of the epidermal calcium gradient coincides with key milestones of barrier ontogenesis in the rodent. J. Invest. Dermatol. 1998;110:399–404. doi: 10.1046/j.1523-1747.1998.00151.x. [DOI] [PubMed] [Google Scholar]
- 12.Menon G.K., Elias P.M., Feingold K.R. Localization of calcium in murine epidermis following disruption and repair of the permeability barrier. Cell Tissue Res. 1992;270:503–512. doi: 10.1007/BF00645052. [DOI] [PubMed] [Google Scholar]
- 13.Behne M.J., Tu C.L., Mauro T.M. Human keratinocyte ATP2C1 localizes to the Golgi and controls Golgi Ca2+ stores. J. Invest. Dermatol. 2003;121:688–694. doi: 10.1046/j.1523-1747.2003.12528.x. [DOI] [PubMed] [Google Scholar]
- 14.Hennings H., Michael D., Yuspa S.H. Calcium regulation of growth and differentiation of mouse epidermal cells in culture. Cell. 1980;19:245–254. doi: 10.1016/0092-8674(80)90406-7. [DOI] [PubMed] [Google Scholar]
- 15.Mauro T., Bench G., Cullander C. Acute barrier perturbation abolishes the Ca2+ and K+ gradients in murine epidermis: quantitative measurement using PIXE. J. Invest. Dermatol. 1998;111:1198–1201. doi: 10.1046/j.1523-1747.1998.00421.x. [DOI] [PubMed] [Google Scholar]
- 16.Tsutsumi M., Denda S., Denda M. Calcium ion gradients and dynamics in cultured skin slices of rat hindpaw in response to stimulation with ATP. J. Invest. Dermatol. 2009;129:584–589. doi: 10.1038/jid.2008.299. [DOI] [PubMed] [Google Scholar]
- 17.Denda M., Tsuchiya T., Feingold K.R. Stress alters cutaneous permeability barrier homeostasis. Am. J. Physiol. Regul. Integr. Comp. Physiol. 2000;278:R367–R372. doi: 10.1152/ajpregu.2000.278.2.R367. [DOI] [PubMed] [Google Scholar]
- 18.Turner N.G., Cullander C., Guy R.H. Determination of the pH gradient across the stratum corneum. J. Investig. Dermatol. Symp. Proc. 1998;3:110–113. doi: 10.1038/jidsymp.1998.23. [DOI] [PubMed] [Google Scholar]
- 19.Agronskaia A.V., Tertoolen L., Gerritsen H.C. Fast fluorescence lifetime imaging of calcium in living cells. J. Biomed. Opt. 2004;9:1230–1237. doi: 10.1117/1.1806472. [DOI] [PubMed] [Google Scholar]
- 20.Szmacinski H., Lakowicz J.R. Possibility of simultaneously measuring low and high calcium concentrations using Fura-2 and lifetime-based sensing. Cell Calcium. 1995;18:64–75. doi: 10.1016/0143-4160(95)90046-2. [DOI] [PMC free article] [PubMed] [Google Scholar]
- 21.Lakowicz J.R. Emerging applications of fluorescence spectroscopy to cellular imaging: lifetime imaging, metal-ligand probes, multi-photon excitation and light quenching. Scanning Microsc. Suppl. 1996;10:213–224. [PubMed] [Google Scholar]
- 22.Hanson K.M., Behne M.J., Clegg R.M. Two-photon fluorescence lifetime imaging of the skin stratum corneum pH gradient. Biophys. J. 2002;83:1682–1690. doi: 10.1016/S0006-3495(02)73936-2. [DOI] [PMC free article] [PubMed] [Google Scholar]
- 23.Behne M.J., Meyer J.W., Mauro T.M. NHE1 regulates the stratum corneum permeability barrier homeostasis. Microenvironment acidification assessed with fluorescence lifetime imaging. J. Biol. Chem. 2002;277:47399–47406. doi: 10.1074/jbc.M204759200. [DOI] [PubMed] [Google Scholar]
- 24.Kuchibhotla K.V., Lattarulo C.R., Bacskai B.J. Synchronous hyperactivity and intercellular calcium waves in astrocytes in Alzheimer mice. Science. 2009;323:1211–1215. doi: 10.1126/science.1169096. [DOI] [PMC free article] [PubMed] [Google Scholar]
- 25.Yoshiki K., Azuma H., Araki T. Finding of optimal calcium ion probes for fluorescence lifetime measurement. Opt. Rev. 2005;12:415–419. [Google Scholar]
- 26.Elias P., Ahn S., Feingold K.R. Origin of the epidermal calcium gradient: regulation by barrier status and role of active vs passive mechanisms. J. Invest. Dermatol. 2002;119:1269–1274. doi: 10.1046/j.1523-1747.2002.19622.x. [DOI] [PubMed] [Google Scholar]
- 27.Turksen K., Troy T.C. Permeability barrier dysfunction in transgenic mice overexpressing claudin 6. Development. 2002;129:1775–1784. doi: 10.1242/dev.129.7.1775. [DOI] [PubMed] [Google Scholar]
- 28.Rice R.H., Green H. Presence in human epidermal cells of a soluble protein precursor of the cross-linked envelope: activation of the cross-linking by calcium ions. Cell. 1979;18:681–694. doi: 10.1016/0092-8674(79)90123-5. [DOI] [PubMed] [Google Scholar]
- 29.Markova N.G., Marekov L.N., Steinert P.M. Profilaggrin is a major epidermal calcium-binding protein. Mol. Cell. Biol. 1993;13:613–625. doi: 10.1128/mcb.13.1.613. [DOI] [PMC free article] [PubMed] [Google Scholar]
- 30.Tu C.L., Chang W., Bikle D.D. The extracellular calcium-sensing receptor is required for calcium-induced differentiation in human keratinocytes. J. Biol. Chem. 2001;276:41079–41085. doi: 10.1074/jbc.M107122200. [DOI] [PubMed] [Google Scholar]
- 31.Tu C.L., Chang W., Bikle D.D. Inactivation of the calcium sensing receptor inhibits E-cadherin-mediated cell-cell adhesion and calcium-induced differentiation in human epidermal keratinocytes. J. Biol. Chem. 2008;283:3519–3528. doi: 10.1074/jbc.M708318200. [DOI] [PubMed] [Google Scholar]
- 32.Elias P., Leventhal M. Intercellular volume changes and cell surface expansion during cornification. Clin. Res. 1979;25:525a. (Abstr.) [Google Scholar]
- 33.Cornelissen L.H., Oomens C.W., Baaijens F.P. Mechanisms that play a role in the maintenance of the calcium gradient in the epidermis. Skin Res. Technol. 2007;13:369–376. doi: 10.1111/j.1600-0846.2007.00239.x. [DOI] [PubMed] [Google Scholar]
Associated Data
This section collects any data citations, data availability statements, or supplementary materials included in this article.