

Abstract
Direct visualization of the mechanism(s) by which peptides induce localized changes to the structure of membranes has high potential for enabling understanding of the structure-function relationship in antimicrobial and cell-penetrating peptides. We have applied a combined imaging strategy to track the interaction of a model antimicrobial peptide, PFWRIRIRR-amide, with bacterial membrane-mimetic supported phospholipid bilayers comprised of POPE/TOCL. Our in situ studies revealed rapid reorganization of the POPE/TOCL membrane into localized TOCL-rich domains with a concomitant change in the organization of the membranes themselves, as reflected by changes in fluorescent-membrane-probe order parameter, upon introduction of the peptide.
Introduction
The ability of short cationic peptides to penetrate cell membranes has led to significant interest in their use as antimicrobial (AMPs) and cell-penetrating agents. Most AMPs are expressed from genes involved in the innate defense of various organisms and are capable of preventing the invasion of pathogenic microorganisms (1). The apparent inability of bacteria to develop resistance to these systems makes them attractive therapeutic candidates (2). Understanding the link between the structure and mechanisms of action of these peptides is therefore of particular interest for the de novo design of targeted AMPs. Most AMPs are believed to cause membrane permeabilization through one of three possible routes: carpet (3), barrel-stave pore (4), or toroidal pore (5), although other mechanisms that do not involve perforation may exist, including membrane crowding. Identifying whether the AMPs target specific membrane components and whether they themselves induce specific restructuring of the membrane is of particular interest. Although lateral inhomogeneities commonly referred to as membrane domains are recognized to exist in mammalian systems, recent evidence has suggested that similar structures also exist in bacterial membranes (6–16). Moreover, there is increasing evidence that the efficacy of some cationic antimicrobial agents is determined by their effects on membrane domains (17–25). To date, evidence of such phenomena, which may include clustering of the cationic antimicrobial peptide with certain anionic lipids, has been obtained from differential scanning calorimetry, nuclear magnetic resonance, and freeze-fracture microscopy studies (17,19–21).
We previously used simultaneous correlated in situ atomic force (AFM) and fluorescence microscopy to investigate peptide-membrane interactions using substrate-supported phospholipid bilayers (SPBs) as membrane-mimetic substrates (26–28). Coupling these imaging modalities for the study of SPBs provides an effective means of overcoming the key limitations of the individual techniques. For example, AFM is well suited for resolving molecular-scale topographical details at surfaces; however, it is limited in its ability to image structures that do not provide sufficient topographical contrast, such as peptides that have inserted into a membrane. AFM, as conventionally practiced, also lacks chemical specificity and thus one often identifies structures solely based on size and shape. Conversely, optical microscopy has traditionally been a diffraction-limited technique, relying heavily on the use of fluorescent reporter molecules. With a hybrid scanning probe-optical imaging system, complementary information is acquired by both techniques and can be spatially correlated to provide a clearer picture of molecular-level peptide-membrane interactions (29–32). Furthermore, differences in optical properties such as emission wavelength (33–38), fluorescence lifetime (39–41), or, as we report here, the linear dichroism/polarization anisotropy (42–48) of the reporter fluorophores, can be exploited to obtain additional quantitative and dynamic insights into the environment surrounding the probe (49). The temporal resolution of optical imaging and spectroscopy is also a clear advantage over the slower raster-scanning AFM. Using polarized total internal reflection fluorescence microscopy (pTIRFM), an orientational order parameter, 〈P2〉, can be calculated that reflects the time- and ensemble-averaged orientational order of a collection of fluorescent probe molecules (47,50–54), in direct analogy to that reported by other orientation-sensitive spectroscopies (55–58). This approach allows one to create spatial maps of the (probe concentration-independent) order parameter image 〈P2〉 that, in a coupled AFM-fluorescence system, can then be correlated against specific topographical features. Spatio-temporal changes in 〈P2〉 can be used to examine time-dependent orientational order changes in the environment surrounding the fluorescent probes. Such changes may arise from alterations to the local membrane composition, domain restructuring, and membrane remodeling, or through the action of enzymes or peptides that specifically interact with membrane components.
Our earlier studies of the model antimicrobial peptide indolicidin (47,59), prompted us to apply these tools to characterize the interactions of a model small cationic peptide, PFWRIRIRR-amide (PR-9), that has shown potent antimicrobial activity only against Gram-positive bacteria that contain neutral or zwitterionic lipids as well as anionic lipids, suggesting a role for the clustering of anionic lipids by this agent (R. F. Epand and R. M. Epand, unpublished work). Upon interaction with model SPBs containing cardiolipin and phosphoethanolamine, our studies revealed that PR-9 induces the formation of cardiolipin-rich domains with a concomitant reduction in the ordering of the lipid acyl tails. This remodeling effect results in structural instabilities in the model membranes, consistent with recent studies suggesting phase separation as an alternative mechanism of antimicrobial peptide action (16,19,60).
Materials and Methods
Materials
The synthetic lipids 1-palmitoyl-2-oleoyl-sn-glycero-3-phosphoethanolamine (POPE, 16:0–18:1) and 1′,3′-bis[1,2-dioleoyl-sn-glycero-3-phospho]-sn-glycerol (TOCL, 18:1), along with beef heart cardiolipin, were purchased from Avanti Polar Lipids (Alabaster, AL) and used without further purification. Two mg (total) of POPE and TOCL lipids in a 3:1 molar ratio were dissolved in 2:1 chloroform/methanol (v/v) and transferred into a clean glass centrifuge tube. The solvent was removed under a stream of nitrogen gas and then placed in a vacuum desiccator for 3 h. The dried lipid film was then sealed under Argon gas and stored at −20°C. The fluorescent lipophilic probes 10-nonyl-acridine orange (NAO) and 1,1′-di-eicosanyl-3,3,3′,3′-tetramethylindocarbocyanine perchlorate (DiI-C20) were purchased from Invitrogen/Molecular Probes (Oakville, Ontario, Canada) and Molecular Targeting Technologies (West Chester, PA), respectively, dissolved in pure ethanol at a concentration of 0.5 mg/mL and stored in glass vials at −4°C capped under nitrogen gas. The chemical structures of the lipids and fluorescent probes used in this study are shown in Fig. 1. The antimicrobial peptide, PFWRIRIRR-amide (PR-9), synthesized with C-terminal amidation and purified to >95%, was purchased from SynBioSci (Livermore, CA). The PR-9 peptide was dissolved at a concentration of 1.34 mg/mL in pH 7.4 PIPES aqueous buffer (20 mM PIPES, 140 mM NaCl, 1 mM EDTA) prepared using ultrapure Milli-Q water (Millipore, Billerica, MA), and subsequently stored in a glass vial at −20°C. Before use, the stock AMP solution was gently warmed up to room temperature and vortexed for 5 s.
Figure 1.
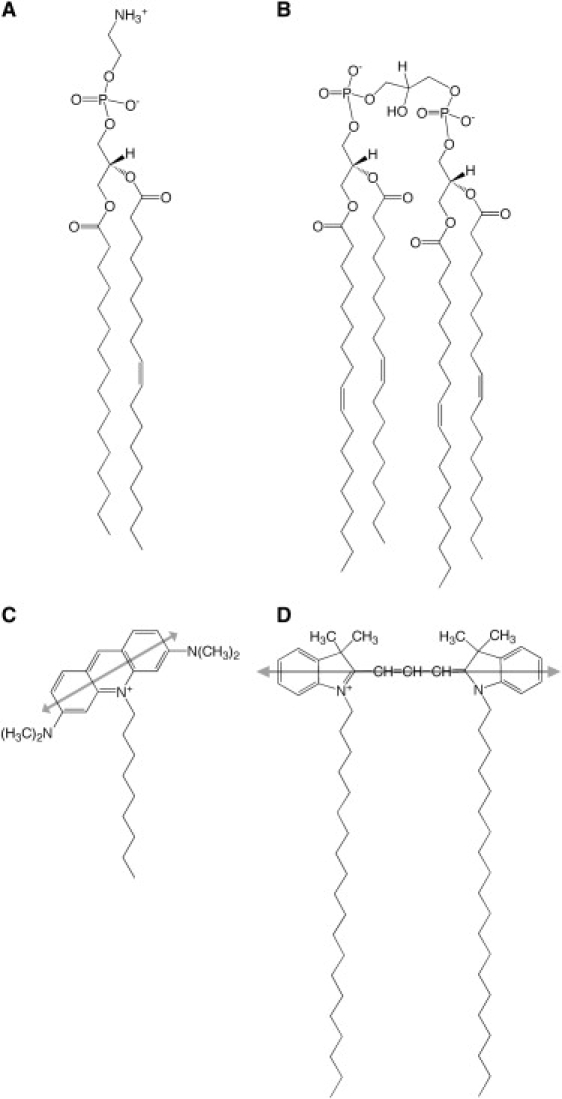
Chemical structures of the synthetic lipids and fluorescent membrane probes used in this study. (A) POPE, (B) TOCL, (C) NAO, and (D) DiI-C20. The shaded double arrows in panels C and D indicate the approximate orientation of the main electronic transition dipole moment with respect to the chromophore structure of the fluorescent probe.
Substrate-supported lipid bilayer formation
SPBs composed of 3:1 POPE/TOCL were created by the method of vesicle fusion (61–63). First, small unilamellar vesicle (SUV) suspensions were prepared by rehydrating the 3:1 POPE/TOCL lipid films with pH 7.4 HEPES aqueous buffer (10 mM HEPES, 150 mM NaCl) to concentration of ∼1 mM and sonicating at 50°C for 20 min. SUV suspensions were stored at −4°C in 1.5-mL plastic microfuge tubes for up to one week. On the day of a pTIRFM/AFM imaging experiment, 3:1 POPE/TOCL substrate-supported phospholipid bilayers (SPBs) were prepared by sequentially depositing 100 μL of the SUV suspension and 2.9 mL of pH 7.4 aqueous HEPES buffer onto freshly cleaved mica (Structure Probe, West Chester, PA) affixed to a 170-μm-thick, 50-mm-diameter glass-bottom culture dish (WillCoWells, Amersterdam, The Netherlands), with optical adhesive #63 from Norland Products (Cranbury, NJ). A detailed protocol describing the construction of mica-glass substrates for SPB imaging experiments has been reported previously (64). After standing at room temperature for 15 min, the sample chamber was washed 10 times with 1-mL aliquots of HEPES buffer to either remove excess SUVs in solution or prevent them from adhering to the bilayer surface, ensuring the total solution volume in the chamber was 3 mL at all times. In most experiments, the upper leaflet of the SPBs (i.e.: the leaflet furthest away from the supporting substrate) was labeled with the fluorescent lipid probes NAO or DiI-C20 using the following protocol. The fluorescent lipid probes in ethanol were diluted 1000-fold in pH 7.4 HEPES buffer and 25 μL of the solution then injected into the sample chamber after removal of 25 μL of the chamber solution. After gentle flushing with 3 mL of HEPES buffer, the sample chamber was attached to the microscope stage using custom magnetic holders.
Combined pTIRFM/AFM imaging
The combined pTIRFM/AFM instrument and its use for SPB imaging was recently reported by us (47,65). In brief, the AFM raster-scans over the upper surface of the SPB, generating a topographical image with subnanometer vertical resolution and nanometer lateral resolution. Depending on the bilayer composition and imaging conditions, lipid domains may be resolved as local variations in bilayer thickness arising from differences in acyl-chain packing (66–71). In pTIRFM, a polarized beam of light is directed through the periphery of a high-numerical-aperture microscope objective lens such that the beam undergoes total internal reflection at the substrate-sample solution interface. The resulting surface-traveling evanescent wave penetrates ∼250 nm or less into the sample. Fluorescence-detected linear dichroism images of a fluorescently labeled SPB are acquired by capturing images with an electron-multiplying charge-coupled device (EMCCD) camera under equal intensity substrate perpendicular (p-polarized) and substrate parallel (s-polarized) excitation. A right-handed sample coordinate system is defined with the z direction normal to the substrate interface (parallel to the microscope objective optical axis), and the x direction oriented along the direction of travel of the evanescent field wavefront at the substrate-solution interface. Under uniaxial symmetry, as is usually the case for flat SPBs, the pTIRFM order parameter (originally derived by Thompson et al. (51) using a semiclassical treatment of light-matter interactions), 〈P2〉, can be calculated on a per-pixel basis using the equation
| (1) |
where Ix, Iy, and Iz are the squares of the x-, y-, and z-direction evanescent electric-field vector amplitudes, respectively, calculated using the Fresnel equations of physical optics when the angle of incidence (α) of the illuminating TIRF beam and the relative index of refraction (n = n1/n2) between the mica substrate (n2) and the sample solution (n1) are known (51,72). The fluorescence-detected dichroic ratio, RFD, is the ratio of the fluorescence intensity values (F) for a region of interest (ROI) under total internal reflection illumination with p-polarized and s-polarized excitation light,
| (2) |
and is analogous to the absorption dichroic ratio reported in polarized attenuated total internal reflection Fourier transform infrared spectroscopy (57,58,73,74). The RFD image is generated by pixelwise division of the Fp and Fs images. Because the RFD image is a ratio of two images captured under different illumination polarizations, factors that affect the absolute fluorescence intensity, such as local probe concentration and quantum yield, cancel out (50,54). The RFD image thus reflects only molecular factors that affect the orientational order of the probes within a given pixel. The pTIRFM order parameter 〈P2〉 image is calculated by applying Eq. 1 at every pixel in the RFD image. If the angle of incidence of the illuminating TIR beam is set to the critical angle (α = αc) of the substrate-solution interface, the illumination beam travels horizontally and parallel to the interface, and the x component of the evanescent electric-field vector vanishes (Ix→0). Equation 1 then assumes the following simpler and more compact form,
| (3) |
where G = 1/RFD. A common interpretation of 〈P2〉 is that it is the first nontrivial term in an infinite series expansion of Legendre polynomials that describe the fluorescent probe's orientation probability distribution function (75)
| (4) |
where θ is the polar tilt angle that the fluorescent probe's absorption transition dipole moment makes with the substrate normal. The angled brackets around θ denote an ensemble average over all fluorescent molecules within the detection volume and over the timescale associated with light absorption. It is important to note that order parameter measurements by an orientation-sensitive technique such as pTIRFM only partially characterize the true probe-orientation-distribution function. Although other models of the physical interpretation of 〈P2〉 are possible, their limitations are discussed in Oreopoulos and Yip (47) and references contained therein.
pTIRFM/AFM imaging protocol
The pTIRFM/AFM imaging protocol of a 3:1 POPE/TOCL SPB was as follows: an ROI of a SPB labeled with NAO or DiI-C20 was brought into focus under total internal reflectance illumination. The EMCCD camera exposure time was set at 200 ms and the multiplication gain set to 3500. The pTIRFM polarization angle (p- or s-polarization) that yielded maximal fluorescence intensity was identified by inspection and viewed in the camera software's preview mode. The incident-excitation beam laser power was adjusted (0.25–0.50 mW) such that this image's brightest feature pixel-intensities were just below the camera's 16-bit linear-dynamic-range saturation level with the camera exposure and gain sensitivity levels held constant. The p- and s-polarized pTIRFM images were sequentially acquired at these laser power and camera settings. Immediately after pTIRFM image capture, the prealigned AFM was engaged to the sample surface and a 20 × 20 μm AFM image of the central area within the same TIRF-illuminated ROI was acquired.
The microscope was then switched back to pTIRFM imaging mode and the EMCCD multiplication gain increased to 3900. The illumination laser power was reduced such that the pixel intensities in the camera software preview mode were below saturation. A 30-μL aliquot of PR-9 dissolved in PIPES buffer solution was injected into the sample chamber while simultaneously acquiring time-lapse pTIRFM images (200-ms exposures, 750 frames; p-polarization for NAO, s-polarization for DiI-C20). Three different AMP aliquot stock concentrations were tested: (I) 1.34 mg/mL; (II) 0.67 mg/mL; and (III) 0.20 mg/mL. Because the total sample volume was maintained at 3 mL, the final diluted AMP concentrations in the sample imaging chamber were: (I′) 13 μg/mL; (II′) 6.7 μg/mL; and (III′) 2.0 μg/mL. After the time-lapse pTIRFM image acquisition, the same combined pTIRFM/AFM image series described earlier was acquired on the same ROI. If significant photobleaching occurred during time-lapse pTIRFM imaging, a different ROI of the same sample was randomly selected and examined using the same combined imaging procedure.
In a separate series of experiments, unlabeled SPBs composed of 3:1 POPE/TOCL were imaged by time-lapse AFM alone. First, five different 20 μm × 20 μm ROIs were scanned before adding the 30-μL aliquot of the AMP at concentrations I, II, or III. After acquiring the fifth image, the AMP aliquot was injected into the imaging chamber shortly after the repeat scan of the same ROI. If possible, the same ROI was imaged continuously for a maximum of 120 min. If AFM tracking was lost during this time, a randomly selected ROI in the same sample was imaged for the duration of the time.
All AFM images were obtained using tapping-mode in aqueous pH 7.4 HEPES buffer using short-thin 125-μm V-shaped DNP-S tips (Nanoprobes, Veeco, Santa Barbara, CA) driven at a tip oscillation frequency of ∼8.5 kHz, and a drive amplitude setpoint of 0.3–0.2 V using a Digital Instruments/Veeco Bioscope scanning probe microscope equipped with a dual-range G scanner and interfaced with a Nanoscope IIIA controller (Veeco Metrology, Santa Barbara, CA). All AFM images were acquired using Nanoscope software (Ver. 5.30r1) as 512 × 512 pixel images at a scan rate of 1 Hz (Digital Instruments, Gujarat, India). All pTIRFM images were acquired on a homebuilt free-space three-laser TIR illumination system constructed around an IX-70 inverted microscope using a PLAN-APO 60× 1.45 numerical-aperture microscope objective (Olympus, Center Valley, PA) and a Cascade II 512B EMCCD camera (512 × 512 pixels, 16 × 16 μm pixel size; Photometrics, Tucson, AZ) (47). Polarization optics were inserted into the excitation path of the optical train and allowed the illuminating light's polarization angle to be switched between p- and s-polarized. For these studies, NAO and DiI-C20 excitation was provided by a 532-nm diode pumped, solid-state laser. Fluorescence was viewed through a filter cube outfitted with a 565-nm dichroic mirror and a 565–605-nm emission bandpass filter. The polarization extinction ratio was measured to be 127:1 at the objective (72). The pTIRFM images were captured using the open-source camera driver software μManager (Ver. 1.2.32, (76)). The EMCCD camera was shut off during AFM imaging to avoid vibration artifacts caused by the camera's cooling fan. All experiments were performed at room temperature.
pTIRFM/AFM image postprocessing
All AFM images were subjected to a zero-order flattening and an x-axis second-order plane-fit filter using Digital Instruments/Veeco Nanoscope software (Ver. 30r1). Height-line-profile analyses were performed using the Nanoscope software's Section Analysis tool. The p- and s-polarized pTIRFM intensity images are presented in grayscale with equal brightness and contrast settings within each pTIRFM/AFM image set. The pTIRFM order parameter images were calculated using an in-house-written NIH ImageJ (http://rsb.info.nih.gov/ij/, Ver. 1.43e) macro that is available upon request. Using the two Fp and Fs pTIRFM images, the total internal reflectance illumination beam angle of incidence (α), and the substrate/buffer solution relative index of refraction (n) as inputs (α = 60°; n = 0.84 corresponding to Iy = 3.95 and Iz = 5.49), the macro subtracts the background from each image and determines the RFD image by pixelwise division. For each pixel, 〈P2〉 was evaluated using Eq. 3 and plotted as a new 32-bit floating-point value image. The resulting order parameter image was then color-coded using ImageJ's “Fire” look-up table. The look-up table contrast was stretched to cover the full range of 〈P2〉 values in the order parameter images, both before and after the addition of the AMP. To illustrate the distribution and range of 〈P2〉 values obtained for each case, one-dimensional image histograms were computed and presented with the order parameter images. Statistical analysis of the order parameter images was carried out using ImageJ's built-in image threshold and measure functions. The time-lapse pTIRFM image sequences were analyzed using ImageJ's built-in particle analysis functions.
Results
Lipid bilayers formed by direct fusion of 3:1 POPE/TOCL vesicles on mica and subsequently labeled with NAO exhibited uniform fluorescence and topography when examined by correlated pTIRFM/AFM (Fig. 2, A–D). We did not observe any phase separation or domains before addition of the PR-9 peptide. Close inspection of smaller 1 μm × 1 μm regions of the SPBs by AFM did not reveal any evidence of suboptical diffraction-limit-sized or topographically distinct domains (see Fig. S1 in the Supporting Material). As NAO is known to associate with TOCL (7,77), the uniform fluorescence in the Fp and Fs pTIRFM images suggests that the TOCL was evenly mixed with the POPE lipids before peptide addition. The corresponding pTIRFM order parameter images were similarly uniform, exhibiting a normally distributed pixel-average 〈P2〉 value of 0.15 ± 0.01, measured over several ROIs and replicate samples (Fig. 2 C).
Figure 2.
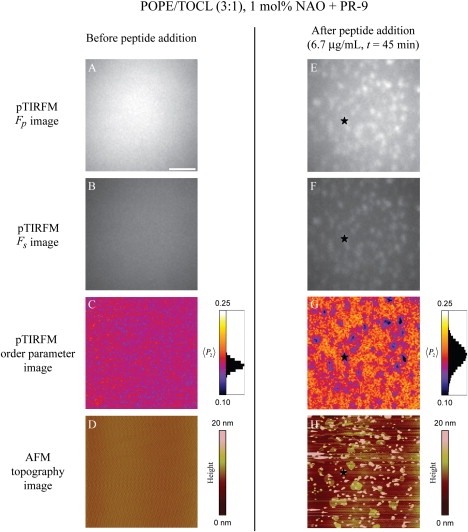
Combined pTIRFM/AFM image set of the same 20 × 20-μm ROI of a 3:1 POPE/TOCL SPB fluorescently labeled with NAO before and after the addition of PR-9 (image chamber concentration of 6.7 μg/mL). (A, B, E, and F) The p-/s-polarized pTIRFM images of the sample before and after the addition of the peptide, respectively. These intensity images are presented with equal contrast settings. (C and G) Calculated pTIRFM order-parameter images of the sample before and after the addition of the AMP. The image contrast of the two order-parameter images is stretched to cover the full range of 〈P2〉 pixel values present in both images. (D and H) Corresponding AFM images of the SPB before and after the addition of the AMP. The star symbols (∗) in panels E–H are meant as guides for the reader's eye to identical xy locations in the after-peptide-addition images. Scale bar = 5 μm.
Having established the baseline fluorescence and topography of the 3:1 POPE/TOCL bilayers in the absence of PR-9, we then examined how the physical state of the bilayer was altered upon exposure to PR-9. Three different PR-9 concentrations were tested and time-lapse pTIRFM images of SPBs fluorescently labeled with NAO were captured as a small aliquot of the peptide was injected into the sample chamber. (See Movie S1, Movie S2, and Movie S3 in the Supporting Material.) Upon introduction of PR-9 at a sample chamber concentration of (I′) 13 μg/mL, bright spots ranging in size from diffraction-limited spots to a few micrometers in diameter rapidly appeared (transition from one 200-ms frame to the next, 0.6 s after the initial peptide aliquot injection). At lower peptide concentrations of (II′) 6.7 μg/mL and (III′) 2.0 μg/mL, the same phenomena were observed although the time required for the spots to appear was significantly longer, ∼3.2–7.8 s after introduction of the peptide. The rapid nucleation and growth of these spots at the higher peptide concentrations (I′, II′) precluded stable imaging and analysis. It was only at the lowest peptide concentration (III′) that the nucleation and growth of these bright spots could be reliably monitored and analyzed (Fig. 3). Here we found that the areal growth rate of the larger spots was ∼1.0–3.0 μm2/s (Fig. 3, B and C). Smaller spots that were equal to or just over the diffraction limit of detection appeared 15–20 s after the initial nucleation of the larger spots. On rare occasions, some spots shrank slightly in size over time; however, the general trend was for stable growth.
Figure 3.
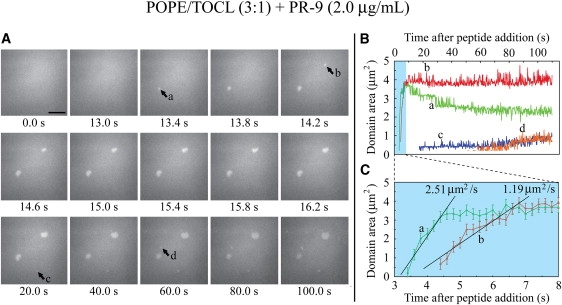
Time-lapse pTIRFM image sequence of a 3:1 POPE/TOCL SPB fluorescently labeled with NAO as PR-9 is introduced into the imaging chamber at a final concentration of 2.0 μg/mL. (A) Selected time-stamped frames from the entire sequence are presented. The PR-9 aliquot is injected into the sample chamber at frame 50 (t = 10 s). Several bright spots (labeled a–d) that emerge during the sequence are indicated. Scale bar = 5 μm. (B) Plot of bright spot area versus time. (C) Enlarged plot of the shaded region in (B) showing that the initial growth of the larger spots in panel A (spots a and b) proceeded at different rates.
To determine whether the pTIRFM-resolved bright spots seen after PR-9 peptide addition were laterally phase-separated lipid domains, we examined the matching AFM images, finding that the bright areas corresponded to topographically distinct rounded domains that extended ∼3.0–3.5 nm above the surrounding contiguous phase (Fig. 2, E–H). The AFM images were also populated by numerous smaller ∼100–500-nm diameter circular structures that were well over 35 nm in height with respect to the membrane surface. These features were located on top of both the domains and the surrounding lower topography lipid phase. We were unable to resolve any finer topographical structures (i.e., structured/oriented protein aggregates) within the domains or the surrounding contiguous phase by AFM. The calculated pTIRFM order parameter images of the 3:1 POPE/TOCL SPBs after PR-9 exposure revealed a spatially heterogeneous distribution of 〈P2〉 values (Fig. 2 G). The bright spots in the pTIRFM images corresponding to the taller/higher domains resolved by AFM had a slightly lower 〈P2〉 value than the surrounding lower topography contiguous lipid phase. Using image intensity thresholding and Gaussian decomposition, the image histograms of these order parameter images could be fit by two normal distributions. The bright domains exhibited a 〈P2〉high value = 0.12 ± 0.01, whereas the rest of the order parameter image had a 〈P2〉low value = 0.18 ± 0.02.
We also used pTIRFM/AFM to examine 3:1 POPE/TOCL SPBs labeled with the fluorescent lipid DiI-C20, both before and after addition of PR-9. DiI-C20 is known to preferentially partition into more ordered phases in model membranes (78–82) and its orientational order in SPBs and giant unilamellar vesicles has been characterized previously by fluorescence polarization microscopy (47,53,83). As in the case of NAO, the DiI-C20 fluorescence was initially uniformly distributed laterally in 3:1 POPE/TOCL SPB; however, upon PR-9 addition, diffraction-limited and larger micrometer-sized brighter spots of DiI-C20 fluorescence could be seen throughout the bilayer. The average pTIRFM order parameters associated with both the DiI-C20 and NAO labels are summarized in Table 1. To discount the possibility that domain formation was an artifact arising from photooxidation of the fluorescent probe (84–86), we monitored the effect of PR-9 on unlabeled 3:1 POPE/TOCL SPBs by AFM alone, finding similar domain formation upon peptide addition (Fig. 4).
Table 1.
Summary of pTIRFM fluorescent probe order parameter and absorption transition dipole polar tilt angles measured in 3:1 POPE/TOCL SLBs both before and after the addition of PR-9
| Fluorescent Probe |
Before PR-9 addition (single topographical phase) |
After PR-9 addition(high topographical phase) |
After PR-9 addition(low topographical phase) |
|||
|---|---|---|---|---|---|---|
| 〈P2〉 | 〈θ〉 | 〈P2〉high | 〈θ〉high | 〈P2〉low | 〈θ〉low | |
| NAO | 0.15 ± 0.01 | 48.8° ± 0.5° | 0.12 ± 0.01 | 50.0° ± 0.5° | 0.18 ± 0.02 | 47.6° ± 1.0° |
| DiI-C20 | −0.32 ± 0.01 | 69.7° ± 0.5° | −0.24 ± 0.01 | 65.4° ± 0.5° | −0.21 ± 0.01 | 63.9° ± 0.3° |
All reported 〈P2〉 values are an average of at least 500 pixels from multiple regions of interest in three different identically prepared samples. 〈θ〉 values are calculated by inverting Eq. 4.
Figure 4.
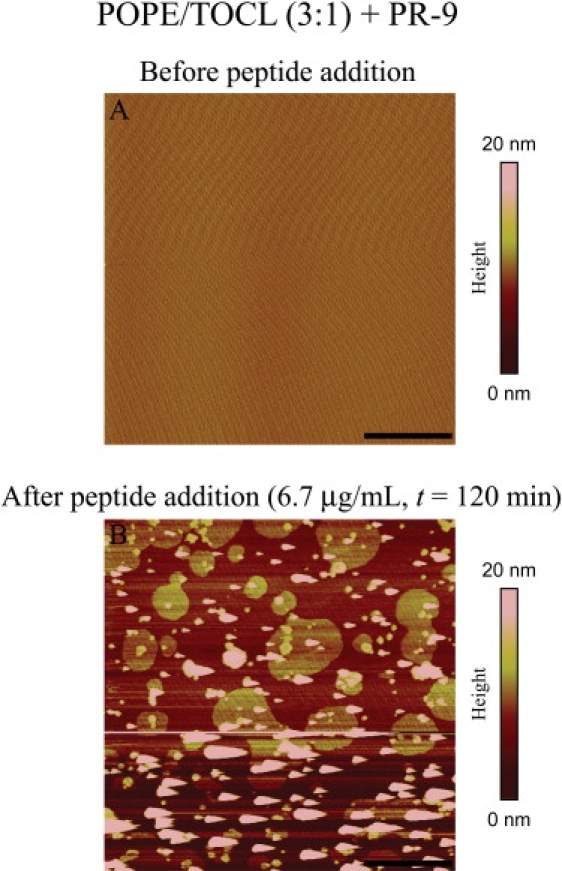
Selected AFM images sequence of an unlabeled 3:1 POPE/TOCL SPB before (A) and after (B) PR-9 is introduced into the imaging chamber at a final concentration of 6.7 μg/mL. Scale bar = 5 μm.
Discussion
Recent work by us and others has suggested that phase separation and/or domain formation may be an alternative mechanism of action for certain antimicrobial peptides that directly contrasts with the more conventional models of AMP activity (16,19,22,60,87–90). Using a correlated imaging approach, we have examined the interaction of the model cationic AMP PR-9 with model 3:1 POPE/TOCL SPBs intended to mimic the inner membrane of E. coli and many other bacterial species with high phosphoethanolamine content. Using NAO as a fluorescent probe because of its known association with cardiolipin in both model and real cell membranes (7,12,77,91–93), our combined pTIRFM/AFM fluorescence measurements suggest that TOCL was homogenously distributed in the SPB before exposure to PR-9. Moreover, our data suggested that the absorption transition dipole moment of NAO was, on average, tilted ∼49° with respect to the membrane normal. As the orientation of NAO in membrane bilayers has not been previously characterized by pTIRFM experiments or any other orientation sensitive spectroscopic methods, we decided to assess the orientation of DiI-C20, another membrane probe known to orient in ternary SPBs that mimic eukaryotic membranes with its linear conjugated bridge at an average polar angle of 70–75° (47). This tilt angle was reported to be dependent on the cholesterol concentration and the phase state of the bilayer. In this study, the pTIRFM order parameter for DiI-C20 in intact 3:1 POPE/TOCL SPBs corresponded to a tilt angle of 69.7°, indicating that the bilayers existed in a mainly fluid liquid-disordered phase state.
The addition of PR-9 to the SPBs led to rapid formation of lipid domains, an effect observed by both AFM and pTIRFM. The enhanced fluorescence intensity of NAO was localized to the domains, as seen in the raw p- and s-polarized pTIRFM images, suggesting that higher concentrations of TOCL were present in these regions. The existence of two distinct pTIRFM-determined order parameters for NAO, as compared to the single value seen before PR-9 addition, supports this claim. We found that, in the TOCL-rich domains, the NAO order-parameter values corresponded to a chromophore polar tilt angle of 50.0°, whereas in the surrounding lower topography regions, the angle was 47.6°. The increased polar tilt-angle of NAO's absorption transition dipole moment in the lipid domains is consistent with tight binding of NAO's aromatic chromophore and the headgroup gap caused by the lateral stacking of adjacent cardiolipins in ordered rows, as has been reported by others (see Figs. 2 and 3 in (77) and (92), respectively). We also found that the polar tilt angle of DiI-C20's chromophore decreased to 65.4° and 63.9° in the domains and the surrounding lower topography phase, respectively. This result was consistent with an overall loss of lipid acyl-tail orientational order. The observation that the DiI-C20 fluorescence intensity and average polar tilt angle were both greater in the domain areas, as compared to the surrounding membrane phase, is consistent with the known partitioning of DiI-C20 into more ordered lipid phases (65,82). However, because both tilt angles were lower than the single tilt angle measured before PR-9 addition, the overall lipid acyl-chain order was likely less in both phases compared to that of normal non-phase-separated 3:1 POPE/TOCL SPBs. This was consistent with the PR-9 peptide initiating clustering of the lower-melting, more-fluid anionic TOCL component into domains. This observation also agrees with the proposed mechanism of action of PR-9 and similar AMPs. The observed decrease in acyl-chain order may also explain the appearance of the punctate topographical structures in the AFM and pTIRFM images. These structures, which also exhibit increased NAO and DiI-C20 fluorescence, could be lipid vesicles emerging from the SPB because of the decrease in membrane order and the onset of domain boundary instabilities. In this study, one of the components of the mixture is POPE, a lipid with high negative-curvature tendencies. When phase separation occurs, the domains enriched in POPE would have a tendency to form curved structures that could facilitate the formation of punctate structures and/or vesicle budding.
In contrast to our work with tetraoleoyl cardiolipin, recent AFM studies of 4:1 POPE/beef-heart cardiolipin SPBs reported evidence of domains at both room temperature and 37°C in the absence of any peptides (94–97). We also observed domain formation in a separate set of experiments using beef-heart cardiolipin (see Fig. S2). These observations argue that the cardiolipin source (and perhaps lipid impurities therein) can influence membrane structure and phase state. Beef-heart cardiolipin has predominantly polyunsaturated linoleoyl chains that are much more prone to oxidation than the oleoyl chains of the synthetic cardiolipin used in this work. Additionally, the 18:2 chains of beef-heart cardiolipin are shorter than the 18:1 of the synthetic lipids and hence less miscible with POPE. Interestingly, we found that the addition of PR-9 at concentration (III′) in beef-heart cardiolipin/POPE SPBs caused rapid and widespread membrane destabilization and vesicle blebbing, indicating that the presence of preexisting domain structures in the membrane may enhance the efficacy of the peptide in rearranging the lipids (see Fig. S3).
Conclusion
This study has provided the first direct evidence of antimicrobial peptide-induced domain formation in model membranes, enabling us to assess the dynamics of domain formation, including growth rates, peptide-induced restructuring, and lipid recruitment. Our use of a powerful coupled AFM-pTIRFM imaging approach to examine how these peptide-membrane interactions led to changes in membrane order portends its application in more detailed studies of complex structural dynamics on both model and real cell membranes.
Supporting Material
Three movies and three figures are available at http://www.biophysj.org/biophysj/supplemental/S0006-3495(10)00099-8.
Supporting Material
Acknowledgments
Support for this work was from the Natural Sciences and Engineering Research Council (PGS-D scholarship to J.O.), the Canada Research Chairs program (to C.M.Y.), and Canadian Institutes of Health Research (grant No. MOP-86608 to R.E.; grant No. PRG-80174 to C.M.Y. and R.E.).
The authors thank Chantal Blanchard and George Sakellaropoulos of Olympus Canada for the loan of the EMCCD camera.
Contributor Information
Richard M. Epand, Email: epand@mcmaster.ca.
Christopher M. Yip, Email: christopher.yip@utoronto.ca.
References
- 1.Koczulla A.R., Bals R. Antimicrobial peptides: current status and therapeutic potential. Drugs. 2003;63:389–406. doi: 10.2165/00003495-200363040-00005. [DOI] [PubMed] [Google Scholar]
- 2.Zasloff M. Antimicrobial peptides of multicellular organisms. Nature. 2002;415:389–395. doi: 10.1038/415389a. [DOI] [PubMed] [Google Scholar]
- 3.Pouny Y., Rapaport D., Shai Y. Interaction of antimicrobial dermaseptin and its fluorescently labeled analogues with phospholipid membranes. Biochemistry. 1992;31:12416–12423. doi: 10.1021/bi00164a017. [DOI] [PubMed] [Google Scholar]
- 4.He K., Ludtke S.J., Huang H.W. Neutron scattering in the plane of membranes: structure of alamethicin pores. Biophys. J. 1996;70:2659–2666. doi: 10.1016/S0006-3495(96)79835-1. [DOI] [PMC free article] [PubMed] [Google Scholar]
- 5.Yang L., Harroun T.A., Huang H.W. Barrel-stave model or toroidal model? A case study on melittin pores. Biophys. J. 2001;81:1475–1485. doi: 10.1016/S0006-3495(01)75802-X. [DOI] [PMC free article] [PubMed] [Google Scholar]
- 6.Fishov I., Woldringh C.L. Visualization of membrane domains in Escherichia coli. Mol. Microbiol. 1999;32:1166–1172. doi: 10.1046/j.1365-2958.1999.01425.x. [DOI] [PubMed] [Google Scholar]
- 7.Mileykovskaya E., Dowhan W. Visualization of phospholipid domains in Escherichia coli by using the cardiolipin-specific fluorescent dye 10-N-nonyl acridine orange. J. Bacteriol. 2000;182:1172–1175. doi: 10.1128/jb.182.4.1172-1175.2000. [DOI] [PMC free article] [PubMed] [Google Scholar]
- 8.Vanounou S., Pines D., Fishov I. Coexistence of domains with distinct order and polarity in fluid bacterial membranes. Photochem. Photobiol. 2002;76:1–11. doi: 10.1562/0031-8655(2002)076<0001:codwdo>2.0.co;2. [DOI] [PubMed] [Google Scholar]
- 9.Gibbs K.A., Isaac D.D., Theriot J.A. Complex spatial distribution and dynamics of an abundant Escherichia coli outer membrane protein. LamB. Mol. Microbiol. 2004;53:1771–1783. doi: 10.1111/j.1365-2958.2004.04242.x. [DOI] [PubMed] [Google Scholar]
- 10.Johnson A.S., van Horck S., Lewis P.J. Dynamic localization of membrane proteins in Bacillus subtilis. Microbiology (UK) 2004;150:2815–2824. doi: 10.1099/mic.0.27223-0. [DOI] [PubMed] [Google Scholar]
- 11.Nishibori A., Kusaka J., Matsumoto K. Phosphatidylethanolamine domains and localization of phospholipid synthases in Bacillus subtilis membranes. J. Bacteriol. 2005;187:2163–2174. doi: 10.1128/JB.187.6.2163-2174.2005. [DOI] [PMC free article] [PubMed] [Google Scholar]
- 12.Matsumoto K., Kusaka J., Hara H. Lipid domains in bacterial membranes. Mol. Microbiol. 2006;61:1110–1117. doi: 10.1111/j.1365-2958.2006.05317.x. [DOI] [PubMed] [Google Scholar]
- 13.Huang K.C., Mukhopadhyay R., Wingreen N.S. A curvature-mediated mechanism for localization of lipids to bacterial poles. PLOS Comput. Biol. 2006;2:1357–1364. doi: 10.1371/journal.pcbi.0020151. [DOI] [PMC free article] [PubMed] [Google Scholar]
- 14.Rosch J.W., Hsu F.F., Caparon M.G. Anionic lipids enriched at the ExPortal of Streptococcus pyogenes. J. Bacteriol. 2007;189:801–806. doi: 10.1128/JB.01549-06. [DOI] [PMC free article] [PubMed] [Google Scholar]
- 15.Romantsov T., Helbig S., Wood J.M. Cardiolipin promotes polar localization of osmosensory transporter ProP in Escherichia coli. Mol. Microbiol. 2007;64:1455–1465. doi: 10.1111/j.1365-2958.2007.05727.x. [DOI] [PubMed] [Google Scholar]
- 16.Epand R.M., Epand R.F. Domains in bacterial membranes and the action of antimicrobial agents. Mol. Biosyst. 2009;5:580–587. doi: 10.1039/b900278m. [DOI] [PubMed] [Google Scholar]
- 17.Epand R.F., Schmitt M.A., Epand R.M. Role of membrane lipids in the mechanism of bacterial species selective toxicity by two α/β-antimicrobial peptides. Biochim. Biophys. Acta Biomembr. 2006;1758:1343–1350. doi: 10.1016/j.bbamem.2006.01.018. [DOI] [PubMed] [Google Scholar]
- 18.Mason A.J., Marquette A., Bechinger B. Zwitterionic phospholipids and sterols modulate antimicrobial peptide-induced membrane destabilization. Biophys. J. 2007;93:4289–4299. doi: 10.1529/biophysj.107.116681. [DOI] [PMC free article] [PubMed] [Google Scholar]
- 19.Epand R.M., Rotem S., Epand R.F. Bacterial membranes as predictors of antimicrobial potency. J. Am. Chem. Soc. 2008;130:14346–14352. doi: 10.1021/ja8062327. [DOI] [PubMed] [Google Scholar]
- 20.Jean-François F., Castano S., Dufourc E.J. Aggregation of cateslytin β-sheets on negatively charged lipids promotes rigid membrane domains. A new mode of action for antimicrobial peptides? Biochemistry. 2008;47:6394–6402. doi: 10.1021/bi800448h. [DOI] [PubMed] [Google Scholar]
- 21.Epand R.F., Wang G., Epand R.M. Lipid segregation explains selective toxicity of a series of fragments derived from the human cathelicidin LL-37. Antimicrob. Agents Chemother. 2009;53:3705–3714. doi: 10.1128/AAC.00321-09. [DOI] [PMC free article] [PubMed] [Google Scholar]
- 22.Lohner K. New strategies for novel antibiotics: peptides targeting bacterial cell membranes. Gen. Physiol. Biophys. 2009;28:105–116. doi: 10.4149/gpb_2009_02_105. [DOI] [PubMed] [Google Scholar]
- 23.Salnikov E.S., Mason A.J., Bechinger B. Membrane order perturbation in the presence of antimicrobial peptides by 2H solid-state NMR spectroscopy. Biochimie. 2009;91:734–743. doi: 10.1016/j.biochi.2009.01.002. [DOI] [PubMed] [Google Scholar]
- 24.Arouri A., Dathe M., Blume A. Peptide induced demixing in PG/PE lipid mixtures: a mechanism for the specificity of antimicrobial peptides towards bacterial membranes? Biochim. Biophys. Acta Biomembr. 2009;1788:650–659. doi: 10.1016/j.bbamem.2008.11.022. [DOI] [PubMed] [Google Scholar]
- 25.Joanne P., Galanth C., Alves I.D. Lipid reorganization induced by membrane-active peptides probed using differential scanning calorimetry. Biochim. Biophys. Acta Biomembr. 2009;1788:1772–1781. doi: 10.1016/j.bbamem.2009.05.001. [DOI] [PubMed] [Google Scholar]
- 26.Slade A.L., Schoeniger J.S., Yip C.M. In situ scanning probe microscopy studies of Tetanus toxin-membrane interactions. Biophys. J. 2006;91:4565–4574. doi: 10.1529/biophysj.105.080457. [DOI] [PMC free article] [PubMed] [Google Scholar]
- 27.Shaw J.E., Epand R.F., Yip C.M. Tracking peptide-membrane interactions: insights from in situ coupled confocal-atomic force microscopy imaging of NAP-22 peptide insertion and assembly. J. Struct. Biol. 2006;155:458–469. doi: 10.1016/j.jsb.2006.04.015. [DOI] [PubMed] [Google Scholar]
- 28.Alattia J.R., Shaw J.E., Privé G.G. Molecular imaging of membrane interfaces reveals mode of β-glucosidase activation by saposin C. Proc. Natl. Acad. Sci. USA. 2007;104:17394–17399. doi: 10.1073/pnas.0704998104. [DOI] [PMC free article] [PubMed] [Google Scholar]
- 29.Shaw J.E., Oreopoulos J., Yip C.M. Coupling evanescent-wave fluorescence imaging and spectroscopy with scanning probe microscopy: challenges and insights from TIRF-AFM. Surf. Interface Anal. 2006;38:1459–1471. [Google Scholar]
- 30.Chiantia S., Ries J., Schwille P. Combined AFM and two-focus SFCS study of raft-exhibiting model membranes. ChemPhysChem. 2006;7:2409–2418. doi: 10.1002/cphc.200600464. [DOI] [PubMed] [Google Scholar]
- 31.Lin W.C., Blanchette C.D., Longo M.L. Lipid asymmetry in DLPC/DSPC-supported lipid bilayers: a combined AFM and fluorescence microscopy study. Biophys. J. 2006;90:228–237. doi: 10.1529/biophysj.105.067066. [DOI] [PMC free article] [PubMed] [Google Scholar]
- 32.Johnston L.J. Nanoscale imaging of domains in supported lipid membranes. Langmuir. 2007;23:5886–5895. doi: 10.1021/la070108t. [DOI] [PubMed] [Google Scholar]
- 33.Bagatolli L.A., Gratton E. Two-photon fluorescence microscopy observation of shape changes at the phase transition in phospholipid giant unilamellar vesicles. Biophys. J. 1999;77:2090–2101. doi: 10.1016/S0006-3495(99)77050-5. [DOI] [PMC free article] [PubMed] [Google Scholar]
- 34.Bagatolli L.A., Gratton E. Two-photon fluorescence microscopy of coexisting lipid domains in giant unilamellar vesicles of binary phospholipid mixtures. Biophys. J. 2000;78:290–305. doi: 10.1016/S0006-3495(00)76592-1. [DOI] [PMC free article] [PubMed] [Google Scholar]
- 35.Gaus K., Chklovskaia E., Harder T. Condensation of the plasma membrane at the site of T lymphocyte activation. J. Cell Biol. 2005;171:121–131. doi: 10.1083/jcb.200505047. [DOI] [PMC free article] [PubMed] [Google Scholar]
- 36.Gaus K., Gratton E., Jessup W. Visualizing lipid structure and raft domains in living cells with two-photon microscopy. Proc. Natl. Acad. Sci. USA. 2003;100:15554–15559. doi: 10.1073/pnas.2534386100. [DOI] [PMC free article] [PubMed] [Google Scholar]
- 37.Dietrich C., Bagatolli L.A., Gratton E. Lipid rafts reconstituted in model membranes. Biophys. J. 2001;80:1417–1428. doi: 10.1016/S0006-3495(01)76114-0. [DOI] [PMC free article] [PubMed] [Google Scholar]
- 38.Bagatolli L.A. To see or not to see: lateral organization of biological membranes and fluorescence microscopy. Biochim. Biophys. Acta Biomembr. 2006;1758:1541–1556. doi: 10.1016/j.bbamem.2006.05.019. [DOI] [PubMed] [Google Scholar]
- 39.de Almeida R.F.M., Loura L.M.S., Prieto M. Lipid rafts have different sizes depending on membrane composition: a time-resolved fluorescence resonance energy transfer study. J. Mol. Biol. 2005;346:1109–1120. doi: 10.1016/j.jmb.2004.12.026. [DOI] [PubMed] [Google Scholar]
- 40.Stöckl M., Plazzo A.P., Herrmann A. Detection of lipid domains in model and cell membranes by fluorescence lifetime imaging microscopy of fluorescent lipid analogues. J. Biol. Chem. 2008;283:30828–30837. doi: 10.1074/jbc.M801418200. [DOI] [PMC free article] [PubMed] [Google Scholar]
- 41.de Almeida R.F.M., Loura L.M.S., Prieto M. Membrane lipid domains and rafts: current applications of fluorescence lifetime spectroscopy and imaging. Chem. Phys. Lipids. 2009;157:61–77. doi: 10.1016/j.chemphyslip.2008.07.011. [DOI] [PubMed] [Google Scholar]
- 42.Benninger R.K.P., Onfelt B., French P.M. Fluorescence imaging of two-photon linear dichroism: cholesterol depletion disrupts molecular orientation in cell membranes. Biophys. J. 2005;88:609–622. doi: 10.1529/biophysj.104.050096. [DOI] [PMC free article] [PubMed] [Google Scholar]
- 43.Ariola F.S., Mudaliar D.J., Heikal A.A. Dynamics imaging of lipid phases and lipid-marker interactions in model biomembranes. Phys. Chem. Chem. Phys. 2006;8:4517–4529. doi: 10.1039/b608629b. [DOI] [PubMed] [Google Scholar]
- 44.Haluska C.K., Schröder A.P., Marques C.M. Combining fluorescence lifetime and polarization microscopy to discriminate phase separated domains in giant unilamellar vesicles. Biophys. J. 2008;95:5737–5747. doi: 10.1529/biophysj.108.131490. [DOI] [PMC free article] [PubMed] [Google Scholar]
- 45.Livanec P.W., Dunn R.C. Single-molecule probes of lipid membrane structure. Langmuir. 2008;24:14066–14073. doi: 10.1021/la802886c. [DOI] [PMC free article] [PubMed] [Google Scholar]
- 46.Ariola F.S., Li Z.G., Heikal A.A. Membrane fluidity and lipid order in ternary giant unilamellar vesicles using a new BODIPY-cholesterol derivative. Biophys. J. 2009;96:2696–2708. doi: 10.1016/j.bpj.2008.12.3922. [DOI] [PMC free article] [PubMed] [Google Scholar]
- 47.Oreopoulos J., Yip C.M. Probing membrane order and topography in supported lipid bilayers by combined polarized total internal reflection fluorescence-atomic force microscopy. Biophys. J. 2009;96:1970–1984. doi: 10.1016/j.bpj.2008.11.041. [DOI] [PMC free article] [PubMed] [Google Scholar]
- 48.Livanec P.W., Huckabay H.A., Dunn R.C. Exploring the effects of sterols in model lipid membranes using single-molecule orientations. J. Phys. Chem. B. 2009;113:10240–10248. doi: 10.1021/jp903908m. [DOI] [PubMed] [Google Scholar]
- 49.Axelrod D., Omann G.M. Combinatorial microscopy. Nat. Rev. Mol. Cell Biol. 2006;7:944–952. doi: 10.1038/nrm2062. [DOI] [PubMed] [Google Scholar]
- 50.Axelrod D. Biophysical Tools for Biologists, Vol. 2: In Vivo Techniques. Elsevier Academic Press; San Diego, CA: 2008. Total internal reflection fluorescence microscopy. [Google Scholar]
- 51.Thompson N.L., McConnell H.M., Burhardt T.P. Order in supported phospholipid monolayers detected by the dichroism of fluorescence excited with polarized evanescent illumination. Biophys. J. 1984;46:739–747. doi: 10.1016/S0006-3495(84)84072-2. [DOI] [PMC free article] [PubMed] [Google Scholar]
- 52.Burghardt T.P. Model-independent fluorescence polarization for measuring order in a biological assembly. Biopolymers. 1984;23:2383–2406. doi: 10.1002/bip.360231118. [DOI] [PubMed] [Google Scholar]
- 53.Timbs M.M., Thompson N.L. Slow rotational mobilities of antibodies and lipids associated with substrate-supported phospholipid monolayers as measured by polarized fluorescence photobleaching recovery. Biophys. J. 1990;58:413–428. doi: 10.1016/S0006-3495(90)82387-0. [DOI] [PMC free article] [PubMed] [Google Scholar]
- 54.Sund S.E., Swanson J.A., Axelrod D. Cell membrane orientation visualized by polarized total internal reflection fluorescence. Biophys. J. 1999;77:2266–2283. doi: 10.1016/S0006-3495(99)77066-9. [DOI] [PMC free article] [PubMed] [Google Scholar]
- 55.Van Blitterswijk W.J., Van Hoeven R.P., Van der Meer B.W. Lipid structural order parameters (reciprocal of fluidity) in biomembranes derived from steady-state fluorescence polarization measurements. Biochim. Biophys. Acta. 1981;644:323–332. doi: 10.1016/0005-2736(81)90390-4. [DOI] [PubMed] [Google Scholar]
- 56.Lafrance C.P., Nabet A., Pezolet M. On the relationship between the order-parameter 〈P2(cosθ)〉 and the shape of orientation distributions. Can. J. Chem. Rev. Can. Chim. 1995;73:1497–1505. [Google Scholar]
- 57.Axelsen P.H., Citra M.J. Orientational order determination by internal reflection infrared spectroscopy. Prog. Biophys. Mol. Biol. 1996;66:227–253. doi: 10.1016/s0079-6107(97)00007-2. [DOI] [PubMed] [Google Scholar]
- 58.Lopes S., Castanho M. Overview of common spectroscopic methods to determine the orientation/alignment of membrane probes and drugs in lipidic bilayers. Curr. Org. Chem. 2005;9:889–898. [Google Scholar]
- 59.Shaw J.E., Alattia J.R., Yip C.M. Mechanisms of antimicrobial peptide action: studies of indolicidin assembly at model membrane interfaces by in situ atomic force microscopy. J. Struct. Biol. 2006;154:42–58. doi: 10.1016/j.jsb.2005.11.016. [DOI] [PubMed] [Google Scholar]
- 60.Epand R.M., Epand R.F. Lipid domains in bacterial membranes and the action of antimicrobial agents. Biochim. Biophys. Acta Biomembr. 2009;1788:289–294. doi: 10.1016/j.bbamem.2008.08.023. [DOI] [PubMed] [Google Scholar]
- 61.Brian A.A., McConnell H.M. Allogeneic stimulation of cyto-toxic T-cells by supported planar membranes. Biophys. J. 1984;81:6159–6163. doi: 10.1073/pnas.81.19.6159. [DOI] [PMC free article] [PubMed] [Google Scholar]
- 62.Tamm L.K., McConnell H.M. Supported phospholipid bilayers. Biophys. J. 1985;47:105–113. doi: 10.1016/S0006-3495(85)83882-0. [DOI] [PMC free article] [PubMed] [Google Scholar]
- 63.Mou J.X., Yang J., Shao Z.F. Tris(hydroxymethyl)aminomethane (C4H11NO3) induced a ripple phase in supported unilamellar phospholipid-bilayers. Biochemistry. 1994;33:4439–4443. doi: 10.1021/bi00181a001. [DOI] [PubMed] [Google Scholar]
- 64.Oreopoulos J., Yip C.M. Combined scanning probe and total internal reflection fluorescence microscopy. Methods. 2008;46:2–10. doi: 10.1016/j.ymeth.2008.05.011. [DOI] [PubMed] [Google Scholar]
- 65.Oreopoulos J., Yip C.M. Combinatorial microscopy for the study of protein-membrane interactions in supported lipid bilayers: Order parameter measurements by combined polarized TIRFM/AFM. J. Struct. Biol. 2009;168:21–36. doi: 10.1016/j.jsb.2009.02.011. [DOI] [PubMed] [Google Scholar]
- 66.Rinia H.A., de Kruijff B. Imaging domains in model membranes with atomic force microscopy. FEBS Lett. 2001;504:194–199. doi: 10.1016/s0014-5793(01)02704-1. [DOI] [PubMed] [Google Scholar]
- 67.Connell S.D., Smith D.A. The atomic force microscope as a tool for studying phase separation in lipid membranes. Mol. Membr. Biol. 2006;23:17–28. doi: 10.1080/09687860500501158. [DOI] [PubMed] [Google Scholar]
- 68.Seantier B., Giocondi M.C., Milhiet P.E. Probing supported model and native membranes using AFM. Curr. Opin. Colloid Interface Sci. 2008;13:326–337. [Google Scholar]
- 69.Brasseur R., Deleu M., Dufrene Y.F. Probing peptide-membrane interactions using AFM. Surf. Interface Anal. 2008;40:151–156. [Google Scholar]
- 70.Goksu E.I., Vanegas J.M., Longo M.L. AFM for structure and dynamics of biomembranes. Biochim. Biophys. Acta Biomembr. 2009;1788:254–266. doi: 10.1016/j.bbamem.2008.08.021. [DOI] [PubMed] [Google Scholar]
- 71.Tokumasu F., Jin A.J., Dvorak J.A. Nanoscopic lipid domain dynamics revealed by atomic force microscopy. Biophys. J. 2003;84:2609–2618. doi: 10.1016/S0006-3495(03)75066-8. [DOI] [PMC free article] [PubMed] [Google Scholar]
- 72.Hecht E. Addison Wesley; San Francisco, CA: 2002. Optics. [Google Scholar]
- 73.Citra M.J., Axelsen P.H. Determination of molecular order in supported lipid membranes by internal reflection Fourier transform infrared spectroscopy. Biophys. J. 1996;71:1796–1805. doi: 10.1016/S0006-3495(96)79380-3. [DOI] [PMC free article] [PubMed] [Google Scholar]
- 74.Tamm L.K., Tatulian S.A. Infrared spectroscopy of proteins and peptides in lipid bilayers. Q. Rev. Biophys. 1997;30:365–429. doi: 10.1017/s0033583597003375. [DOI] [PubMed] [Google Scholar]
- 75.Lipari G., Szabo A. Effect of librational motion on fluorescence depolarization and nuclear magnetic resonance relaxation in macromolecules and membranes. Biophys. J. 1980;30:489–506. doi: 10.1016/S0006-3495(80)85109-5. [DOI] [PMC free article] [PubMed] [Google Scholar]
- 76.Stuurman N., Amodaj N., Vale R.D. MICRO-MANAGER: open-source software for light microscope imaging. Microsc. Today. 2007;15:42–43. [Google Scholar]
- 77.Mileykovskaya E., Dowhan W., Haines T.H. Cardiolipin binds nonyl acridine orange by aggregating the dye at exposed hydrophobic domains on bilayer surfaces. FEBS Lett. 2001;507:187–190. doi: 10.1016/s0014-5793(01)02948-9. [DOI] [PubMed] [Google Scholar]
- 78.Spink C.H., Yeager M.D., Feigenson G.W. Partitioning behavior of indocarbocyanine probes between coexisting gel and fluid phases in model membranes. Biochim. Biophys. Acta. 1990;1023:25–33. doi: 10.1016/0005-2736(90)90005-9. [DOI] [PubMed] [Google Scholar]
- 79.Korlach J., Schwille P., Feigenson G.W. Characterization of lipid bilayer phases by confocal microscopy and fluorescence correlation spectroscopy. Proc. Natl. Acad. Sci. USA. 1999;96:8461–8466. doi: 10.1073/pnas.96.15.8461. [DOI] [PMC free article] [PubMed] [Google Scholar]
- 80.Feigenson G.W. Phase behavior of lipid mixtures. Nat. Chem. Biol. 2006;2:560–563. doi: 10.1038/nchembio1106-560. [DOI] [PMC free article] [PubMed] [Google Scholar]
- 81.Zhao J., Wu J., Feigenson G.W. Phase studies of model biomembranes: complex behavior of DSPC/DOPC/cholesterol. Biochim. Biophys. Acta Biomembr. 2007;1768:2764–2776. doi: 10.1016/j.bbamem.2007.07.008. [DOI] [PMC free article] [PubMed] [Google Scholar]
- 82.Baumgart T., Hunt G., Feigenson G.W. Fluorescence probe partitioning between Lo/Ld phases in lipid membranes. Biochim. Biophys. Acta Biomembr. 2007;1768:2182–2194. doi: 10.1016/j.bbamem.2007.05.012. [DOI] [PMC free article] [PubMed] [Google Scholar]
- 83.Axelrod D. Fluorescence polarization microscopy. Methods Cell Biol. 1989;30:333–352. [PubMed] [Google Scholar]
- 84.Ayuyan A.G., Cohen F.S. Lipid peroxides promote large rafts: effects of excitation of probes in fluorescence microscopy and electrochemical reactions during vesicle formation. Biophys. J. 2006;91:2172–2183. doi: 10.1529/biophysj.106.087387. [DOI] [PMC free article] [PubMed] [Google Scholar]
- 85.Coban O., Popov J., Johnston L.J. Transition from nanodomains to microdomains induced by exposure of lipid monolayers to air. Biophys. J. 2007;92:2842–2853. doi: 10.1529/biophysj.106.088419. [DOI] [PMC free article] [PubMed] [Google Scholar]
- 86.Hirst L.S., Yuan J. 22nd International Liquid Crystal Conference. Taylor & Francis; Cheju Island, South Korea: 2008. The effects of fluorescent probes on model membrane organization: photo-induced lipid sorting and soft structure formation; pp. 739–745. [Google Scholar]
- 87.Wu M.H., Maier E., Hancock R.E. Mechanism of interaction of different classes of cationic antimicrobial peptides with planar bilayers and with the cytoplasmic membrane of Escherichia coli. Biochemistry. 1999;38:7235–7242. doi: 10.1021/bi9826299. [DOI] [PubMed] [Google Scholar]
- 88.Hancock R.E.W., Diamond G. The role of cationic antimicrobial peptides in innate host defenses. Trends Microbiol. 2000;8:402–410. doi: 10.1016/s0966-842x(00)01823-0. [DOI] [PubMed] [Google Scholar]
- 89.Hancock R.E.W., Rozek A. Role of membranes in the activities of antimicrobial cationic peptides. FEMS Microbiol. Lett. 2002;206:143–149. doi: 10.1111/j.1574-6968.2002.tb11000.x. [DOI] [PubMed] [Google Scholar]
- 90.Jenssen H., Hilpert K., Hancock R.E.W. Antibacterial host defense peptides of bovine origin. Chim. Oggi-Chem. Today. 2007;25:17–19. [Google Scholar]
- 91.Septinus M., Berthold T., Zimmermann H.W. Hydrophobic acridine-dyes for fluorescence staining of mitochondria in living cells. 3. Specific accumulation of the fluorescence dye NAO at the mitochondrial-membranes in HeLa-cells by hydrophobic interaction—decrease of respiratory activity and changes in the ultrastructure of mitochondria by NAO—increase of fluorescence intensity of NAO stained mitochondria in situ by irradiation. Histochemistry. 1985;82:51–66. doi: 10.1007/BF00502091. [DOI] [PubMed] [Google Scholar]
- 92.Haines T.H., Dencher N.A. Cardiolipin: a proton trap for oxidative phosphorylation. FEBS Lett. 2002;528:35–39. doi: 10.1016/s0014-5793(02)03292-1. [DOI] [PubMed] [Google Scholar]
- 93.Kawai F., Shoda M., Matsumoto K. Cardiolipin domains in Bacillus subtilis Marburg membranes. J. Bacteriol. 2004;186:1475–1483. doi: 10.1128/JB.186.5.1475-1483.2004. [DOI] [PMC free article] [PubMed] [Google Scholar]
- 94.Domenech O., Sanz F., Hernandez-Borrell J. Thermodynamic and structural study of the main phospholipid components comprising the mitochondrial inner membrane. Biochim. Biophys. Acta Biomembr. 2006;1758:213–221. doi: 10.1016/j.bbamem.2006.02.008. [DOI] [PubMed] [Google Scholar]
- 95.Domenech O., Morros A., Hernandez-Borrell J. Supported planar bilayers from hexagonal phases. Biochim. Biophys. Acta Biomembr. 2007;1768:100–106. doi: 10.1016/j.bbamem.2006.06.012. [DOI] [PubMed] [Google Scholar]
- 96.Domènech O., Morros A., Hernández-Borrell J. Thermal response of domains in cardiolipin content bilayers. Ultramicroscopy. 2007;107:943–947. doi: 10.1016/j.ultramic.2007.04.009. [DOI] [PubMed] [Google Scholar]
- 97.Domenech O., Francius G., Mingeot-Leclercq M.P. Interactions of oritavancin, a new lipoglycopeptide derived from vancomycin, with phospholipid bilayers: effect on membrane permeability and nanoscale lipid membrane organization. Biochim. Biophys. Acta Biomembr. 2009;1788:1832–1840. doi: 10.1016/j.bbamem.2009.05.003. [DOI] [PubMed] [Google Scholar]
Associated Data
This section collects any data citations, data availability statements, or supplementary materials included in this article.