

Abstract
The role of individual photosynthetic antenna complexes of Photosystem II (PSII) both in membrane organization and excitation energy transfer have been investigated. Thylakoid membranes from wild-type Arabidopsis thaliana, and three mutants lacking light-harvesting complexes CP24, CP26, or CP29, respectively, were studied by picosecond-fluorescence spectroscopy. By using different excitation/detection wavelength combinations it was possible for the first time, to our knowledge, to separate PSI and PSII fluorescence kinetics. The sub-100 ps component, previously ascribed entirely to PSI, turns out to be due partly to PSII. Moreover, the migration time of excitations from antenna to PSII reaction center (RC) was determined for the first time, to our knowledge, for thylakoid membranes. It is four times longer than for PSII-only membranes, due to additional antenna complexes, which are less well connected to the RC. The results in the absence of CP26 are very similar to those of wild-type, demonstrating that the PSII organization is not disturbed. However, the kinetics in the absence of CP29 and, especially, of CP24 show that a large fraction of the light-harvesting complexes becomes badly connected to the RCs. Interestingly, the excited-state lifetimes of the disconnected light-harvesting complexes seem to be substantially quenched.
Introduction
In the process of photosynthesis in plants, photosystems work together to transform sunlight energy into chemical energy. The early events in this process: light absorption, excitation energy transfer (EET), and electron transfer occur in Photosystems I and II (PSI and PSII, see the Supporting Material for a schematic view of the macrostructure of the thylakoid membrane). Stable charge separation (CS) occurs within a few hundreds of picoseconds but differs for PSI and PSII. Elaborate research in the past has provided a general picture of these processes and the first kinetic steps could be studied for entire chloroplasts with the use of time-resolved fluorescence. However, agreement was never reached about the assignment and interpretation of all the obtained lifetime components, that moreover differed considerably in many different experiments (for an overview see van Amerongen and Dekker (1)). A great challenge in studies (1–4) on photosynthetic membranes and chloroplasts was that the thylakoid membranes contain both PSI and PSII with their spectra heavily overlapping and reaction kinetics occurring on similar timescales, making it difficult to distinguish between various processes. In more recent years, research has concentrated on the performance of the individual pigment-protein complexes that constitute PSI and PSII. The determination of the crystal structures of PSI (5), the core of PSII (6) and the major light-harvesting complex II of PSII (LHCII) (7) helped to understand the primary events at the molecular level and although many details are still under discussion, a rather detailed picture has emerged (8–10).
Based on the knowledge acquired in vitro it should now be possible to deepen our understanding of the in vivo system with the ultimate goal to apply time-resolved spectroscopy to study chloroplasts in vivo under different conditions and to link the spectroscopic features resolved to the different processes taking place, with special reference to the response of the chloroplast to varying environmental conditions. Here, we study thylakoid membranes from Arabidopsis thaliana, which contain both PSI and PSII but we focus on the kinetics of PSII, presenting a way to extract the PSII contribution to the fluorescence.
Photosystem II (PSII) is a large supramolecular pigment-protein complex embedded in the thylakoid membranes of green plants, algae, and cyanobacteria. It uses sunlight to split water into molecular oxygen, protons, and electrons. PSII in higher plants is composed of i), a core complex, consisting of the reaction center (RC) and the Chl a binding light-harvesting complexes CP43 and CP47; and ii), the outer, Chl a/b binding monomeric antenna complexes CP24, CP26, CP29, and trimeric light-harvesting complex II (LHCII) (11) (Fig. 1). In the RC excitations are used to create a primary CS. Primary CS is a reversible reaction, which is followed by further spatial separation of the charges (secondary CS) and transport of an electron to quinone A (QA) and then further along the electron transfer pathway.
Figure 1.
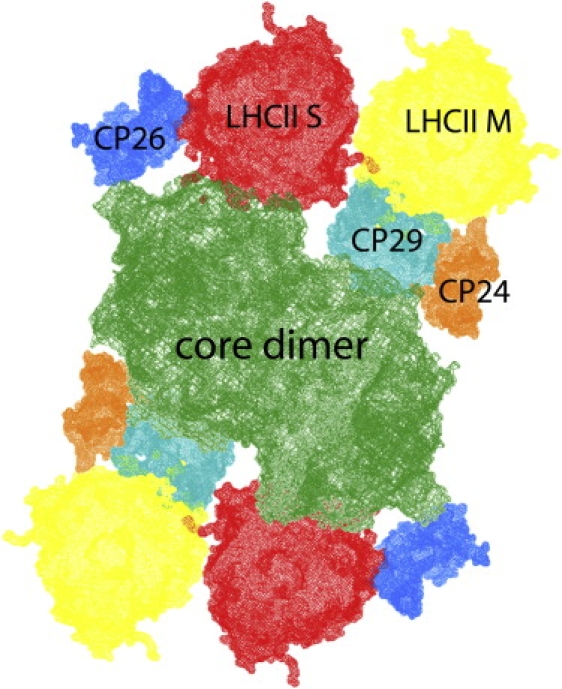
Organization of the PSII supercomplex, based on Caffarri et al. (50). The monomeric minor antenna complexes (CP24, CP26, CP29) are located in between the dimeric core and the trimeric major antenna complex LHCII, at positions S and M.
The outer antennae are not only important for harvesting light, but also play essential roles in photoprotective and regulative mechanisms such as Chl a triplet quenching (12,13), reactive oxygen species scavenging (14), and nonphotochemical quenching (15–17). The quantum efficiency of CS depends on the rate constants of various processes: 1), EET from antenna to RC; 2), CS and charge recombination; 3), stabilization of CS by secondary electron transfer; and 4), relaxation or loss processes: intersystem crossing, internal conversion, and fluorescence.
Recently, a coarse-grained method was developed to correlate these processes to the fluorescence kinetics of PSII membranes (BBY preparations) with open RCs, i.e., with the secondary electron acceptor QA being oxidized (18,19). The dimeric supercomplex of PSII (Fig. 1) forms the basic unit for this coarse-grained model. A hopping rate khop was defined for EET between neighboring monomeric antenna complex (sub)units. The other parameters of the coarse-grained model are the rates of primary and secondary CS and the drop in free energy on primary charge separation. Using this model, and comparing the fluorescence kinetics obtained on 412 nm (relatively more excitations in the core) and 484 nm excitation (relatively more excitations in the outer antenna), it was concluded that the average migration time of an excitation toward the RC contributes 20–25% to the overall average trapping time. Within the context of the coarse-grained model it was calculated that the rate of primary CS in the RC is (5.5 ± 0.4 ps)−1, the rate of secondary CS is (137 ± 5 ps)−1 and the drop in free energy on primary CS is (826 ± 30) cm−1. It should be noted that the number of LHCII trimers in these BBY preparations was relatively low (2.45 trimers per RC), i.e., far lower than the number of trimers that is generally believed to be present per RC in thylakoid preparations, namely four (11) (see also below). This might partly explain why the average fluorescence lifetime (∼150 ps) found for BBY preparations (18,19) is significantly shorter than the (average) lifetime generally ascribed to PSII for measurements on thylakoid membranes and chloroplasts (many hundreds of picoseconds; for an overview see van Amerongen and Dekker (1) and Dekker and Van Grondelle (9). Another part of the explanation consists of the fact that lifetimes of ∼100 ps that are usually observed for thylakoids/chloroplasts have been fully ascribed to PSI in the past (20) whereas PSII membranes also show a similar lifetime (18,19).
In this work, thylakoid membranes of A. thaliana are studied with time-resolved fluorescence spectroscopy using different combinations of excitation and detection wavelengths to separate PSI and PSII kinetics. In addition, the mutants CP24ko, CP26ko, and CP29as are studied (lacking minor antenna complexes CP24, CP26, and CP29, respectively) to investigate their role in the structural and functional organization of PSII. These monomeric minor complexes are located in between the PSII core (containing PSII reaction center(s), CP43, and CP47), and LHCII (Fig. 1) (21). Biochemical and physiological analyses have shown that the absence of each of these minor complexes has an effect on the packing of the supercomplexes in the membrane (22,23). In the absence of CP24, only C2S2 supercomplexes (consisting of a dimeric core (C) complexes and two strongly(S)-bound LHCII trimers) were observed in the membrane, and no supercomplexes containing the so-called LHCII M-trimers (24). CP24 also seems to be required for proper macroorganization of PSII complexes: in its absence, the packing of PSII leads to limitation of plastoquinone diffusion (23). In contrast, the absence of CP26 does not influence the presence of the other complexes within the PSII supercomplexes, but it changes their packing, somewhat shortening the distance between adjacent cores (22). The most drastic effect was observed in the absence of CP29: even on very mild solubilization, it was impossible to observe any microcrystalline arrays of membranes (present in wild-type (WT)), and no PSII supercomplexes were observed (22). This suggests that CP29 is a key component for the stability of the supercomplexes.
The main goal of this study is to unveil the relation between PSII composition and PSII fluorescence decay kinetics, which reflect both EET and CS.
Materials and Methods
Sample preparation
A. thaliana T-DNA insertion mutants (Columbia ecotype) SALK_077953 with insertion into the Lhcb6 gene (At1g15820) and SALK_014869 into the Lhcb5 gene (At4g10340) were obtained from the NASC collections (25). The antisense line for CP29 (26) was a kind gift of S. Jansson (Umea, Sweden). Plants were grown for 6 weeks at 120 μmol photons m−2 s−1, 22°C, 70% humidity, and 8 h of daylight.
Thylakoids were isolated from leaves as described before (27). Pigments analysis was carried out by high performance liquid chromatography and by fitting of the spectrum of the acetone extract with the spectra of the individual pigments (28). The Chl a/b ratio of the thylakoids of different plants was quite similar in all cases (Table 1).
Table 1.
Composition of thylakoid membranes from WT and mutants of A. thaliana
| Sample | Chl a/b | PSI/PSII | LHCII/PSII∗ |
|---|---|---|---|
| WT | 2.69 | 0.69 ± 0.12 | 4.0 |
| CP29as | 2.67 | 0.65 ± 0.09 | 3.9 |
| CP26ko | 2.62 | 0.64 ± 0.15 | 4.1 |
| CP24ko | 2.71 | 0.68 ± 0.11 | 4.1 |
Chl a/b ratio was determined by fitting of the spectrum of the acetone extract with the spectra of the individual pigments (28), PSI/PSII ratio was calculated using a μs resolution pump-and-probe spectrometer (30). LHCII trimers/monomeric PSII core ratio was calculated from the PSI/PSII ratio and subunit pigment composition.
LHCII trimers/monomeric PSII core.
SDS-PAGE analysis was carried out with the Tris-Tricine buffer system as described previously (29).
The PSI/PSII ratio was measured using a JTS-10 spectrophotometer (BioLogic Science Instruments, Grenoble, France) in which absorption changes are sampled by monochromatic flashes provided by LED; changes in the amplitude of the electrochromic shift signal were recorded on excitation in the presence or absence of the PSII inhibitors DCMU (50 μM) and hydroxylamine (1 mM) as described in Cardol et al. (30).
Fluorescence
Steady-state fluorescence emission spectra, which are necessary to calibrate decay-associated spectra (DAS), were measured after excitation at 412 nm or 484 nm on a Spex Fluorolog 3.2.2 (HORIBA Jobin-Yvon, Edison, NJ).
Time-resolved fluorescence was measured by time-correlated single photon counting, using a home-built setup (31). In brief: excitation was carried out by ∼0.2 ps vertically polarized excitation pulses (wavelength 412 nm or 484 nm) at a repetition rate of 3.8 MHz. Fluorescence was collected at right angle to the excitation beam, under magic-angle polarization through interference filters (Schott, Mainz, Germany) that were slightly tilted to avoid reflections. Under the tilt angle, maximal transmission was at 680 nm, 700 nm, or 720 nm (15 nm width). The excitation power was reduced with neutral density filters, to keep RCs in an open state, and to keep the detection rate under 30,000 photons/s, to avoid pile-up distortion. Care was taken to avoid further data distortion, as described in detail in by van Hoek and Visser (32). Photon arrival times were stored in a multichannel analyzer (4096 channels at 2.0 ps time spacing).
The sample was kept at 287 K in a flow cuvette. Under the experimental conditions, with 0.5–4 μW excitation almost all PSII RCs remain open. More details are provided in the Supporting Material.
Data analysis
Fluorescence decay curves were analyzed using home-built software (33), using the instrument response function (55 ps full width at half-maximum) measured from the 6 ps decay of pinacyanol iodide in methanol (34). The data were fitted to multi-exponential decay functions with amplitudes pi and fluorescence decay times τi. During analysis the decay times were forced to be equal for all measurements of a sample. The fit quality was judged from the Poissonian maximum likelihood estimator, the residuals, and the autocorrelation of the residuals.
Extraction of PSII kinetics
Fit results were interpreted in terms of the average fluorescence lifetime (τavg) of PSII calculated from the three sub-ns lifetimes that were needed for good fits: , with . However, the decay components are partly due to PSI and partly to PSII. Calculation the PSII average lifetime therefore requires removal of the PSI contribution from the fit results, by unmixing the amplitudes, using the DAS of PSI (35–37), and of PSII and thylakoid membranes (both from this work).
Unmixing requires the calculation of the relative contributions of PSI and PSII to the DAS of the fastest decay component for thylakoid membranes measured at 680 nm (with ). The DAS of thylakoid membranes at 680 nm (Thyl680) is the sum of a PSI part (PSI680) and a PSII part (PSII680), according to Eq. 1:
| (1) |
and for 720 nm:
| (2) |
and follow from Eq. 1:
| (3) |
| (4) |
Equations 1 and 2 can be rewritten as Eq. 5 and Eq. 6:
| (5) |
| (6) |
Adding Eq. 5 and Eq. 6 gives Eq. 7:
| (7) |
Combining Eq. 7 with Eq. 3 gives
| (8) |
Likewise, it follows from Eq. 1, Eq. 2, and Eq. 4 that
| (9) |
The amplitude of the fastest DAS of PSII equals . The other two thylakoid DAS are fully attributed to PSII, so . The total amplitude of the PSII DAS at 680 nm therefore equals . Normalizing the total amplitude gives the relative amplitudes of PSII (Eq. 10), which can be used to calculate the average fluorescence lifetime of PSII (τavg) (Eq. 11):
| (10) |
| (11) |
Theory and modeling of the fluorescence kinetics
The overall average charge separation time τavg can be considered as the sum of two times τavg = τmig + τtrap. τmig is the first passage time or migration time, representing the average time that it takes for an excitation created somewhere in PSII to reach the RC (primary electron donor), and τtrap is the trapping time. τtrap is the CS time τCS divided by the probability that the excitation is located on the RC (18,38): τtrap = NeffτC, with Neff = NPSII/NRC, where NPSII and NRC are the numbers of Chl a molecules in PSII and the RC, respectively. In the case that the total number of (isoenergetic) pigments for instance doubles, the probability for an excitation to be on the primary donor decreases by a factor of 2 and τtrap doubles. In case CS is reversible then τtrap should be replaced by τtrap = Neff[τCS + τRP exp(−ΔG/kT)] (derivation in Supporting Material) where τRP is the secondary CS time and ΔG is the drop in free energy on primary CS. When excited state decay processes in the antenna are taken into account, the equations change into for irreversible CS and for reversible CS, where τ0 is the excited antenna complex lifetime (taken as 4 ns; see van Oort et al. (39)). For τ0 ≫ τtrap the trapping timescales linearly with the total number of (isoenergetic) pigments.
In Broess et al. (19) the parameters τCS, ΔG, and τRP were determined for PSII membranes from spinach (BBY particles). Assuming that these numbers remain unaltered in the thylakoid membranes, τtrap can be calculated (19) and the value increases, on increasing the size of the antenna. It was also pointed out in (19) that excitation at 412 and 484 nm lead to different values of τavg, because excitation at 484 nm leads to relatively more excitations in the outer antenna. Due to invariance of τtrap with initial excitation conditions, the difference (Δτavg) between the two values characterize solely the change of migration time.
Results
The thylakoid membranes of the WT and the three mutants were analyzed in terms of pigment and protein composition. The PSI/PSII ratio was calculated using a μs resolution pump-and-probe spectrometer (30). The obtained ratio was 0.69 for the WT and it was very similar for all the mutants (Table 1), indicating that the absence of one of the minor antennae does not affect the PSI/PSII ratio. The Chl a/b ratio of the thylakoid preparations from WT and mutants (Table 1) was also very similar in all cases, indicating that, also at the level of PSII, the absence of one of the antennae does not strongly influence the expression of other Lhcb complexes. Indeed, by using the pigment composition of the individual subunits (40) and the measured PSI/PSII value, it can be calculated that in the case of the WT 4 LHCII trimers are present per monomeric PSII core. The data were very similar for the mutants, ranging from 3.9 trimers per PSII in CP29as to 4.1 trimers of CP26ko and CP24ko, identical within experimental errors (Table 1). This is in agreement with the analysis of the protein content on fractionation by SDS PAGE, which showed very similar values for the LHCII/core ratio in all samples (results not shown). It is worth noting that the same method used here to calculate the ratio LHCII/PSII core gave a value of 2.45 trimers of LHCII per monomeric core for the BBY membranes (19), indicating that during the preparation of the grana membranes part of the LHCII trimers is lost.
Fluorescence decay curves were measured for thylakoid membranes of all four samples. The excitation wavelength was either 412 nm or 484 nm, and fluorescence was detected at 680 nm, 700 nm, or 720 nm. Different combinations of excitation and detection wavelength lead to different fractional contributions of PSI and PSII to the fluorescence decay kinetics. This was used to extract the fluorescence kinetics of PSII. The combination 484 nm/680 nm leads to the highest contribution of PSII. The corresponding decay curves are presented in Fig. 2. The combination 412 nm/720 nm leads to the lowest contribution of PSII. The curves with highest/lowest PSII contribution are presented in Fig. 3, for WT, CP24ko, and CP29as.
Figure 2.
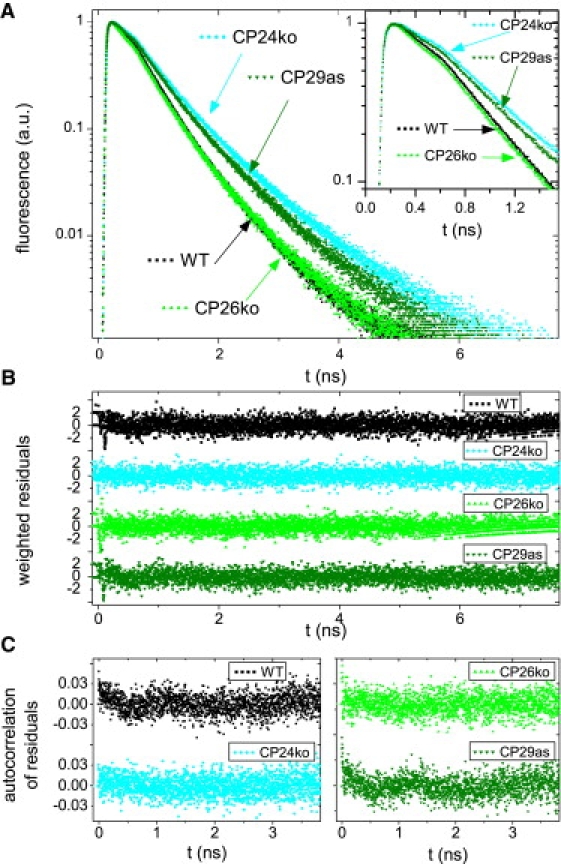
Time resolved fluorescence of thylakoid membranes from WT and mutants of A. thaliana. (A) Normalized fluorescence decay curves. Inset: Initial part of the decay curves. (B) Weighted residuals of the fits of the decay curves in A. (C) Autocorrelation of the weighted residuals. (B and C) Used to evaluate fit quality. The excitation wavelength is 484 nm and the detection wavelength is 680 nm.
Figure 3.
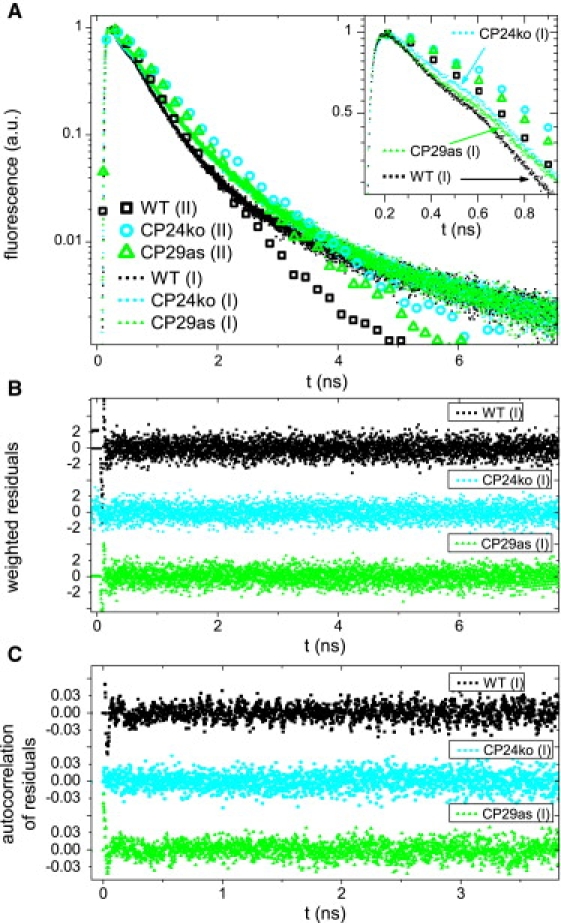
Time resolved fluorescence of thylakoid membranes from WT and mutants of A. thaliana, for two combinations of excitation/detection wavelengths: 412 nm/720 nm (dots labeled (I)) and 484/680 nm (open symbols labeled (II)). For (I) relatively more excitations are created in PSI and PSII core and relatively more PSI emission is detected; For (II) relatively more excitations are created in the PSII outer antenna. (A) Normalized fluorescence decay curves (symbols for every 200th data point). Inset: initial part of the decay curves (symbols for every 100th data point). (B) Weighted residuals of the fits of the decay curves in A. (C) Autocorrelation of the weighted residuals. (B and C) Used to evaluate fit quality. The complete curves for 484 nm/680 nm are presented in Fig. 2. The data of CP26ko are omitted for readability.
The decay curves of WT and CP26ko were very similar, whereas those of CP29as and CP24ko were considerably slower (Figs. 2 and 3). Each sample was measured six times, with different combinations of excitation and detection wavelength. The decay curves were globally fitted to a sum of exponential decay functions. For each sample, four decay components were needed to obtain a satisfactory fit for all wavelength combinations, as was judged from the Poissonian maximum likelihood estimator, and from the residuals and the autocorrelation of the residuals. The fitting results of the WT curves are given in Table 2. Note that the decay times and amplitudes do not necessarily correspond to real physical processes but they provide an accurate description of the data that will be used later.
Table 2.
Results of global fitting of the fluorescence decay curves of WT A. thaliana
| Detection | Excitation |
|||||
|---|---|---|---|---|---|---|
| 412 nm |
484 nm |
|||||
| 680 nm | 700 nm | 720 nm | 680 nm | 700 nm | 720 nm | |
| τ (ps)∗ | p | p | p | p | p | p |
| 73 | 0.250 | 0.366 | 0.501 | 0.150 | 0.221 | 0.281 |
| 251 | 0.390 | 0.349 | 0.279 | 0.468 | 0.442 | 0.394 |
| 532 | 0.351 | 0.276 | 0.210 | 0.376 | 0.332 | 0.317 |
| 1.8–2.6 ns | 0.009 | 0.009 | 0.011 | 0.006 | 0.005 | 0.008 |
The longest lifetime was not fitted globally. Confidence intervals of fluorescence lifetimes (τ) as calculated by exhaustive search were <5%, standard errors of amplitudes, as calculated from 2–5 repeats, were generally <3%, except for the amplitude of the longest lifetime (10–20%). p, relative amplitudes.
Except for the fourth component.
On moving the detection wavelength to the red, the relative contribution of PSI increases (20), which is reflected by an increase of the amplitude of the 73 ps component (Table 2). Although both PSI and PSII contribute to the 73 ps component, the contribution of PSI is dominant whereas the 251 ps and 532 ps components are due mainly to PSII (see also below). The amplitude of the slowest (several ns) component, which should be ascribed to either closed PSII, free Chl or disconnected light-harvesting complexes is very small and it was omitted in the analysis. Excitation at 412 nm creates relatively higher excitation densities on PSI than excitation at 484 nm (because PSII contains relatively more Chl b, which dominates the absorption at 484 nm) causing an increased contribution of the 73 ps component at 412 nm.
In a recent study on dissolved PSI-LHCI crystals, lifetimes of 24 ps, 61 ps, and 143 ps were found with relative amplitudes 0.55, 0.33, and 0.10, respectively, on excitation at 410 nm and detection above 710 nm (34). The 24 ps component is not resolved here because of the limited time resolution and the decrease in relative contribution. The 61 ps lifetime is similar to the 73 ps lifetime. The 143 ps component is not detected separately, because its amplitude is relatively small and it contributes to some extent to the 73 and 251 ps components in the fit. PSII also contributes to the 73 ps component as indicated by the analysis of membranes enriched in PSII, which also showed a short component (18,19). It should be noted that it is not possible to discriminate between lifetimes that are close together and they will be lumped into one lifetime in the fitting procedure.
When single traces measured at a particular combination of excitation and detection wavelength are fitted, the obtained lifetimes are somewhat different from the lifetimes obtained with a global fit. However, the calculated average lifetimes are identical and these will be used for further analysis.
The main goal of this study is to understand the relation between the PSII composition and the PSII decay kinetics, which reflect both EET and CS. Therefore, the measured overall kinetics have to be corrected for the contribution of PSI. As already stated above, PSI mainly contributes to the 73 ps component and much less to the other ones. Here, the relative contributions of PSI and PSII to the 73 ps component will be called qI and qII, with qI + qII = 1. At 680 nm, qII is defined as qII680 and can be estimated using Eq. 1 (see Materials and Methods for a derivation).
| (12) |
In this equation Thyl720/Thyl680 is the ratio of the normalized values of the 73 ps decay associated spectrum (DAS) of thylakoid membranes at 720 nm and 680 nm (see Materials and Methods for more explanation). The DAS are calculated from the fit results in Table 2 and the steady-state fluorescence emission spectra (Supplementary Material), as described in Materials and Methods. The ratio PSI720/PSI680 is defined analogously to Thyl720/Thyl680. Because spectral equilibration in PSI occurs within the first 10 ps after excitation (34), the ratio PSI720/PSI680 is constant for longer-lived DAS and it was taken from literature: at 412 nm excitation PSI720/PSI680 = 1.44 (average from values in Ihalainen et al. (36,37)), at 484 nm 1.57 (35). The ratio PSI720/PSI680 was calculated from the 251 ps DAS of thylakoids, which is thought to arise mainly from PSII although there might be a small contribution from PSI. However, using the 532 ps DAS for calculating qII680 leads to very similar results, confirming that the contribution of PSI to the 251 ps DAS is minor (Table 3).
Table 3.
Fluorescence kinetics at 680 nm of PSII in thylakoids of WT A. thaliana
| Wavelengths used for PSI removal | PSII ratios from 251 ps DAS |
PSII ratios from 532 ps DAS |
||||||||||||||
|---|---|---|---|---|---|---|---|---|---|---|---|---|---|---|---|---|
| 700/680 nm | 720/680 nm | 700/680 nm | 720/680 nm | |||||||||||||
| Excitation | 412 nm | 484 nm | 412 nm | 484 nm | 412 nm | 484 nm | 412 nm | 484 nm | ||||||||
| τ (ps) | ||||||||||||||||
| 73 | 0.195 | 0.122 | 0.185 | 0.125 | 0.187 | 0.119 | 0.181 | 0.125 | ||||||||
| 251 | 0.424 | 0.487 | 0.429 | 0.485 | 0.428 | 0.489 | 0.431 | 0.485 | ||||||||
| 532 | 0.381 | 0.391 | 0.386 | 0.390 | 0.385 | 0.392 | 0.388 | 0.390 | ||||||||
| τavg (ps) | 323 | 339 | 326 | 338 | 326 | 340 | 328 | 338 | ||||||||
The kinetics were derived from the kinetics of thylakoid membranes by removing the PSI contribution, using the ratios of the PSI and PSII DAS at 700/680 nm or 720/680 nm. The PSI ratios were taken from literature (35–37), and the PSII ratios were obtained from the PSII DAS of either 251 ps or 532 ps. For details, see text. Confidence intervals of fluorescence lifetimes (τ) were <5% (calculated by exhaustive search), standard errors of amplitudes were generally <5% (calculated from 2–5 repeats). Confidence intervals of average lifetimes (τavg) were <1%. This is smaller than the uncertainties of the fit parameters due to correlations between fit parameters.
After obtaining qII680, the relative amplitudes and the average fluorescence lifetime (τavg) of PSII were calculated using Eq. 13 and Eq. 14 (see Materials and Methods).
| (13) |
| (14) |
The same calculations were also done using the DAS at 700 and 680 nm instead of 720 and 680 nm. The results for WT are shown in Table 3.
Excitation at 412 nm leads to average lifetimes that are nearly identical in all cases: 323, 326, 326, and 328 ps i.e., 326 ± 2 ps on average. Excitation at 484 nm leads to the values 339, 338, 340, and 338 ps, i.e., 339 ± 1 ps on average. The latter lifetime is 13 ps longer than the one obtained on exciting at 412 nm and this is due to the fact that on 484 nm excitation a larger fraction of the initial excitations are localized on the outer antenna, whereas 412 nm leads to a relatively larger fraction of PSII core excitation (19).
The same measurements and procedures were repeated for thylakoid preparations from CP24ko, CP26ko and CP29as. For each of these three mutants the average PSII fluorescence lifetime (τavg) was calculated in the same four ways as described for WT. The resulting values of τavg were averaged, giving , and used to calculate standard errors of . The results for excitation at 412 nm and 484 nm are in Table 4.
Table 4.
Average fluorescence lifetimes at 680 nm of PSII in thylakoids of WT A. thaliana and mutants
| Excitation |
(ps) |
Difference (ps) | |
|---|---|---|---|
| 412 nm | 484 nm | ||
| WT | 326 (0.9) | 339 (0.5) | 13 (1.3) |
| CP24ko | 329 (2.5) | 413 (1.0) | 83 (2.6) |
| CP26ko | 303 (0.1) | 318 (1.0) | 15 (1.0) |
| CP29as | 391 (2.0) | 420 (0.8) | 30 (2.7) |
The values were calculated from fluorescence kinetics of thylakoid membranes by removing the PSI contribution in four ways: using the ratios of the DAS at 700/680 nm or 720/680 nm, and using the PSII DAS of either 251 ps or 532 ps (for WT the results of each of these four calculations are shown in Table 3). From the four calculations the average fluorescence lifetime and standard errors of the mean (in brackets) were calculated. See text for details.
The results for CP26ko are similar to those for WT in the sense that the difference between the average lifetimes on 412 and 484 nm is similar (15 vs. 13 ps). For CP29as and CP24ko this difference is larger, namely 30 and 83 ps, whereas in these mutants the average lifetime on 484 nm excitation is substantially longer than for WT and CP26ko.
Discussion
The average lifetime of PSII is twice as long in thylakoid membranes as in PSII membranes. This difference is ascribed to the fact that the number of LHCII trimers per PSII RC in the PSII membranes was 2.45, whereas for the thylakoid preparations that are used in this study, the value is ∼4. The overall average trapping time τavg can be considered as the sum of the migration time or first passage time τmig and the trapping time τtrap, i.e., τavg = τmig + τtrap (38). Although this is strictly speaking only correct for a regular lattice, it is a good approximation in the case of less regular structures like for instance the PSII membrane (18).
To estimate the contribution of both τmig and τtrap to the overall trapping time it was assumed that the parameters for charge separation for the PSII RCs in the current preparations are the same as for the RC in the BBY preparations (19). This is reasonable because the core complexes are probably almost identical in both preparations. By using the fact that there are 4 LHCII trimers per RC, the value of τtrap was calculated to be 181 ps (See Materials and Methods, taking into account a 4 ns excited state lifetime of the antenna). Note that τtrap does not depend on the organization of the pigments with respect to each other (38). This value of τtrap is larger than the 120 ps for the BBY preparations (19) (τtrap is 124 ps in those preparations when a 4 ns decay in the antenna is taken into account). This difference between PSII in thylakoid and BBY membranes is entirely caused by the additional ∼1.5 trimers of LHCII per RC, which increase the antenna size, and thereby reduce the equilibrium population of excited states in the RC.
The migration time τmig is thus ∼150 ps for WT PSII (i.e., τmig = τavg − τtrap = 330 ps − 181 ps). This is substantially slower than observed for the BBY preparations, where it was found to be ∼35 ps (19). This can be interpreted in terms of connectivity between LHCII and RC. In supercomplexes of A. thaliana each PSII RC is in very close association with 2 LHCII trimers (41,42). The BBY preparation contained 2.45 LHCII trimers per RC, suggesting that most of the LHCII trimers are arranged in this type of supercomplexes (C2S2M2) in the grana region of the membrane (as also directly observed by electron microscopy (EM) analysis (43)). This agrees with recent time-resolved fluorescence results on isolated supercomplexes (44) that show only slightly faster decay times than the BBY complexes. That means that the overall organization and composition of isolated supercomplexes is very similar to that in BBY preparations. However, in thylakoid membranes τmig is ∼4 times slower (150 ps vs. 35 ps). This implies that in the thylakoid membranes the migration time from the additional trimers is substantially longer than from the trimers in the supercomplexes. This increase of the migration time is also responsible for the fact that the difference in average lifetime on 412 and 484 nm excitation is 13 ps, i.e., a factor of 3 larger than for the BBY particles (where it was 4.3 ps (19)). As was also pointed out in Materials and Methods, the difference in the average lifetime for the two excitation wavelengths is approximately proportional to the migration time.
The average lifetimes for CP26ko are only somewhat faster than for WT, and the difference in lifetimes on exciting at 412 and 484 nm is very similar to the difference observed for WT, indicating that the migration time is also very similar in both cases. This suggests that the difference in the overall lifetime is primarily due to the smaller number of pigments per RC in the mutant, but that the absence of CP26 does not influence the overall performance of the supercomplexes, in agreement with the EM analysis of mildly solubilized membranes of this mutant (22). This indicates that PSII supercomplexes are still in the C2S2M2 form, when CP26 is absent. It can be concluded that the absence of CP26 does not have any direct or indirect effect on the energy transfer and trapping processes.
The situation is different for CP29as. The absence of CP29 should lead to a value for τtrap that is similar to the value in the absence of CP26 or even smaller due to the additional loss of CP24 in the CP29as mutant (26). Because the average fluorescence lifetime is longer than for CP26ko and also WT, this means that τmig must have increased. This agrees with the fact that the difference in average lifetime on 412 and 484 nm excitation is 30 ps, i.e., more or less double the value as for CP26ko and WT, indicating that τmig should be ∼300 ps. The value of τtrap is calculated (in the same way as for WT) to be ∼174 ps, similar to what is expected for WT (181 ps) and CP26ko (174 ps). Together, these numbers would thus predict an average lifetime of ∼300 + 174 = 474 ps, somewhat longer than the observed lifetime of ∼400 ps. This difference might be due to faster charge separation kinetics in the RC for this mutant but, more likely, it can also be due to a fast decay rate of the excited state for light-harvesting complexes or a subset of them.
The difference between measured and calculated average lifetime is even more pronounced for CP24ko: The difference in average lifetime on 412 and 484 nm excitation is 80 ps that implies an increase of the migration time with a factor of 5–6 as compared to the WT, meaning that the migration time by itself would already be 800–1000 ps, much longer than the observed lifetimes of 300–400 ps. The most straightforward way to explain the large difference in average lifetime on 412 and 484 nm excitation, as well as the faster-than-WT average lifetime on 412 nm excitation, is heterogeneity: the coexistence of regions of PSII characterized by a short trapping time and regions that contain badly connected or disconnected light-harvesting complexes that are quenched substantially.
The fact that for CP29as the difference of the excited-state lifetimes for the two excitation wavelengths is smaller than for CP24ko, whereas the average lifetime is larger is surprising, considering that in both mutants the amount of LHCII is identical to that of the WT. This suggests that the absence of CP29 slows down the transfer from LHCII to the core, but does not completely block it. By contrast, in the case of CP24ko, a large part of the LHCII trimers is apparently completely disconnected from the core. This result thus indicates a different organization of the subunits in the membranes of the two mutants.
Indeed, in the case of CP24ko, two different regions could be identified in the membrane by EM: i), microcrystalline arrays composed of highly ordered C2S2 supercomplexes; and ii), regions strongly enriched in LHCII (23). Thus, in CP24ko fast energy transfer is expected for the C2S2 supercomplexes that are present in high amounts in the membrane, whereas a slower lifetime should be associated to the regions enriched in LHCII, thus explaining the large difference in lifetime observed on exciting at different wavelengths.
To test this hypothesis we assumed that the different regions are not interconnected, in the sense that excitations cannot move from one region to the other. With the use of the absorption of the individual subunits we calculated the relative probabilities to excite the C2S2 supercomplexes and the LHCII-only region (considering that three out of the four LHCII present per core are located in this region). We could thus solve a system of equations in which the two unknowns are the average lifetime of C2S2 and that of disconnected LHCII in the membrane (Eq. 15). The excitation vectors in Engelmann et al. (4) were calculated using the absorption spectra of core and antennas normalized to the number of Chls:
| (15) |
This leads to an average lifetime of 110 ps for C2S2, whereas it is 560 ps for the disconnected antenna. This result is in excellent agreement with the measurements on the BBY membrane where a lifetime of 150–165 ps was observed for complexes containing 2.5 LHCII per monomeric core (19), in which case the difference in lifetime is simply due to the smaller number of Chls associated with the C2S2 complexes as compared to C2S2M2 + 0.5 LHCII trimer in the BBY preparations. From the average lifetime for the BBY membrane one would expect an average lifetime of 95–105 ps for C2S2, very close to the obtained value of 110 ps. Moreover, it is close to the average lifetime of 115 ps that was obtained for a mixture of C2S2 and C2SM (44).
It is striking that the excited-state lifetime of the disconnected LHCIIs is much shorter than the lifetime of ∼4 ns for LHCII in detergent and liposomes (45,46). Interestingly a shortening of LHCII excited-state lifetime requires only a small change of volume and free energy (47). Indeed, a shorter lifetime occurs under many conditions: when LHCII is tightly packed in liposomes (45), or when it is aggregated (39), or crystallized (48), suggesting that interactions between the complexes in the membrane cause a shortening of excited-state lifetime. It is interesting to note that recently in LHCII preparations that were argued to be in a similar state as in the thylakoid membrane the excited-state lifetime turned out to be ∼600 ps (49).
In the case of the membranes of CP29as no microcrystalline arrays could be detected on mild solubilization (22). Moreover, not even individual supercomplexes could be observed in these conditions indicating that CP29 is a key subunit for the stability of the supercomplex. Furthermore, CP29 is positioned in between the outer LHCII and the core and as such forms part of the energy transfer pathway from LHCII to the reaction center, thus suggesting that in its absence the transfer from LHCII to the RC might be slower. It is concluded that in the membrane of CP29as, each core is surrounded by several LHCII complexes that are still able to transfer energy to the RC, but less efficiently than in the WT.
Conclusions
It proved possible to extract the time-resolved fluorescence kinetics of PSII from the kinetics of thylakoid preparations, by correcting for the PSI contribution. From the results the following is concluded:
PSII contributes significantly to the short (<100 ps) fluorescence component, which is usually ascribed to PSI only.
LHCII trimers that are not part of the C2S2M2 PSII supercomplexes are responsible for migration times of the excitations to the RCs that are much longer than those for the trimers within the supercomplexes (hundreds instead of tens of ps). In the WT membranes, there are approximately two trimers present per core in the supercomplex and two are present in a different region. This explains why the average fluorescence lifetimes are substantially longer for PSII in intact thylakoid membranes than in grana preparations.
The absence of CP26 leaves the PSII organization nearly unaltered as evidenced by very similar migration times in the presence and absence of CP26. In contrast, the absence of CP29 and especially CP24 lead to substantial changes in the PSII organization as evidenced by a significant increase of the apparent migration time, demonstrating a bad connection between a significant part of the antennae and the RCs.
Antenna complexes that are badly connected or unconnected to an RC are strongly quenched: a fluorescence lifetime of ∼560 ps implies a fluorescence quantum yield of <4%, indicating extensive decay of Chl excited states by heat dissipation.
Applying the same analysis on thylakoid membranes of different composition, and under various environmental stress conditions will provide substantial new knowledge on the variability of excitation migration. Such experiments are in progress currently.
Supporting Material
Details about the experimental conditions, fluorescence emission spectra, τtrap = Neff[τCS + τRP exp(-G /kT)] derivation of and calculation of decay associated spectra are available at http://www.biophysj.org/biophysj/supplemental/S0006-3495(09)01739-1.
Supporting Material
Acknowledgments
Stefan Jansson, Umea University, is thanked for the kind gift of Lhcb4 antisense plants.
This work is was supported by the Stichting voor Fundamenteel onderzoek der Materie, which is financially supported by the Netherlands Organization for Scientific Research (B.v.O.). Fondo Integrativo per la Ricerca di Base (RBLA0345SF_002 and RBIP06CTBR_006 to R.B.), the Netherlands Organization for Scientific Research-Earth and Life Sciences (VIDI grant to R.C.), and the Lithuanian State Science and Studies Foundation (G.T.).
References
- 1.van Amerongen H., Dekker J.P. Light-harvesting in Photosystem II. In: Green B.R., Parson W.W., editors. Light-Harvesting Antennas in Photosynthesis. Kluwer Academic Publishers; Dordrecht: 2003. pp. 219–251. [Google Scholar]
- 2.van Grondelle R., Dekker J.P., Sundstrom V. Energy transfer and trapping in photosynthesis. Biochim. Biophys. Acta. 1994;1187:1–65. [Google Scholar]
- 3.Veerman J., McConnell M.D., Bruce D. Functional heterogeneity of photosystem II in domain specific regions of the thylakoid membrane of spinach (Spinacia oleracea L.) Biochemistry. 2007;46:3443–3453. doi: 10.1021/bi061964r. [DOI] [PubMed] [Google Scholar]
- 4.Engelmann E.C.M., Zucchelli G., Jennings R.C. The effect of outer antenna complexes on the photochemical trapping rate in barley thylakoid Photosystem II. Biochim. Biophys. Acta. 2005;1706:276–286. doi: 10.1016/j.bbabio.2004.11.009. [DOI] [PubMed] [Google Scholar]
- 5.Amunts A., Drory O., Nelson N. The structure of a plant photosystem I supercomplex at 3.4 A resolution. Nature. 2007;447:58–63. doi: 10.1038/nature05687. [DOI] [PubMed] [Google Scholar]
- 6.Loll B., Kern J., Biesiadka J. Towards complete cofactor arrangement in the 3.0 A resolution structure of photosystem II. Nature. 2005;438:1040–1044. doi: 10.1038/nature04224. [DOI] [PubMed] [Google Scholar]
- 7.Liu Z.F., Yan H., Chang W. Crystal structure of spinach major light-harvesting complex at 2.72 A resolution. Nature. 2004;428:287–292. doi: 10.1038/nature02373. [DOI] [PubMed] [Google Scholar]
- 8.Novoderezhkin V.I., Palacios M.A., van Grondelle R. Excitation dynamics in the LHCII complex of higher plants: modeling based on the 2.72 Angstrom crystal structure. J. Phys. Chem. B. 2005;109:10493–10504. doi: 10.1021/jp044082f. [DOI] [PubMed] [Google Scholar]
- 9.Dekker J.P., Van Grondelle R. Primary charge separation in Photosystem II. Photosynth. Res. 2000;63:195–208. doi: 10.1023/A:1006468024245. [DOI] [PubMed] [Google Scholar]
- 10.Şener M.K., Jolley C., Schulten K. Comparison of the light-harvesting networks of plant and cyanobacterial photosystem I. Biophys. J. 2005;89:1630–1642. doi: 10.1529/biophysj.105.066464. [DOI] [PMC free article] [PubMed] [Google Scholar]
- 11.Dekker J.P., Boekema E.J. Supramolecular organization of thylakoid membrane proteins in green plants. Biochim. Biophys. Acta. 2005;1706:12–39. doi: 10.1016/j.bbabio.2004.09.009. [DOI] [PubMed] [Google Scholar]
- 12.Barzda V., Peterman E.J.G., van Amerongen H. The influence of aggregation on triplet formation in light-harvesting chlorophyll a/b pigment-protein complex II of green plants. Biochemistry. 1998;37:546–551. doi: 10.1021/bi972123a. [DOI] [PubMed] [Google Scholar]
- 13.Mozzo M., Dall'Osto L., Croce R. Photoprotection in the antenna complexes of photosystem II: role of individual xanthophylls in chlorophyll triplet quenching. J. Biol. Chem. 2008;283:6184–6192. doi: 10.1074/jbc.M708961200. [DOI] [PubMed] [Google Scholar]
- 14.Dall'Osto L., Cazzaniga S., Bassi R. The Arabidopsis aba4-1 mutant reveals a specific function for neoxanthin in protection against photooxidative stress. Plant Cell. 2007;19:1048–1064. doi: 10.1105/tpc.106.049114. [DOI] [PMC free article] [PubMed] [Google Scholar]
- 15.Ahn T.K., Avenson T.J., Fleming G.R. Architecture of a charge-transfer state regulating light harvesting in a plant antenna protein. Science. 2008;320:794–797. doi: 10.1126/science.1154800. [DOI] [PubMed] [Google Scholar]
- 16.Ruban A.V., Berera R., van Grondelle R. Identification of a mechanism of photoprotective energy dissipation in higher plants. Nature. 2007;450:575–578. doi: 10.1038/nature06262. [DOI] [PubMed] [Google Scholar]
- 17.Horton P., Ruban A.V., Walters R.G. Regulation of light harvesting in green plants. Annu. Rev. Plant Physiol. Plant Mol. Biol. 1996;47:655–684. doi: 10.1146/annurev.arplant.47.1.655. [DOI] [PubMed] [Google Scholar]
- 18.Broess K., Trinkunas G., van Amerongen H. Excitation energy transfer and charge separation in photosystem II membranes revisited. Biophys. J. 2006;91:3776–3786. doi: 10.1529/biophysj.106.085068. [DOI] [PMC free article] [PubMed] [Google Scholar]
- 19.Broess K., Trinkunas G., van Amerongen H. Determination of the excitation migration time in Photosystem II consequences for the membrane organization and charge separation parameters. Biochim. Biophys. Acta. 2008;1777:404–409. doi: 10.1016/j.bbabio.2008.02.003. [DOI] [PubMed] [Google Scholar]
- 20.Roelofs T.A., Lee C.-H., Holzwarth A.R. Global target analysis of picosecond chlorophyll fluorescence kinetics from pea chloroplasts: a new approach to the characterization of the primary processes in photosystem II α- and β-units. Biophys. J. 1992;61:1147–1163. doi: 10.1016/s0006-3495(92)81924-0. [DOI] [PMC free article] [PubMed] [Google Scholar]
- 21.Harrer R., Bassi R., Schäfer C. Nearest-neighbor analysis of a photosystem II complex from Marchantia polymorpha L. (liverwort), which contains reaction center and antenna proteins. Eur. J. Biochem. 1998;255:196–205. doi: 10.1046/j.1432-1327.1998.2550196.x. [DOI] [PubMed] [Google Scholar]
- 22.Yakushevska A.E., Keegstra W., Horton P. The structure of photosystem II in Arabidopsis: localization of the CP26 and CP29 antenna complexes. Biochemistry. 2003;42:608–613. doi: 10.1021/bi027109z. [DOI] [PubMed] [Google Scholar]
- 23.de Bianchi S., Dall'Osto L., Bassi R. Minor antenna proteins CP24 and CP26 affect the interactions between photosystem II subunits and the electron transport rate in grana membranes of Arabidopsis. Plant Cell. 2008;20:1012–1028. doi: 10.1105/tpc.107.055749. [DOI] [PMC free article] [PubMed] [Google Scholar]
- 24.Kovács L., Damkjaer J., Horton P. Lack of the light-harvesting complex CP24 affects the structure and function of the grana membranes of higher plant chloroplasts. Plant Cell. 2006;18:3106–3120. doi: 10.1105/tpc.106.045641. [DOI] [PMC free article] [PubMed] [Google Scholar]
- 25.Alonso J.M., Stepanova A.N., Ecker J.R. Genome-wide insertional mutagenesis of Arabidopsis thaliana. Science. 2003;301:653–657. doi: 10.1126/science.1086391. [DOI] [PubMed] [Google Scholar]
- 26.Andersson J., Walters R.G., Jansson S. Antisense inhibition of the photosynthetic antenna proteins CP29 and CP26: implications for the mechanism of protective energy dissipation. Plant Cell. 2001;13:1193–1204. doi: 10.1105/tpc.13.5.1193. [DOI] [PMC free article] [PubMed] [Google Scholar]
- 27.Casazza A.P., Tarantino D., Soave C. Preparation and functional characterization of thylakoids from Arabidopsis thaliana. Photosynth. Res. 2001;68:175–180. doi: 10.1023/A:1011818021875. [DOI] [PubMed] [Google Scholar]
- 28.Croce R., Canino G., Bassi R. Chromophore organization in the higher-plant photosystem II antenna protein CP26. Biochemistry. 2002;41:7334–7343. doi: 10.1021/bi0257437. [DOI] [PubMed] [Google Scholar]
- 29.Schägger H., von Jagow G. Tricine-sodium dodecyl sulfate-polyacrylamide gel electrophoresis for the separation of proteins in the range from 1 to 100 kDa. Anal. Biochem. 1987;166:368–379. doi: 10.1016/0003-2697(87)90587-2. [DOI] [PubMed] [Google Scholar]
- 30.Cardol P., Bailleul B., Finazzi G. An original adaptation of photosynthesis in the marine green alga Ostreococcus. Proc. Natl. Acad. Sci. USA. 2008;105:7881–7886. doi: 10.1073/pnas.0802762105. [DOI] [PMC free article] [PubMed] [Google Scholar]
- 31.Borst J.W., Hink M.A., Visser A.J. Effects of refractive index and viscosity on fluorescence and anisotropy decays of enhanced cyan and yellow fluorescent proteins. J. Fluoresc. 2005;15:153–160. doi: 10.1007/s10895-005-2523-5. [DOI] [PubMed] [Google Scholar]
- 32.van Hoek A., Visser A.J.W.G. Artefact and distortion sources in time correlated single photon counting. Anal. Instrum. 1985;14:359–378. [Google Scholar]
- 33.Digris A.V., Skakoun V.V., Visser A.J. Thermal stability of a flavoprotein assessed from associative analysis of polarized time-resolved fluorescence spectroscopy. Eur. Biophys. J. 1999;28:526–531. doi: 10.1007/s002490050235. [DOI] [PubMed] [Google Scholar]
- 34.van Oort B., Amunts A., Croce R. Picosecond fluorescence of intact and dissolved PSI-LHCI crystals. Biophys. J. 2008;95:5851–5861. doi: 10.1529/biophysj.108.140467. [DOI] [PMC free article] [PubMed] [Google Scholar]
- 35.Ihalainen J.A., Jensen P.E., Dekker J.P. Pigment organization and energy transfer dynamics in isolated photosystem I (PSI) complexes from Arabidopsis thaliana depleted of the PSI-G, PSI-K, PSI-L, or PSI-N subunit. Biophys. J. 2002;83:2190–2201. doi: 10.1016/S0006-3495(02)73979-9. [DOI] [PMC free article] [PubMed] [Google Scholar]
- 36.Ihalainen J.A., Klimmek F., Dekker J.P. Excitation energy trapping in photosystem I complexes depleted in Lhca1 and Lhca4. FEBS Lett. 2005;579:4787–4791. doi: 10.1016/j.febslet.2005.06.091. [DOI] [PubMed] [Google Scholar]
- 37.Ihalainen J.A., van Stokkum I.H.M., Dekker J.P. Kinetics of excitation trapping in intact Photosystem I of Chlamydomonas reinhardtii and Arabidopsis thaliana. Biochim. Biophys. Acta. 2005;1706:267–275. doi: 10.1016/j.bbabio.2004.11.007. [DOI] [PubMed] [Google Scholar]
- 38.van Amerongen H., Valkunas L., van Grondelle R. World Scientific Publishing; Singapore: 2000. Photosynthetic Excitons. [Google Scholar]
- 39.van Oort B., van Hoek A., van Amerongen H. Aggregation of light-harvesting complex II leads to formation of efficient excitation energy traps in monomeric and trimeric complexes. FEBS Lett. 2007;581:3528–3532. doi: 10.1016/j.febslet.2007.06.070. [DOI] [PubMed] [Google Scholar]
- 40.Sandonà D., Croce R., Bassi R. Higher plants light harvesting proteins. Structure and function as revealed by mutation analysis of either protein or chromophore moieties. Biochim. Biophys. Acta. 1998;1365:207–214. doi: 10.1016/s0005-2728(98)00068-1. [DOI] [PubMed] [Google Scholar]
- 41.Morosinotto T., Bassi R., Barber J. Biochemical and structural analyses of a higher plant photosystem II supercomplex of a photosystem I-less mutant of barley. Consequences of a chronic over-reduction of the plastoquinone pool. FEBS J. 2006;273:4616–4630. doi: 10.1111/j.1742-4658.2006.05465.x. [DOI] [PubMed] [Google Scholar]
- 42.Yakushevska A.E., Jensen P.E., Dekker J.P. Supermolecular organization of photosystem II and its associated light-harvesting antenna in Arabidopsis thaliana. Eur. J. Biochem. 2001;268:6020–6028. doi: 10.1046/j.0014-2956.2001.02505.x. [DOI] [PubMed] [Google Scholar]
- 43.Santini C., Tidu V., Bassi R. Three-dimensional structure of the higher-plant photosystem II reaction centre and evidence for its dimeric organization in vivo. Eur. J. Biochem. 1994;221:307–315. doi: 10.1111/j.1432-1033.1994.tb18742.x. [DOI] [PubMed] [Google Scholar]
- 44.Broess, K. 2009. Primary photosynthetic processes: from supercomplex to leaf. PhD thesis. Laboratory of Biophysics, Wageningen University, Wageningen, The Netherlands.
- 45.Moya I., Silvestri M., Bassi R. Time-resolved fluorescence analysis of the photosystem II antenna proteins in detergent micelles and liposomes. Biochemistry. 2001;40:12552–12561. doi: 10.1021/bi010342x. [DOI] [PubMed] [Google Scholar]
- 46.Palacios M.A., de Weerd F.L., van Amerongen H. Superradiance and exciton (de)localization in light-harvesting complex II from green plants? J. Phys. Chem. B. 2002;106:5782–5787. [Google Scholar]
- 47.van Oort B., van Hoek A., van Amerongen H. Equilibrium between quenched and nonquenched conformations of the major plant light-harvesting complex studied with high-pressure time-resolved fluorescence. J. Phys. Chem. B. 2007;111:7631–7637. doi: 10.1021/jp070573z. [DOI] [PubMed] [Google Scholar]
- 48.Pascal A.A., Liu Z.F., Ruban A. Molecular basis of photoprotection and control of photosynthetic light-harvesting. Nature. 2005;436:134–137. doi: 10.1038/nature03795. [DOI] [PubMed] [Google Scholar]
- 49.Miloslavina Y., Wehner A., Holzwarth A.R. Far-red fluorescence: a direct spectroscopic marker for LHCII oligomer formation in non-photochemical quenching. FEBS Lett. 2008;582:3625–3631. doi: 10.1016/j.febslet.2008.09.044. [DOI] [PubMed] [Google Scholar]
- 50.Caffarri S., Kouril R., Croce R. Functional architecture of higher plant photosystem II supercomplexes. EMBO J. 2009;28:3052–3063. doi: 10.1038/emboj.2009.232. [DOI] [PMC free article] [PubMed] [Google Scholar]
Associated Data
This section collects any data citations, data availability statements, or supplementary materials included in this article.