

Abstract
Objective
To assess whether knee extensor strength or hamstring:quadriceps (H:Q) ratio predict risk for incident radiographic tibiofemoral and incident symptomatic whole knee osteoarthritis (OA) in adults age 50–79.
Methods
We followed 1617 participants (2519 knees) who, at the baseline visit of the Multicenter Osteoarthritis (MOST) Study, did not have radiographic tibiofemoral OA and 2078 participants (3392 knees) who did not have symptomatic whole knee OA (did not have the combination of radiographic OA and frequent knee symptoms). Isokinetic strength was measured at baseline and participants were followed for development of incident radiographic tibiofemoral OA or incident symptomatic whole knee OA at 30-months. Generalized estimating equations accounted for 2 knees per subject and multivariable models adjusted for age, BMI, hip BMD, history of knee surgery or pain, and physical activity score.
Results
In the studies of incident radiographic and incident symptomatic knee OA, mean ages were 62.4±8.0 and 62.3±8.0 years and mean BMI were 30.6±5.8 and 30.2±5.5 kg/m2, respectively. Knee extensor strength and H:Q ratio at baseline significantly differed between men and women. Neither knee extensor strength nor the H:Q ratio was predictive of incident radiographic tibiofemoral OA. Compared with the lowest tertile, the highest tertile of knee extensor strength protected against development of incident symptomatic whole knee OA in both sexes (adjusted OR=0.5–0.6). H:Q ratio was not predictive of incident symptomatic whole knee OA in either sex.
Conclusions
Thigh muscle strength does not appear to predict incident radiographic, but does seem to predict incident symptomatic knee OA.
INTRODUCTION
Knee osteoarthritis (OA) is a major public health concern worldwide(1) and one of the foremost causes of chronic disability in older adults.(2) Preventive care is dependent upon identification of risk factors for development of incident knee OA. Additionally, since pain is the primary complaint that leads to physician visits as well as functional limitations, it is important to clarify risk factors not only for radiographic, but also for symptomatic knee OA. In order to develop therapies directed at underlying mechanisms for incident knee OA, there has been a long-standing need for longitudinal assessment of risk factors.
There is evidence that muscle dysfunction is involved in the pathogenesis of knee OA.(3–6) As lower limb musculature is the natural brace for the knee joint, potentially important muscle dysfunction may arise from either quadriceps weakness or relative weakness of the hamstrings in comparison to the quadriceps, usually assessed as the hamstrings:quadriceps (H:Q) ratio. An H:Q ratio of greater than or equal to 0.6 is considered to be normal.(7–9) Thus, evaluation of muscle dysfunction in relation to the knee joint should examine both quadriceps strength as well as the balance of muscle strength.
Numerous cross-sectional studies have shown that persons with knee OA have lower knee extensor strength than control participants without knee OA.(3–5, 10–12) Although some of these studies indicate quadriceps muscle weakness may precede knee OA,(3, 4) this weakness has largely been attributed to joint pain that may limit muscle use and lead to atrophy. To our knowledge, there has been only 1 report of longitudinal data suggesting a link between relative quadriceps weakness (strength per body weight) and incident OA and this was found only in women and even then, was of borderline statistical significance perhaps because the numbers of men and women developing incident OA in this study were small. In this study, women who later developed knee OA were 18% weaker at baseline than those who did not develop knee OA.(13)
The longitudinal study suggested an effect of weakness on the development of radiographic knee OA, but since radiographic knee OA is often unaccompanied by pain,(14) the public health implications of this finding are uncertain. In addition to assessing the effect of quadriceps strength on incident radiographic knee OA in a longitudinal study, there is also a need to assess whether quadriceps strength alters risk for incident symptomatic knee OA – de novo knee pain or stiffness in the context of radiographic stigmata of OA. Symptomatic knee OA has been the focus of increasing interest because it parallels clinical OA, agrees with ACR criteria for OA, is unlike incident radiographic OA, and has clear-cut clinical and public health implications. While certain risk factors for radiographic knee OA have been characterized, less is known about risk factors for incident symptomatic knee OA.
Therefore, the objective of our study was to evaluate the relationship between quadriceps muscle dysfunction (strength and balance with the hamstrings) and incident radiographic tibiofemoral and incident symptomatic whole knee OA.
MATERIALS and METHODS
The Multicenter Osteoarthritis Study (MOST) is a prospective, longitudinal cohort study of risk factors for knee osteoarthritis (OA). Enrollment was from a volunteer sample of individuals from two communities and surrounding regions in Iowa and Alabama. The study enrolled 3026 men and women (6052 knees), 50–79 years of age, who responded to mass mailings or advertisements and were screened by telephone for risk factors including age, sex, previous knee injury or surgery and overweight status based on percentiles derived from the Framingham Heart Study cohort (i.e. women in the 6th, 7th, and 8th decades weighing over 154, 151, and 148 lbs respectively and men weighing over 194, 187 and 182 lbs respectively.) Exclusion criteria included a history of (or planned) bilateral knee replacement; cancer with the exception of non-melanoma skin cancer or breast, cervical, colon, prostate, rectal, or uterine cancer successfully treated with surgery; history of chemotherapy or radiation therapy; rheumatologic disease; or plan to move out of the area in the next 3 years. Inclusion criteria are outlined in Figure 1.
Figure 1.
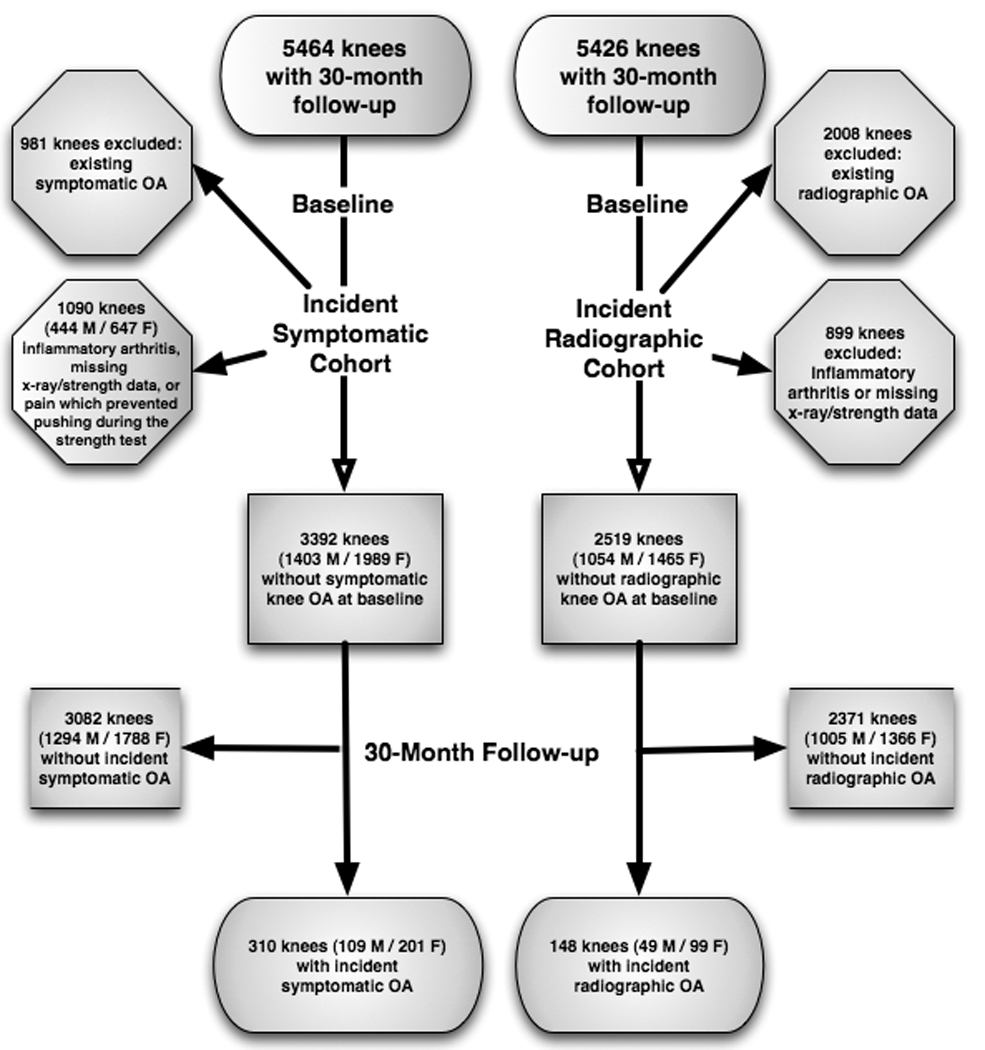
Subject Inclusion Diagram
Participants were from Iowa City, IA, and Birmingham, AL or the surrounding communities. The Institutional Review Boards (IRB) of participating institutions approved this study. All participants provided written informed consent using an IRB-approved consent process. We report here data from the baseline and 30–month follow-up visits.
Participants
The study of incident radiographic tibiofemoral OA included 2519 knees (1617 participants) without pre-existing radiographic tibiofemoral OA (Kellgren-Lawrence grade of 2 or greater)(15) at baseline, who met inclusion criteria (Figure 1).
Using previous approaches that have characterized symptomatic whole knee OA (16), we excluded knees with frequent symptoms. Knees were considered free of frequent knee symptoms at baseline if participants answered “No” at either the telephone screen or clinic visit in response to "During the past 30 days, have you had any pain, aching, or stiffness in your knee on most days?"
The study of incident symptomatic whole knee OA included 3346 knees (2046 participants) that did not have symptomatic whole knee OA at baseline and met inclusion criteria depicted in Figure 1.(15)
The following evaluations were completed at the baseline visit.
Strength Measurements
Concentric knee extensor strength was assessed with a Cybex 350 computerized isokinetic dynamometer (Avocent, Huntsville, AL) at 60 degrees per second and a chair back angle of 85 degrees. HUMAC software version 4.3.2/Cybex 300 for Windows98 Software Package was used for data acquisition. Participants were provided instructions using a standardized script for subject testing and three practice trials using 50% effort. After the practice trials, four repetitions were completed for flexor and extensor torque. Participants' concentric knee extensor and flexor strength (N•m) were considered the peak torque obtained over 4 trials. Trained examiners, certified in the standardized MOST strength testing protocol, underwent annual recertification to assure uniformity in following the strength testing protocol. Examiners calibrated the isokinetic dynamometer position, angular velocity and torque (at 25 and 245 N•m) monthly.
Participants with unilateral knee replacement performed the test on the contralateral side only. There were no participants tested who had a systolic blood pressure greater than 199 mmHg, a diastolic blood pressure greater than 109 mmHg, history of cerebral aneurysm, cerebral bleeding within the past six months, back surgery within the previous 3-months, myocardial infarction or cataract surgery within the previous 6-week period, untreated inguinal hernia, or pain that precluded participation were excluded from strength testing. To avoid potential pain or injury associated with a maximal eccentric contraction, peak torque was recorded concentrically. In a validity study conducted with the isokinetic dynamometer used, conducted concurrent with the MOST study, the strength testing protocol had an intraclass correlation coefficient of .94 (.82–.99), a coefficient of variation of 8% (6–12%) and a within subject variation of 6.3 N•m (4.71–9.63).
Hamstring to Quadriceps muscle strength ratio (H:Q)
A ratio of the peak torque of the knee flexors to knee extensors was calculated to investigate whether antagonist/agonist imbalance may alter risk for incident OA. Cutoff for dichotomizing H:Q ratio was defined at 0.6.(7–9) A confirmatory analysis was also performed using 0.8 as a cutoff.(8)
Knee radiograph assessments
Weight-bearing, fixed flexion posteroanterior(17) and lateral radiographs(18) of the knees were obtained at baseline, and 30 months according to the MOST radiograph protocol as previously described.(19) Radiographs were taken of the contralateral knee in participants with unilateral knee replacement. Each subject’s baseline and follow-up radiographs were paired and scored by two independent readers (an experienced academically-based musculoskeletal radiologist and a rheumatologist experienced in study reading) according to Kellgren-Lawrence scale.(15) Readers were not blinded to radiograph sequence, but were blinded to subject strength, the predictor in this study. For cases where the two readers disagreed on the presence of incident radiographic tibiofemoral OA, an adjudication panel of 3 experienced readers decided.
Knee Symptoms
During the telephone screen, trained and certified interviewers asked participants: "During the past 30 days, have you had pain, aching or stiffness in or around your knee on most days?" Knee symptoms were assessed again at the baseline clinic visit, where participants were asked the same question again about knee pain, aching, or stiffness. Participants who responded negatively on either the telephone screen or the baseline visit questionnaire were considered free of knee symptoms at baseline.
At the 30-month telephone screen and clinic visit, participants were again asked the same question regarding pain, aching, or stiffness in each knee on most of the past 30 days. Incident knee symptoms were defined by an affirmative response on both the screen and visit at 30 months.
Femoral Neck Bone Mineral Density (BMD)
As femoral neck BMD has been related to both knee extensor strength and incident OA, we controlled for BMD in our analyses. We obtained a bone mineral density scan of the proximal femur in participants without a history of bilateral hip replacement using dual energy x-ray absorptiometry (DXA, Hologic, 4500a and 4500w, Bedford, MA). Bone mineral density of the femoral neck region was recorded in g/cm2.
Anthropometric Measures
Height and Weight
At baseline, height in centimeters (stadiometer, Holtain, Wales, UK) and weight in kilograms were obtained by trained and certified staff and BMI (kg/m2) was calculated as reported previously.(19) Two height measurements were initially taken. If measurements differed by 3 mm, then 2 additional measurements were completed. All measurements were recorded and averaged.
Physical Activity
At baseline, participants completed the validated Physical Activity Scale for the Elderly (PASE: New England Research Institute, Watertown, MA) questionnaire, and activity scores were calculated.(20)
Definition of Incident Radiographic Tibiofemoral OA
Knees met criteria for incident radiographic tibiofemoral OA if they had no radiographic tibiofemoral OA at baseline (KL grade of less than 2) and had radiographic tibiofemoral OA (KL grade of 2 or greater) on 30-month radiographs.
Definition of Incident Symptomatic Whole knee OA
At the baseline and 30 month visits, we obtained radiographs and asked on the phone and at the clinic about the presence of knee pain or stiffness on most days. Incident symptomatic whole knee OA was defined as the combination of knee symptoms and radiographic OA in the tibiofemoral or patellofemoral compartments (whole knee OA) at the follow-up but not at the baseline visit. Recognizing that OA symptoms fluctuate,(21) we felt that at follow-up participants needed to answer ‘yes’ to the knee symptom questions both times.
Therefore, knees met criteria for incident symptomatic whole knee (tibiofemoral or patellofemoral) OA if:
at baseline they did not have radiographic whole knee OA (x-ray − ) regardless of symptoms, but at 30–months they had the combination of radiographic whole knee OA (x-ray + ) and knee symptoms on both the screen and clinic visit as described above (symptoms + )
at baseline they had radiographic whole knee OA (x-ray + ) but did not have symptoms on both the screen and clinic visit (symptoms +/− or −/− ), but at 30–months they had knee symptoms both times when asked (symptoms +/+ ), or if
they did not have radiographic whole knee OA and symptoms at baseline (x-ray - or symptoms − ) and underwent knee arthroplasty between baseline and follow-up as treatment for OA.
Statistical Methods
Participant characteristics were summarized with frequencies and means. Comparisons of peak strength and H:Q ratio by logistic regression for categorical groups (sex, and surgery) and by Pearson correlation coefficients or linear regression for continuous measures (age, body mass index, PASE score). Use of generalized estimating equations (GEE) is an accepted statistical method for using weighted combinations of observations to extract the appropriate amount of information from correlated data, providing conservative calculations of standard errors in datasets with clusters of correlated data.(22) Thus, we elected to use GEE to control for between-knee correlations within participants in our knee-based analyses.
We tested the following hypotheses using logistic regression models:
High isokinetic (a) knee extensor strength, and (b) H:Q ratio at baseline decrease risk for incident radiographic tibiofemoral OA by 30-month follow-up.
High isokinetic (a) knee extensor strength, and (b) H:Q ratio at baseline decrease risk for incident symptomatic whole knee OA at 30-month follow-up.
Analyses of outcomes were lower limb-based, considering thigh strength and H:Q ratio ipsilateral to each knee. Knees were stratified by (1) sex-specific tertiles of peak knee extensor strength and (2) whether hamstring:quadriceps ratio was ≥ 0.6 or <0.6.(7–9) Strata were compared using generalized estimating equations, adjusting for the correlation between knees within participants. Known correlates with knee extensor strength or knee OA (age, body mass index, hip bone mineral density, history of lower limb surgery, pain, and PASE score) were included in all multivariable models.
Separate analyses were performed for men and women due to differences in strength and H:Q ratio by sex. SAS Version 9.1 (SAS Institute Inc., Cary, NC) was used for all analyses and overall significance level was set at <.05.
RESULTS
Incident radiographic tibiofemoral OA
For the 2713 participants (5426 knees) with 30-month follow-up, the mean age was 62.4 ± 8.0 years, body mass index was 30.6±5.8 kg/m2, PASE score was 176.6 ±88.8, and peak knee extensor strength was 91.3 ± 43.3 N•m. Baseline peak knee extensor strength significantly differed between men (124.8 ± 42.4) and women (69.5 ± 26.7) (p<.0001) and between participants with (90.8±45.7) and without (90.1±42.3) prior knee surgery or injury (p<.0001). The proportion of men and women with a hamstring:quadriceps (H:Q) ratio less than 0.6 also significantly differed between men (50%) and women (57%) (p<.0001). Figure 1 depicts participants' analysis groups.
Of the 5,426 knees followed, 2519 eligible knees without baseline radiographic tibiofemoral OA were included (Figure 1). Baseline characteristics are summarized in Table 1. Forty-eight out of 680 men (49 knees) and 93 out of 937 women (99 knees) developed incident radiographic tibiofemoral OA. The mean knee extensor strength of those who developed incident radiographic tibiofemoral OA was 123.1 ± 47.7 for men and 74.4 ± 29.0 for women, compared with 131.2 ± 42.8 for men and 76.1 ± 25.4 for women in those who did not develop this endpoint. Approximately 55 % of men and 63% of women who developed incident radiographic tibiofemoral OA had H:Q ratios <0.6. After adjusting for age, BMI, femoral neck BMD, and PASE score, neither knee extensor strength nor H:Q ratio was a significant predictor of incident radiographic tibiofemoral OA (Table 2). This result remained constant whether knee extensor strength was analyzed as a categorical (tertile) or continuous variable.
Table 1.
Baseline Characteristics for the Study of Incident Radiographic Tibiofemoral Osteoarthritis (OA) (N=1617 participants, 2519 knees.)
| Age (years) |
Body Mass Index (BMI) (kg/m2) |
Bone Mineral Density (BMD) Femoral Neck (g/cm2) |
Knee Extensor Strength (KES, N•m) |
Hamstring: Quadriceps (H:Q) Ratio (% <0.6) |
Physical Activity Scale for the Elderly (PASE) score |
|
|---|---|---|---|---|---|---|
|
Men N=680 (1054 knees) |
61.0 ± 7.9 | 29.8 ± 4.7 | 0.9 ± 0.1 | 130.8 ± 43.1 | 51.7% | 209.7 ± 97.9 |
|
Women N=937 (1465 knees) |
61.7 ± 7.8 | 29.3 ± 5.5 | 0.8 ± 0.1 | 76.0 ± 25.6 | 58.3% | 164.5± 78.6 |
| p-value | 0.1039 | 0.0277 | <0.0001 | <0.0001 | 0.0076 | <0.0001 |
Mean±SD except as indicated
Table 2.
Association Between Knee Extensor Strength and H:Q Ratio and Incident Radiographic Tibiofemoral OA
| Knee Extensor Strength |
Sex-Specific Tertiles | N of case (%) |
OR (95% CI), Adjusting for age, BMI, BMD, surgery, and PASE at baseline |
OR (95% CI), Adjusting for age, BMI, BMD, surgery, PASE, and knee pain at baseline |
|---|---|---|---|---|
| Men | Lowest, 12–109 N•m (n=334) |
22 (6.5) |
1.0 | 1.0 |
| Middle, 110–144 N•m (n=350) |
12 (3.4) |
0.5 (0.2, 1.0) | 0.5 (0.3, 1.1) | |
| Highest, 145–276 N•m (n=370) |
15 (4.1) |
0.5 (0.2, 1.2) | 0.6 (0.3, 1.4) | |
| 1SD | 0.76 (0.52, 1.11) | 0.81 (0.55, 1.21) | ||
| Test for linear trend | p=0.1529 | p=0.3024 | ||
| Women | Lowest, 4–61 N•m (n=416) |
33 (7.9) |
1.0 | 1.0 |
| Middle, 62–83 N•m (n=514) |
30 (5.8) |
0.7 (0.4, 1.1) | 0.7 (0.4, 1.2) | |
| Highest, 84–206 N•m (n=535) |
67 (6.7) |
0.7 (0.4, 1.2) | 0.8 (0.4, 1.4) | |
| 1SD | 0.86 (0.65, 1.14) | 0.92 (0.70, 1.21) | ||
| Test for linear trend | p=0.2868 | p=0.5469 | ||
| H:Q Ratio | H:Q Cut-off |
N of case (%) |
OR (95% CI), Adjusting for age, BMI, BMD, surgery, and PASE at baseline |
OR (95% CI), Adjusting for age, BMI, BMD, surgery, knee pain and PASE at baseline |
| Men | <0.6 (n=545) | 27 (5.0) |
1.0 | 1.0 |
| ≥0.6 (n=509) | 22 (4.3) |
0.9 (0.5, 1.7) | 0.9 (0.5, 1.6) | |
| Women | <0.6 (n=854) | 62 (7.3) |
1.0 | 1.0 |
| ≥0.6 (n=611) | 37 (6.1) |
0.8 (0.6, 1.3) | 0.8 (0.5, 1.2) |
BMI: Body Mass Index
BMD: Bone Mineral Density
PASE: Physical Activity Scale for the Elderly
Incident symptomatic whole knee OA
Out of 5,464 knees, there were 3,392 eligible knees without pre-existing symptomatic knee OA (as defined above) at baseline. Excluded from the analyses were 981 knees with pre-existing symptomatic whole knee OA and 1091 knees with missing radiographic or strength data, or reported pain that prevented pushing during the measurement of muscle strength (Figure 1). Baseline characteristics of participants are summarized in Table 3. As shown in Table 4, strength was associated with KL grade at baseline among knees without symptomatic whole knee OA in both men (P=.0189) and women (P=<.0001) and H:Q ratio was not associated with KL grade at baseline in men or women.
Table 3.
Baseline characteristics for the Study of Incident Symptomatic Whole Knee OA (N=2078 participants / 3392 knees)
| Age (years) |
Body Mass Index (BMI, kg/m2) |
Bone Mineral Density (BMD) Femoral Neck (g/cm2) |
Knee Extensor Strength (KES, N•m) |
Hamstring: Quadriceps (H:Q) Ratio (% <0.6) |
Physical Activity Scale for the Elderly (PASE) Score |
|
|---|---|---|---|---|---|---|
|
Men N=846 (1403 knees) |
61.9 ± 8.2 | 30.3 ± 4.9 | 0.9 ± 0.1 | 128.9 ± 42.3 | 51.5% | 206.8 ± 97.4 |
|
Women N=1232 (1989 knees) |
62.6 ± 7.8 | 30.1 ± 5.9 | 0.8 ± 0.1 | 73.8 ± 25.5 | 58.0% | 159.4 ± 77.6 |
| p-values | 0.0337 | 0.4637 | <.0001 | <.0001 | 0.0011 | <.0001 |
Mean±SD except as indicated
Table 4.
Incident Symptomatic Whole knee Osteoarthritis Cohort: Mean Knee Extensor Strength and Frequency of Hamsting:Quadriceps (H:Q) Ratio <0.6 by Baseline Kellgren-Lawrence (KL) Grade
|
Baseline KL Grade |
Peak Knee Extensor Strength | H:Q Ratio <0.6 | ||||||
|---|---|---|---|---|---|---|---|---|
| Men* | Women* | Men | Women | |||||
| Total # of knees |
Mean ± SD (N•m) |
Total # of knees |
Mean ± SD (N•m) |
Total # of knees |
% | Total # of knees |
% | |
| 0 | 778 | 131.7 ± 43.8 | 1068 | 76.5 + 25.4 | 778 | 51.4 | 1068 | 60.2 |
| 1 | 270 | 128.7 ± 40.9 | 391 | 74.3 + 26.4 | 270 | 52.6 | 391 | 52.9 |
| 2 | 130 | 124.6 ± 36.7 | 248 | 71.2 + 23.8 | 130 | 53.9 | 248 | 58.1 |
| 3 | 188 | 124.9 ± 41.2 | 228 | 67.4 + 23.6 | 188 | 48.9 | 228 | 57.9 |
| 4 | 37 | 108.8 ± 38.2 | 54 | 55.9 + 22.0 | 37 | 48.7 | 54 | 51.9 |
p<.05 for peak knee extensor strength trend among KL grades within each sex
At the 30-month visit, 201 out of 1989 knees in women (10.1%) and 109 out of 1403 men (7.8%) had incident symptomatic whole knee OA. In men, mean baseline knee extensor strength for limbs with and without incident symptomatic whole knee OA at 30 months was 114.3 ± 41.4 and 130.2 ± 42.1, respectively. In women, mean baseline knee extensor strength in limbs with and without incident symptomatic whole knee OA at 30-month follow-up was 65.3 ± 25.6 and 74.7 ± 25.3 respectively. Compared with the lowest tertile, women in the highest tertile of peak knee extensor strength had reduced odds of incident symptomatic whole knee OA with and OR of 0.5 (95%CI: 0.3, 0.8) (Table 5). There was a slightly reduced OR of 0.5 (95% CI: 0.3, 1.1) for incident symptomatic whole knee OA in men in the highest compared with the lowest tertile of peak KES, but this lost significance after also adjusting for baseline knee pain (Table 5). When treated as a continuous measure, there was a statistically significant association between knee extensor strength and incident symptomatic whole knee OA (p=0.0143 in men, 0.0034 in women). However, H:Q ratios were not predictive of incident symptomatic whole knee OA in either women or men .
Table 5.
Association Between Knee Extensor Strength and Hamstring:Quadriceps (H:Q) Ratio and Incident Symptomatic Whole Knee Osteoarthritis
| Knee Extensor Strength |
Sex-Specific Tertiles |
N of case (%) |
OR (95% CI), Adjusting age, BMI, BMD, surgery, and PASE at baseline |
OR (95% CI), Adjusting age, BMI, BMD, surgery, PASE, and knee pain at baseline |
|---|---|---|---|---|
| Men | Lowest, 12–109 N•m (n=462) |
52 (11.3) | 1.0 | 1.0 |
| Middle, 110–144 N•m (n=465) |
30 (6.4) | 0.6 (0.4, 1.0) | 0.6 (0.4, 1.1) | |
| Highest, 145–276 N•m (n=476) |
27 (5.7) | 0.5 (0.3, 0.9)* | 0.6 (0.3, 1.1) | |
| 1SD | 0.7 (0.5, 0.9) | 0.7 (0.6, 0.9)* | ||
| P for linear trend | 0.0026 | 0.0143 | ||
| Women | Lowest, 4–61 N•m (n=647) |
96 (14.8) | 1.0 | 1.0 |
| Middle, 62–83 N•m (n=676) |
62 (9.2) | 0.7 (0.5, 0.9)* | 0.7 (0.5, 1.0) | |
| Highest, 84–206 N•m (n=666) |
43 (6.5) | 0.4 (0.3, 0.7)* | 0.5 (0.3, 0.8)* | |
| 1SD | 0.7 (0.6, 0.9)* | 0.7 (0.6, 0.9)* | ||
| P for linear trend | 0.0004 | 0.0034 | ||
| H:Q Ratio | H:Q cut-off |
N of case (%) |
OR (95% CI), Adjusting age, BMI, BMD, surgery, and PASE at baseline |
OR (95% CI), Adjusting age, BMI, BMD, surgery, knee pain and PASE at baseline |
| Men | <0.6 (722) | 57 (7.9) | 1.0 | 1.0 |
| ≥0.6 (681) | 52 (7.6) | 1.0 (0.6, 1.5) | 1.1 (0.7, 1.7) | |
| Women | <0.6 (1154) | 118(10.2) | 1.0 | 1.0 |
| ≥0.6 (835) | 83 (9.9) | 1.0 (0.7, 1.3) | 1.0 (0.7, 1.3) |
BMI: Body Mass Index
BMD: Bone Mineral Density
PASE: Physical Activity Scale for the Elderly
DISCUSSION
To our knowledge, this is the first longitudinal study of a community-based cohort that simultaneously assessed the role of quadriceps muscle strength in risk for incident radiographic and incident symptomatic whole knee OA. Our results suggest that neither higher knee extensor strength nor normal hamstring:quadriceps balance is protective against development of incident radiographic tibiofemoral OA. However, in women, being in the highest tertile of knee extensor strength appeared protective against development of incident symptomatic whole knee OA.
Our results concur with those of others with respect to the finding that strength was lower with increasing KL grade of tibiofemoral OA at baseline (Table 4).(12, 23–26) The finding that there was no correlation between KL grade and H:Q ratio also is in agreement with prior work.(24, 27) This may indicate that although quadriceps strength is lower, hamstring strength may also be lower with increasing KL grade, resulting in no change in overall sagittal plane muscle balance.
Our longitudinal results appear to differ from those of Slemenda, who reported that knee extensor weakness per body weight was a risk factor for radiographic knee OA in women.(13) An important difference between our analysis and that of Slemenda et al. may account for our respective findings. The prior report divided strength by body weight. Since women with incident OA in that study were more obese, dividing strength by body weight may have resulted in the participants with incident knee OA having a lower strength per body weight, due to their increased weight.
The analytic approach used in the prior study recognized that absolute strength values, devoid of context, are of limited usefulness in the assessment of weakness. For example, a certain degree of strength may be either normal or weak depending on the body size, age and sex. However, as fat mass increases with obesity, the ratios of both strength and muscle to body weight will necessarily decrease due to the increased denominator. For example, strength would not be expected to double with a doubling of body mass. Thus, such 1:1 ratios would not accurately reflect whether the absolute strength should be considered weak.
In order to understand the true relationship between strength and knee OA in people of different body sizes, it is important to assess the relationship recognizing that although a positive correlation between strength and body size is expected,(28, 29) like other biological standards, it may not be a 1:1 ratio.(30–33) Therefore, we chose to scale strength by controlling for BMI using logistic regression to determine body-size-independent index of strength, rather than to assume a linear ratio. This difference in methodology may account for the seemingly different results.
If there were a subgroup in which knee extensor strength may be more important for protecting against incident knee OA, we would anticipate that study of the MOST cohort would have revealed this. Participants were recruited to the MOST cohort due to the presence of known risk factors for knee OA – overweight or obese, knee pain, prior knee surgery or injury. Therefore, the absence of an association between knee extensor strength or balance with incident radiographic tibiofemoral OA in this study of 5426 at-risk knees with 148 incident radiographic outcomes suggests that a clinically significant association is unlikely to exist.
The MOST study has several unique features that enabled this study to advance knowledge beyond that of prior epidemiologic studies of knee osteoarthritis, which focused on only radiographic knee OA.(13, 34) To our knowledge, this is the first study of the effect of lower limb strength on risk for incident symptomatic whole knee OA. The ability to assess risk for development of symptomatic disease allowed this study to provide information most relevant to adults who have activity limitations and present for medical care. Therefore, the results are useful in testing prior supposition that weakness may increase risk for radiographic knee OA,(4, 35) and also extend knowledge regarding risk for incident symptomatic whole knee OA using the same cohort and methods. In addition, the MOST study focused on participants representative of those who would most benefit from prevention opportunities, those who have known risk factors for knee OA. Third, this study included comprehensive and reproducible radiographic techniques as well as measuring the outcome on a cohort of 3026 with very little loss to follow-up.
A potential limitation is inherent in the measurement of strength. The lower strength in participants with radiographic knee OA at baseline may indicate true weakness, or it may indicate co-activation of knee flexors during knee extensor testing, leading to a lower estimate of knee extensor strength due to simultaneous antagonist action.(36) For example, if participants attempted to stabilize their knee during isokinetic testing, using 10 N•m of knee flexor torque during knee extensor testing, this would have reduced the measured knee extensor strength value. Such co-contraction has been reported, particularly in people who report a sensation of knee instability.(37) However, since weakness was not predictive of incident knee OA, this potential limitation is unlikely to have influenced the results. Another limitation of the strength assessment was that this study focused on knee extension and flexion strength, and did not include assessments of hip abductor strength. Study of hip abductor strength, which is recognized as important for control of the knee joint,(38–40) may be useful in a more comprehensive assessment of risk for incident knee OA.
In this study, we aimed to identify individuals with current knee symptoms. In order to confirm the presence of consistent knee symptoms, individuals were asked about knee symptoms on most days of the last 30 days. This question is based on ACR criteria for establishing presence of symptomatic knee OA and has also been used in the Framingham knee study as well as in the Osteoarthritis Initiative. However, as symptoms can fluctuate, this question may not have identified participants who had frequent symptoms at some point outside of the past 30 days. Lastly, a study with a greater number of knees or endpoints or longer follow-up duration may be able to detect a smaller protective effect of knee extensor strength than was possible in this study that followed approximately 5400 knees over a 30-month period.
CONCLUSIONS
The highest tertile of knee extensor strength appears to protect against incident symptomatic whole knee OA. Neither knee extensor strength nor the balance of knee extensors and flexors (H:Q ratio) appear to protect against incident radiographic tibiofemoral OA in either sex. These findings suggest that targeted interventions to reduce risk for symptomatic whole knee OA may be directed towards increasing knee extensor strength, but alternative strategies should be considered for reducing risk for incident radiographic tibiofemoral OA.
Acknowledgments
This study was supported by NIH grants to: Boston University (David Felson, MD - 1 U01 AG18820);University of Iowa (James Torner, PhD - 1 U01 AG18832); University of Alabama (Cora E. Lewis, MD MSPH - 1 U01 AG18947); University of California San Francisco (Michael Nevitt, PhD - 1 U01 AG19069); and the Association of Academic Physiatrists (Neil Segal, MD -5K12HD001097-08).
REFERENCES
- 1.Woolf AD, Pfleger B. Burden of major musculoskeletal conditions. Bull World Health Organ. 2003;81(9):646–656. [PMC free article] [PubMed] [Google Scholar]
- 2.Guccione AA, Felson DT, Anderson JJ, Anthony JM, Zhang Y, Wilson PW, et al. The effects of specific medical conditions on the functional limitations of elders in the Framingham Study. Am J Public Health. 1994;84(3):351–358. doi: 10.2105/ajph.84.3.351. [DOI] [PMC free article] [PubMed] [Google Scholar]
- 3.Slemenda C, Brandt KD, Heilman DK, Mazzuca S, Braunstein EM, Katz BP, et al. Quadriceps weakness and osteoarthritis of the knee. Ann Intern Med. 1997;127(2):97–104. doi: 10.7326/0003-4819-127-2-199707150-00001. [DOI] [PubMed] [Google Scholar]
- 4.Hurley MV. The role of muscle weakness in the pathogenesis of osteoarthritis. Rheum Dis Clin North Am. 1999;25(2):283–298. doi: 10.1016/s0889-857x(05)70068-5. vi. [DOI] [PubMed] [Google Scholar]
- 5.Hurley MV. The effects of joint damage on muscle function, proprioception and rehabilitation. Man Ther. 1997;2(1):11–17. doi: 10.1054/math.1997.0281. [DOI] [PubMed] [Google Scholar]
- 6.Sharma L, Pai YC, Holtkamp K, Rymer WZ. Is knee joint proprioception worse in the arthritic knee versus the unaffected knee in unilateral knee osteoarthritis? Arthritis Rheum. 1997;40(8):1518–1525. doi: 10.1002/art.1780400821. [DOI] [PubMed] [Google Scholar]
- 7.Read MT, Bellamy MJ. Comparison of hamstring/quadriceps isokinetic strength ratios and power in tennis, squash and track athletes. Br J Sports Med. 1990;24(3):178–182. doi: 10.1136/bjsm.24.3.178. [DOI] [PMC free article] [PubMed] [Google Scholar]
- 8.Aagaard P, Simonsen EB, Magnusson SP, Larsson B, Dyhre-Poulsen P. A new concept for isokinetic hamstring: quadriceps muscle strength ratio. Am J Sports Med. 1998;26(2):231–237. doi: 10.1177/03635465980260021201. [DOI] [PubMed] [Google Scholar]
- 9.Aagaard P, Simonsen EB, Trolle M, Bangsbo J, Klausen K. Isokinetic hamstring/quadriceps strength ratio: influence from joint angular velocity, gravity correction and contraction mode. Acta Physiol Scand. 1995;154(4):421–427. doi: 10.1111/j.1748-1716.1995.tb09927.x. [DOI] [PubMed] [Google Scholar]
- 10.Stauffer RN, Chao EY, Gyory AN. Biomechanical gait analysis of the diseased knee joint. Clin Orthop Relat Res. 1977;(126):246–255. [PubMed] [Google Scholar]
- 11.Fransen M, Crosbie J, Edmonds J. Isometric muscle force measurement for clinicians treating patients with osteoarthritis of the knee. Arthritis Rheum. 2003;49(1):29–35. doi: 10.1002/art.10923. [DOI] [PubMed] [Google Scholar]
- 12.Lewek MD, Rudolph KS, Snyder-Mackler L. Quadriceps femoris muscle weakness and activation failure in patients with symptomatic knee osteoarthritis. J Orthop Res. 2004;22(1):110–115. doi: 10.1016/S0736-0266(03)00154-2. [DOI] [PMC free article] [PubMed] [Google Scholar]
- 13.Slemenda C, Heilman DK, Brandt KD, Katz BP, Mazzuca SA, Braunstein EM, et al. Reduced quadriceps strength relative to body weight: a risk factor for knee osteoarthritis in women? Arthritis Rheum. 1998;41(11):1951–1959. doi: 10.1002/1529-0131(199811)41:11<1951::AID-ART9>3.0.CO;2-9. [DOI] [PubMed] [Google Scholar]
- 14.Lawrence JS, Bremner JM, Bier F. Osteo-arthrosis. Prevalence in the population and relationship between symptoms and x-ray changes. Ann Rheum Dis. 1966;25(1):1–24. [PMC free article] [PubMed] [Google Scholar]
- 15.Kellgren JH, Lawrence JS. Radiological assessment of osteo-arthrosis. Ann Rheum Dis. 1957;16(4):494–502. doi: 10.1136/ard.16.4.494. [DOI] [PMC free article] [PubMed] [Google Scholar]
- 16.Lawrence RC, Felson DT, Helmick CG, Arnold LM, Choi H, Deyo RA, et al. Estimates of the prevalence of arthritis and other rheumatic conditions in the United States. Part II. Arthritis and rheumatism. 2008;58(1):26–35. doi: 10.1002/art.23176. [DOI] [PMC free article] [PubMed] [Google Scholar]
- 17.Nevitt MC, Peterfy C, Guermazi A, Felson DT, Duryea J, Woodworth T, et al. Longitudinal performance evaluation and validation of fixed-flexion radiography of the knee for detection of joint space loss. Arthritis and rheumatism. 2007;56(5):1512–1520. doi: 10.1002/art.22557. [DOI] [PubMed] [Google Scholar]
- 18.LaValley MP, McLaughlin S, Goggins J, Gale D, Nevitt MC, Felson DT. The lateral view radiograph for assessment of the tibiofemoral joint space in knee osteoarthritis: its reliability, sensitivity to change, and longitudinal validity. Arthritis and rheumatism. 2005;52(11):3542–3547. doi: 10.1002/art.21374. [DOI] [PubMed] [Google Scholar]
- 19.Segal NA, Felson DT, Torner JC, Zhu Y, Curtis JR, Niu J, et al. Greater trochanteric pain syndrome: epidemiology and associated factors. Archives of Physical Medicine and Rehabilitation. 2007;88(8):988–992. doi: 10.1016/j.apmr.2007.04.014. [DOI] [PMC free article] [PubMed] [Google Scholar]
- 20.Washburn RA, Smith KW, Jette AM, Janney CA. The Physical Activity Scale for the Elderly (PASE): development and evaluation. Journal of Clinical Epidemiology. 1993;46(2):153–162. doi: 10.1016/0895-4356(93)90053-4. [DOI] [PubMed] [Google Scholar]
- 21.Johnson SR, Archibald A, Davis AM, Badley E, Wright JG, Hawker GA. Is self-reported improvement in osteoarthritis pain and disability reflected in objective measures? The Journal of rheumatology. 2007;34(1):159–164. [PubMed] [Google Scholar]
- 22.Hanley JA, Negassa A, Edwardes MD, Forrester JE. Statistical analysis of correlated data using generalized estimating equations: an orientation. Am J Epidemiol. 2003;157(4):364–375. doi: 10.1093/aje/kwf215. [DOI] [PubMed] [Google Scholar]
- 23.Stauffer RN, Chao EY, Gyory AN. Biomechanical gait analysis of the diseased knee joint. Clin Orthop. 1977;126:246–255. [PubMed] [Google Scholar]
- 24.Fransen M, Crosbie J, Edmonds J. Isometric muscle force measurement for clinicians treating patients with osteoarthritis of the knee. Arthritis Rheum. 2003;49(1):29–35. doi: 10.1002/art.10923. [DOI] [PubMed] [Google Scholar]
- 25.Hurley MV, Scott DL, Rees J, Newham DJ. Sensorimotor changes and functional performance in patients with knee osteoarthritis. Ann Rheum Dis. 1997;56(11):641–648. doi: 10.1136/ard.56.11.641. [DOI] [PMC free article] [PubMed] [Google Scholar]
- 26.Baker KR, Xu L, Zhang Y, Nevitt M, Niu J, Aliabadi P, et al. Quadriceps weakness and its relationship to tibiofemoral and patellofemoral knee osteoarthritis in Chinese: the Beijing osteoarthritis study. Arthritis & Rheumatism. 2004;50(6):1815–1821. doi: 10.1002/art.20261. [DOI] [PubMed] [Google Scholar]
- 27.Hall KD, Hayes KW, Falconer J. Differential strength decline in patients with osteoarthritis of the knee: revision of a hypothesis. Arthritis Care Res. 1993;6(2):89–96. doi: 10.1002/art.1790060208. [DOI] [PubMed] [Google Scholar]
- 28.Maughan RJ, Watson JS, Weir J. Strength and cross-sectional area of human skeletal muscle. J Physiol. 1983;338:37–49. doi: 10.1113/jphysiol.1983.sp014658. [DOI] [PMC free article] [PubMed] [Google Scholar]
- 29.Harris T. Muscle mass and strength: relation to function in population studies. J Nutr. 1997;127(5 Suppl):1004S–1006S. doi: 10.1093/jn/127.5.1004S. [DOI] [PubMed] [Google Scholar]
- 30.Jaric S. Muscle strength testing: use of normalisation for body size. Sports Med. 2002;32(10):615–631. doi: 10.2165/00007256-200232100-00002. [DOI] [PubMed] [Google Scholar]
- 31.Jaric S, Radosavljevic-Jaric S, Johansson H. Muscle force and muscle torque in humans require different methods when adjusting for differences in body size. Eur J Appl Physiol. 2002;87(3):304–307. doi: 10.1007/s00421-002-0638-9. [DOI] [PubMed] [Google Scholar]
- 32.Tanner JM. Fallacy of per-weight and per-surface area standards, and their relation to spurious correlation. J Appl Physiol. 1949;2(1):1–15. doi: 10.1152/jappl.1949.2.1.1. [DOI] [PubMed] [Google Scholar]
- 33.Nevill AM, Holder RL. Scaling, normalizing, and per ratio standards: an allometric modeling approach. J Appl Physiol. 1995;79(3):1027–1031. doi: 10.1152/jappl.1995.79.3.1027. [DOI] [PubMed] [Google Scholar]
- 34.Brandt KD, Heilman DK, Slemenda C, Katz B, Mazzuca S, Braunstein EM. Quadriceps (Q) weakness: a risk factor for incidence but not progression of knee osteoarthritis (KOA) Arthritis Rheum. 1998;320:S86. doi: 10.1002/1529-0131(199811)41:11<1951::AID-ART9>3.0.CO;2-9. [DOI] [PubMed] [Google Scholar]
- 35.Becker R, Berth A, Nehring M, Awiszus F. Neuromuscular quadriceps dysfunction prior to osteoarthritis of the knee. J Orthop Res. 2004;22(4):768–773. doi: 10.1016/j.orthres.2003.11.004. [DOI] [PubMed] [Google Scholar]
- 36.Aagaard P, Simonsen EB, Andersen JL, Magnusson SP, Bojsen-Moller F, Dyhre-Poulsen P. Antagonist muscle coactivation during isokinetic knee extension. Scand J Med Sci Sports. 2000;10(2):58–67. doi: 10.1034/j.1600-0838.2000.010002058.x. [DOI] [PubMed] [Google Scholar]
- 37.Schmitt LC, Rudolph KS. Influences on knee movement strategies during walking in persons with medial knee osteoarthritis. Arthritis Care & Research. 2007;57(6):1018–1026. doi: 10.1002/art.22889. [DOI] [PMC free article] [PubMed] [Google Scholar]
- 38.Rasch A, Bystrom AH, Dalen N, Berg HE. Reduced muscle radiological density, cross-sectional area, and strength of major hip and knee muscles in 22 patients with hip osteoarthritis. Acta Orthop. 2007;78(4):505–510. doi: 10.1080/17453670710014158. [DOI] [PubMed] [Google Scholar]
- 39.Huang SC, Wei IP, Chien HL, Wang TM, Liu YH, Chen HL, et al. Effects of severity of degeneration on gait patterns in patients with medial knee osteoarthritis. Med Eng Phys. 2008;30(8):997–1003. doi: 10.1016/j.medengphy.2008.02.006. [DOI] [PubMed] [Google Scholar]
- 40.Chang A, Hayes K, Dunlop D, Song J, Hurwitz D, Cahue S, et al. Hip abduction moment and protection against medial tibiofemoral osteoarthritis progression. Arthritis Rheum. 2005;52(11):3515–3519. doi: 10.1002/art.21406. [DOI] [PubMed] [Google Scholar]