

Abstract
Merkel cell carcinoma (MCC) is an aggressive neuroendocrine skin cancer with poorly characterized genetics. We performed high-resolution comparative genomic hybridization on 25 MCC specimens using a high-density oligonucleotide microarray. Tumors frequently carried extra copies of chromosomes 1, 3q, 5p, and 6 and lost chromosomes 3p, 4, 5q, 7, 10 and 13. MCC tumors with less genomic aberration were associated with improved survival (p=0.04). Tumors from 13 of 22 MCC patients had detectable Merkel cell polyomavirus DNA, and these tumors had fewer genomic deletions. Three regions of genomic alteration were of particular interest: a deletion of 5q12-21 occurred in 26% of tumors, a deletion of 13q14-21 was recurrent in 26% of tumors and contains the well-characterized tumor suppressor RB1, and a novel focal amplification at 1p34 was present in 39% of tumors and centers on L-Myc (MYCL1). L-Myc is related to the c-Myc proto-oncogene, has transforming activity, and is amplified in the closely related small cell lung cancer. Normal skin showed no L-Myc expression, while 4/4 MCC specimens tested expressed L-Myc RNA in relative proportion to the DNA copy number gain. These findings suggest several genes that may contribute to MCC pathogenesis, most notably L-Myc.
Keywords: Merkel cell carcinoma, comparative genomic hybridization, L-Myc, Merkel cell polyomavirus, genetics
Introduction
Merkel cell carcinoma (MCC) is a neuroendocrine cancer of the skin. It is believed to arise from the sensory Merkel cells normally found in the lower epidermis and hair follicles. (Haeberle et al, 2004);(Boulais and Misery, 2007). Clinically, MCC typically presents as a rapidly growing, painless, red nodule on sun-exposed skin and carries a poor prognosis (Heath et al, 2008). Indeed, MCC is lethal in 33% of cases (Hodgson, 2005) and thus has a worse prognosis than that of melanoma (Cancer Facts & Figures, 2006). Improved diagnostic techniques and an aging population have contributed to a rapid rise in the reported incidence; currently 1500 new cases of MCC are diagnosed annually in the United States (Lemos and Nghiem, 2007).
The key oncogenic events in Merkel cell carcinoma are not well understood. Recently, a search for unique cDNA sequences present in MCC identified a novel polyomavirus that was present in 8 of 10 tumor samples (Feng et al, 2008). While existing data suggest that this virus is neither necessary nor sufficient for developing MCC, it is an open question as to whether the virus contributes to carcinogenesis in a subset of cases.
Forays into several major cancer pathways including p53 (Van Gele et al, 2000), Wnt (Liu et al, 2007), c-Kit (Swick et al, 2007), BRAF and other MAP kinase pathway members (Houben et al, 2006) have revealed little involvement of these canonical cancer pathways in the pathogenesis of MCC. The generally null findings of these directed investigations highlight the need for an unbiased approach to identify candidate oncogenic pathways for further exploration.
Comparative genomic hybridization (CGH) is a technique used to map regions of copy number alteration in a cancer genome. CGH compares DNA derived from cancer cells to normal diploid DNA to detect copy number imbalance in cancer cells. Classical chromosome CGH relies on light microscopy of metaphase spreads and resolution is thus limited. Several studies have used chromosome CGH in MCC (Harle et al, 1996, Larramendy et al, 2004, Popp et al, 2002, Van Gele et al, 2002, Van Gele et al, 1998) but did not have sufficient resolution to delineate specific candidate oncogenes or tumor suppressors. Modern array-CGH technology on oligonucleotide microarrays improves resolution up to a thousand fold and can define copy number alterations in regions as small as a single gene (Brennan et al, 2004). Array-CGH has been employed successfully to profile genetic aberrations and identify cancer-relevant genes in many malignancies such as lung and pancreatic cancer (Aguirre et al, 2004, Tonon et al, 2005).
We performed array-CGH on 25 MCC tumor samples using a DNA-microarray imprinted with >40,000 oligonucleotides that spanned the genome with a distance of only 24 kb between probes in gene rich regions. This greatly improved resolution has allowed identification of several focal regions of aberration containing candidate genes for further investigation in MCC pathogenesis.
Results
Patient and Tumor Characteristics
We studied 28 Merkel cell carcinoma tumor specimens from 25 patients with MCC. Our samples were a mixture of formalin-fixed paraffin embedded (FFPE) tumors and flash-frozen tumors. Data was excluded from three FFPE specimens due to high noise; analysis continued with the remaining 25 samples from 23 patients. Most specimens contained over 90% tumor cells, and all specimens contained at least 70% MCC tumor cells.
The patients in this cohort were similar to prior reports with regard to demographics (Table 1) as the average age at diagnosis was 71 years, and 65% (15/23) were male (Heath, et al., 2008, Allen et al, 2005). 13 primary tumors, 6 lymph node metastases, 3 distant metastases, and 3 recurrences were studied. Primary tumor size information was available for 12 of 13 primary tumors studied. In these tumors, the diameter ranged between 0.5 and 6 cm, and the median tumor size was 1.65 cm. Interestingly, we observed no relationship between primary tumor size and extent of copy number alteration (data not shown). The study included a heterogeneous group of samples including primary, recurrent, nodal metastasic and distant metastatic tissues. However, for the patients for which both a primary and metastasis were profiled, the signatures were nearly identical between the primary and metastasis, suggesting that heterogeneity of the sample types does not substantially affect interpretation of the data.
Table 1. Patient and Tumor Characteristics.
| Sample ID | Sample Type | Site of Primary Tumor |
Size of Primary Tumor (cm) |
Sex | Age | Disease Course and Comments |
% Probes Aberrant (>2.3n or <1.75n) |
MCPyV Detected? |
|---|---|---|---|---|---|---|---|---|
| MCCd1p | Primary* | Head/Neck | 1.1 | F | 79 | Died of disease at 14 months |
20 | Y |
| MCCd1m | Metastasis of MCCd1p* |
“ | “ | “ | “ | “ | 17 | Y |
| MCCd3p | Primary* | Buttock | 6 | M | 45 | Died of disease at 22 months; HIV+ |
15 | Y |
| MCCd3m | Metastasis of MCCd3p* |
“ | “ | “ | “ | “ | 10 | Y |
| MCCd5 | Primary* | Upper Limb | 5.2 | M | 63 | No relapse at 14 months |
3 | N |
| MCCd6 | Primary* | Lower Limb | 2.3 | M | 50 | No relapse at >36 months |
6 | Y |
| MCCd7 | Node* | Upper Limb | 0.6 | F | 76 | No relapse at >36 months |
4 | Y |
| MCCd8 | Primary* | Head/Neck | 2.2 | F | 86 | 16 | Y | |
| MCCd9 | Primary* | Upper Limb | 1 | F | 69 | 3 | Y | |
| MCCd10 | Primary* | Flank | 1.2 | M | 86 | Patient on immuno- suppressives |
40 | Y |
| MCCd11 | Primary* | Upper Limb | 1.7 | F | 85 | Collision tumor with squamous cell carcinoma |
58 | Y |
| MCCd12 | Primary* | Lower Limb | 1.3 | M | 85 | Died disease free at 16 months; also had renal cancer |
2 | Y |
| MCCd13 | Metastasis* | Lower Limb | 2 | M | 80 | Alive with disease at 6 months; NED at 30 months (regression) |
13 | Y |
| MCCd14 | Primary* | Lower Limb | 2.5 | M | 47 | Alive with disease at 5 months; still alive at 24 months |
11 | Y |
| MCCd15 | Primary* | Chest | 0.5 | M | 73 | No relapse at 5 months |
6 | |
| MCCd16 | Primary* | Upper Limb | 1.6 | M | 72 | No relapse at 10 months; patient has bladder cancer |
63 | N |
| MCCL1T | Node | Head/Neck | 0.6 | F | 63 | Died of disease at 14 months |
29 | N |
| MCCL3T | Node | 0.2 | M | 68 | No relapse at >36 months |
35 | N | |
| MCCL4T | Node | Head/Neck | M | 77 | Died of disease at 40 months |
24 | N | |
| MCCL5T | Recurrence | Head/Neck | F | 72 | Died of disease at 26 months |
65 | N | |
| MCCL12T | Recurrence | Head/Neck | 3 | M | 61 | Died of disease at 9 months |
21 | N |
| MCCL13T | Node | Head/Neck | 0.6 | F | 65 | No relapse at >36 months |
3 | Y |
| MCCL16T | Recurrence | Head/Neck | 0.7 | M | 71 | 20 | N | |
| MCCL21T | Node | Lower limb | M | 82 | Alive with disease at 33 months |
10 | Y | |
| MCCLSm | Primary | Head/Neck | M | 70 | 22 | N |
Asterisks represent formalin-fixed paraffin embedded specimens; all other DNA was extracted from flash-frozen tumors. Times are reported as time since diagnosis. MCPyV = Merkel cell polyomavirus, presence detected by PCR.
Eight of the 25 specimens reported here had been previously studied using classical CGH approaches (metaphase spreads). Specimens MCCL1T, MCCL3T, MCCL4T, MCCL5T, MCCL12T, MCCL13T, MCCL16T, and MCCL21T were previously reported as MCC1, MCC3, MCC4, MCC5, MCC12, MCC13, MCC16 and MCC21, respectively (Van Gele, et al., 1998). An “L” is added to the original sample names to avoid confusion with other samples in this study labeled “d”. These samples were included in the present study because the array-CGH improves resolution of copy number alteration allowing detection of previously unseen regions of alteration.
Detection of the Merkel cell polyomavirus
Specimens were tested for the presence or absence of Merkel cell polyomavirus (MCPyV) DNA by real-time PCR, as described (Garneski et al, 2008, 2), and virus was detected in tumors from 13 of 22 patients (59%) (Table 1). We cannot exclude the possible presence of a strain variant in samples with no detectable MCPyV. Comparing virus positive MCC to MCC with no detectable virus, there was a trend (not significant) towards less aberration in virus positive tumors, especially for regions of deletion (Supplementary Materials, Figure S1).
Array-CGH detects focal changes in DNA copy number in MCC tumors
Genome-wide array-CGH was performed on genomic DNA extracted from both frozen and formalin-fixed paraffin-embedded tissues. Although noise tended to be greater with FFPE samples, sufficient signals were detectable in most cases (Figure 1). For each sample, a graphical plot and the associated raw numerical data are included in Supplementary Materials (Figure S2).
Figure 1. Genome-wide profile of a representative MCC tumor.
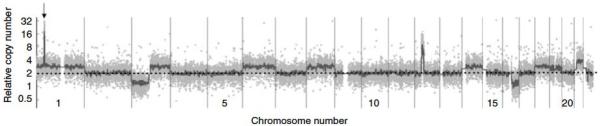
Genome-wide overview of array-CGH data that graphically depicts changes in copy number for sample MCCd10. On the x-axis (dotted line) data points are organized along the 22 autosomal chromosomes arranged from largest (on left) to smallest. A dotted line is shown at the level of 2n (normal) relative DNA amount and the y-axis depicts relative copy number on a logarithmic scale. Light grey dots represent individual data points, and the dark grey line represents the line of Moving Average Fit (see Methods). DNA for this tumor was extracted from a paraffin-embedded specimen, and noise is characteristic. Arrow points to focal amplification on chromosome 1 containing L-Myc. Plots in this format are included in Supplementary Materials (Figure S2) for all specimens.
Recurrent genomic changes across MCC tumors
Analysis of Copy Errors (ACE) detection was used to identify regions of copy number aberration for each MCC specimen (see Methods). To determine recurrent regions of aberration, we combined the data from 23 MCC specimens (only the primary was included for the two patients with both primary and metastatic tissue analyzed). For each probe, the percentage of MCC tumors that were amplified or deleted was calculated (Figure 2). Magnitude of aberration was not considered so long as the software determined the change in copy number to be statistically significant. A stringent cut-off was used to favor detection of high amplitude events that are less likely to be technical noises (see Methods).
Figure 2. Recurrent changes in relative DNA copy number in 23 Merkel cell carcinomas.
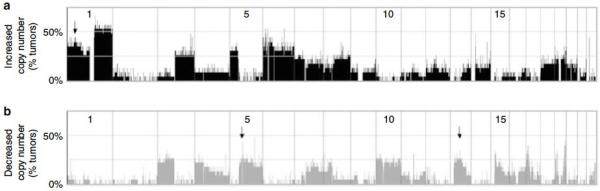
The 22 autosomal chromosomes are arranged horizontally along the x-axis, from largest to smallest, with “p” arms to the left. At each genomic location, the percentage of tumors that have an aberration is shown on the y-axis. Significant gains and losses in relative copy number were determined using ACE detection (see Methods). (a) Recurrent Gains Across the Genome. The arrow points to the 1p34 amplification detailed in Figure 4. (b) Recurrent Losses Across the Genome. Arrows represent the 5q and 13q deletions detailed in Figure 4. A similar figure in which Merkel cell polyomavirus positive and negative tumors are shown separately is available in Supplementary Materials.
Chromosomes 1, 3q, 5p and 6 were most frequently increased in copy number while chromosomes 3p, 4, 5q, 7, 10 and 13 were most frequently lost. These global findings concur with those previously published for MCC using classical CGH (Harle, et al., 1996, Larramendy, et al., 2004, Popp, et al., 2002, Van Gele, et al., 2002, Van Gele, et al., 1998). We also performed recurrence analysis including only samples not previously studied and found the genome-wide results to be very similar (data not shown).
Low levels of genomic change were associated with improved prognosis
To estimate the amount of overall genomic alteration per sample, we called probes as aberrant if they had Analysis of Copy Errors (ACE) analyzed log-ratio values greater than 0.2 or less than −0.2 (>2.3n and <1.75n relative copy number, respectively). We then calculated the percentage of probes that were aberrant for each tumor. It must be noted that the simple calculation of log2ratio to actual copy number does not take into account the small amount of stromal contamination or heterogeneity. However, we feel this approximation is useful as it aids interpretation of our findings.
We observed a wide range of genomic variation between MCC tumors. Three tumors had very high levels of alteration with >50% probes aberrant, while five tumors had almost no detectable copy number alteration with <5% probes aberrant. Copy number transitions were also determined, and the number of copy number transitions was highly correlated with percentage aberration for any given tumor (data not shown). Percent aberration and copy number transition are different metrics of overall genome rearrangement. The former estimates the percentage of the overall genome with an aberrant copy number, and the latter gives the average number of chromosomal rearrangements or breaks in a given tumor. The percentage aberration metric was chosen for analysis because a copy number transition analysis scores a narrow region of alteration the same as a wide region and may under-represent the amount of genomic change.
Disease-specific survival information was available for 17 patients. To investigate whether the percentage of aberrant probes for each tumor was associated with cause-specific survival, tumors were assigned to one of two groups: less aberration (fewer than 15% probes aberrant) or more aberration (15% or more probes aberrant). As shown in Figure 3, less aberration was associated with significantly improved disease-specific survival (p=0.04). Less aberration was associated with excellent cause-specific survival whereas outcomes in the more aberration group were mixed. Previous studies have also reported that low aberration in MCC tumors is associated with improved survival (Van Gele, et al., 1998, Larramendy, et al., 2004); however, the present study is the first such association to reach statistical significance.
Figure 3. Extent of genomic aberration is associated with disease-specific survival.
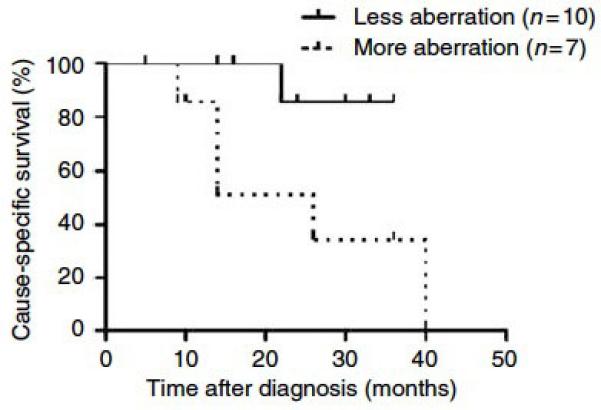
Survival data was available for 17 patients. This Kaplan-Meier analysis compares disease-specific survival of patients whose tumors displayed less genomic aberration (solid line, less than 15% of CGH probes aberrant) and those whose tumors displayed more genomic aberration (dotted line, 15% or more probes aberrant). Aberration was defined as a probe being >2.3n or <1.75 n. Patients with less aberration displayed significantly improved survival, p = 0.04 by log-rank test.
Three interesting narrow regions of amplification and deletion
Several of the regions of recurrent genomic aberration were especially interesting because they were altered in a substantial portion (>25%) of MCC tumors, were focal enough to contain fewer than 100 annotated genes, and contained biologically plausible known cancer-related genes. Graphical images of these three regions are shown in Figure 4, and accompanying information is in Table 2.
Figure 4.
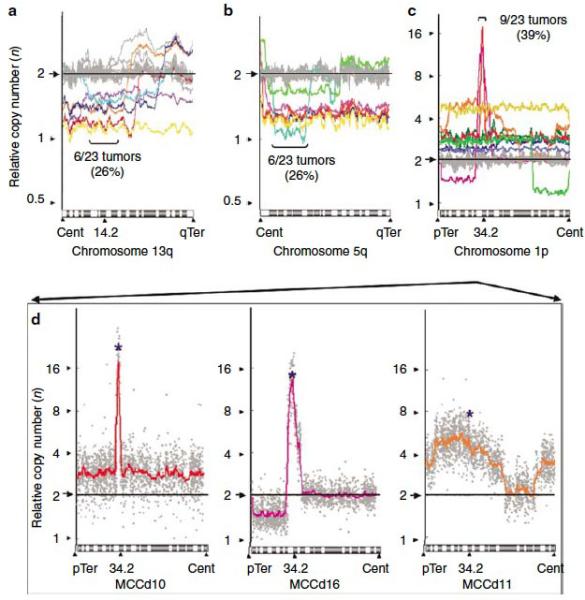
Three narrow regions of recurrent amplification or deletion, shown on chromosome arms 13q (a), 5q (b), and 1p (c). These regions were selected due to their high recurrence (>25% of MCCs altered) and focal nature. Colored lines represent individual tumor samples with copy number alteration in the region, and grey lines represent the remaining samples. For further details on these regions see Table 2. (d) Three samples with the highest relative copy number of the 1p34 region are shown in detail. The colored lines are Moving Average Fit lines redrawn from (c), and the gray dots represent individual data points. The probe targeting L-Myc is shown with a blue asterisk. Cent = centromere, pTer = p-Terminal, qTer =q-Terminal. Note y-axis scale difference between (a) and (b) versus (c).
Table 2. Characteristics of Minimum Common Regions shown in Figure 4.
| Location of recurrent copy number alteration |
Chromosome 13q14.11-13q21.33 |
Chromosome 5q12.3-5q21.1 |
Chromosome 1p34.3-1p34.2 |
|---|---|---|---|
| Type of alteration | Deletion | Deletion | Amplification |
| Approximate size (Kb) | 30700 | 34700 | 3400 |
|
Tumors with copy number alteration |
MCCd1, MCCd16, MCCL1T, MCCL3T, MCCL5T, MCCL13T |
MCCd1, MCCd16, MCCL1T, MCCL5T, MCCL12T, MCCLSm |
MCCd1, MCCd8, MCCd10, MCCd11, MCCd16, MCCL3T, MCCL12T, MCCL16T, MCCLSm |
|
Number of named genes in region |
67 | 94 | 29 |
| Genes of interest | RB1, TPT1, RFP2, DLEU1, DLEU2, DLEU7 |
XRCC4, RASA1 | MYCL1, MYCBP, HEYL |
| Functional RNAs in region | miR-16-1, miR-15a, miR- 621, ACA31 |
miR-9-2, miR-583, HBI-115, U109 |
miR-30e, miR-30c, ACA55 |
A list of all annotated genes in each region is included in Supplementary Table S1.
Previous studies have reported that RB1, a well-characterized tumor suppressor, is lost in a subset of MCC tumors (Van Gele, et al., 1998). 6 of 23 tumors in our study had losses of chromosome 13q14-13q21 (Figure 4a).
A region of recurrent deletion was located at chromosome 5q12-21 (Figure 4b). This region was lost in 6 of 23 tumors. A previous study found that this region is also deleted in 71% of BRCA1-mutant breast cancers (n=42), which suggests it may contain a tumor suppressor (Johannsdottir et al, 2006).
We found a novel recurrent amplification at 1p34 (Figure 4c). The region is amplified in 9 of 23 tumors; two specimens have especially focal amplifications and an average relative copy number of >10n. The 1p34 region is gene-rich and contains 29 annotated genes including L-Myc, a close relative of the proto-oncogene c-Myc. No relationship was observed between these three narrow regions of aberration and the presence of Merkel cell polyomavirus DNA.
L-Myc is expressed in MCC tumors
We chose the 1p34 amplification for further analysis because of the focal, high magnitude copy number increase in a subset of MCC tumors. Among the 29 genes in this region, we focused on the L-Myc gene because it is at the center of the peak of the focal amplification (Figure 4d). Furthermore, L-Myc is the most biologically plausible candidate oncogene in this region, and it has been implicated as potentially relevant in small cell lung cancer, a closely related neuroendocrine tumor (Kim et al, 2006).
Using quantitative PCR, we confirmed the DNA copy number of the L-Myc gene in 4 MCC specimens for which additional FFPE tumor was available (Figure 5a). We further used reverse-transcription PCR to test for RNA expression of L-Myc. In a specimen of UV-exposed normal adult skin used as a control, beta-actin was expressed but L-Myc was undetectable. In contrast, all four MCC tumors expressed both beta-actin and L-Myc (Figure 5b). Furthermore, the three tumors with gene amplification expressed L-Myc RNA in higher levels proportional to their DNA copy number increase.
Figure 5. L-Myc DNA amplification and RNA expression in selected MCC tumors.
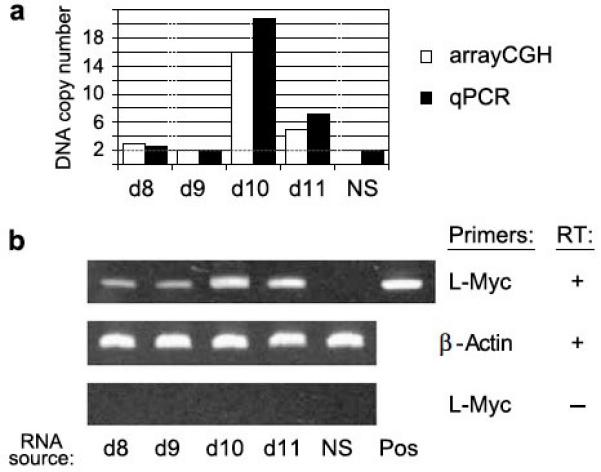
Four tumors with ample remaining materials were chosen for additional analysis. Three of these tumors (MCCd8, MCCd10, MCCd11) had amplification of the L-Myc locus by aCGH, and one tumor (MCCd9) had normal, 2n copy number at the L-Myc locus (Figure 4c). (a) Quantitative PCR confirmation of L-Myc DNA copy number amplification. White bars represent copy number determined by array-CGH, and black bars represent copy number as determined by real-time PCR. NS = normal skin (not predicted to have amplification of L-Myc). (b) L-Myc RNA is expressed in proportion to DNA amplification. L-Myc expression was investigated using reverse-transcription PCR. Top row: L-Myc is expressed in all four studied tumors but not in normal skin. The positive control for L-Myc PCR detection (pos) was an L-Myc expression construct. Middle row: Beta-actin served as a positive control. Bottom row: As a negative control, the same experiments were performed without reverse-transcriptase (RT). Three reactions were run for all conditions, and the gels shown are representative.
Discussion
We utilized array-based CGH to generate the most comprehensive overview of genomic aberration in Merkel cell carcinoma. Among our 25 specimens, the general pattern of recurrence agreed with previous studies with chromosomes 1, 5, 6, and 10 most frequently altered. For the 17 specimens with associated complete survival information, we found a statistically significant association between the amount of genomic aberration and survival. Less aberration was associated with better outcome. This suggests that genomic instability may play a role in the pathogenesis of MCC. There were too few samples, however, to determine prognostic information for individual aberrations. Of the recurrent alterations detected in this study, the most significant is the high amplitude, focal amplification of 1p34. This centers on L-Myc which is a highly plausible oncogene implicated in a closely related neuroendocrine cancer. L-Myc RNA expression was increased in proportion to DNA amplification. We anticipate that our complete CGH results, made available in Supplementary Materials, will help inform future studies of neuroendocrine tumors.
Eight specimens in our study had been previously studied using CGH on metaphase spreads (Van Gele, et al., 1998). The array-CGH technology detected several focal regions of copy number change that were previously missed. For example, in sample MCCL3T, array-CGH newly identified a gain on the terminal of 14q32-14qter that contains AKT1, a well-known gene with anti-apoptotic functions. In sample MCCL1T, we found a previously unreported narrow deletion on chromosome 4q21-4q22 that contains a protein phosphatase, PTPN13, that acts as a tumor suppressor (Spanos et al, 2008). Further, we found that sample MCCL12T had a narrow high-magnitude amplification on chromosome 11p13. This region contains only one full gene, CD44, which is a cell surface protein involved in hyaluronic acid biology and cell migration/metastasis (Gotte and Yip, 2006, Sackstein et al, 2008). These interesting findings highlight the utility of the detailed data derived from the present array-CGH platform.
The 13q14-13q21 region of recurrent deletion contains the RB1 gene. Of the six MCC tumors that had deletions in this region, four were previously reported to have this deletion and indeed had lost expression of RB1 protein (Van Gele, et al., 1998). Interestingly, the miRNAs miR-16-1 and miR-15a are also located in this portion of chromosome 13. These miRNAs are postulated to act as tumor suppressors by post-transcriptionally down-regulating BCL-2 (Cimmino et al, 2005). Thus the loss of these miRNAs may be linked to BCL-2 upregulation. This is relevant because BCL-2 protein levels are commonly elevated in MCC tumors (Kennedy et al, 1996, Plettenberg et al, 1996), and high BCL-2 levels have been shown to be functionally important in an MCC xenograft model (Schlagbauer-Wadl et al).
A copy number increase at chromosome 1p34 occurred in 39% of tumors. This novel finding, combined with our RNA expression data, raises the possibility of a role for L-Myc in MCC tumorigenesis. L-Myc is a transcription factor that is closely related to the well-characterized proto-oncogene c-Myc and its homolog n-Myc (Nau et al, 1985). The Myc genes are basic helix-loop-helix (BHLH) transcriptional regulators. Like c-Myc and n-Myc, when L-Myc is over-expressed it is able to synergize with Ras to transform fibroblasts in culture. In the cell types tested, L-Myc does so with a reduced efficiency (1-10% of the efficiency of c-Myc); however, lines transformed by L-Myc are identical in phenotype and growth rate to those transformed by c-Myc overexpression (Birrer et al, 1988).
Unlike the well-characterized c-Myc and n-Myc, the functional role of L-Myc in human cancer is less well defined. L-Myc was initially discovered in small cell lung cancer (SCLC) where it is increased in copy number 10-20 fold (Nau, et al., 1985). SCLC is a neuroendocrine tumor that shares nearly identical histology with MCC. In several SCLC cell lines with L-Myc amplifications, a reduction of L-Myc expression inhibited cell line growth in a dose-dependent manner (Dosaka-Akita et al, 1995). A recent array-based approach investigated gene amplification and expression profiles in 24 SCLC cell lines (Kim, et al., 2006). 13 of 24 cell lines carried amplifications of c-Myc, n-Myc, or L-Myc. Interestingly, no cell line carried a DNA amplification of more than one Myc gene, suggesting amplification of the various Myc genes may be functionally reciprocal. However, expression analysis showed that the downstream effects of c-, n- and L-Myc amplification differed, so the exact mechanism of L-Myc oncogenesis remains unclear.
A novel polyomavirus, Merkel cell polyomavirus (MCPyV), was recently reported to be associated with Merkel cell carcinoma tumors (Feng, et al., 2008). This virus remains to be functionally characterized but may plausibly contribute to a subset of MCCs because it is predicted to encode two oncogenic proteins (“T antigens”) (Garneski et al, 2008, 1). We tested our samples for the presence or absence of MCPyV DNA (Table 1) and found that samples with detectable viral DNA had fewer deletions than those without (Supplementary Materials, Figure S1). A notable exception is chromosome arm 19q, deleted in the majority of virus positive MCC but rarely deleted in virus negative MCC. The significance of these findings remains unclear, and a more complete analysis of the potential interplay between MCPyV and genomic changes is beyond the scope of this report.
The present array-CGH study of 25 MCC tumors provides insight into genetic aberrations in this poorly understood disease. This high-resolution dataset is made available to the public to help advance studies of this lethal cancer. Furthermore, these findings suggest an exciting new lead for further study; L-Myc amplification is possibly involved in the pathogenesis of MCC. Future studies are needed to characterize a possible functional role of Myc family members in Merkel cell carcinoma.
Materials/Methods
Patients and tumor samples
In adherence with the Declaration of Helsinki principles and keeping with NIH guidelines for the protection of human subjects, IRB approval was obtained from Dana-Farber/Harvard/Partners. The MCC tumor samples were formalin-fixed paraffin-embedded (FFPE) archival specimens or flash-frozen surgical tissue. FFPE tumor sections were obtained from Dana-Farber/Brigham & Women’s Cancer Center Pathology or from Cohen Dermatopathology. For two patients, samples of both the primary and metastasis were available (MCCd1p, MCCd1m, MCCd3p, and MCCd3m). Tumor samples with a name containing the letter “L” were provided as DNA extracted from flash frozen Australian MCC tumor specimens that are previously described (Leonard et al, 1996). Merkel cell carcinoma diagnoses were made by a dermatopathologist and confirmed with immunohistochemistry and/or with lung imaging to rule out a metastasis originating from a SCLC primary tumor.
DNA and RNA extraction from FFPE tissues
For DNA extraction, 10 micron sections were cut from FFPE blocks containing at least 70% tumor cells as determined by microscopic examination of adjacent sections. Paraffin was removed by sequential xylene and ethanol washes, and the formalin was removed by a PBS wash (pH 7.2). DNA was purified using a DNeasy Tissue Mini Kit (Qiagen, Valencia, CA) and the integrity confirmed by visualization on a 1% agarose gel. RNA was extracted from 5 micron sections of the same block using the RNeasy FFPE Kit (Qiagen).
Array-CGH
15 micrograms of genomic DNA were digested with AluI and RsaI (New England Biolabs, Ipswich, MA) and purified using the QIAquick PCR Purification Kit (Qiagen). DNA was eluted in water and diluted to 100 nanograms/microliter. DNA was random-prime labeled as described (Aguirre, et al., 2004) and hybridized to human 60-mer oligonucleotide microarrays (Agilent, Santa Clara, CA). A single batch of human, male, pooled lymphocyte DNA was used for the reference DNA for all samples (Promega, Madison, WI). Please see the complete description of this hybridization protocol for further details (Protopopov et al, 2008). Samples MCCL4T, MCCL12T, MCCL13T, MCCL21T, and MCCLSm were run on G4410B chip and the remainder were run on the G4410A chip. The microarrays contain over 40,000 coding and non-coding sequences, and provide 43 kb overall median resolution which improves to a resolution of 24 kb in gene rich regions. The fluorescence ratios for samples MCCd1p, MCCd3p-MCCd16, MCCL1T, MCCL3T, MCCL5T, and MCCL16T were calculated using the average of two paired (dye swap) arrays. The fluorescence ratios for tumor samples MCCd1m, MCCL4T, MCCL12T, MCCL13T, MCCL21T and MCCLSm were calculated using a single dye array; this was feasible due to higher DNA quality from the frozen tissues.
Detection of Merkel cell polyomavirus
Tumor specimens were tested for the presence of Merkel cell polyomavirus (MCPyV) DNA by real time PCR as described (Garneski, et al., 2008, 2). One specimen was not available for testing due to insufficient sample volume. The viral status of 14 of these samples were previously reported (Garneski, et al., 2008, 2).
Quantitative PCR (qPCR)
Confirmation of L-Myc copy number was performed by real-time quantitative PCR (qPCR). Primers were designed to amplify L-Myc and control genomic DNA sequences. The control sequence was selected within a region of euploid copy number on chromosome 2 (near the TPO gene). 2.5 nanograms of DNA were combined with primers and 2X SYBR green PCR mastermix (Applied Biosystems, Foster City, CA), denatured at 95 degrees for 10 minutes, and then run for 40 cycles of 95 degrees for 15 seconds followed by one minute of annealing at 60 degrees. Fluorescence was detected using an Applied Biosystems 7900 HT sequence detection system, and relative quantities were determined using the comparative Ct (delta-delta-Ct) method as described by the manufacturer. DNA from FFPE sun-exposed, disease free, normal human skin was used as a control for copy number, and water served as a negative control. Copy number was compared to the Moving Average Fit values for 1p34 (Figure 4c). All wells were run in triplicate, and the experiment was repeated twice. Several genomic sequences located on chromosomes 1, 3, 10 and 14 were also studied to confirm validity of CGH results, and all were consistent with CGH findings (data not shown). Primer sequences are as follows: control (TPO) forward AACTTCCTGAGCCAACAAGC and reverse CACACATTACCCGTTGGATG (expected product length 127 bp), L-Myc forward CAGTGAGCTTTCTTGGTCCT and reverse TGGCATCTTAGACCTCCACA (expected product length 105 bp).
Reverse Transcription PCR (RT-PCR)
The High Capacity cDNA reverse transcription kit (Applied Biosystems) was used with random primers to reverse transcribe 0.5 micrograms of total RNA. Primers were designed to beta-Actin (PCR control) and L-Myc. Forward and reverse primers were designed to span exons so as to only amplify cDNA. In addition, the same experiments were repeated without reverse transcriptase as a negative control. cDNA was amplified with 38 cycles of PCR (95 degrees for 15 seconds then 60 degrees for 1 minute); the product was visualized on an 8% acrylamide TBE gel stained with ethidium bromide. One picogram of a plasmid containing full length L-Myc cDNA was used as the positive control. We were unable to assay levels of L-Myc protein because no adequate antibody is commercially available. Primer sequences are as follows: control (beta-Actin) forward AGAGCTACGAGCTGCCTGAC and reverse AAGGTAGTTTCGTGGATGCC (expected product length 129 bp), L-Myc forward AGCGACTCGGAGAATGAAGA and reverse CAGCTTTCTGGAGGAAAACG (expected product length 180 bp).
Statistical analysis
Array data was log-transformed and mode-centered. The CGH-Explorer program (version 3.1) (Lingjaerde et al, 2005) was used to visualize and analyze the CGH data. Genome-wide profile images displaying the raw data for each sample were plotted, and a “Moving Average Fit” line was applied to each image (neighborhood size = 29). Images for each sample are included in Supplementary Materials (Figure S2). Views of the minimum common regions for Figure 4 were also generated using Moving Average Fit; individual data points were not displayed for (a), (b), and (c), and the neighborhood size was increased to 39 to better enable visualization of multiple samples on the same graph. Statistically significant copy number alterations were identified by applying the Analysis of Copy Errors (ACE) detection algorithm (Lingjaerde, et al., 2005), which is a validated algorithm used to determine regions of loss and gain (Meza-Zepeda et al, 2006). Data from the 22 autosomal chromosomes were analyzed. Sex chromosomes were excluded because of gender differences between patients. The stringent cut-off of the false discovery rate was set at 0.003, indicating 3 probes per 1,000 were falsely called aberrant. Raw array data and complete analysis results are included in Supplementary Materials and will be posted at the Progenetix online resource (www.progenetix.net) and at the NCI and NCBI’s SKY/M-FISH and CGH Database (2001) (http://www.ncbi.nlm.nih.gov/sky/skyweb.cgi). Annotated genes within the three narrow regions of recurrent aberration (Figure 4/Table 2) were identified using the Santa Cruz Genome Browser. Kaplan-Meier curves were generated using GraphPad Prism, version 5 (GraphPad Software, San Diego, CA).
Supplementary Material
Figure S1: Recurrent changes in relative DNA copy number in Merkel cell carcinomas with and without detectable Merkel cell polyomavirus (MCPyV). The 22 autosomal chromosomes are arranged horizontally along the x-axis, from largest to smallest, with “p” arms to the left. At each genomic location, the percentage of tumors that have an aberration is shown on the y-axis. Significant gains and losses in relative copy number were determined using ACE detection (see Methods). (a) Recurrent Gains Across the Genome. Tumors in which MCPyV was detected (n=13) are shown on the upper panel, and those without MCPyV (n=9) are on the lower panel. (b) Recurrent Losses Across the Genome. Tumors in which MCPyV was detected (n=13) are shown on the upper panel, and those without MCPyV (n=9) are on the lower panel. Note the reduced amount of deletion across many chromosomes in tumors with detectable MCPyV. Further note frequent deletions in chromosome 19 among virus positive tumors.
Figure S2: Genome-wide Profiles of Merkel Cell Carcinoma Tumors Studied. Grey dots represent individual data points, and the black line represents the line of Moving Average Fit.
Array CGH Data File: Log base 2 transformed and Analysis of Copy Error (ACE) analyzed CGH data (txt file).
Table S1: Full List of Named Genes from Minimum Common Regions in Table 2
Acknowledgements
We thank the Bomsztyk lab at the University of Washington for advice and reagents and the Eisenman lab at the Fred Hutchison Cancer Research Center for the gift of an L-Myc plasmid. Array-CGH profiling was performed at the Belfer Center for Cancer Genomics in the Center for Applied Cancer Science at Dana-Farber Cancer Institute. This project was supported by the Harvard Skin Cancer SPORE, NIH-K02-AR050993, the American Cancer Society Jerry Wachter Fund for MCC Research, the Skin Cancer Foundation, and the MCC Patient Gift Fund at the University of Washington.
Abbreviations
- CGH
comparative genomic hybridization
- FFPE
formalin-fixed paraffin embedded
- MCC
Merkel cell carcinoma
- qPCR
quantitative polymerase chain reaction
- SCLC
small cell lung cancer
Footnotes
Conflict of Interest
The authors state no conflict of interest.
This work was performed in Boston, MA, USA, and Seattle, WA, USA
References
- American Cancer Society . Cancer facts & figures. 2006. 2006. [Google Scholar]
- Aguirre AJ, Brennan C, Bailey G, Sinha R, Feng B, Leo C, et al. High-resolution characterization of the pancreatic adenocarcinoma genome. Proc Natl Acad Sci U S A. 2004;101:9067–9072. doi: 10.1073/pnas.0402932101. [DOI] [PMC free article] [PubMed] [Google Scholar]
- Allen PJ, Bowne WB, Jaques DP, Brennan MF, Busam K, Coit DG. Merkel cell carcinoma: Prognosis and treatment of patients from a single institution. J Clin Oncol. 2005;23:2300–2309. doi: 10.1200/JCO.2005.02.329. [DOI] [PubMed] [Google Scholar]
- Birrer MJ, Segal S, DeGreve JS, Kaye F, Sausville EA, Minna JD. L-myc cooperates with ras to transform primary rat embryo fibroblasts. Mol Cell Biol. 1988;8:2668–2673. doi: 10.1128/mcb.8.6.2668. [DOI] [PMC free article] [PubMed] [Google Scholar]
- Boulais N, Misery L. Merkel cells. J Am Acad Dermatol. 2007;57:147–165. doi: 10.1016/j.jaad.2007.02.009. [DOI] [PubMed] [Google Scholar]
- Brennan C, Zhang Y, Leo C, Feng B, Cauwels C, Aguirre AJ, et al. High-resolution global profiling of genomic alterations with long oligonucleotide microarray. Cancer Res. 2004;64:4744–4748. doi: 10.1158/0008-5472.CAN-04-1241. [DOI] [PubMed] [Google Scholar]
- Cimmino A, Calin GA, Fabbri M, Iorio MV, Ferracin M, Shimizu M, et al. Mir-15 and mir-16 induce apoptosis by targeting bcl2. Proc Natl Acad Sci U S A. 2005;102:13944–13949. doi: 10.1073/pnas.0506654102. [DOI] [PMC free article] [PubMed] [Google Scholar]
- Dosaka-Akita H, Akie K, Hiroumi H, Kinoshita I, Kawakami Y, Murakami A. Inhibition of proliferation by l-myc antisense DNA for the translational initiation site in human small cell lung cancer. Cancer Res. 1995;55:1559–1564. [PubMed] [Google Scholar]
- Feng H, Shuda M, Chang Y, Moore PS. Clonal integration of a polyomavirus in human merkel cell carcinoma. Science. 2008;319:1096–1100. doi: 10.1126/science.1152586. [DOI] [PMC free article] [PubMed] [Google Scholar]
- Garneski KM, Decaprio JA, Nghiem P. Does a new polyomavirus contribute to merkel cell carcinoma? Genome Biol. 2008;9:228. doi: 10.1186/gb-2008-9-6-228. [DOI] [PMC free article] [PubMed] [Google Scholar]
- Garneski KM, Warcola AH, Feng Q, Kiviat NB, Leonard JH, Nghiem P. Merkel cell polyomavirus is more frequently present in north american than australian merkel cell carcinoma tumors. J Invest Dermatol. 2008 doi: 10.1038/jid.2008.229. [DOI] [PMC free article] [PubMed] [Google Scholar]
- Gotte M, Yip GW. Heparanase, hyaluronan, and cd44 in cancers: A breast carcinoma perspective. Cancer Res. 2006;66:10233–10237. doi: 10.1158/0008-5472.CAN-06-1464. [DOI] [PubMed] [Google Scholar]
- Haeberle H, Fujiwara M, Chuang J, Medina MM, Panditrao MV, Bechstedt S, et al. Molecular profiling reveals synaptic release machinery in merkel cells. Proc Natl Acad Sci U S A. 2004;101:14503–14508. doi: 10.1073/pnas.0406308101. [DOI] [PMC free article] [PubMed] [Google Scholar]
- Harle M, Arens N, Moll I, Back W, Schulz T, Scherthan H. Comparative genomic hybridization (cgh) discloses chromosomal and subchromosomal copy number changes in merkel cell carcinomas. J Cutan Pathol. 1996;23:391–397. doi: 10.1111/j.1600-0560.1996.tb01428.x. [DOI] [PubMed] [Google Scholar]
- Heath M, Jaimes N, Lemos B, Mostaghimi A, Wang LC, Penas PF, Nghiem P. Clinical characteristics of merkel cell carcinoma at diagnosis in 195 patients: The aeiou features. J Am Acad Dermatol. 2008;58:375–381. doi: 10.1016/j.jaad.2007.11.020. [DOI] [PMC free article] [PubMed] [Google Scholar]
- Hodgson NC. Merkel cell carcinoma: Changing incidence trends. J Surg Oncol. 2005;89:1–4. doi: 10.1002/jso.20167. [DOI] [PubMed] [Google Scholar]
- Houben R, Michel B, Vetter-Kauczok CS, Pfohler C, Laetsch B, Wolter MD, et al. Absence of classical map kinase pathway signalling in merkel cell carcinoma. J Invest Dermatol. 2006;126:1135–1142. doi: 10.1038/sj.jid.5700170. [DOI] [PubMed] [Google Scholar]
- Johannsdottir HK, Jonsson G, Johannesdottir G, Agnarsson BA, Eerola H, Arason A, et al. Chromosome 5 imbalance mapping in breast tumors from brca1 and brca2 mutation carriers and sporadic breast tumors. Int J Cancer. 2006;119:1052–1060. doi: 10.1002/ijc.21934. [DOI] [PubMed] [Google Scholar]
- Kennedy MM, Blessing K, King G, Kerr KM. Expression of bcl-2 and p53 in merkel cell carcinoma. An immunohistochemical study. Am J Dermatopathol. 1996;18:273–277. doi: 10.1097/00000372-199606000-00006. [DOI] [PubMed] [Google Scholar]
- Kim YH, Girard L, Giacomini CP, Wang P, Hernandez-Boussard T, Tibshirani R, et al. Combined microarray analysis of small cell lung cancer reveals altered apoptotic balance and distinct expression signatures of myc family gene amplification. Oncogene. 2006;25:130–138. doi: 10.1038/sj.onc.1208997. [DOI] [PubMed] [Google Scholar]
- Larramendy ML, Koljonen V, Bohling T, Tukiainen E, Knuutila S. Recurrent DNA copy number changes revealed by comparative genomic hybridization in primary merkel cell carcinomas. Mod Pathol. 2004;17:561–567. doi: 10.1038/modpathol.3800091. [DOI] [PubMed] [Google Scholar]
- Lemos B, Nghiem P. Merkel cell carcinoma: More deaths but still no pathway to blame. J Invest Dermatol. 2007;127:2100–2103. doi: 10.1038/sj.jid.5700925. [DOI] [PubMed] [Google Scholar]
- Leonard JH, Williams G, Walters MK, Nancarrow DJ, Rabbitts PH. Deletion mapping of the short arm of chromosome 3 in merkel cell carcinoma. Genes Chromosomes Cancer. 1996;15:102–107. doi: 10.1002/(SICI)1098-2264(199602)15:2<102::AID-GCC4>3.0.CO;2-7. [DOI] [PubMed] [Google Scholar]
- Lingjaerde OC, Baumbusch LO, Liestol K, Glad IK, Borresen-Dale AL. Cgh-explorer: A program for analysis of array-cgh data. Bioinformatics. 2005;21:821–822. doi: 10.1093/bioinformatics/bti113. [DOI] [PubMed] [Google Scholar]
- Liu S, Daa T, Kashima K, Kondoh Y, Yokoyama S. The wnt-signaling pathway is not implicated in tumorigenesis of merkel cell carcinoma. J Cutan Pathol. 2007;34:22–26. doi: 10.1111/j.1600-0560.2006.00577.x. [DOI] [PubMed] [Google Scholar]
- Meza-Zepeda LA, Kresse SH, Barragan-Polania AH, Bjerkehagen B, Ohnstad HO, Namlos HM, et al. Array comparative genomic hybridization reveals distinct DNA copy number differences between gastrointestinal stromal tumors and leiomyosarcomas. Cancer Res. 2006;66:8984–8993. doi: 10.1158/0008-5472.CAN-06-1972. [DOI] [PubMed] [Google Scholar]
- Nau MM, Brooks BJ, Battey J, Sausville E, Gazdar AF, Kirsch IR, et al. L-myc, a new myc-related gene amplified and expressed in human small cell lung cancer. Nature. 1985;318:69–73. doi: 10.1038/318069a0. [DOI] [PubMed] [Google Scholar]
- Plettenberg A, Pammer J, Tschachler E. Merkel cells and merkel cell carcinoma express the bcl-2 proto-oncogene. Exp Dermatol. 1996;5:183–188. doi: 10.1111/j.1600-0625.1996.tb00114.x. [DOI] [PubMed] [Google Scholar]
- Popp S, Waltering S, Herbst C, Moll I, Boukamp P. Uv-b-type mutations and chromosomal imbalances indicate common pathways for the development of merkel and skin squamous cell carcinomas. Int J Cancer. 2002;99:352–360. doi: 10.1002/ijc.10321. [DOI] [PubMed] [Google Scholar]
- Protopopov A, Feng B, Chin L. Full complexity genomic hybridization on 60-mer oligonucleotide microarrays for array comparative genomic hybridization (acgh) In: Starkey M, Elaswarapu R, editors. Genomics protocols: Second edition, methods in molecular biology. Humana Press Inc.; Totowa, NJ: 2008. pp. 87–100. [DOI] [PubMed] [Google Scholar]
- Sackstein R, Merzaban JS, Cain DW, Dagia NM, Spencer JA, Lin CP, Wohlgemuth R. Ex vivo glycan engineering of cd44 programs human multipotent mesenchymal stromal cell trafficking to bone. Nat Med. 2008;14:181–187. doi: 10.1038/nm1703. [DOI] [PubMed] [Google Scholar]
- Schlagbauer-Wadl H, Klosner G, Heere-Ress E, Waltering S, Moll I, Wolff K, et al. Bcl-2 antisense oligonucleotides (g3139) inhibit merkel cell carcinoma growth in scid mice. J Invest Dermatol. 2000;114:725–730. doi: 10.1046/j.1523-1747.2000.00937.x. [DOI] [PubMed] [Google Scholar]
- Spanos WC, Hoover A, Harris GF, Wu S, Strand GL, Anderson ME, et al. The pdz binding motif of human papillomavirus type 16 e6 induces ptpn13 loss, which allows anchorage-independent growth and synergizes with ras for invasive growth. J Virol. 2008;82:2493–2500. doi: 10.1128/JVI.02188-07. [DOI] [PMC free article] [PubMed] [Google Scholar]
- Swick BL, Ravdel L, Fitzpatrick JE, Robinson WA. Merkel cell carcinoma: Evaluation of kit (cd117) expression and failure to demonstrate activating mutations in the c-kit proto-oncogene - implications for treatment with imatinib mesylate. J Cutan Pathol. 2007;34:324–329. doi: 10.1111/j.1600-0560.2006.00613.x. [DOI] [PubMed] [Google Scholar]
- Tonon G, Wong KK, Maulik G, Brennan C, Feng B, Zhang Y, et al. High-resolution genomic profiles of human lung cancer. Proc Natl Acad Sci U S A. 2005;102:9625–9630. doi: 10.1073/pnas.0504126102. [DOI] [PMC free article] [PubMed] [Google Scholar]
- Van Gele M, Kaghad M, Leonard JH, Van Roy N, Naeyaert JM, Geerts ML, et al. Mutation analysis of p73 and tp53 in merkel cell carcinoma. Br J Cancer. 2000;82:823–826. doi: 10.1054/bjoc.1999.1006. [DOI] [PMC free article] [PubMed] [Google Scholar]
- Van Gele M, Leonard JH, Van Roy N, Van Limbergen H, Van Belle S, Cocquyt V, et al. Combined karyotyping, cgh and m-fish analysis allows detailed characterization of unidentified chromosomal rearrangements in merkel cell carcinoma. Int J Cancer. 2002;101:137–145. doi: 10.1002/ijc.10591. [DOI] [PubMed] [Google Scholar]
- Van Gele M, Speleman F, Vandesompele J, Van Roy N, Leonard JH. Characteristic pattern of chromosomal gains and losses in merkel cell carcinoma detected by comparative genomic hybridization. Cancer Res. 1998;58:1503–1508. [PubMed] [Google Scholar]
Associated Data
This section collects any data citations, data availability statements, or supplementary materials included in this article.
Supplementary Materials
Figure S1: Recurrent changes in relative DNA copy number in Merkel cell carcinomas with and without detectable Merkel cell polyomavirus (MCPyV). The 22 autosomal chromosomes are arranged horizontally along the x-axis, from largest to smallest, with “p” arms to the left. At each genomic location, the percentage of tumors that have an aberration is shown on the y-axis. Significant gains and losses in relative copy number were determined using ACE detection (see Methods). (a) Recurrent Gains Across the Genome. Tumors in which MCPyV was detected (n=13) are shown on the upper panel, and those without MCPyV (n=9) are on the lower panel. (b) Recurrent Losses Across the Genome. Tumors in which MCPyV was detected (n=13) are shown on the upper panel, and those without MCPyV (n=9) are on the lower panel. Note the reduced amount of deletion across many chromosomes in tumors with detectable MCPyV. Further note frequent deletions in chromosome 19 among virus positive tumors.
Figure S2: Genome-wide Profiles of Merkel Cell Carcinoma Tumors Studied. Grey dots represent individual data points, and the black line represents the line of Moving Average Fit.
Array CGH Data File: Log base 2 transformed and Analysis of Copy Error (ACE) analyzed CGH data (txt file).
Table S1: Full List of Named Genes from Minimum Common Regions in Table 2