

Abstract
AIMS
Long-term mycophenolate mofetil (MMF) therapy may induce inosine 5′-monophosphate dehydrogenase (IMPDH) activity in peripheral blood mononuclear cells (PBMCs), thus decreasing MMF immunosuppressive properties. Pharmacodynamic monitoring was used to investigate whether biological activity is altered after long-term therapy.
METHODS
IMPDH activity was measured in PBMC samples from 54 stable kidney transplant patients, already on MMF (for at least 3 months), before (t0) and 2 h after (t2) MMF morning dose administration; levels were monitored for up to 15 months, together with total mycophenolic acid (MPA) and free MPA concentrations.
RESULTS
During the 15 months' monitoring, t0 IMPDH activity in transplant recipients increased from 5.9 ± 3.7 nmol h−1 mg−1[95% confidence interval (CI) 4.9, 6.9] to 9.0 ± 3.9 nmol h−1 mg−1 (95% CI 7.2, 10.8), with an intra- and interpatient variability of 28% and 42%. Five patients experienced acute rejection during the follow-up: t0 IMPDH activity was increased during rejection vs. nonrejection, and the trend was significantly higher in rejecting than in nonrejecting subjects for the whole monitoring period.
CONCLUSIONS
Even though a correlation has been found between IMPDH activity and rejection, its efficacy as a predictive tool in long-term transplant outcomes may be affected by high interpatient variability; on the other hand, continuous monitoring of the IMPDH trend could make an effective prognostic parameter of rejection. Other trials also including pre-transplant data on both IMPDH expression and activity are warranted to better assess their role as biomarkers for MPA effect in clinical practice.
Keywords: IMPDH, mycophenolic acid, pharmacodynamics, pharmacokinetics, rejection, renal transplant
WHAT IS ALREADY KNOWN ABOUT THIS SUBJECT
Mycophenolic acid (MPA) is a potent, selective and reversible inhibitor of inosine 5′-monophosphate dehydrogenase (IMPDH), the rate-limiting enzyme for de novo guanosine triphosphate biosynthesis.
The large IMPDH interindividual variability could be responsible for the differences in therapeutic effects and side-effects observed with MPA.
Induction of IMPDH activity has been observed in whole blood during immunosuppressive therapy.
WHAT THIS STUDY ADDS
Our data were acquired in long-term mycophenolate mofetil-treated renal transplant recipients on different combinations of immunosuppressive agents (ciclosporin, tacrolimus, sirolimus) and with different treatment duration (up to 8.8 years post transplant).
The increasing trend in IMPDH activity that we observed throughout our 12-month observation period was significantly higher in rejecting than in nonrejecting subjects.
Introduction
The current improvement in graft survival rates depends on both the efficacy and the tolerability of the immunosuppressants used in the prophylaxis of organ rejection. Mycophenolate mofetil (MMF) is the 2,4-morpholino-ester of mycophenolic acid (MPA), a potent immunosuppressive agent, currently used as part of standard immunosuppressive protocols after solid organ transplantation in most centres. After oral administration, MMF is rapidly and completely absorbed and then hydrolysed by esterase in plasma, liver and kidney to MPA, the pharmacologically active moiety [1].
The action of MPA is based on the reversible inhibition of inosine 5′-monophosphate dehydrogenase (IMPDH), the rate-limiting enzyme for the de novo guanosine triphosphate (GTP) biosynthesis pathway, which occurs in activated lymphocytes. IMPDH catalyses the nicotinamide adenine dinucleotide NAD-dependent oxidation of inosine 5′-monophosphate (IMP) to xanthosine 5′-monophosphate (XMP).
Humans have two isoforms of IMPDH, type I and type II, encoded by two differently regulated genes [2, 3]. Although the isoenzymes have indistinguishable catalytic properties, they are not mutually redundant [4]. In fact, type I enzyme is constitutively expressed and represents the predominant form of all resting cells, whereas type II enzyme is inducible and prevails in proliferating cells [5, 6]. Resting cells use the salvage pathway for GTP biosynthesis, whereas proliferating cells ultimately depend on the activity of IMPDH type II for their GTP requirements. Thus MMF exerts selective antiproliferative effects on lymphocytes, inhibiting their IMPDH type II.
Unfortunately, MMF administration is frequently associated with dose-dependent side-effects, such as gastrointestinal (diarrhoea, gastritis, gastrointestinal bleeding) or haematological (leukopenia, anaemia, thrombocytopenia) adverse events [7, 8]. Consequently, a number of patients require dose reduction or discontinuation of MMF administration, which leads to an increased risk of acute rejection (AR) caused by suboptimal immunosuppression [9, 10]. From this point of view, measurement of the biological response to MMF could make a useful tool for customizing the immunosuppressive regimen to the individual patient, and measurement of pharmacodynamic drug effects by determination of IMPDH activity may provide direct information on the functional activity of MMF therapy in vivo[11, 12].
Several studies have demonstrated large interpatient variability in both baseline IMPDH activity and the time required for complete recovery of enzyme activity after MMF administration [13–15]. An increase in IMPDH activity has been demonstrated in the whole blood of patients receiving MPA-based immunosuppressive therapy [16, 17], which suggests that MPA may induce IMPDH genes. However, although an increase in IMPDH activity and gene expression in red cell lines has been reported in patients undergoing MPA treatment, no similar activations were observed in lymphocytes [18, 19].
Some data show that MMF causes a significant reduction in GTP in isolated peripheral blood mononuclear cells (PBMCs), with a paradoxical simultaneous elevation of GTP in erythrocytes [20]. Therefore, PBMCs are the preferred matrix for the evaluation of IMPDH activity.
We used data from pharmacokinetic and pharmacodynamic monitoring to investigate the intra- and interpatient variability of IMPDH biological activity in kidney transplant recipients during routine follow-up.
Methods
Chemicals, reagents and stock solution
MPA and its carboxybutoxy ether were a generous gift of Roche Palo Alto (Palo Alto, CA, USA); orthophosphoric acid, ammonia solution, acetic acid glacial, high-performance liquid chromatography (HPLC) grade methyl alcohol and water were purchased from Carlo Erba Reagents (Rodano, MI, Italy); Histopaque 1077, IMP, NAD+ and XMP were obtained from Sigma-Aldrich (Steinhem, Germany), SPE OASIS HLB 1 cc (30 mg) extraction cartridges from Waters Corp. (Milford, MA, USA) and ultrafiltration devices Centrifree YM-30 (30 000 molecular weight cut-off) from Millipore (Billerica, MA, USA).
Stock solutions of MPA and the internal standard (IS) carboxybutoxy ether of MPA (1 mg ml−1) were prepared in methyl alcohol and stored at −80°C.
Patients and study protocol
Our clinical study was based on the experience of a single renal transplant centre at the IRCCS Foundation Policlinico S. Matteo (Pavia, Italy); the study was approved by the local Ethics Committee in accordance with the Declaration of Helsinki, and all patients gave their written informed consent. A total of 54 consecutive patients, transplanted at least 6 months earlier (median 3.2 years, range 0.5–8.8 years) and undergoing routine follow-up, were included and monitored for 15 months thereafter. They were in stable clinical condition (namely had stable kidney function and did not experience any infection or rejection) for 3 months prior to enrolment, and had been receiving a maintenance immunosuppressive therapy consisting of MMF, steroids, ciclosporin (CsA), tacrolimus (Tac) or sirolimus (Sir) for at least 3 months.
At the time of transplantation, MMF treatment was started and continued at 1 g b.i.d., with a view to maintaining the target concentration range (>1 µg ml−1). However, MMF dose could be adjusted by the attending physicians based on blood leucocyte count and other clinical indicators of drug tolerability and adverse effects.
MMF treatment was part of a standard therapy, individualized for each patient according to post-transplant period and clinical conditions.
CsA, Tac, or Sir doses were modulated and titrated in order to maintain whole-blood trough concentrations of 130–200 ng ml−1 for CsA (by EMIT, Siemens, Deerfield, IL, USA), 8–16 ng ml−1 for Tac (by EMIT, Siemens) and 10–16 ng ml−1 for Sir (FPIA–IMx, Abbott, Abbott Park, IL, USA).
From month 3 on, steroid doses were administered at 0.20 mg kg−1 day−1 p.o. tapered within the first year to 0.1 mg kg−1 day−1 p.o. and maintained at 0.05 mg kg−1 day−1 thereafter.
Each patient was monitored for at least 12 months after entering the study for pharmacokinetic/pharmacodynamic parameters as well as for clinical status, occurrence of renal/gastrointestinal/haematological adverse events and infections, occurrence of graft rejection. Some patients underwent additional visits, up to month 15, and their data are also included in tables and figures, while others missed some visits but were not lost to follow-up. All rejection episodes were biopsy proven according to the Banff criteria [21, 22].
Sampling procedure
Patients were divided into three groups, CsA, Tac and Sir, according to the immunosuppressive drug on which their therapy was based.
All patients were monitored for plasma total/free MPA concentrations, IMPDH activity and other haematochemical parameters at time zero (on enrolment, after at least 3 months of stable condition under MMF therapy), and at 2, 4, 6, 8, 10, 12 and 15 months after enrolment.
To determine total and free MPA concentrations, whole blood samples [ethylenediamine tetraaceticacid (EDTA)] were drawn at each follow-up visit at the following sampling times: just before the morning dose (time 0), 0.67 and 2 h (CsA group); 0, 0.5 and 2 h (Tac group) and 0 and 2 h (Sir group) after MMF administration; these time points were chosen according to algorithms previously validated for CellCept®[23, 24] and were convenient for our outpatient population.
Plasma was rapidly isolated by centrifugation at 3000 g for 15 min to avoid deglucuronidation of metabolites [25] and total and free MPA concentrations were quantified by a validated HPLC-UV method (see below).
When blood samples were taken for measurement of MPA concentrations, a further 7 ml was drawn (Li-heparin) for measurement of IMPDH activity, by a nonradioactive assay method, during the above observational visits, just before the morning dose (time 0), and 2 h after MMF administration in all three treatment groups (CsA, Tac and Sir).
Analytical methods: total and free MPA (MPAtot and fMPA)
Plasma concentrations of total MPA were measured by a validated HPLC-UV assay at the Clinical Pharmacokinetics Laboratory (IRCCS Foundation Policlinico S. Matteo, Pavia, Italy). Extraction was performed on OASIS HLB 1 cc solid-phase columns (Waters) preconditioned with water and methyl alcohol, as recommended by the manufacturer. Samples were prepared by adding 40 µl of the IS (10 µg ml−1 carboxybutoxy ether of MPA in methyl alcohol) to 0.5 ml of plasma. After washing with water/methanol 5%, acetic acid 2% solution pH 2.7, the sample was eluted with water/methanol 65%, 2% ammonia solution pH 12.0. The eluate was dried under a nitrogen stream at 30°C and dissolved in 200 µl of 55% methanol, 0.1% ortophosphoric acid (mobile phase); 80 µl was injected onto a Supelcosil LC-8 analytical column (15 cm × 4.6 mm, 5 µm, Supelco; Sigma-Aldrich, Bellefonte, PA, USA) at room temperature. Isocratic chromatographic separation was performed in the above mobile phase at a flow rate of 1.3 ml min−1, and analytes monitored at 215 nm. In a concentration range of total MPA from 0.1 to 15 µg ml−1, the calibration curves were linear and the coefficient of determination (r2) ranged from 0.9980 to 0.9997; the lower limit of quantification (LOQ) for MPA was 0.05 µg ml−1; the inter- and intra-assay coefficients of variation (CVs) of the validation procedure were <10%. The assay accuracy ranged form 92.22 to 106.82% (mean ± SD, 98.68 ± 5.55%) and the CV was <10%. The analytical performance of the HPLC assay for total MPA was ensured through participation in the Mycophenolic Acid proficiency Testing Scheme, provided by Analytical Services International (London, UK).
For free MPA extraction plasma samples were previously submitted to ultrafiltration with Microcon YM-30 [26], in order to separate free from protein-bound MPA, and then processed as for total MPA. Standards (0.025, 0.05, 0.25, 0.5, 0.75, 1 µg ml−1) and quality control samples (0.0625, 0.40 and 0.8 µg ml−1) were not prepared in plasma ultrafiltrate due to the very large volumes of ultrafiltrate required, but in buffered saline at pH 7.4, which has already been validated as a suitable matrix for such samples [27, 28]. In a concentration range from 0.05 to 1 µg ml−1, the calibration curves were linear and the coefficient of determination (r2) ranged from 0.9980 to 0.9991; the lower LOQ for MPA was 0.0125 µg ml−1; the inter- and intra-assay CVs of the validation procedure were <5%. The assay accuracy ranged form 91.8 to 105.4% (mean ± SD, 99.8 ± 4.0%) and the CV was <5%. The free fraction was calculated by dividing fMPA by total concentration in the spiked samples.
Blood collection and isolation of lymphocytes
Blood samples (7 ml) were collected in Li-heparin-containing tubes and stored at room temperature. PBMCs were isolated within 6 h of collection from blood by Ficoll gradient density method according to Boyum [29]. Blood was diluted twice with phosphate-buffered saline (PBS, pH 7.4) and 10 ml of this suspension was layered on 3 ml Histopaque 1077 and centrifuged at room temperature at 700 g for 30 min. PBMCs were collected from the interface, diluted with an equal volume of PBS and centrifuged at 900 g for 15 min at 4°C. The resulting pellets were then incubated with 3 ml of a red blood cell (RBC) lysis buffer (150 mM NH4Cl, 10 mM KHCO3, 0.1 mM disodium EDTA, pH 7.3) for 10 min, centrifuged at 900 g for 15 min at 4°C, and the pellet stored at −80°C until assay.
PBMCs were resuspended in 200 µl of 40 mM potassium phosphate buffer pH 7.4, 100 mM KCl, and disrupted by sonication (three pulses of 10 s at 15 µm amplitude), using an MSE Sonicator (Fisons, Loughborough, UK). Insoluble fragments were removed by centrifugation at 12 000 g for 10 min and the supernatant was immediately used for enzymatic assay and protein determination. The protein content of cell lysates was assayed according to Lowry [30].
IMPDH activity assay
The IMPDH activity of PBMCs was assayed with an HPLC-based method, according to Glander et al. [31] with minor changes. All samples were analysed in duplicate. The standard reaction mixture contained 40 mM potassium phosphate pH 7.4, 100 mM KCl, 1 mM IMP, 1 mM NAD+, 40 µl of lysed PBMCs in a final volume of 100 µl. After 3 h of incubation at 37°C, the reaction was stopped by boiling the assay mixture for 10 min and samples were centrifuged at 12 000 g for 10 min. Considering the previously reported data about stability of enzyme activity, the supernatants, stored at 4°C, were injected into the column to separate the analytes no later than after 3 h of storage. Separation was carried out using an Ultrasphere-ODS column (250 × 4.6 mm, 5 µm particle size; Beckman-Coulter, Fullerton, CA, USA), with a methanol linear gradient (10 ml, 0.4–1.4%) in 20 mM potassium phosphate, pH 6.1, followed by 6% methanol (8 ml). The flow rate was 1.0 ml min−1 and analytes were monitored at 254 nm.
The nmoles of XMP produced were determined using a calibration curve obtained by injecting scalar, known amounts (0.06–10 nmol) of XMP, treated the same way as adopted for the enzyme assay. Enzyme activity was expressed as nmol h−1 mg−1 of protein. The calibration curve was linear, with a coefficient of determination ranging from 0.9961 to 0.9980; the lower LOQ was 0.04 nmol, and the inter- and intraday CVs <5%.
IMPDH activity was repeatedly measured in a pool of PBMCs from healthy subjects stored at −80°C as internal quality controls. In order to check enzyme stability over time, some aliquots from every batch of patient samples were regularly assayed up to 1 year later, and exhibited a mean CV of 4%. The same reaction samples run up to 6 h after boiling showed a coefficient of variability of <2%. Blood samples from healthy donors were drawn at the Immunohematology and Transfusion Service, Centre for Transplant Immunology (Pavia, Italy), after the subjects had given their written informed consent.
Pharmacokinetic and pharmacodynamic analysis
Pharmacokinetic parameters such as the plasma concentration just before (C0) and 2 h (C2) after MMF administration were assayed for both total (MPAtot) and free MPA (fMPA).
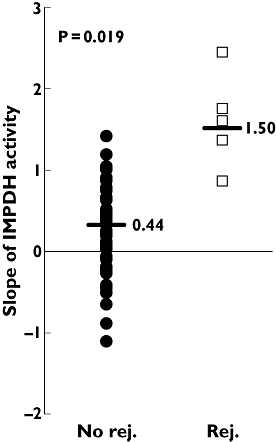
Further sampling times at 0.5 and 0.67 h after MMF administration in CsA and Tac patients, respectively, were used to calculate the area under the concentration–time curve from 0 to 12 h (AUC0–12), using the following algorithm:
 |
 |
Apparent oral clearance of MPA (CL/F= dose/AUC0–12 h) was calculated after normalizing MMF dose to the subject's body weight and multiplying it by the ratio of MPA molecular weight to MMF molecular weight.
The fraction of MPA unbound in plasma (fu) was determined by fu(%) = fMPA × 100/total MPA.
IMPDH activity was determined in PBMCs from blood samples drawn just before (t0) and 2 h (t2) after the MMF morning dose for all patients.
Statistical analyses
The Shapiro–Wilk's W-test was used to evaluate data distribution. Descriptive results are presented as means and standard deviation (SD) and 95% confidence intervals (CIs) or medians and range if data were not normally distributed. Inferential univariate analysis using either parametric or nonparametric tests was used, as appropriate for the data distribution. Correlations between the pharmacokinetic/pharmacodynamic and clinical parameters correlated with MPA administration were evaluated with Pearson's correlation coefficient.
Linear regression models for repeated measures were used to analyse changes over time and between groups of C0, C2h for total and free MPA, AUC0–12 h for total MPA (CsA and Tac groups), and IMPDH activity in PBMCs, serum creatinine, creatinine clearance, blood urea nitrogen, triglycerides, white blood cells, albumin, urine proteins, alanine aminotransferase (ALT) and aspartate aminotransferase (AST).
A P-value <0.05 was deemed statistically significant and all tests were two-sided. Data analysis was performed with STATA statistical package (Stata Corp., College Station, TX, USA).
Results
Fifty-four stable kidney transplant patients with a mean age of 51.4 years were enrolled, divided into three groups of combined maintenance immunosuppressive therapy (15 CsA; 25 Tac; 14 Sir) and monitored at the time of enrolment (from at least 3 months of MMF therapy) and at 2, 4, 6, 8, 10, 12 and 15 months thereafter. Since the study population consisted of outpatients, not all patients attended all the scheduled visits.
On enrolment, patients had been on MMF treatment for a median period of 35 months (range 3–88 months) with a time from transplantation ranging from 0.5 to 8.8 years (median 3.2 years). During the 15 months' observational period, MMF dose was decreased in three patients in the Tac group and increased in two patients in the CsA group, six patients in the Tac group and two patients in the Sir group. Some patients had been switched from a different immunosuppressive therapy, namely one from Tac to CsA, nine from CsA to Tac, two from Tac to Sir, four from CsA to Sir, one from Sir to CsA and two from Sir to Tac (median years before enrolment 3, range 0.7–4). Gender distribution (female/male) in the three treatment groups was as follows: 10/5 in CsA, 13/12 in Tac and 1/13 in Sir groups, respectively.
Table 1 summarizes the patient demographic and laboratory characteristics on enrolment. All patients received a deceased donor graft; the reason for transplantation was essentially end-stage renal disease due to nephropathy of unknown aetiology (n= 26), glomerulonephritis (n= 15) and genetic disorders (n= 13).
Table 1.
Characteristics of patients and main haematological/biochemical parameters at time zero (on enrolment)
| CsA (n= 15) | Tac (n= 25) | Sir (n= 14) | Tot. (n= 54) | |
|---|---|---|---|---|
| Age (years) | 53.5 ± 11.7 | 49.2 ± 12.4 | 53.1 ± 14.4 | 51.4 ± 14.4 |
| Gender (F/M) | 10/5 | 13/12 | 1/13 | 24/30 |
| Body weight (kg) | 68.3 ± 11.0 | 72.5 ± 14.7 | 74.0 ± 17.0 | 72.0 ± 15.2 |
| Switched patients | 2 (13%) | 11 (44%) | 6 (43%) | 19 (35%) |
| Serum creatinine (mg l−1) | 17 ± 6 | 16 ± 5 | 20 ± 6 | 17 ± 6 |
| Creatinine clearance (ml min−1)* | 54.0 ± 19.8 | 63.9 ± 25.2 | 48.5 ± 12.9 | 57.2 ± 21.8 |
| Blood urea nitrogen (mg l−1) | 773 ± 524 | 607 ± 220 | 628 ± 237 | 688 ± 337 |
| Triglycerides (mg l−1) | 1683 ± 970 | 1458 ± 607 | 2405 ± 1052† | 1766 ± 917 |
| White blood cells (×106 µl−1) | 5.3 ± 1.7 | 7.9 ± 12.9 | 6.3 ± 1.3 | 6.7 ± 8.8 |
| Albumin (g l−1) | 41 ± 4 | 42 ± 2 | 37 ± 7** | 41 ± 5 |
| Urine proteins (g per 24 h) | 0.6 ± 0.1 | 0.3 ± 0.2 | 0.4 ± 0.4 | 0.4 ± 0.6 |
| Aminotransferase (IU l−1) | 17.0 ± 6.0 | 17.4 ± 6.4 | 19.2 ± 6.4 | 17.8 ± 6.2 |
| Aspartate aminotransferase (IU l−1) | 13.1 ± 7.0 | 19.7 ± 13.5 | 23.2 ± 13.4 | 18.8 ± 12.4 |
Creatinine clearance was calculated by Cockroft–Gault equation;
P= 0.006 vs. Tac group;
P= 0.027 vs. Tac group. Data are means ± SD. CsA, ciclosporin; Tac, tacrolimus; Sir, sirolimus.
No statistically significant intergroup differences were found for the main haematological or biochemical parameters, even though patients in the Sir group had higher triglyceride values (2405 ± 1052 mg l−1) than the Tac group (1458 ± 607 mg l−1, P= 0.006) and lower albumin levels (37 ± 7 g l−1vs. 42 ± 2 g l−1, P= 0.027). Hyperlipidaemia was seen in patients in all three treatment groups (Table 1).
No new haematological abnormality was found during the observational period, nor any worsening of existing conditions; serum creatinine, creatinine clearance, albumin, urine proteins, AST, ALT as well as other renal and hepatic parameters, remained stable throughout the study.
Five of 54 patients experienced rejection episodes during the 15 months' monitoring and two had two grade II–III rejection episodes. Bolus intravenous methylprednisolone doses (500 mg day−1 for 3 days) were the first-line treatment of grade II–III AR episodes. One patient experienced two steroid-resistant rejection episodes, both treated with intravenous antithymocyte globulin. In the other cases, grade I–II rejection episodes were treated with increasing doses of immunosuppressive therapy and oral steroids.
Pharmacokinetic monitoring
MMF, CsA, Tac and Sir were at steady state at each sampling time. On enrolment, the mean MMF doses were 1441 ± 446, 1253 ± 302 and 1307 ± 486 mg day−1 in patients in the CsA, Tac and Sir groups, respectively, whereas at month 15 they were 1700 ± 414, 1178 ± 225 and 1144 ± 324 mg day−1 in patients in the CsA, Tac and Sir groups, respectively. The average MMF doses administered during the 15 months' follow-up period were 1481 ± 437 mg day−1 (23.0 ± 9.1 mg kg−1 day−1), 1231 ± 316 mg day−1 (17.4 ± 4.3 mg kg−1 day−1) and 1192 ± 390 mg day−1 (16.7 ± 6.7 mg kg−1 day−1) in the CsA, Tac and Sir groups, respectively.
The mean doses were 180.4 ± 49.1 mg day−1 (2.8 ± 1.1 mg kg−1 day−1), 4.9 ± 2.5 mg day−1 (0.071 ± 0.038 mg kg−1 day−1) and 3.6 ± 1.5 mg day−1 (0.050 ± 0.022 mg kg−1 day−1) for CsA, Tac and Sir, respectively.
Mean blood Ctrough concentrations obtained in transplant patients during the 15 months' follow-up period were 142 ± 46, 9.6 ± 3.1 and 13.0 ± 3.9 ng ml−1 for CsA, Tac and Sir, respectively (Table 2).
Table 2.
Mean (± SD) pharmacokinetic and pharmacodynamic parameters throughout the study period
| CsA 15 patients | Tac 25 patients | Sir 14 patients | |
|---|---|---|---|
| 102 total obs | 166 total obs | 56 total obs | |
| mean 6.8/pt | mean 6.65/pt | mean 4/pt | |
| Dose (mg kg−1 day−1) | 2.8 ± 1.1 | 0.071 ± 0.038 | 0.050 ± 0.022 |
| Trough conc. (ng ml−1) | 142 ± 46 | 9.6 ± 3.1 | 13.0 ± 3.9 |
| MMF dose (mg kg−1 day−1) | 23.0 ± 9.1 | 17.4 ± 4.3 | 16.7 ± 6.7 |
| C0 MPAtot (µg ml−1) | 2.3 ± 1.9 | 2.6 ± 2.1 | 3.0 ± 1.9 |
| C2 MPAtot (µg ml−1) | 7.7 ± 4.8 | 5.5 ± 3.0 | 6.2 ± 4.3 |
| C0 fMPA (µg ml−1) | 0.035 ± 0.017 | 0.033 ± 0.028 | 0.036 ± 0.019 |
| C2 fMPA (µg ml−1) | 0.105 ± 0.048* | 0.068 ± 0.054 | 0.072 ± 0.048 |
| MPA AUC0–12 h (µg h ml−1) | 42.0 ± 17.5 | 44.6 ± 19.2 | NA |
| CL/F (l h−1 kg−1) | 0.47 ± 0.30 | 0.33 ± 0.13 | NA |
| t0 IMPDH activity (nmol h−1 mg−1) | 7.8 ± 5.5 | 8.0 ± 5.1 | 7.6 ± 4.8 |
| t2 IMPDH activity (nmol h−1 mg−1) | 5.1 ± 5.6 | 5.7 ± 4.6 | 5.9 ± 3.9 |
| IMPDH inhibition (% of residual activity) | 68.5 ± 33.6 | 77.5 ± 55.0 | 80.9 ± 43.5 |
NA, not applicable;
P= 0.001 vs. Tac and P= 0.021 vs. Sir. CsA, ciclosporin; Tac, tacrolimus; Sir, sirolimus; MMF, mycophenolate mofetil; MPA, mycophenolic acid; IMPDH, inosine 5′-monophosphate dehydrogenase.
Table 3 summarizes the mean C0 and C2 levels of MPAtot and fMPA, fu%, for the three immunosuppressive regimens, and AUC0–12 for the CsA and Tac groups, at every scheduled visit. Forty-two of 648 (6.5%) of fMPA levels were just below (0.0124 µg ml−1 actually measured) the LOQ of our method. The MPAtot values were similar for the three groups (C0 MPAtot 2.3 ± 1.9, 2.6 ± 2.1 and 3.0 ± 1.9 µg ml−1; C2 MPAtot 7.7 ± 4.8, 5.5 ± 3.0 and 6.2 ± 4.3 µg ml−1, for the CsA, Tac and Sir groups, respectively) with no statistically significantly differences. The three groups had similar C0 fMPA values (0.035 ± 0.017, 0.033 ± 0.028 and 0.036 ± 0.019 µg ml−1), but the CsA group had higher C2 fMPA concentrations (0.105 ± 0.048 vs. 0.068 ± 0.054 µg ml−1, P= 0.001, and vs. 0.072 ± 0.048 µg ml−1, P= 0.021) than Tac and Sir groups, respectively. Like MPAtot, fMPA values also did not show any statistically significant differences during the follow-up period; interpatient variability was nevertheless marked, ranging from 55 to 81% for MPAtot and from 52 to 96% for fMPA. The mean AUC0–12 values obtained by the limited sampling strategy were 42.0 ± 17.5 and 44.6 ± 19.2 µg h ml−1 in the CsA and Tac groups, respectively. Mean AUC0–12 values always fell within the proposed therapeutic range for renal transplant [32, 33], both the overall values by treatment group and the mean values at individual follow-up visits; no statistically significant differences were observed during the follow-up period.
Table 3.
Main pharmacokinetic parameters obtained during the monitoring period
| CsA group | |||||||
|---|---|---|---|---|---|---|---|
| C0 MPAtot | C0 fMPA | fu | C2 MPAtot | C2 fMPA | fu | AUC0–12 h | |
| Month | (µg ml−1) | (µg ml−1) | (%) | (µg ml−1) | (µg ml−1) | (%) | (µg h ml−1) |
| 0 | 2.2 ± 1.6 | 0.033 ± 0.017 | 2.0 ± 1.9 | 8.0 ± 5.5 | 0.098 ± 0.032 | 1.4 ± 0.9 | 48.2 ± 21.2 |
| 2 | 1.6 ± 0.5 | 0.032 ± 0.020 | 2.0 ± 1.3 | 7.7 ± 4.7 | 0.104 ± 0.030 | 1.8 ± 1.0 | 37.9 ± 13.1 |
| 4 | 2.8 ± 2.7 | 0.039 ± 0.018 | 2.1 ± 1.4 | 9.3 ± 5.5 | 0.089 ± 0.024 | 1.4 ± 1.2 | 50.3 ± 21.3 |
| 6 | 1.6 ± 0.7 | 0.030 ± 0.010 | 2.0 ± 0.8 | 6.7 ± 4.4 | 0.106 ± 0.042 | 2.0 ± 0.9 | 32.1 ± 14.5 |
| 8 | 2.8 ± 3.0 | 0.029 ± 0.015 | 1.7 ± 1.1 | 7.5 ± 2.9 | 0.116 ± 0.079 | 1.7 ± 1.1 | 44.9 ± 16.1 |
| 10 | 2.5 ± 2.7 | 0.027 ± 0.018 | 1.5 ± 0.7 | 5.8 ± 3.0 | 0.097 ± 0.050 | 1.7 ± 0.4 | 39.7 ± 14.8 |
| 12 | 2.8 ± 1.3 | 0.033 ± 0.014 | 1.5 ± 0.5 | 9.1 ± 6.3 | 0.134 ± 0.079 | 1.7 ± 0.7 | 50.9 ± 19.7 |
| 15 | 2.8 ± 2.1 | 0.022 ± 0.011 | 1.2 ± 0.8 | 6.0 ± 4.1 | 0.100 ± 0.059 | 1.8 ± 1.1 | 38.2 ± 12.4 |
| Total | 2.3 ± 1.9 | 0.035 ± 0.017 | 2.0 ± 1.2 | 7.7 ± 4.8 | 0.105 ± 0.048* | 1.7 ± 0.9 | 42.0 ± 17.5 |
| Tac group | |||||||
| C0 MPAtot | C0 fMPA | fu | C2 MPAtot | C2 fMPA | fu | AUC0–12 h | |
| Month | (µg ml−1) | (µg ml−1) | (%) | (µg ml−1) | (µg ml−1) | (%) | (µg h ml−1) |
| 0 | 3.6 ± 3.1 | 0.035 ± 0.026 | 1.3 ± 1.0 | 7.9 ± 3.6 | 0.109 ± 0.081 | 1.4 ± 1.1 | 56.9 ± 25.9 |
| 2 | 2.4 ± 2.2 | 0.030 ± 0.020 | 1.5 ± 1.0 | 4.7 ± 2.8 | 0.060 ± 0.049 | 1.2 ± 0.6 | 41.8 ± 19.5 |
| 4 | 2.0 ± 1.3 | 0.032 ± 0.039 | 1.8 ± 2.8 | 4.7 ± 2.5 | 0.054 ± 0.025 | 1.2 ± 0.3 | 39.1 ± 12.2 |
| 6 | 2.4 ± 1.4 | 0.033 ± 0.018 | 1.3 ± 0.6 | 5.2 ± 2.5 | 0.069 ± 0.031 | 1.4 ± 0.4 | 41.4 ± 14.0 |
| 8 | 2.3 ± 1.6 | 0.031 ± 0.019 | 1.5 ± 0.9 | 3.8 ± 2.1 | 0.043 ± 0.023 | 1.2 ± 0.4 | 38.0 ± 12.5 |
| 10 | 2.4 ± 1.5 | 0.032 ± 0.021 | 2.0 ± 2.0 | 5.1 ± 2.5 | 0.050 ± 0.019 | 1.1 ± 0.4 | 42.9 ± 12.9 |
| 12 | 2.2 ± 1.2 | 0.040 ± 0.035 | 1.7 ± 0.8 | 4.9 ± 2.3 | 0.063 ± 0.056 | 1.2 ± 0.5 | 40.5 ± 10.8 |
| 15 | 2.7 ± 2.2 | 0.041 ± 0.048 | 2.4 ± 4.1 | 4.8 ± 2.9 | 0.049 ± 0.027 | 1.1 ± 0.4 | 37.3 ± 8.2 |
| Total | 2.6 ± 2.1 | 0.033 ± 0.028 | 1.9 ± 2.8 | 5.5 ± 3.0 | 0.068 ± 0.054 | 1.3 ± 0.6 | 44.6 ± 19.2 |
| Sir group | |||||||
| C0 MPAtot | C0 fMPA | fu | C2 MPAtot | C2 fMPA | fu | AUC0–12 h | |
| Month | (µg ml−1) | (µg ml−1) | (%) | (µg ml−1) | (µg ml−1) | (%) | (µg h ml−1) |
| 0 | 2.9 ± 1.7 | 0.039 ± 0.021 | 1.5 ± 0.6 | 6.3 ± 3.4 | 0.069 ± 0.048 | 1.3 ± 0.9 | NA |
| 2 | 4.3 ± 1.9 | 0.032 ± 0.021 | 0.8 ± 0.3 | 6.3 ± 3.6 | 0.057 ± 0.036 | 0.9 ± 0.3 | NA |
| 4 | 3.0 ± 1.9 | 0.035 ± 0.017 | 1.3 ± 0.4 | 5.4 ± 3.8 | 0.052 ± 0.037 | 1.1 ± 0.4 | NA |
| 6 | 1.3 ± 1.9 | 0.030 ± 0.016 | 2.4 ± 0.5 | 2.1 ± 2.2 | 0.054 ± 0.052 | 2.7 ± 0.4 | NA |
| 8 | 3.7 ± 2.6 | 0.042 ± 0.020 | 1.4 ± 0.8 | 6.3 ± 4.2 | 0.103 ± 0.068 | 1.3 ± 0.9 | NA |
| 10 | 2.5 ± 1.5 | 0.040 ± 0.022 | 2.0 ± 1.5 | 5.4 ± 4.5 | 0.062 ± 0.023 | 2.0 ± 1.7 | NA |
| 12 | 2.3 ± 1.6 | 0.030 ± 0.015 | 1.5 ± 0.5 | 6.7 ± 6.3 | 0.065 ± 0.046 | 1.9 ± 1.2 | NA |
| 15 | 2.1 ± 0.2 | 0.028 ± 0.008 | 1.3 ± 0.4 | 4.4 ± 2.4 | 0.060 ± 0.030 | 0.9 ± 0.4 | NA |
| Total | 3.0 ± 1.9 | 0.036 ± 0.019 | 1.4 ± 0.8 | 6.2 ± 4.3 | 0.072 ± 0.048 | 1.4 ± 1.0 | NA |
Data are expressed as means ± SD. NA, not applicable;
P= 0.001 vs. Tac and P= 0.021 vs. Sir. CsA, ciclosporin; Tac, tacrolimus; Sir, sirolimus; MPA, mycophenolic acid.
Pharmacodynamic monitoring
IMPDH activity, preliminarily monitored in 95 healthy blood donors, was 8.7 ± 6.9 nmol h−1 mg−1. The blood donors (29 F/66 M) were 42 ± 10 years old (range 22–66 years). IMPDH activity was extremely variable (CV 79%), ranging from 1.05 to 31.1 nmol h−1 mg−1, with no correlation with age or gender and IMPDH activity. A similarly high interindividual variability was also reported by other authors [13, 14].
IMPDH activity was measured in the PBMCs of patients in the three groups before (t0) and 2 h after (t2) MMF administration.
Our patients were monitored for 15 months but their post-transplant time ranged from 0.5 to 8.8 years (median 3.2 years). Interpatient variability was quite high (CV 42.4%; range 1.02–21.96) but lower than in healthy subjects, whereas intrapatient variability was rather low (CV 28.8%); no intergroup differences were found. Overall variability for measurements in patient samples was 5.1% (range 0.42–7.9%). The lower intrapatient variability in MMF patients vs. healthy subjects is likely to be a consequence of IMPDH inhibition by MPA.
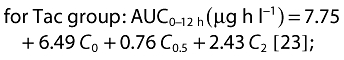
The mean IMPDH inhibition level, reported as the percentage of residual activity 2 h after MMF administration (100% activity was arbitrarily given for each trough sample) was 75.6 ± 47.1%, with a slightly higher inhibition in the CsA group (residual activity 68.5 ± 33.6%, 77.5 ± 55.0% and 80.9 ± 43.5%, for the CsA, Tac and Sir groups, respectively). IMPDH activity levels, measured after 2 h of each morning dose, slightly correlated with C2 fMPA concentrations (r=−0.133, P= 0.048), but was better than C2 MPAtot (r=−0.029, P= 0.663). No correlations were found for either C0 fMPA or C0 MPAtot with t0 IMPDH activity (Figure 1).
Figure 1.
Linear regression model for mycophenolic acid (MPA) concentrations and inosine 5′-monophosphate dehydrogenase (IMPDH) activity. (A) C0 free MPA level vs. t0 IMPDH activity. (B) C0 total MPA level vs. t0 IMPDH activity. (C) C2 free MPA level vs. t2 IMPDH activity. (D) C2 total MPA level vs. t2 IMPDH activity
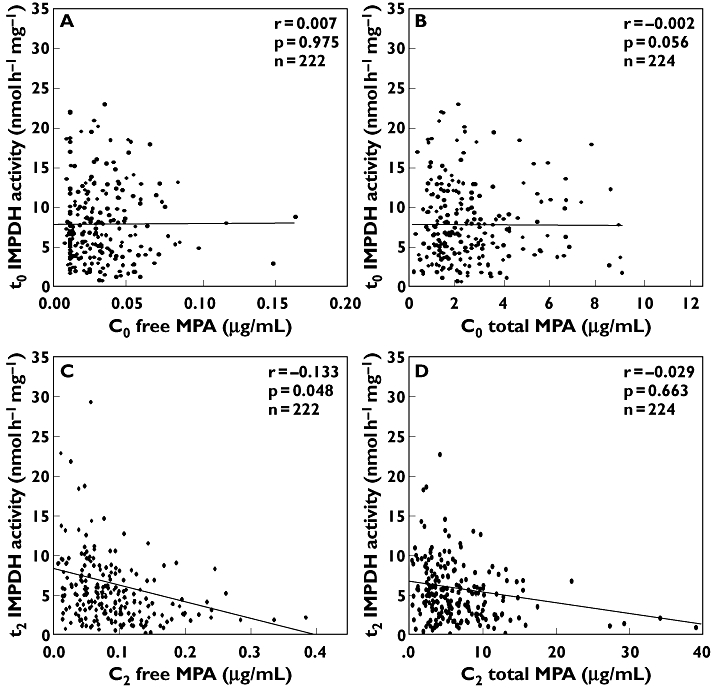
IMPDH inhibition levels exhibited wide variability, with no definite trend during the monitoring period. Conversely, mean predose IMPDH activity had a significant positive correlation with the monitoring period, showing an increasing trend from 5.9 ± 3.7 nmol h−1 mg−1 (95% CI 4.9, 6.9) to 9.0 ± 3.9 nmol h−1 mg−1 (95% CI 7.2, 10.8). Figure 2 shows the changes in IMPDH activity over time, reported as coefficients of a linear regression model adjusted for treatment group and for time since the start of MMF therapy, increasing from 0.34 (95% CI −1.07, 1.75) on enrolment to 5.44 (95% CI 2.88, 8.00) at the end of the monitoring period.
Figure 2.
Variation over time of t0 inosine 5′-monophosphate dehydrogenase (IMPDH) activity during the monitoring period. Data are coefficients of a linear regression model adjusted for treatment group and for time since the start of mycophenolate mofetil (MMF) therapy. Constant (const.) and P shown at each time are the comparison vs. time 0. Constant 5.29 nmol h−1 mg−1 is the intercept of the regression model. Bars indicate the 95% confidence interval
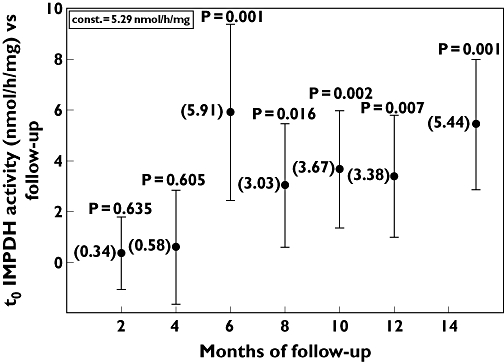
This trend was confirmed also when IMPDH variability was plotted against time in the individual patients. In fact, in Figure 3 IMPDH intrasubject variability is described by the slopes of each of the 48 patients who underwent three or more visits, calculated as linear regression of t0 IMPDH activity vs. the corresponding follow-up time.
Figure 3.
Comparison of the slopes of t0 inosine 5′-monophosphate dehydrogenase (IMPDH) activity between nonrejecting and rejecting subjects. The slopes were calculated, for the 48 patients that underwent three or more visits, as linear regression of IMPDH activity vs. the 15 months of follow-up period. Black circles indicate the activity in nonrejecting subjects, white squares the activity in rejecting subjects, the horizontal bar indicates the median values. P= 0.019 shows the significance comparing the two groups
All rejecting patients (n= 5) showed increases in t0 IMPDH activity during the monitoring period, with an increasing trend significantly higher than the nonrejecting subjects (median slope 1.50, range 0.90–2.40 vs. 0.44, range −1.00–1.50, P= 0.019).
As some patients in this study had been on MMF therapy for only a few months while others had been on MMF for several years, it is noteworthy that increases in predose IMPDH activity were consistent in all patients, especially those on MMF for 20–50 months (Figure 4).
Figure 4.
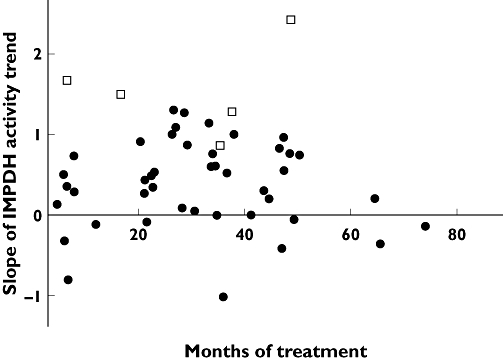
Slopes of t0 inosine 5′-monophosphate dehydrogenase (IMPDH) activity trend measured vs. the relative month since starting mycophenolate mofetil (MMF) therapy. Black circles indicate the activity of nonrejecting subjects, white squares the activity of rejecting subjects
Rejecting patients exhibited higher t0 IMPDH activity at the time of AR diagnosis. The rejection episodes and their grade are reported in Figure 5: patient A (CsA) experienced an AR 1.4 years after renal transplant, patient B (CsA) had two ARs after 7 and 7.5 years, patient C (Tac) had two ARs after 3 and 4 years, patient D (CsA) after 4.5 years, and patient E (Sir) after 1.2 years, respectively. The rejecting patients were on MMF therapy since renal transplantation, except for patient D (CsA), who had been switched to MMF 2 months after transplantation. During the rejection episodes all concentrations of CsA, Tac and Sir fell within the expected concentration range.
Figure 5.
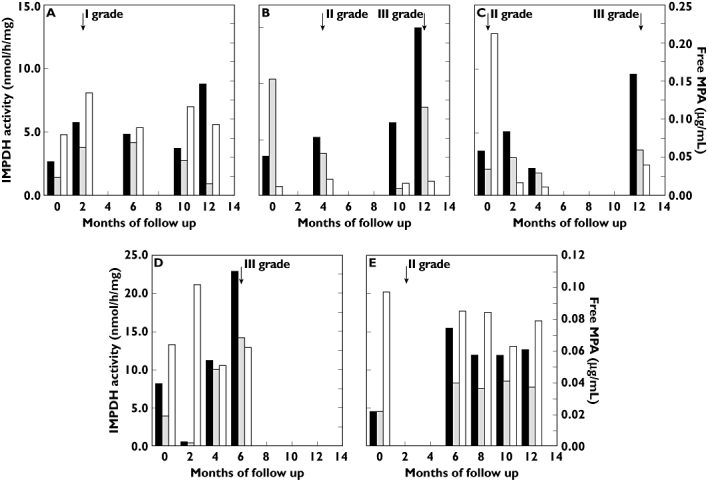
Monitoring of the five patients (A–E) that experienced acute rejection episodes. The black bar indicates t0 inosine 5′-monophosphate dehydrogenase (IMPDH) activity; the white bar C2 free mycophenolic acid (MPA); the grey bar t2 residual IMPDH activity. The arrows indicate the time and grade of rejection episodes
Compared with nonrejecting patients, IMPDH activity was significantly higher at both t0 (11.3 ± 9.9 vs. 7.7 ± 4.8 nmol h−1 mg−1; P= 0.043) and t2 (9.3 ± 13.4 vs. 5.4 ± 4.1 nmol h−1 mg−1; P= 0.016), even though some values were overlapping. In contrast, MPA levels exhibited no significant differences between rejecting and nonrejecting patients, AUC0–12 h values mainly falling within the suggested therapeutic range and overlapping between rejecting (39.6 ± 12.6 µg h ml−1; 73.7% of AUC values into the range) and nonrejecting subjects (43.5 ± 18.1 µg h ml−1; 60.5% of AUC values into the range) [32, 33].
Discussion
Pharmacodynamic monitoring of IMPDH activity to determine biological drug efficacy in vivo has been suggested as a useful approach for optimizing MMF therapy. Pharmacodynamic assessment is not supposed to replace pharmacokinetic monitoring, but rather to be combined with it to improve therapeutic drug dosing and provide more effective and safer results in the individual patient.
The best way to individualize MMF therapy is still a controversial issue. Despite numerous efforts to improve graft outcome by pharmacokinetic monitoring strategies, acute rejection episodes and side-effects cannot be ruled out.
The main aim of this pharmacokinetic/pharmacodynamic trial was to investigate the intra- and interpatient variability of IMPDH biological activity in kidney transplant recipients during routine follow-up.
Unlike other trials [13–15], our observation period covered a wide post-transplant time range (from 0.5 to 8.8 years), which allowed us to monitor IMPDH variability in a more comprehensive real-life setting. We used the pharmacodynamic monitoring of MMF, through PBMC IMPDH activity, to investigate whether long-term therapy might alter IMPDH biological activity. Induction of IMPDH activity in kidney transplant recipients on long-term MMF therapy has previously been observed in whole blood [16, 34]; however, whole blood samples include various cell populations, where erythrocytes are predominant. Since lymphocytes are most involved in allograft rejection, they are the primary target of MPA, and heavy interference from red cell IMPDH activity may hamper the use of whole blood in the pharmacodynamic approach. The clinical relevance of erythrocyte IMPDH activity on MPA efficacy remains therefore a matter of debate.
Our data demonstrate marked interpatient variability for both pharmacokinetic and pharmacodynamic parameters, also in long-term MMF-treated patients. This variability could be reasonably attributed to both genetic (e.g. polymorphisms) and environmental factors, which can enhance lymphocyte activation (e.g. infections). We observed high interindividual variability in IMPDH activity in different patients with similar CsA, Tac or Sir concentrations. Several factors that potentially influence IMPDH inhibition in vivo must be considered. Haematological factors such as albumin, haematocrit, or the composition of the blood cell fraction may influence the concentration of unbound MPA with access to the enzyme. Free MPA only has been shown to be the pharmacologically active portion of MMF. Therefore, the capacity of plasma to ensure the release of free MPA to activate lymphocytes seems to have an important role in determining the clinical effect of the drug. Variability during in vitro measurement of IMPDH activity should also be considered. It was recently reported that repeated washing steps performed during the classic method of isolation of PBMCs from whole blood samples may cause removal of MPA from the isolated cells [35]. Our method for PBMC separation included two washing steps, but one of them was carried out after RBC lysis. This latter step does involve an additional wash but is very useful to avoid RBC contamination, which could increase protein contents and ultimately lead to an underestimation of IMPDH activity.
A significant inverse correlation was found between IMPDH activity levels, measured 2 h after the morning dose, and the corresponding fMPA concentrations. High interpatient variability between individual IMPDH activity measurements appears to affect the clinical usefulness of this biological parameter as a predictive tool in long-term transplant outcomes. Nevertheless, the trend of IMPDH levels measured during continuous monitoring of the individual patient could play a role as another prognostic parameter of rejection.
Although correlations between drug concentration and IMPDH activity have been observed [13, 16, 18, 32], no clear relationship between clinical outcomes and IMPDH activity has been reported [36]. The clinical usefulness of pharmacodynamic monitoring has been supported by the observation of Budde et al. [36], who found a correlation between pretransplant IMPDH values and post-transplant outcome, with lower pretransplant IMPDH activity apparently related to a higher incidence of adverse effects.
Our study is limited, in that we started monitoring IMPDH concentrations at least 6 months post transplant and thus we have no information on pretransplant IMPDH activity. Fifty-four stable patients on long-term MMF therapy were monitored for at least 12 months and found to exhibit significant increases in IMPDH predose activity levels, which was more marked in patients that experienced rejection. All three groups of combined therapy (CsA, Tac and Sir) showed a similar increasing trend, suggesting that any influence of the chosen immunosuppressive regimen on IMPDH activity induction should be excluded. The t2 IMPDH residual activity was quite unchanged during the monitoring period. The CsA group showed higher IMPDH inhibition levels than the other two groups; as the inhibition is positively correlated with fMPA levels, it is noteworthy that the CsA group also had the highest fMPA levels, which, however, could be due to the well-known drug–drug interactions between CsA and MPA. Different from Tac and Sir, CsA inhibits the MRP2 transporter and decreases the enterohepatic recirculation of MPA [37, 38], which results in higher mycophenolic acid glucuronide plasma concentrations. This competitively displaces MPA from albumin binding sites, which reduces MPA binding capacity and increases its free fraction [39, 40].
Our data confirm the induction of IMPDH activity reported in renal transplant patients after prolonged exposure (24-month follow-up after kidney transplantation) to MMF [41], which may be partially explained by upregulation of IMPDH-I and -II genes in blood mononuclear cells observed also, and more markedly, in patients experiencing acute rejection.
During our monitoring period five patients experienced acute rejection, two of whom had two episodes. The MPAtot and fMPA levels were not significantly different and no differences were found in enzyme inhibition. However, in five of seven cases the AR was characterized by a marked increase in t0 IMPDH activity, relative not only to the activity values measured at the previous visits, but also to the mean activity observed in nonrejecting patients.
All these patients showed an increasing trend of activity, throughout the observational period, with slope values higher than those of nonrejecting subjects (Figure 3). Interestingly, two patients (B and E, Figure 4) experienced another rejection episode after the follow-up period (data not shown). Since three of these patients experienced AR after >30 months of MMF therapy (Figure 4), we can exclude that the more pronounced slope in IMPDH activity was due to a shorter MMF treatment period.
The number of rejecting patients in our series was low, but all of them showed similar trends, particularly relative to the increase from IMPDH activity on enrolment, which may suggest further investigation into IMPDH activity and its increase rate during follow-up starting from immediately post transplant.
Since our patients did not undergo any visits other than those scheduled during follow-up, pharmacokinetics/pharmacodynamics and samples for histopathological diagnosis of rejection were all collected at the same time, i.e. during clinical assessment. Thus, even though the relationship between IMPDH activity trend and the onset of AR is clear, our data cannot define if the marked increase in t0 IMPDH activity occurs immediately before the AR. Regardless, t0 IMPDH activity in some patients might be an additional tool for monitoring the effectiveness of MMF therapy or dosage: since higher baseline activity is correlated with higher intracellular enzyme concentration, a greater amount of inhibitor could be required to obtain an adequate response.
Integrating data of prospective trials following patients longitudinally, evaluating also pretransplant IMPDH activity and expression and during follow-up, may better elucidate the specificity and potential clinical value of IMPDH monitoring.
Competing interests
None to declare.
The authors thank Ms Caterina Campani for her skillful assistance in drafting the manuscript.
REFERENCES
- 1.Bullingham RE, Nicholls A, Hale M. Pharmacokinetics of mycophenolate mofetil (RS61443): a short review. Transplant Proc. 1996;28:925–9. [PubMed] [Google Scholar]
- 2.Natsumeda Y, Ohno S, Kawasaki H, Konno Y, Weber G, Suzuki K. Two distinct cDNAs for human IMP dehydrogenase. J Biol Chem. 1990;265:5292–5. [PubMed] [Google Scholar]
- 3.Collart FR, Huberman E. Cloning and sequence analysis of the human and Chinese hamster inosine-5′-monophosphate dehydrogenase cDNAs. J Biol Chem. 1988;263:15769–72. [PubMed] [Google Scholar]
- 4.Gu JJ, Stegmann S, Gathy K, Murray R, Laliberte J, Ayscue L, Mitchell BS. Inhibition of T lymphocyte activation in mice heterozygous for loss of the IMPDH II gene. J Clin Invest. 2000;106:599–606. doi: 10.1172/JCI8669. [DOI] [PMC free article] [PubMed] [Google Scholar]
- 5.Gu JJ, Spychala J, Mitchell BS. Regulation of the human inosine monophosphate dehydrogenase type I gene. Utilization of alternative promoters. J Biol Chem. 1997;272:4458–66. doi: 10.1074/jbc.272.7.4458. [DOI] [PubMed] [Google Scholar]
- 6.Zimmerman AG, Sphycala J, Mitchell BS. Characterization of the human inosine-5′-monophosphate dehydrogenase type II gene. J Biol Chem. 1995;270:6808–14. doi: 10.1074/jbc.270.12.6808. [DOI] [PubMed] [Google Scholar]
- 7.Behrend M. Adverse gastrointestinal effects of mycophenolate mofetil: aetiology, incidence and management. Drug Saf. 2001;24:645–63. doi: 10.2165/00002018-200124090-00002. [DOI] [PubMed] [Google Scholar]
- 8.Arns W. Noninfectious gastrointestinal (GI) complications of mycophenolic acid therapy: a consequence of local GI toxicity? Transplant Proc. 2007;39:88–93. doi: 10.1016/j.transproceed.2006.10.189. [DOI] [PubMed] [Google Scholar]
- 9.Knoll GA, MacDonald I, Khan A, Van Walraven C. Mycophenolate mofetil dose reduction and the risk of acute rejection after renal transplantation. J Am Soc Nephrol. 2003;14:2381–6. doi: 10.1097/01.asn.0000079616.71891.f5. [DOI] [PubMed] [Google Scholar]
- 10.Pelletier RP, Akin B, Henry ML, Bumgardner GL, Elkhammas EA, Rajab A, Ferguson RM. The impact of mycophenolate mofetil dosing patterns on clinical outcome after renal transplantation. Clin Transplant. 2003;17:200–5. doi: 10.1034/j.1399-0012.2003.00026.x. [DOI] [PubMed] [Google Scholar]
- 11.van Gelder T, Shaw LM. The rationale for and limitation of therapeutic drug monitoring for mycophenolate mofetil in transplantation. Transplantation. 2005:244–53. doi: 10.1097/01.tp.0000186380.61251.fc. [DOI] [PubMed] [Google Scholar]
- 12.Burkhart C, Heusser C, Morris RE, Raulf F, Weckbecker G, Weitz-Schmidt G, Welzenbach K. Pharmacodynamics in the development of new immunosuppressive drugs. Ther Drug Monit. 2004;26:588–92. doi: 10.1097/00007691-200412000-00002. [DOI] [PubMed] [Google Scholar]
- 13.Budde K, Glander P, Bauer S, Braun K, Waiser J, Fritsche L, Mai I, Roots I, Neumayer HH. Pharmacodynamic monitoring of mycophenolate mofetil. Clin Chem Lab Med. 2000;38:1213–6. doi: 10.1515/CCLM.2000.191. [DOI] [PubMed] [Google Scholar]
- 14.Glander P, Hambach P, Braun KP, Fritsche L, Giessing M, Mai I, Einecke G, Waiser J, Neumayer HH, Budde K. Pre-transplant inosine monophosphate dehydrogenase activity is associated with clinical outcome after renal transplantation. Am J Transplant. 2004;4:2045–51. doi: 10.1111/j.1600-6143.2004.00617.x. [DOI] [PubMed] [Google Scholar]
- 15.Kamar N, Glander P, Nolting J, Böhler T, Hambach P, Liefeldt L, Neumayer HH, Klupp J, Budde K. Effect of mycophenolate mofetil monotherapy on T-cell functions and inosine monophosphate dehydrogenase activity in patients undergoing a kidney transplantation. Transplant Proc. 2006;38:2292–4. doi: 10.1016/j.transproceed.2006.06.121. [DOI] [PubMed] [Google Scholar]
- 16.Sanquer S, Breil M, Baron C, Dhamane D, Astier A, Lang P. Induction of inosine monophosphate dehydrogenase activity after long-term treatment with mycophenolate mofetil. Clin Pharmacol Ther. 1999;65:640–8. doi: 10.1016/S0009-9236(99)90085-1. [DOI] [PubMed] [Google Scholar]
- 17.Vethe NT, Mandla R, Line PD, Midtvedt K, Hartmann A, Bergan S. Inosine monophosphate dehydrogenase activity in renal allograft recipients during mycophenolate treatment. Scand J Clin Lab Invest. 2006;66:31–44. doi: 10.1080/00365510500420259. [DOI] [PubMed] [Google Scholar]
- 18.Weigel G, Griesmacher A, Zuckermann AO, Laufer G, Mueller MM. Effect of mycophenolate mofetil therapy on inosine monophosphate dehydrogenase induction in red blood cells of heart transplant recipients. Clin Pharmacol Ther. 2001;69:137–44. doi: 10.1067/mcp.2001.114166. [DOI] [PubMed] [Google Scholar]
- 19.Bremer S, Mandla R, Vethe NT, Rasmussen I, Rootwelt H, Line PD, Midtvedt K, Bergan S. Expression of IMPDH1 and IMPDH2 after transplantation and initiation of immunosuppression. Transplantation. 2008;85:55–61. doi: 10.1097/01.tp.0000296854.68123.03. [DOI] [PubMed] [Google Scholar]
- 20.Goldsmith D, Carrey EA, Edbury S, Smolenski RT, Jagodzinski P, Simmonds HA. Mycophenolate mofetil, an inhibitor of inosine monophosphate dehydrogenase, causes a paradoxical elevation of GTP in erythrocytes of renal transplant patients. Clin Sci. 2004;107:63–8. doi: 10.1042/CS20030331. [DOI] [PubMed] [Google Scholar]
- 21.Racusen LC, Solez K, Colvin RB, Bonsib SM, Castro MC, Cavallo T, Croker BP, Demetris AJ, Drachenberg CB, Fogo AB, Furness P, Gaber LW, Gibson IW, Glotz D, Goldberg JC, Grande J, Halloran PF, Hansen HE, Hartley B, Hayry PJ, Hill CM, Hoffman EO, Hunsicker LG, Lindblad AS, Marcussen N, Mihatsch MJ, Nadasdy T, Nickerson P, Olsen TS, Papadimitriou JC, Randhawa PS, Rayner DC, Roberts I, Rose S, Rush D, Salinas-Madrigal L, Salomon DR, Sund S, Taskinen E, Trpkov K, Yamaguchi Y. The Banff97 working classification of renal allograft pathology. Kidney Int. 1999;55:713–23. doi: 10.1046/j.1523-1755.1999.00299.x. [DOI] [PubMed] [Google Scholar]
- 22.Solez K, Colvin RB, Racusen LC, Sis B, Halloran PF, Birk PE, Campbell PM, Cascalho M, Collins AB, Demetris AJ, Drachenberg CB, Gibson IW, Grimm PC, Haas M, Lerut E, Liapis H, Mannon RB, Marcus PB, Mengel M, Mihatsch MJ, Nankivell BJ, Nickeleit V, Papadimitriou JC, Platt JL, Randhawa P, Roberts I, Salinas-Madriga L, Salomon DR, Seron D, Sheaff M, Weening JJ. The Banff '05 Meeting report: differential diagnosis of chronic allograft injury and elimination of chronic allograft nephropathy (CAN) Am J Transplant. 2007;7:518–26. doi: 10.1111/j.1600-6143.2006.01688.x. [DOI] [PubMed] [Google Scholar]
- 23.Pawinski T, Hale M, Korecka M, Fitzimmons WE, Shaw LM. Limited sampling strategy for the estimation of mycophenolic acid area under the curve in adult renal transplant patients treated with concomitant tacrolimus. Clin Chem. 2002;48:1497–504. [PubMed] [Google Scholar]
- 24.van Hest RM, Mathôt RA, Vulto AG, Le Meur Y, van Gelder T. Mycophenolic acid in diabetic renal transplant recipients. Pharmacokinetics and application of a limited sampling strategy. Ther Drug Monit. 2004;26:620–5. doi: 10.1097/00007691-200412000-00006. [DOI] [PubMed] [Google Scholar]
- 25.de Loor H, Naesens M, Verbeke K, Vanrenterghem Y, Kuypers DR. Stability of mycophenolic acid and glucuronide metabolites in human plasma and the impact of deproteinization methodology. Clin Chim Acta. 2008;389:87–92. doi: 10.1016/j.cca.2007.11.033. [DOI] [PubMed] [Google Scholar]
- 26.Nowak I, Shaw LM. Mycophenolic acid binding to human serum albumin: characterization and relation to pharmacodynamics. Clin Chem. 1995;41:1011–7. [PubMed] [Google Scholar]
- 27.Shipkova M, Niedmann PD, Armstrong VW, Schütz E, Wieland E, Shaw LM, Oellerich M. Simultaneous determination of mycophenolic acid and its glucuronide in human plasma using a simple high-performance liquid chromatography procedure. Clin Chem. 1998;44:1481–8. [PubMed] [Google Scholar]
- 28.Patel CG, Mendonza AE, Akhlaghi F, Majid O, Trull AK, Lee T, Holt DW. Determination of total mycophenolic acid and its glucuronide metabolite using liquid chromatography with ultraviolet detection and unbound mycophenolic acid using tandem mass spectrometry. J Chromatogr B Analyt Technol Biomed Life Sci. 2004;813:287–94. doi: 10.1016/j.jchromb.2004.10.004. [DOI] [PubMed] [Google Scholar]
- 29.Böyum A. Isolation of leucocytes from human blood. A two-phase system for removal of red cells with methylcellulose as erythrocyte-aggregating agent. Scand J Clin Lab Invest. 1968;97:9–29. [PubMed] [Google Scholar]
- 30.Lowry OH, Rosebrough NJ, Farr AL, Randall RJ. Protein measurement with the Folin phenol reagent. J Biol Chem. 1951;193:265–75. [PubMed] [Google Scholar]
- 31.Glander P, Braun KP, Hambach P, Bauer S, Mai I, Roots I, Waiser J, Fritsche L, Neumayer HH, Budde K. Non-radioactive determination of inosine 5′-monophosphate dehydrogenase (IMPDH) in peripheral mononuclear cells. Clin Biochem. 2001;34:543–9. doi: 10.1016/s0009-9120(01)00267-3. [DOI] [PubMed] [Google Scholar]
- 32.van Gelder T, Le Meur Y, Shaw LM, Oellerich M, DeNofrio D, Holt C, Holt DW, Kaplan B, Kuypers D, Meiser B, Toenshoff B, Mamelok RD. Therapeutic drug monitoring of mycophenolate mofetil in transplantation. Ther Drug Monit. 2006;28:145–54. doi: 10.1097/01.ftd.0000199358.80013.bd. [DOI] [PubMed] [Google Scholar]
- 33.Le Meur Y, Büchler M, Thierry A, Caillard S, Villemain F, Lavaud S, Etienne I, Westeel PF, Hurault de Ligny B, Rostaing L, Thervet E, Szelag JC, Rérolle JP, Rousseau A, Touchard G, Marquet P. Individualized mycophenolate mofetil dosing based on drug exposure significantly improves patient outcomes after renal transplantation. Am J Transplant. 2007;7:2496–503. doi: 10.1111/j.1600-6143.2007.01983.x. [DOI] [PubMed] [Google Scholar]
- 34.Albrecht W, Storck M, Pfetsch E, Martin W, Abendroth D. Development and application of a high-performance liquid chromatography-based assay for determination of the activity of inosine 5′-monophosphate dehydrogenase in whole blood and isolated mononuclear cells. Ther Drug Monit. 2000;22:283–94. doi: 10.1097/00007691-200006000-00009. [DOI] [PubMed] [Google Scholar]
- 35.Glander P, Sombogaard F, Budde K, Gelder TV, Hambach P, Liefeldt L, Lorkowski C, Mai M, Neumayer HH, Vulto AG, Mathot RA. Improved assay for the nonradioactive determination of inosine 5′-monophosphate dehydrogenase activity in peripheral blood mononuclear cells. Ther Drug Monit. 2009;31:351–9. doi: 10.1097/FTD.0b013e31819c3f3d. [DOI] [PubMed] [Google Scholar]
- 36.Budde K, Bauer S, Hambach P, Hahn U, Röblitz H, Mai I, Diekmann F, Neumayer HH, Glander P. Pharmacokinetic and pharmacodynamic comparison of enteric-coated mycophenolate sodium and mycophenolate mofetil in maintenance renal transplant patients. Am J Transplant. 2007;7:888–98. doi: 10.1111/j.1600-6143.2006.01693.x. [DOI] [PubMed] [Google Scholar]
- 37.van Gelder T, Klupp J, Barten MJ, Christians U, Morris RE. Comparison of the effects of tacrolimus and cyclosporine on the pharmacokinetics of mycophenolic acid. Ther Drug Monit. 2001;23:119–28. doi: 10.1097/00007691-200104000-00005. [DOI] [PubMed] [Google Scholar]
- 38.Kobayashi M, Saitoh H, Kobayashi M, Tadano K, Takahashi Y, Hirano T. Cyclosporin A, but not tacrolimus, inhibits the biliary excretion of mycophenolic acid glucuronide possibly mediated by Mrp2 in rats. J Pharmacol Exp Ther. 2004;309:1029–35. doi: 10.1124/jpet.103.063073. [DOI] [PubMed] [Google Scholar]
- 39.Shaw LM, Korecka M, Venkataramanan R, Golberg L, Bloom R, Brayman KL. Mycophenolic acid pharmacodynamic and pharmacokinetics provide a basis for rational monitoring strategies. Am J Transplant. 2003;3:534–42. doi: 10.1034/j.1600-6143.2003.00079.x. [DOI] [PubMed] [Google Scholar]
- 40.Shaw LM, Figurski M, Milone MC, Trofe J, Bloom RD. Therapeutic drug monitoring of mycophenolic acid. Clin J Am Soc Nephrol. 2007;2:1062–72. doi: 10.2215/CJN.03861106. [DOI] [PubMed] [Google Scholar]
- 41.Sanquer S, Maison P, Tomkiewicz C, Macquin-Mavier I, Legendre C, Barouki R, Lang P. Expression of inosine monophosphate dehydrogenase type I and type II after mycophenolate mofetil treatment: a 2-year follow-up in kidney transplantation. Clin Pharmacol Ther. 2008;83:328–35. doi: 10.1038/sj.clpt.6100300. [DOI] [PubMed] [Google Scholar]