

Abstract
AIMS
In spontaneous reporting systems (SRS), there is a growing need for the automated detection of adverse drug reactions (ADRs) resulting from drug–drug interactions. In addition, special attention is also needed for systems facilitating automated data preprocessing. In our study, we set up a computerized system to signal possible drug–drug interactions by which data acquisition and signal detection could be carried out automatically and the process of data preprocessing could also be facilitated.
METHODS
This system was developed with Microsoft Visual Basic 6.0 and Microsoft Access was used as the database. Crude ADR reports submitted to Shanghai SRS from January 2007 to December 2008 were included in this study. The logistic regression method, the Ω shrinkage measure method, an additive model and a multiplicative model were used for automatic detection of drug–drug interactions where two drugs were used concomitantly.
RESULTS
A total of 33 897 crude ADR reports were acquired from the SRS automatically. The 10 drug combinations most frequently reported were found and the 10 most suspicious drug–drug ADR combinations for each method were detected automatically after the performance of the system.
CONCLUSIONS
Since the detection of drug–drug interaction depends upon the skills and memory of the professionals involved, is time consuming and the number of reports is increasing, this system might be a promising tool for the automated detection of possible drug–drug interactions in SRS.
Keywords: adverse drug reaction, drug–drug interactions, signal detection
WHAT IS ALREADY KNOWN ABOUT THE SUBJECT
Concomitant use of different drugs may yield excessive risk for adverse drug reactions and it is a challenging task to do surveillance on the safety profile of the interaction between different drugs.
Currently, several methods are used by pharmacoepidemiologists and statisticians to detect possible drug–drug interactions in spontaneous reporting systems.
However, with the increasing number of reports in the system, there is a growing need for a computerized system that could facilitate the process of data arrangement and detection of drug interaction.
WHAT THIS STUDY ADDS
We had already developed a computerized system to detect adverse drug reaction signals due to single drugs.
After the development of this system, interaction between different drugs could also be detected automatically and intelligently.
Introduction
Interaction between drug substances may yield excessive risk for adverse drug reactions (ADR) when two or more drugs are taken in combination. However, in premarketing trials, patients with multiple drug use are usually excluded, which makes the detection of drug–drug interactions in the postmarketing period even more important. The proportion of ADRs due to drug–drug interactions is estimated to be between 6% and 30%, and surveillance on the safety profile of the interaction between different drugs is challenging [1, 2].
Generally, the detection of possible interactions is based on the following concept: when a suspected ADR is reported more frequently in the combination of two drugs compared with the situation where they are used alone, this association might indicate the existence of a drug–drug interaction. The currently used methods for quantitative drug–drug interaction detection include frequentist approaches, regression approaches and Bayesian approaches. The χ2 test proposed by Alsheikh-Ai and the ADR reporting odds ratios method defined by the Netherlands Pharmacovigilance Foundation Lareb belong to the frequentist approaches [3, 4]. These methods are clear and easy to understand, but this type of approach does not adjust the counts for exposure to the various drug combinations and thus does not provide an appropriate statistical context for studying drug interaction. The logistic regression method presented by van Puijenbroek et al. and the log-linear model proposed by DuMouchel are regression approaches [5–7]. These methods offer the possibility of controlling for covariates and tend to achieve more realistic results than the frequentist approaches. The higher order Bayesian confidence propagation neural network method, the interaction signal score method and the Ω shrinkage measure method are Bayesian approaches [8–10]. Bayesian approaches calculate an observed to expected ratio for each relevant drug event or drug–drug event combination in the database and could achieve a more specific result. In addition, an additive model and a multiplicative model have also been presented by which the detected drug interaction signals could be further identified by statistical test [11].
Surveillance schemes based on spontaneous reporting systems (SRS) are a cornerstone of the early detection of drug hazards that are novel by virtue of their clinical nature, severity and/or frequency [12]. The Shanghai ADR SRS is a part of China ADR SRS and one of the major goals of this system is the timely detection of possible new ADRs and interactions. There are 12 000–16 000 ADR reports submitted to the system annually. However, with the increasing number of reports in the system, the setting up of a computerized system that could aid the automated detection of possible drug–drug interactions has become the focus of statisticians and pharmacoepidemiologists. In our study, we set up a computerized system that could facilitate the process of data acquisition and data arrangement. In addition, the logistic regression method, the Ω shrinkage measure method, the additive model as well as the multiplicative model were carried out automatically for the detection of possible drug interactions. Given the apparent disadvantage of the frequentist approaches, they were not employed in our system. The objective of the present study was to illustrate the computerized system as well as its performance characteristics with the ADR SRS of Shanghai.
Methods
Microsoft visual basic (vb) 6.0 was used as the programming language for this system and Microsoft Access was used as the database. The data were accessed from the database through the structured query language (sql).
Data acquisition
The data could be downloaded automatically with the system via http://www.adr.gov.cn, which was developed by National Adverse Drug Reaction Monitoring Centre of China.
Data coding
The following procedure was used to address the problem of redundant and variable drug nomenclature. The ADR names were coded with World Health Organization (WHO)-Adverse Reaction Terminology using preferred terms, which has been developed for more than 30 years to serve as a basis for rational coding of adverse reaction terms [13]. For example, when dyssomnia was reported as the ADR, then was changed to sleep disorder automatically by the system. In addition, the generic names for drugs were standardized according to catalogue of generic names for common prescription drugs, which was issued by Ministry of Health of China in 2007. The website http://app1.sfda.gov.cn/datasearch/face3/dir.html and Chinese Pharmacopoeia were also used as materials for our work [14].
Data pre-processing
When there was only one drug and multiple reactions in a report, then it was broken up into drug–ADR combinations by the system. For the report which included two drugs and multiple reactions, the system broke them up into drug–drug–ADR combinations after this procedure. Reports which included more than two drugs were excluded from the study. As a result, we were able to detect possible drug–drug interactions.
Data inquiry
According to the conditions input in the system, the data could be accessed from the database through sql.
Signal detection
The development and use of data mining tools for detecting new safety signals in postmarketing spontaneous reporting databases is becoming prevalent among regulators and drug monitoring centres as well as pharmaceutical companies, with hopes for earlier and more efficient detection of new safety signals postmarketing [15]. The logistic regression method has been applied by the Netherlands Pharmacovigilance Foundation Lareb. Before the performance of the method, all records in the database were automatically divided into cases and noncases by the system according to different ADRs. Cases were defined as patients who reported ADRs of interest, while ‘noncases’ consisted of all other reports. ADR reporting ORs were first calculated for the comparison of reports where both drug A and drug B were used concomitantly with reports where neither drug A nor drug B was used [4]. Then the ADR reporting ORs were adjusted for age and gender and calculated by logistic regression. In constructing the logistic model, drug A, drug B as well as the concomitant use of A and B were coded, respectively, by the system according to different ADRs and the model would then look like:
where a= age, G= gender, A= drug A, B= drug B, AB= the concomitant use of A and B.
The Ω shrinkage measure method has also been carried out for detecting suspicious drug–drug combinations with the entire WHO database. After the prior and posterior distribution for µ is assumed to be gamma-distributed, the exact credibility interval limits for µ can be found numerically as solutions to the following equation:
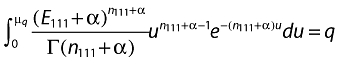 |
Norén et al. have given a detailed description of the computation of the Ω shrinkage measure method and a signal is considered to be generated when Ω025 > 0 [10].
The additive and multiplicative models have also been applied in the Food and Drug Administration's (FDA) database for the detection drug interaction. When performing the multiplicative model, it was assumed that the risk associated with a drug multiplies with the background risk and the performance of the additive model was under the assumption that the risk associated with a drug adds to the background risk. RRAB/(RRA × RRB) > 1 and RDAB – RDA + RDB > 0, respectively, indicate that a drug interaction signal is generated by the multiplicative and the additive model when the corresponding P-value is also <0.05. The theory of the two models was elaborated by Thakrar et al. and we refer to the formulae in their work [11].
Results
All in all, 33 897 crude ADR reports from January 2007 to December 2008 were acquired from the SRS automatically, 5345 (15.76%) of which were detected with two drugs. The number of drug combinations involved in the database was 2664, 70 of which were reported as > 10. The top 10 drug combinations were detected and listed in Table 1.
Table 1.
The 10 drug combinations that were reported most in the database
| Drug A | Drug B | Report number |
|---|---|---|
| Cefuroxime | Sodium chloride | 76 |
| Interferon alfa-2a | Ribavirin | 62 |
| Levofloxacin hydrochloride | Sodium chloride | 59 |
| Penicillin sodium | Sodium chloride | 56 |
| Penicillin sodium | Piperaxillin | 53 |
| Clindamycin | Sodium chloride | 48 |
| Piperaxillin | Sodium chloride | 47 |
| Cefuroxime | Ribavirin | 45 |
| Azlocillin | Penicillin sodium | 35 |
| Capecitabine | Oxaliplatin | 35 |
According to the results in Table 1, a well-known example of interaction between interferon alfa-2a and ribavirin, which could increase the incidence rate of anaemia, was selected by us to check whether it could be detected by our system. Results showed that the system detected the established drug–drug interaction as desired (Table 2).
Table 2.
Results for the established drug–drug interaction
| Algorithm | Variable | n | Value |
|---|---|---|---|
| Ω shrinkage measure | Ω025 | 5 | 1.23 |
| Logistic regression | OR (interferon alfa-2a) | 1 | 13.16 (1.65–91.95) |
| OR (ribavirin) | 0 | 0 (0–∞) | |
| OR (drug combination) | 5 | 129.68 (45.45–334.85) | |
| The additive model | δ | 5 | 0.07 |
| The multiplicative model | δ | 5 | * |
n, the number of the combinations when both of the drugs were used concomitantly and a certain adverse drug reaction was caused as a result. The P-value for the interaction term of AB in the logistic model was <0.001. The P-value for the additive and multiplicative model was 0.021 and <0.001, respectively.
RRA × RRB was 0 and the δ could not be calculated as a result.
With the system we carried out a database-wide screen. Tables 3–5 show the 10 most suspicious drug–drug–ADR combinations detected by the three methods, respectively. The P-values for the interaction term of AB in the logistic model for all 10 combinations were <0.05. All results in Table 5 were first detected by the additive model and then validated by the multiplicative model. Different methods were also compared according to the detected combinations during the database-wide screen in Table 6.
Table 3.
The 10 most suspicious drug–drug–adverse drug reaction (ADR) combinations detected by logistic regression in the database-wide screen
| Drug combinations (A and B) | ADR | n | OR (drug A) | OR (drug B) | OR (A and B) | |
|---|---|---|---|---|---|---|
| Levodopa and benserazide | Amantadine | Ataxia | 4 | 117.66 (30.04–460.91) | 0 (0–∞) | >999.99 (>999.99–>999.99) |
| Interferon alfa-2a | Ribavirin | Thyroid disorder | 21 | 769.16 (317.54–>999.99) | 0 (0–∞) | >999.99 (898.54–>999.99) |
| Mycophenolate mofetil | Prednisone | Abnormal lung function | 6 | 114.77 (32.23–408.68) | 0 (0–∞) | >999.99 (491.66–>999.99) |
| Chlorpromazine | Risperidone | Extrapyramidal disorder | 5 | 200.62 (125.72–320.15) | 202.48 (137.27–298.65) | 904.65 (172.24–>999.99) |
| Glucophage | Gliclazide | Hypoglycaemia | 3 | 5.63 (0.76–41.45) | 0 (0–∞) | 647.83 (101.91–>999.99) |
| Mycophenolate mofetil | Ciclosporin | Constipation | 4 | 0 (0–∞) | 0 (0–∞) | 257.25 (62.71–>999.99) |
| Interferon alfa-2a | Ribavirin | Marrow suppression | 33 | 53.30 (34.57–82.20) | 0 (0–∞) | 156.95 (93.41–263.72) |
| Azithromycin | Fleroxacin | Sleep disorder | 5 | 0.32 (0.08–1.27) | 11.56 (7.16–18.67) | 87.93 (30.77–251.27) |
| Capecitabine | Oxaliplatin | Thrombocytopenia | 4 | 0 (0–∞) | 0 (0–∞) | 45.03 (15.34–132.19) |
| Mezlocillin | Penicillin sodium | Allergic reaction | 7 | 0.76 (0.28−2.08) | 1.88 (1.46−2.41) | 4.33 (1.86−10.05) |
Table 5.
The 10 most suspicious drug–drug–adverse drug reaction (ADR) combinations detected by the additive and multiplicative model
| Drug combinations (A and B) | Adverse drug reaction | n | δ1 | P1 | δ2 | P2 | |
|---|---|---|---|---|---|---|---|
| Levodopa and benserazide | Amantadine | Ataxia | 4 | 0.8 | <0.001 | * | <0.001 |
| Levodopa and benserazide | Benzhexol | Neurosis | 6 | 0.78 | <0.001 | * | <0.001 |
| Tarceva | Gemcitabine | Diarrhoea | 5 | 0.66 | <0.001 | 6.91 | <0.001 |
| Mycophenolate mofetil | Ciclosporin | Constipation | 4 | 0.5 | 0.005 | * | <0.001 |
| Interferon alfa-2a | Ribavirin | Marrow suppression | 33 | 0.27 | <0.001 | 3.52 | <0.001 |
| Interferon alfa-2a | Ribavirin | Thyroid disorder | 21 | 0.21 | <0.001 | * | <0.001 |
| Azithromycin | Fleroxacin | Sleep disorder | 5 | 0.21 | 0.011 | 21.22 | <0.001 |
| Cefuroxime | Clindamycin | Local swelling | 4 | 0.21 | 0.027 | 13.44 | <0.001 |
| Mezlocillin | Penicillin sodium | Allergic reaction | 7 | 0.15 | 0.029 | 3.98 | <0.001 |
| Interferon alfa-2a | Ribavirin | Leucopenia | 17 | 0.12 | <0.001 | 1.67 | <0.001 |
δ1 and P1 represent the result of the additive model and δ2 and P2 represent the result of the multiplicative model. The meaning of
is as in Table 2.
Table 6.
Comparison of different methods according to the detected combinations during the database-wide screen
| Signal detection methods | ||||||
|---|---|---|---|---|---|---|
| Drug combinations (A and B) | Adverse drug reaction | n | Method A* | Method B† | Method C‡ | |
| Mycophenolate mofetil | Ciclosporin | Constipation | 4 | + | + | + |
| Azithromycin | Fleroxacin | Sleep disorder | 5 | + | + | + |
| Levodopa and benserazide | Amantadine | Ataxia | 4 | + | + | + |
| Interferon alfa-2a | Ribavirin | Thyroid disorder | 21 | + | + | + |
| Mycophenolate mofetil | Prednisone | Abnormal lung function | 6 | + | + | − |
| Glucophage | Gliclazide | Hypoglycaemia | 3 | + | + | − |
| Capecitabine | Oxaliplatin | Thrombocytopenia | 4 | + | + | − |
| Chlorpromazine | Risperidone | Extrapyramidal disorder | 5 | + | − | − |
| Interferon alfa-2a | Ribavirin | Marrow suppression | 33 | + | − | + |
| Mezlocillin | Penicillin sodium | Allergic reaction | 7 | + | − | + |
| Tarceva | Gemcitabine | Diarrhoea | 5 | − | + | + |
| Levodopa and benserazide | Benzhexol | Neurosis | 6 | − | + | + |
| Methotrexate | Dexamethasone | Muscle weakness | 7 | − | + | − |
| Cefuroxime | Clindamycin | Local swelling | 4 | − | − | + |
| Interferon alfa-2a | Ribavirin | Leucopenia | 17 | − | − | + |
Method A: the logistic regression method.;
Method B: the Ω shrinkage measure method.
Method C: the additive and multiplicative model; +, the combination was detected by the method; –, the combination was not detected by the method.
Table 4.
The 10 most suspicious drug–drug–adverse drug reaction (ADR) combinations detected by the Ω shrinkage measure method
| Drug combinations (A and B) | ADR | n | Ω025 | |
|---|---|---|---|---|
| Mycophenolate mofetil | Ciclosporin | Constipation | 4 | 1.69 |
| Capecitabine | Oxaliplatin | Thrombocytopenia | 4 | 1.56 |
| Levodopa and benserazide | Benzhexol | Neurosis | 6 | 1.50 |
| Methotrexate | Dexamethasone | Muscle weakness | 7 | 1.34 |
| Levodopa and benserazide | Amantadine | Ataxia | 4 | 1.18 |
| Mycophenolate mofetil | Prednisone | Abnormal lung function | 6 | 0.80 |
| Glucophage | Gliclazide | Hypoglycaemia | 3 | 0.66 |
| Interferon alfa-2a | Ribavirin | Thyroid disorder | 21 | 0.74 |
| Tarceva | Gemcitabine | Diarrhoea | 5 | 0.50 |
| Azithromycin | Fleroxacin | Sleep disorder | 5 | 0.42 |
Discussion
A major function of the SRS is generating new signals [16]. For this purpose, all reports are individually reviewed and detection depends upon the skills and memory of the professionals involved. Since this procedure is time consuming and the number of reports is increasing, there is a growing need for an automated system that could facilitate the process of data arrangement and detection of ADR, especially in some special cases such as drug–drug interactions. We had already developed a computerized system to detect ADR signals due to single drugs [17]. In this study, with the use of MS VB 6.0 and MS Access, we present another computerized system in which data acquisition could be carried out automatically and the process of data preprocessing could be facilitated. Moreover, after the database-wide screen, 10 drug–drug–ADR combinations with the highest statistical scores for each method were detected, which could be submitted to an expert panel to make a decision. The results indicate that this system could help to download data automatically and detect drug interactions intelligently.
The analysis of possible drug–drug interactions is based on the concept that a suspected ADR is more often reported on the combination of two drugs compared with the situation where either of these drugs has been used in absence of the other [18]. The advantage of logistic regression is that it offers the possibility for controlling for covariates, and furthermore offers a possibility of analysing the use of interaction terms in more detail. However, the use of the method for the assessment of interaction has been criticized by some epidemiologists, who believe that such models are not suitable for detecting drug interactions [19–21]. Norén et al. have also argued that logistic regression is prone to miss some reporting patterns strongly suggestive of suspected drug–drug interaction and have proposed the alternative Ω shrinkage measure method. After a confirmatory study using the WHO database, they believe that the Ω shrinkage measure is a more sophisticated method [10]. The presentation of the multiplicative and additive model provides another way to analyse possible interactions between two drugs. The characteristic of the two models is that the detected signal could be further validated by statistical tests. After their application with FDA's database, the additive model is found to be more sensitive in detecting interaction signals and the multiplicative model may further help qualify the strength of the signal detected by the additive model [11]. In fact, there has been a paucity of studies comparing the performance of different methods. According to our results listed in Table 6, seven combinations were detected by two methods and four combinations were even detected by all three methods, which may reflect the fact that the three methods are highly correlated. However, there was no gold standard for algorithms dealing with signal detection; as a result, problems such as sensitivity and specificity as well as the false positivity and false negativity of the three methods were not further researched in our study [22–24].
In view of the fact that large collections of individual case safety reports clearly constitute very complex sources of information, the results were also considered from the pharmacology perspective to determine whether there was interaction between the detected drug combinations. We found it pharmacologically plausible that most of the drug combinations interacted with each other. For example, it has been reported that the combined use of interferon alfa-2a and ribavirin could lead to the onset of thyroid disorder and marrow suppression [25]. Much clinical practice has also shown that capecitabine and oxaliplatin will increase the incidence rate of thrombocytopenia when they are used concomitantly [26, 27]. However, as regards drug combinations such as azithromycin and fleroxacin, we found no evidence to suggest that sleep disorder will be caused by the concomitant use of the two drugs. As a result, we believe that such combinations should be sent to the pharmacologist for further validation to determine to what extent the highlighted results are worthy of further follow-up or just driven by underlying data quality issues.
The detection of drug–drug interactions is much more complicated than the detection of drug–event combinations because of the relatively lower incidence rates and background reporting rates in SRS. Consequently, although much effort has been devoted to developing methods for detecting possible drug interactions, there are still no reports in the literature suggesting that any of the proposed interaction detection methods have been implemented for routine ADR surveillance. Nor are we aware of any examples of early warnings on drug–drug interaction produced by any of the methods. However, quantitative methods are undoubtedly indispensable for large collections of SRS data. In our research, all three methods were validated by case studies in the database and detected possible drug interaction signals. We will employ these methods for routine surveillance in our database for further analysis in our future research.
The selection of Ms Access as the database is mainly because of its availability and ease of use. However, with the increasing number of ADR reports, SQL Server 2000, which is more powerful for dealing with large databases, will be selected to replace MS Access. The aim of this study was to describe the development of a system that could aid the process of signal detection and promote the application of currently developed methods. Different methods employed by the system will be compared in more detail after their application with different databases. In addition, the employment of more sophisticated methods for interaction detection will also be the focus of our future work.
Conclusion
In SRS, there is a growing need for automatic detection of drug–drug interaction. In our study, we have developed a computerized system that could facilitate data arrangement and the process of signal detection. In addition, a database-wide screen was carried out to signal possible drug interactions with three different methods. After its application in the Shanghai ADR SRS, the system described promises to be a useful tool in analysing possible interactions.
Competing interests
None to declare.
This study was conducted under a grant from the National Natural Science Foundation of China (30872186) and two grants from the Ministry of Science and Technology of China (2008ZX10002–018 and 2008ZX09312–007). The study was also sponsored by Program of Shanghai Subject Chief Scientist (09xd1405500). The authors are indebted to the Adverse Drug Reaction Monitoring Centre of Shanghai, who contributed the data.
REFERENCES
- 1.Pirmohamed M, Orme M. Drug interactions of clinical importance. In: Davies D, Ferner R, de Glanville H, editors. Davies's Textbook of Adverse Drug Reactions. 5th. London: Chapman & Hall Medical; 1998. pp. 888–912. [Google Scholar]
- 2.Hauben M, Zhou X. Quantitative methods in pharmacovigilance: focus on signal detection. J Drug Saf. 2003;26:159–86. doi: 10.2165/00002018-200326030-00003. [DOI] [PubMed] [Google Scholar]
- 3.Alsheikh-Ali AA, Abourjaily HM, Karas RH. Risk of adverse events with concomitant use of atorvastatin or simvastatin and glucose-lowering drugs (thiazolidinediones, metformin, sulfonylurea, insulin, and acarbose) Am J Cardiol. 2002;89:1308–10. doi: 10.1016/s0002-9149(02)02334-2. [DOI] [PubMed] [Google Scholar]
- 4.Van Puijenbroek EP, Egberts AC, Meyboom RH, Leufkens HG. Signalling possible drug–drug interactions in a spontaneous reporting system: delay of withdrawal bleeding during concomitant use of oral contraceptives and itraconazole. Br J Clin Pharmacol. 1999;47:689–93. doi: 10.1046/j.1365-2125.1999.00957.x. [DOI] [PMC free article] [PubMed] [Google Scholar]
- 5.Van Puijenbroek EP, Egberts AC, Heerdink ER, Leufkens HG. Detecting drug–drug interactions using a database for spontaneous adverse drug reactions: an example with diuretics and non-steroidal anti-inflammatory drugs. Eur J Clin Pharmacol. 2000;56:733–8. doi: 10.1007/s002280000215. [DOI] [PubMed] [Google Scholar]
- 6.DuMouchel W, Pregibon D. Empirical Bayes screening for multi-item associations. Proc KDD 2001; New York: ACM, 67–76.
- 7.Wu X, Barbarā D, Ye Y. Screening and interpreting multi-item associations based on log-linear modeling. Proc KDD 2003; New York: ACM, 276–85.
- 8.Almenoff JS, Dumouchel W, Kindman LA, Yang X, Fram D. Disproportionality analysis using empirical Bayes data mining: a tool for the evaluation of drug interaction in the post-marketing setting. Pharmacoepidemiol Drug Saf. 2003;12:517–21. doi: 10.1002/pds.885. [DOI] [PubMed] [Google Scholar]
- 9.Norén GN, Bate A, Orre R, Edwards IR. Extending the methods used to screen the WHO drug safety database towards analysis of complex association and improved accuracy for rare events. Stat Med. 2006;25:3740–57. doi: 10.1002/sim.2473. [DOI] [PubMed] [Google Scholar]
- 10.Norén GN, Sundberg R, Bate A, Edwards IR. A statistical methodology for drug–drug interaction surveillance. Stat Med. 2008;27:6271–2. doi: 10.1002/sim.3247. [DOI] [PubMed] [Google Scholar]
- 11.Thakrar BT, Grundschober SB, Doessegger L. Detecting signals of drug–drug interactions in a spontaneous reports database. Br J Clin Pharmacol. 2007;64:489–95. doi: 10.1111/j.1365-2125.2007.02900.x. [DOI] [PMC free article] [PubMed] [Google Scholar]
- 12.Hauben M, Madigan D, Gerrits CM, Walsh L, Van Puijenbroek EP. The role of data mining in pharmacovigilance. Expert Opin Drug Saf. 2005;4:929–48. doi: 10.1517/14740338.4.5.929. [DOI] [PubMed] [Google Scholar]
- 13.National Adverse Drug Reaction Monitoring Center. WHO Adverse Reaction Terminology. Peking: China Medicine and Technology Press; 2003. [Google Scholar]
- 14.Committee of Chinese Pharmacopoeia. Chinese Pharmacopoeia. Peking: Chemical Industry Press; 2005. [Google Scholar]
- 15.Stephenson WP, Hauben M. Data mining for signals in spontaneous reporting databases: proceed with caution. Pharmacoepidemiol Drug Saf. 2007;16:359–65. doi: 10.1002/pds.1323. [DOI] [PubMed] [Google Scholar]
- 16.Du W, Levine M, Wang L, Zhang Y, Yi C, Wang H, Wang X, Xie H, Xu J, Jin H, Wang T, Huang G, Wu Y. Building a structured monitoring and evaluating system of postmarketing drug use in Shanghai. Can J Clin Pharmacol. 2007;14:40–4. [PubMed] [Google Scholar]
- 17.Ye X, Fu Z, Wang H, Du W, Wang R, Sun Y, Gao Q, He J. A computerized system for signal detection in spontaneous reporting system of Shanghai, China. Pharmacoepidemiol Drug Saf. 2009;18:154–8. doi: 10.1002/pds.1695. [DOI] [PubMed] [Google Scholar]
- 18.Egberts AC, Meyboom RH, van Puijenbroek EP. Use of measures of disproportionality in pharmacovigilance: three Dutch examples. Drug Saf. 2002;25:453–8. doi: 10.2165/00002018-200225060-00010. [DOI] [PubMed] [Google Scholar]
- 19.Skrondal A. Interaction as departure from additivity in case–control studies: a cautionary note. Am J Epidemiol. 2003;158:251–8. doi: 10.1093/aje/kwg113. [DOI] [PubMed] [Google Scholar]
- 20.Rothman KJ, Greenland S, Walker AM. Concepts of interaction. Am J Epidemiol. 1980;112:467–70. doi: 10.1093/oxfordjournals.aje.a113015. [DOI] [PubMed] [Google Scholar]
- 21.Hosmer DW, Lemeshow S. Confidence interval estimation of interaction. Epidemiology. 1992;3:452–6. doi: 10.1097/00001648-199209000-00012. [DOI] [PubMed] [Google Scholar]
- 22.Van Puijenbroek EP, Bate A, Leufkens HG, Lindquist M, Orre R, Eqberts AC. A comparison of measures of disproportionality for signal detection in spontaneous reporting system for adverse drug reactions. Pharmacoepidemiol Drug Saf. 2002;11:3–10. doi: 10.1002/pds.668. [DOI] [PubMed] [Google Scholar]
- 23.Lindquist M, Stahl M, Bate A, Edwards IR, Meyboom RH. A retrospective evaluation of a data mining approach to aid finding new adverse drug reaction signals in the WHO database. Drug Saf. 2000;23:533–42. doi: 10.2165/00002018-200023060-00004. [DOI] [PubMed] [Google Scholar]
- 24.Li C, Xia J, Deng J, Jiang J. A comparison of measures of disproportionality for signal detection on adverse drug reaction spontaneous reporting database of Guangdong province in China. Pharmacoepidemiol Drug Saf. 2008;17:593–600. doi: 10.1002/pds.1601. [DOI] [PubMed] [Google Scholar]
- 25.Lin F, Wang H. Concomitant nodular goiter during IFN and ribavirin treatment of HCV: a case report. Clin J Hepatol. 2006;14:163–6. [PubMed] [Google Scholar]
- 26.Zhang J, Miao J, Zhao F, Chen S, Guo X. Analysis of effects of the combination of capecitabine and oxaliplatin as first-line chemotherapy on metastatic colorectal cancer. Mod Med J. 2008;36:37–9. [Google Scholar]
- 27.Liang K, Li Y. Clinical observation of capecitabine combining oxaliplatin in the treatment of advanced colorectal carcinoma. Mod Oncol. 2008;16:1365–6. [Google Scholar]