

Abstract
Background
There is an elevated prevalence of celiac disease (CD) in family members (FMs) of celiac patients, but most prior studies have been done on selected populations. Aim: To determine the clinical, serological and genetic predictors of CD in FMs of a population-based cohort of index cases.
Methods
Index cases from Southeast Minnesota provided contact information for their first-degree relatives. FMs were examined for endomysial antibodies (EMA), tissue transglutaminase antibodies (tTGA), and human leucocyte antigen (HLA)-DQ genotyping. Two questionnaires were applied: BDQ and SF-36. Intestinal biopsies were offered if: any positive autoantibody or seronegative FMs with gastrointestinal symptoms and HLA-DQ at-risk for CD.
Results
We recruited 111 index cases that had 579 FMs of whom 344 (59%) were investigated. The average screening rate among families was 65%. A positive tTGA test was found in 47 (14%), 33 with a positive EMA test. CD was diagnosed in 39 (21 males), with an estimated prevalence of 11% (λR=16.1). All affected FMs carried the at-risk genotypes. Twenty-one (54%) had “silent” disease, most with severe intestinal villous atrophy. Carrying HLA-DQ2 (OR=16.1, 95% CI [2.1, 123]) and being a sibling (OR=2.5, 95% CI [1.1, 5.8]) are high-risk factors for CD.
Conclusions
CD is more common in first-degree relatives than previously reported in the United States, with siblings having the greatest risk. There is male preponderance of new cases, and many had silent disease despite severe histological injury. A more pro-active case-finding strategy in FMs may improve the diagnostic rate of CD in North America.
Keywords: celiac disease, families, screening
Introduction
Celiac disease (CD) affects ∼1% of Caucasians and causes damage to the small-intestine that is triggered by and dependent on the ingestion of gluten 1, 2, 3 Testing at-risk groups may unmask CD. 4-6 Familial aggregation is common: a large American study that recruited relatives during CD-support group meetings identified ∼5% of first-degree relatives with CD. 3 This is less than in Europe and may reflect different case selection, recruitment, and testing. The prevalence is higher in relatives of affected sibling pairs (17.2%), 7, 8 monozygotic twins (75%) and human leukocyte antigen (HLA)-identical siblings (40%).9 Genetic susceptibility for CD is associated with HLA-DQ2 (>90% of cases), the remainder carry DQ8. 10 Thus, the absence of these genotypes exclude CD-risk.1, 11
Undiagnosed patients may have chronic symptoms, severe complications, and excess mortality. 12, 13, 14 Widespread availability of accurate serology for CD facilitates case-finding noninvasively. 15, 16 The tissue transglutaminase (tTGA) test is sensitive (>90%) and specific (∼95%) for CD, while endomysial (EMA) test has a variable sensitivity (75-90%) but high specificity (100%).17, 18 Testing both antibodies may improve detection rate.
The best strategy to detect CD in families is unknown, and most prior studies used referral populations, with variable selection and recruitment methodology of both probands and family members (FMs). Avoiding reliance on proband recruitment may improve risk estimates. The aim of this study was to determine clinical, serological and genetic predictors of CD in parents, siblings and children of a population-based cohort of index cases.
Methods
Patients
The first-degree relatives of CD patients from Southeast Minnesota were investigated. Cases were identified from the Rochester Epidemiology Project that links the medical records of Olmsted County residents. 19 All index cases were seen at either the Mayo Clinic or the Olmsted Medical Center (OMC), which provide virtually all healthcare in the region. CD was confirmed by biopsy and response to GFD. 1 Mayo Foundation and OMC Institutional Review Boards approved this study.
Index cases provided contact information for FMs. We directly contacted all living first-degree relatives. Previously tested relatives were excluded. Sampling kits and questionnaires (BDQ and SF-36) 20, 21 were mailed if resided far away, and returned to Mayo Clinic for processing. Selection was not based on race, although all families were Caucasian.12 The screening protocol is shown in Figure 1. {Supplementary Table 1}
Figure 1.
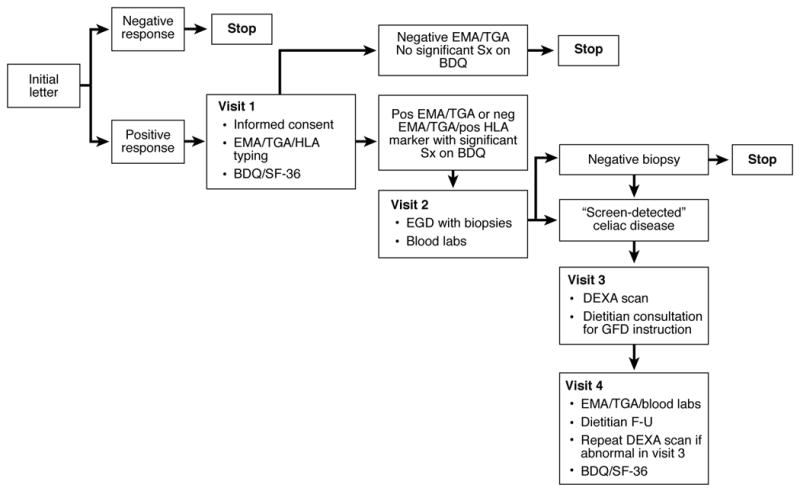
Summary of the screening protocol on first-degree relatives who where included in the study
Laboratory Testing
Serum was tested for tTGA using human antigen (INOVA Diagnostics Inc., San Diego, CA), positive = ≥20 U/mL. EMA was determined by indirect immunofluorescence on monkey esophagus (BINDAZYME™, The Binding Site Ltd, Birmingham, UK) as previously described. 22 Positive = ≥1:5. HLA class II was typed by low-resolution PCR-SSP (one Lambda Inc., Canoga Park, CA), and by high resolution methods for DQA/B alleles. 23
Intestinal Biopsy
Subjects were classified by a blinded pathologist based on the greatest change in 4 biopsies. 24
Operational Definitions
Marsh/Oberhuber stages 2 and 3 were considered “definite” CD. Positive serology plus DQ2/8 in those refusing endoscopy or stage 1 were classified as “probable” CD. “Screen-detected” CD included both categories.
Statistical Analysis
Data was summarized using descriptive statistics. Logistic regression was used to assess the risk for CD in FMs. Odds ratios (OR) and 95 percent confidence intervals (CIs) convey the magnitude of risk of CD. The “λR statistic” estimates the relative risk for the entire cohort or specific subsets such as siblings (λS).25 This statistic is the ratio of observed over expected CD prevalence, assuming a general population risk of 1:133.3 The change in scores from baseline to follow-up was summarized as mean change and 95 percent CIs. A p<0.05 was considered significant.
Results
Cases
We recruited 113 CD index cases: mean age at diagnosis 42.0 yr (range, 1.1-81.6); 79 (70%) female. HLA was available in 73 (65%): 60 DQ2+, 11 DQ2/DQ8+, and 1 only DQ8+. 30 (26%) index cases were related. All index cases permitted us to contact their relatives, 2 without FMs were excluded.
Participating Relatives
344 (mean age 42.4 yr, 207 [60%] female) of 574 FMs were analyzed (Figure 2). 75 (22%) were parents, 132 (38%) were children and 137 (40%) were siblings. Participation was less likely in older (p<0.001) and male (p=0.05) relatives. Only 9 relatives were <5 years of age, one of whom had CD.
Figure 2.
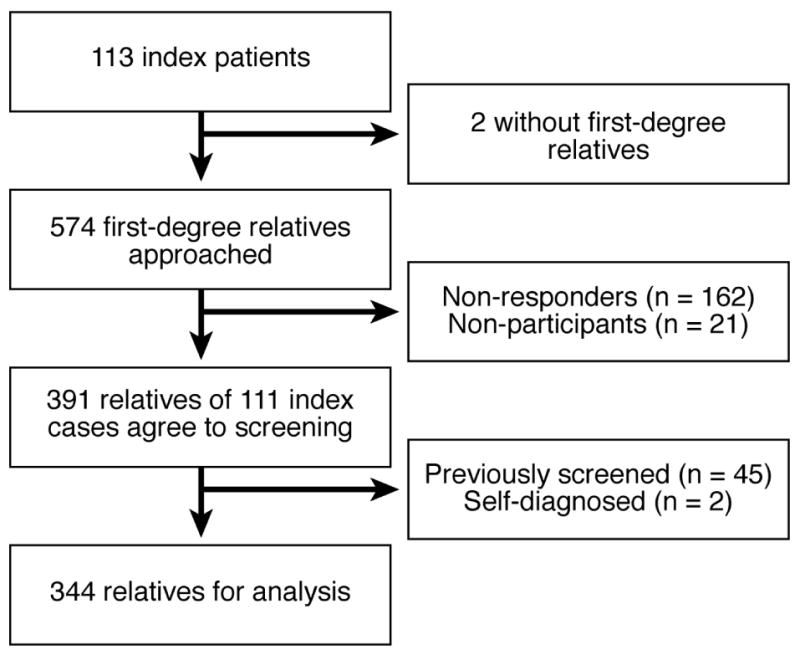
The numbers of index patients and first-degree relatives who were included in the study and the reasons for exclusion from the study
Diagnosis of Celiac Disease before Screening
45 relatives were tested for CD prior to this study, 25 (56%) were positive. Among positives, the mean age was 47 yr (range, 1-84), 22 (88%) female. Eleven (44%) were siblings, 8 (32%) children, and 6 (24%) parents. All 45 were excluded.
Screening and Family Size
The average screening rate among the 111 families was 65%. Of the FMs initially considered, all were included for 31(28%) index cases and at least one in 104 (94%). The screening rate decreased with increasing family size (p<0.001). {Supplementary Table 2}
Overall Results
IgA-class tTGA was positive in 47 (14%) of 344: 8(11%) parents, 13 (4%) children, and 26 (19%) siblings. EMA was positive in 33 (10%): 5(7%) parents, 10 (8%) children, and 18 (13%) siblings. All EMA-positive individuals were also tTGA positive, but 14 tTGA-positives were EMA-negative.
Intestinal biopsy was performed in 37 (79%) of the 47 tTGA-positive (9 EMA-negative) and 28 (85%) of the 33 EMA-positive. All EMA-positive individuals had biopsies compatible with CD. Biopsies were done in 29 (25%) of 122 symptomatic seronegatives DQ2+ or DQ8+: 3 (10%) had villous atrophy (VA) (stage 3b) [IgA-class tTGA levels were 7.8, 5, and 13.1 U/mL respectively]. (Table 1)
TABLE 1.
Summary of the results of serology and biopsy in relatives of celiac disease patients
| Serological Status | No. of relatives | Intestinal biopsy | ||||
|---|---|---|---|---|---|---|
| Normal (Marsh 0) | Marsh 1 | Marsh 2 | Marsh 3 | Not done | ||
| *IgA EMA+ tTGA+ | 33 | 0 (0%) | 1 (3%) | 1 (3%) | 26 (79%) | 5 (15%) |
| #IgA EMA- tTGA+ | 14 | 4 (29%) | 2 (14%) | 0 (0%) | 3 (21%) | 5 (36%) |
| IgA EMA- tTGA- | 297 | 26 (9%) | 0 (0%) | 0 (0%) | 3 (1%) | 268 (90%) |
| Total | 344 | 30 (9%) | 3 (1%) | 1 (0%) | 32 (9%) | 278 (81%) |
Sensitivity 77.8%, Positive predictor value (PPV) 100%
Sensitivity 13.9%, PPV 55.6%
EMA, endomysial antibody; tTGA, tissue transglutaminase antibody
Relative Risk by Relationship
CD was found in 39 (11%, λR=16.1) first-degree relatives who were related to just 32 (29%) of the 111 cases. Definite CD was diagnosed in 33 (10%, λR=13.7): 16 (49%) siblings, 11 (33%) children, and 6 (18%) parents. Probable CD was diagnosed in 6 cases: 5 siblings, and 1 parent. Siblings had greater odds of CD relative to children (OR 2.5, 95% CI [1.1, 5.8], p=0.034). Thus, 21 (15%, λS=21.8) siblings, 11 (8%, λC =11.8) children, and 7 (9%, λP=13.2) parents had “screen-detected” CD (Table 2). Neither the age of the FMs (p=0.15) or the index case (p=0.23) at assessment was associated with CD.
TABLE 2.
Risk of celiac disease by relationship to the index case
| Relationship | Odds Ratio† (95% CI) | p-value |
|---|---|---|
| Children | 1.0 [reference] | - |
| Parents | 1.6 (0.5, 5.6) | 0.45 |
| Siblings | 2.5 (1.1, 5.8) | 0.034 |
adjusted for age and gender
Histological Spectrum
Among 66 biopsied FMs; the Marsh/Oberhuber stage was 0 in 30 (46%), 1 in 3 (4%), 2 in 1 (2%), 3a in 3 (4%), 3b in 21 (32%), and 3c in 8 (12%). (Figure 3)
Figure 3.
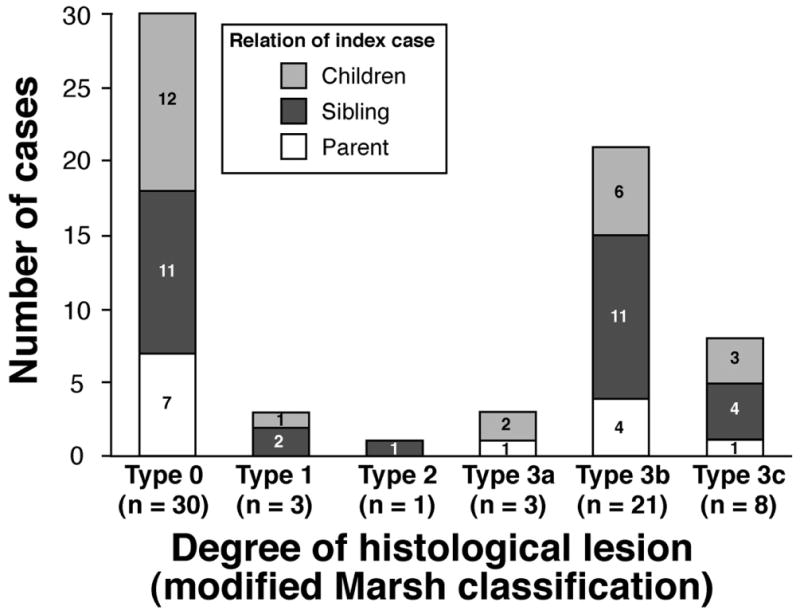
Spectrum of histological lesion in first-degree relatives of patients with celiac disease
Three seronegative (DQ2+) FMs with significant symptoms had VA, and 26 had normal biopsies. The intestinal biopsy was abnormal in all (n=28) double-positive (tTGA and EMA). Biopsy was abnormal in 5 of 9 with positive tTGA but negative EMA (stages 1 in 2, and 3b in 3).
Clinical Features of New Cases
CD was diagnosed in 39 subjects, 21 males. Classical, atypical, and silent forms of CD were recognized in 13% (2 siblings, 2 parents, 1 child), 33% (8 siblings, 3 parents, 2 children), and 54% (11 siblings, 2 parents, 8 children) of cases, respectively. The “atypical” manifestations were constipation and bloating (n=7), severe fatigue with non-specific musculoskeletal pain (n=4), and iron-deficiency anemia (n=2). Three (8%) had autoimmune disorders: Graves's disease, Hashimoto's thyroiditis, and type 1 diabetes. There was no difference in the frequency of gastrointestinal symptoms (p=0.39), the SF-36 (mean ±SD) physical composite score (52.2±7.7 vs. 51.2±8.3, p=0.50), and mental composite score (51.2±9.8 vs. 53±7.8, p=0.21) between relatives with or without CD.
HLA Status in Family Members
91 (27%) of the 342 FMs with HLA-typing did not carry DQ2. All relatives with CD (n=39) carried one of the at-risk HLA types. Carrying DQ2 increases the risk of CD in relatives (OR=16.1, 95% CI [2.1, 123], p=0.007). Approximately 70% of each relationship group also carried DQ2. {Supplementary Table 3}
Seronegative but DQ2+ FMs had greater odds for reporting symptoms of gastroesophageal reflux disease (OR=2.61, 95% CI [1.01, 6.72], p=0.05) than HLA-DQ2 negative, adjusting for age and gender.
Overall Prevalence
The overall frequency of CD in screened relatives (screen-detected [n=39] plus previously detected [n=25]) was 16% (λR=23.5). If we assume that tested relatives are representative of all eligible previously untested FMs, an extrapolation stratified by relationship can be used to calculate a weighted estimate of the total prevalence in all eligible FMs: 17% (λR=24.8). If we assume that all non-tested FMs are unaffected then a minimum estimate would be 11% (λR=16).
Follow-up
Serology was re-tested after one year on GFD in 33 (85%) of 39 relatives with CD. tTGA was negative in 20 (67%); 13 relatives were positive (9 were tTGA positive but EMA negative). For EMA, 29 (88%) were negative. Two seronegative relatives who had VA showed a normal biopsy after GFD. IgG-class tTGA was normal after 6 months on GFD in the other seronegative CD case. Ten (37%) of 27 tested had an abnormal DEXA scan (3 osteoporosis, 7 osteopenia). All relatives with abnormal baseline bone mineral density had DEXA scan after the GFD: there was an improvement in the lumbar spine T-score and Z-scores. Although the 95% CIs for the lumbar spine did not contain 0, these should be interpreted with caution since there was no sham GFD (control) group to evaluate whether the increase is really attributable to the GFD, the pre and post bone density assessment were limited to 11 selected patients, and the time to follow-up DEXA was not uniform. Twenty-two (59%) completed the BDQ and SF-36 questionnaires after GFD (4 children couldn't complete the questionnaires): there were no differences in gastrointestinal symptoms or the composite scores (SF-36). {Supplementary Table 4}
Discussion
The major findings were: Firstly, the prevalence of CD observed among first-degree relatives was higher (10% for “definite” CD) than previously reported in the US.3 Indeed, the overall prevalence was substantially higher than previously enumerated.26 This finding supports a more pro-active screening of FMs in the US. Secondly, carrying HLA-DQ2 and being a sibling of the index case were the greatest risk factors for CD.
The estimate of prevalence in family studies depends on accurate screening methodology and how index cases are selected and relatives recruited. 27 This study differs from others in several ways: 1) using a geographical basis for index case selection may avoid referral bias; 2) direct recruitment of FMs rather than utilizing the index case as the recruiter; 3) detection strategy not solely dependent on serology but augmented by HLA-typing and symptoms; and 4) the application of validated questionnaires for symptom assessment. Costless endoscopy increased recruitment of seropositive relatives for intestinal biopsies. Previously tested FMs were more likely to have CD (45%) than those screened in this study (11%). The high number of previously diagnosed is not surprising considering the high level of knowledge about CD in these families. Both groups need to be considered in overall family-risk assessment.
There was an interesting but unexpected male preponderance of new cases. All new cases carried the at-risk HLA. Thus, HLA genotyping is specific to exclude CD. 11 Accordingly, ∼27% of our FMs lack DQ2 and don't need further screening, though one DQ8+ case would have been missed. Thus, to exclude all possible CD cases, both DQ2 and DQ8 need to be absent.28, 29 Conversely, most people with DQ2 or DQ8 may never get CD and suffer discrimination, worry or misguided avoidance of gluten.11, 27
The presence of DQ2 and being a sibling are the greatest risk factors for CD in first-degree relatives. These findings are supported by experimental evidence of immunity to gliadin in the rectum of CD relatives. 30 Serologic screening should be offered to all first-degree relatives of patients with CD but especially to siblings who carried DQ2. The whole spectrum of enteropathy was observed, but despite severe histologic damage, over half were asymptomatic. 31
The benefits and risks of screening asymptomatic FMs of CD patients are incompletely understood. 32 Symptomatic CD is cause of severe complications but the long-term effect of GFD in screen-detected CD is unknown.14, 33 In our patients, symptoms or quality-of-life didn't improve after GFD but lumbar spine bone density scores did it. This data, although informative, was limited by the low number of cases, drop-outs, and the short period of GFD to assess long-term complications. Improvement in bone density, however, supports early case identification and treatment.
Selective IgA deficiency is associated with CD. 1, 34 Thus, IgA deficiency is possible in 3 “seronegative” relatives with abnormal histology. Indeed, IgA deficiency was probable in one, as the IgG-class tTGA was elevated. Healing of the intestine after GFD confirmed gluten-induced intestinal damage in the other 2 cases that had normal but measurable levels of IgA-class tTGA in their serum making IgA deficiency unlikely. Autoantibodies can be present only in the mucosa. 35 All “seronegative” relatives had sub-total VA. Thus, although a previous study demonstrated that endomysial positivity depends on severity of VA, 36 the degree of the lesion didn't explain the absence of circulating antibodies in our patients. The degree of enteropathy, may explain why some tTGA positive relatives were EMA negative; indeed most double-positive cases had VA, but many tTGA positive/EMA negative had normal histology or minimal histologic lesions.
Our study was limited as not all eligible relatives were tested. Direct face-to-face contact may be important in recruiting such individuals, but was impractical for many. Only a small proportion of seronegative relatives with the at-risk HLA were biopsied. Finally, initially negative FMs were not retested; thus, the use of multiple testing to exclude family-risk was not evaluated. 37
In conclusion, this study, demonstrated the highest prevalence of CD in first-degree relatives of CD patients in the US. Carrying DQ2 and being a sibling are the principal risk factors for CD. Most affected relatives were asymptomatic despite severe histological injury. A more pro-active case-finding strategy in FMs may improve the diagnostic rate of CD in North America.
Supplementary Material
Acknowledgments
supported by the American College of Gastroenterology (ACG) International Training Grant 2006 and the NIH Training Grant in Gastrointestinal Allergy and Immunology Research T32 AI-07047 (to ART), CTSA grant 1UL1RR024150-01 from the National Center for Research Resources (NCRR), and NIH grants DK-57892 and DK-070031 (to JAM). This study was made possible by the Rochester Epidemiology Project (R01 AR30582) from the National Institute of Arthritis and Musculoskeletal and Skin Diseases.
Abbreviations
- CD
celiac disease
- HLA
human leukocyte antigen
- EMA
endomysial antibody
- FMs
family members
- tTG
tissue transglutaminase
- tTGA
tissue transglutaminase antibody
- BDQ
bowel disease questionnaire
- SF-36
Short Form Health Survey
Footnotes
Publisher's Disclaimer: This is a PDF file of an unedited manuscript that has been accepted for publication. As a service to our customers we are providing this early version of the manuscript. The manuscript will undergo copyediting, typesetting, and review of the resulting proof before it is published in its final citable form. Please note that during the production process errors may be discovered which could affect the content, and all legal disclaimers that apply to the journal pertain.
References
- 1.Rostom A, Murray JA, Kagnoff MF. American Gastroenterological Association (AGA) Institute technical review on the diagnosis and management of celiac disease. Gastroenterology. 2006;131(6):1981–2002. doi: 10.1053/j.gastro.2006.10.004. [DOI] [PubMed] [Google Scholar]
- 2.Catassi C. The world map of celiac disease. Acta Gastroenterol Latinoam. 2005;35(1):37–55. [PubMed] [Google Scholar]
- 3.Fasano A, Berti I, Gerarduzzi T, et al. Prevalence of celiac disease in at-risk and not-at-risk groups in the United States: a large multicenter study. Arch Intern Med. 2003;163(3):286–92. doi: 10.1001/archinte.163.3.286. [DOI] [PubMed] [Google Scholar]
- 4.Talal AH, Murray JA, Goeken JA, et al. Celiac disease in an adult population with insulin-dependent diabetes mellitus: use of endomysial antibody testing. Am J Gastroenterol. 1997;92:1980–4. [PubMed] [Google Scholar]
- 5.Kemppainen T, Kroger H, Janatuinen E, et al. Osteoporosis in adult patients with celiac disease. Bone. 1999;24(3):249–55. doi: 10.1016/s8756-3282(98)00178-1. [DOI] [PubMed] [Google Scholar]
- 6.Sanders DS, Carter MJ, Hurlstone DP, et al. Association of adult celiac disease with irritable bowel syndrome: a case-control study in patients fulfilling ROME II criteria referred to secondary care. Lancet. 2001;358(9292):1204–8. doi: 10.1016/S0140-6736(01)06581-3. [DOI] [PubMed] [Google Scholar]
- 7.Book L, Zone JJ, Neuhausen L. Prevalence of celiac disease among relatives of sib pairs with celiac disease in U.S. families. Am J Gastroenterol. 2003;98:377–81. doi: 10.1111/j.1572-0241.2003.07238.x. [DOI] [PubMed] [Google Scholar]
- 8.Gudjonsdottir AH, Nilsson S, Ek J, et al. The risk of celiac disease in 107 families with at least two affected siblings. JPGN. 2004;38:338–42. doi: 10.1097/00005176-200403000-00020. [DOI] [PubMed] [Google Scholar]
- 9.Greco L, Romino R, Coto I, et al. The first large population based twin study of celiac disease. Gut. 2002;50:624–28. doi: 10.1136/gut.50.5.624. [DOI] [PMC free article] [PubMed] [Google Scholar]
- 10.Louka AS, Sollid LM. HLA in celiac disease: unraveling the complex genetics of a complex disorder. Tissue Antigens. 2003;61(2):105–17. doi: 10.1034/j.1399-0039.2003.00017.x. [DOI] [PubMed] [Google Scholar]
- 11.Kaukinen KPJ, Maki M, Collin P. HLA-DQ typing in the diagnosis of celiac disease. Am J Gastroenterol. 2003;97:695–99. doi: 10.1111/j.1572-0241.2002.05471.x. [DOI] [PubMed] [Google Scholar]
- 12.Murray JA, Van Dyke C, Plevak MF, et al. Trends in the identification and clinical features of celiac disease in a North American community, 1950-2001. Clin Gastroenterol Hepatol. 2003;1(1):19–27. doi: 10.1053/jcgh.2003.50004. [DOI] [PubMed] [Google Scholar]
- 13.Metzger MH, Heier M, Maki M, et al. Mortality excess in individuals with elevated IgA anti-transglutaminase antibodies: The KORA/MONICA Augsburg Cohort Study 1989-1998. Eur J Epidemiol. 2006;21:359–65. doi: 10.1007/s10654-006-9002-4. [DOI] [PubMed] [Google Scholar]
- 14.Catassi C, Fabiani E, Corrao G, et al. Risk of non-Hodgkin lymphoma in celiac disease. JAMA. 2002;287(11):1413–9. doi: 10.1001/jama.287.11.1413. [DOI] [PubMed] [Google Scholar]
- 15.NIH consensus statement on celiac disease. NIH Consens State Sci Statements. 2004;21(1):1–22. [PubMed] [Google Scholar]
- 16.Catassi C, Kryszak D, Louis-Jacques O, et al. Detection of celiac disease in primary care: a multicenter case-finding study in North America. Am J Gastroenterol. 2007;102:1454–1460. doi: 10.1111/j.1572-0241.2007.01173.x. [DOI] [PubMed] [Google Scholar]
- 17.Farrell RJ, Kelly CP. Celiac sprue. N Engl J Med. 2002;346(3):180–8. doi: 10.1056/NEJMra010852. [DOI] [PubMed] [Google Scholar]
- 18.Rostom A, Dube C, Cranney A, et al. The diagnostic accuracy of serologic tests for celiac disease: a systematic review. Gastroenterology. 2005;128(4 Suppl 1):S38–46. doi: 10.1053/j.gastro.2005.02.028. [DOI] [PubMed] [Google Scholar]
- 19.Melton LJ., 3rd History of the Rochester Epidemiology Project. Mayo Clin Proc. 1996;71(3):266–74. doi: 10.4065/71.3.266. [DOI] [PubMed] [Google Scholar]
- 20.Talley NJ, Phillips SF, Wiltgen CM, et al. Assessment of functional gastrointestinal disease: the bowel disease questionnaire. Mayo Clin Proc. 1990;65:1456–78. doi: 10.1016/s0025-6196(12)62169-7. [DOI] [PubMed] [Google Scholar]
- 21.Yacavone RF, Locke R, III, Provenzale DT, et al. Quality of life measurement in gastroenterology: what is available? Am J Gastroenterol. 2001;96:285–97. doi: 10.1111/j.1572-0241.2001.03509.x. [DOI] [PubMed] [Google Scholar]
- 22.Chorzelski TP, Beutner EH, Sulej J, et al. IgA anti-endomysium antibody. A new immunological marker of dermatitis herpetiformis and celiac disease. Br J Dermatol. 1984;11(4):395–402. doi: 10.1111/j.1365-2133.1984.tb06601.x. [DOI] [PubMed] [Google Scholar]
- 23.Olerup O, Aldener A, Fogdell A. HLA-DQB1 and DQA1 typing by PCR amplification with sequence-specific primers (PCR-SSP) in 2 hours. Tissue Antigens. 1993;41:119–34. doi: 10.1111/j.1399-0039.1993.tb01991.x. [DOI] [PubMed] [Google Scholar]
- 24.Oberhuber G. Histopathology of celiac disease. Biomed Pharmacother. 2000;54(7):368–72. doi: 10.1016/S0753-3322(01)80003-2. [DOI] [PubMed] [Google Scholar]
- 25.Risch N. Linkage strategies for genetically complex traits. II the power of affected relative pairs. Am J Hum Genet. 1990;46:229–41. [PMC free article] [PubMed] [Google Scholar]
- 26.Dube C, Rostom A, Sy R, et al. The prevalence of celiac disease in average-risk and at-risk Western European populations: a systematic review. Gastroenterology. 2005;128(4 Suppl 1):S57–67. doi: 10.1053/j.gastro.2005.02.014. [DOI] [PubMed] [Google Scholar]
- 27.Murray JA. Celiac disease in patients with an affected member, type 1 diabetes, iron-deficiency, or osteoporosis. Gastroenterology. 2005;128(4 Suppl 1):S52–S56. doi: 10.1053/j.gastro.2005.02.029. [DOI] [PubMed] [Google Scholar]
- 28.Karell K, Louka AS, Moodie SJ, et al. HLA types in celiac disease patients not carrying the DQA1*05-DQB1*02 (DQ2) heterodimer: results from the European genetics cluster on celiac disease. Human Immunology. 2003;64:469–77. doi: 10.1016/s0198-8859(03)00027-2. [DOI] [PubMed] [Google Scholar]
- 29.Karinen H, Karkkainen P, Pihlajamaki J, et al. HLA genotyping is useful in the evaluation of the risk of celiac disease in the 1st-degree relatives of patients with celiac disease. Scand J Gastroenterol. 2006;41:1299–1304. doi: 10.1080/00365520600684548. [DOI] [PubMed] [Google Scholar]
- 30.Troncone R, Mazzarella G, Leone N, et al. Gliadin activates mucosal cell mediated immunity in cultured rectal mucosa from celiac patients and a subset of their siblings. Gut. 1998;43:484–89. doi: 10.1136/gut.43.4.484. [DOI] [PMC free article] [PubMed] [Google Scholar]
- 31.Brar P, Kwon GY, Egbuna II, et al. Lack of correlation of degree of villous atrophy with severity of clinical presentation of celiac disease. Dig Liver Dis. 2007;39:26–29. doi: 10.1016/j.dld.2006.07.014. [DOI] [PubMed] [Google Scholar]
- 32.Collin P. Should adults be screened for celiac disease? What are the benefits and harms for screening? Gastroenterology. 2005;128:S104–S108. doi: 10.1053/j.gastro.2005.02.021. [DOI] [PubMed] [Google Scholar]
- 33.West J, Logan RF, Smith CJ, et al. Malignancy and mortality in people with celiac disease: a population-based cohort study. BMJ. 2004;326(7468):716–9. doi: 10.1136/bmj.38169.486701.7C. [DOI] [PMC free article] [PubMed] [Google Scholar]
- 34.Cataldo F, Marino V, Ventura A, et al. Prevalence and clinical features of selective immunoglobulin A deficiency in celiac disease: an Italian multicentre study. Gut. 1998;42(3):362–5. doi: 10.1136/gut.42.3.362. [DOI] [PMC free article] [PubMed] [Google Scholar]
- 35.Salmi TT, Collin P, Korponay-Szabo IR, et al. Endomysial antibody-negative celiac disease: clinical characteristics and intestinal autoantibody deposits. Gut. 2006;55(12):1746–53. doi: 10.1136/gut.2005.071514. [DOI] [PMC free article] [PubMed] [Google Scholar]
- 36.Abrams JA, Diamond B, Rotterdam H, et al. Seronegative celiac disease: increased prevalence with lesser degrees of villous atrophy. Dig Dis Sci. 2004;49(4):546–50. doi: 10.1023/b:ddas.0000026296.02308.00. [DOI] [PubMed] [Google Scholar]
- 37.Goldberg D, Kryszak D, Fasano A, et al. Screening for celiac disease in family members: is follow-up testing necessary? Dig Dis Sci. 2007;54(4):1082–6. doi: 10.1007/s10620-006-9518-1. [DOI] [PubMed] [Google Scholar]
Associated Data
This section collects any data citations, data availability statements, or supplementary materials included in this article.