Abstract
New high-throughput immunoassay methods for rapid point-of-care diagnostic applications represent an unmet need and current focus of numerous innovative methods. We report a new micromosaic competitive immunoassay developed for the analysis of the thyroid hormone thyroxine (T4), inflammation biomarker C-reactive protein (CRP), and the oxidative damage marker 3-nitrotyrosine (BSA–3NT) on a silicon nitride substrate. To demonstrate the versatility of the method, both direct and indirect format competitive immunoassays were developed and could be applied simultaneously for single samples. Signals from standard solutions were fit to a logistic equation, allowing simultaneous detection of T4 (7.7–257.2 nM), CRP (0.3–4.2 µg/mL), and BSA–3NT (0.03–22.3 µg/mL). Total assay time including sample introduction, washing, and fluorescence measurement was less than 45 min. Dissociation constants for affinity pairs in the system have been estimated using regression. This proof-of-concept experiment shows that both small and macromolecular biomarkers can be quantified from a single sample using the method and suggests that groups of clinically related analytes may be analyzed by competitive micromosaic immunoassay techniques.
Following Yalow and Berson’s pioneering work in the late 1950s, immunoassay techniques have become the primary tool for analysis of complex biological samples in clinical laboratory settings.1 Antibodies are the essential reagent for immunoassay testing, providing high selectivity, specificity, and affinity necessary to assay complex samples such as whole blood or serum. Thousands of antibodies and other affinity reagents are available commercially for a variety of analytes, ranging from large proteins to small molecules. Although many affinity assays have been developed, heterogeneous immunoassay protocols have become increasingly popular in both clinical and research labs. These procedures require one or more affinity capture reagents to be bound to a solid phase to capture target analytes. This design proves advantageous because excess or unreacted reagent and sample can be separated from the desired immunocomplex by washing the surface following the capture reaction.2 Heterogeneous methods concentrate reagent on the surface thereby increasing the observed signal. Solid-phase heterogeneous formats have been superseded by modern techniques such as the enzyme-labeled immunosorbent assay (ELISA.) The micromosaic strategy has recently been developed as a high-density heterogeneous immunoassay.3,4 In the micromosaic pattering approach, micrometer-scale channels are fabricated in a polymer, normally poly-(dimethylsiloxane) (PDMS), using soft lithography.5 Completed microfluidic networks (µFNs) are then formed when the network is reversibly sealed to a flat substrate such as a silicon wafer or PDMS. Solutions carrying reagent are introduced to the µFN through ports in the polymer mold.4,6 During first-dimension patterning, a receptor molecule flows through the network and binds to the substrate, either through passive adsorption, affinity interaction, or covalent attachment.4 This creates a pattern of the receptor on the substrate that replicates the pattern of the microfluidic channels. After removal of the first microfluidic channel, remaining reactive sites on the substrate are passivated with a blocking agent to minimize nonspecific adsorption. For second-dimension pattering, the reagents are delivered to the substrate via channels perpendicular to the initial pattern of the immobilized capture molecules. Binding between analytes in the sample and surface-bound affinity reagents is observed after the removal of the second stamp, usually via fluorescence. Affinity interactions produce a pattern of squares on the substrate; thus, the term “micromosaic” has been used to describe the pattern. Micromosaic immunoassays offer an appealing alternative to traditional immunoassays for several reasons. Required sample volumes are submicroliter, and the flow of solution through the network is driven by capillary and hydrodynamic flow eliminating the need for pressurized or electrokinetic pumps. Furthermore, the method allows for precise localization of reagents onto the substrate at the micrometer scale, while the sample ports provide an interface for control of microscopic phenomena. Last, such assays are rapid because they take advantage of micrometer-scale diffusion distances.7,8 Micromosaics have been used to measure DNA hybridization rates, detect cell surface receptors, detect cardiac markers, and simultaneously analyze samples for different analyte classes including bacteria, viruses, and proteins.9–12 To date, however, they have not been used for competitive immunoassays.
This study demonstrates the first competitive micromosaic immunoassays using thyroxine (T4), C-reactive protein (CRP), and bovine serum albumin labeled 3-nitrotyrosine (BSA–3NT) as model analytes. Surface-activated silicon nitride is employed as the substrate, a unique material for heterogeneous immunoassays with direct applications to waveguide technology.13 It is shown that both direct (surface-bound antibody) and indirect (surface-bound hapten) competitive formats can be performed simultaneously. 14 Analyte binding curves allow detection over the reference ranges for T4 (60–140 nM) and CRP (<10 µg/mL) and over nanogram per milliliter concentrations of BSA–3NT. Finally, detection of all three analytes in affinity-purified human serum is successfully demonstrated. This work attempts to introduce multiplexed analysis of metabolites and proteins using the micromosaic platform as an important step in bioassay development.15
MATERIALS AND METHODS
Chemicals and Materials
CRP (no. 30-AC05), CRP monoclonal antibody (mAb) (mouse IgG1, M701289), and T4 mAb (mouse IgG2b, M94208) were purchased from Fitzgerald (Concord, MA). 3NT pAb (rabbit IgG A-21285) was purchased from Invitrogen (Carlsbad, CA). N-(2-Aminoethyl)-3-aminopropyl-trimethoxysilane (EDS) was obtained from Gelest (Morrisville, PA). Sulfo-SMCC, all dialysis materials, and BCA protein assay materials were purchased from Pierce (Rockford, IL). Silicon nitride coated silicon wafers (500 Å thickness) were received as a gift from Thermo-Electron (Waltham, MA), and silicon wafers coated with 100 nm of thermal oxide were purchased from University Wafer (South Boston, MA). SU8-2035 photoresist was purchased from Microchem (Newton, MA). PDMS monomer and cross-linker (Sylgard 184) were received from Dow Corning (Midland, MI) and used at the recommended 10:1 ratio. Biopsy punches used for creating entrance and exit wells in the µFNs were purchased from Technical Innovations (Brazoria, TX). Serum samples were affinity-purified in our laboratory against antibody-coated particles. 16 Purified samples were spiked with analyte to the desired concentrations. All other chemicals and reagents were obtained from Sigma (St. Louis, MO) and used as received. Fluorescent measurements were made using a Photometrics HQ2 CCD camera from Roper Scientific (Tuscon, AZ) and Metamorph software from Molecular Devices (Sunnyvale, CA) on a Nikon Eclipse TE2000-U epifluorescence microscope assembly (Melville, NY).
Fabrication of Microfluidic Networks
Photolithographic molds for µFNs were made according to previous reports.17,18 Masks were designed using Adobe Illustrator and printed by Photoplot Store at 40 000 dpi (Colorado Springs, CO.) It was observed that silicon wafers with a 100 nm layer of thermal oxide bonded strongly to SU-8 photoresist, providing stability and reproducibility for features below 30 µm in width. Each mold was designed as a negative relief for a network containing 12 separate channels, each 20 µm wide with 40 µm spacing between channels. Profilometry was used to measure actual channel cross-sectional dimensions, and these were found to be 26 µm wide and 16.1 µm high. PDMS µFNs made from this mold were prepared for sample introduction with a 1.65 mm diameter punch to create inlet and outlet ports. All µFNs were subjected to sequential solvent extraction using toluene, ethyl acetate, and acetone for 2 h each with stirring. Residual solvent was removed from the µFNs by overnight baking at 65 °C. Solvent compatibility with PDMS has been established previously.19
Preparation of Labeled Proteins and Protein Conjugates
Prior to use, all proteins were purified by dialysis against PBS (150 mM NaCl, 50 mM Na2HPO4 pH 7.4) at 4 °C for 8 h using a Pierce Slide-a-Lyzer kit with a 3.5 kDa molecular weight cutoff. BSA–T4 and BSA–3NT conjugates were prepared according to the literature; however, the haptens were solubilized using DMSO and 50 mM phosphate pH 8.5 prior to conjugation due to low solubility at lower pH values.20 It was found that conjugates could also be synthesized effectively according to the Pierce instructions for EDC-based coupling as an alternative method. Conjugates were dialyzed against PBS and water at room temperature (22 ± 1°C) extensively to remove unreacted hapten and EDC, which could interfere with assay performance. T4-mAb, 3NT-pAb as well as CRP were labeled with the amine-reactive fluorophore fluorescein isothiocyanate (FITC) according to the established procedure (Sigma). FITC conjugates were purified using Pall Omega Nanosep 3 kDa centrifuge filters. Final concentrations of all stock protein solutions were determined by bicinchoninic acid assay (BCA).21
Micromosaic Immunoassays on Silicon Nitride Substrates
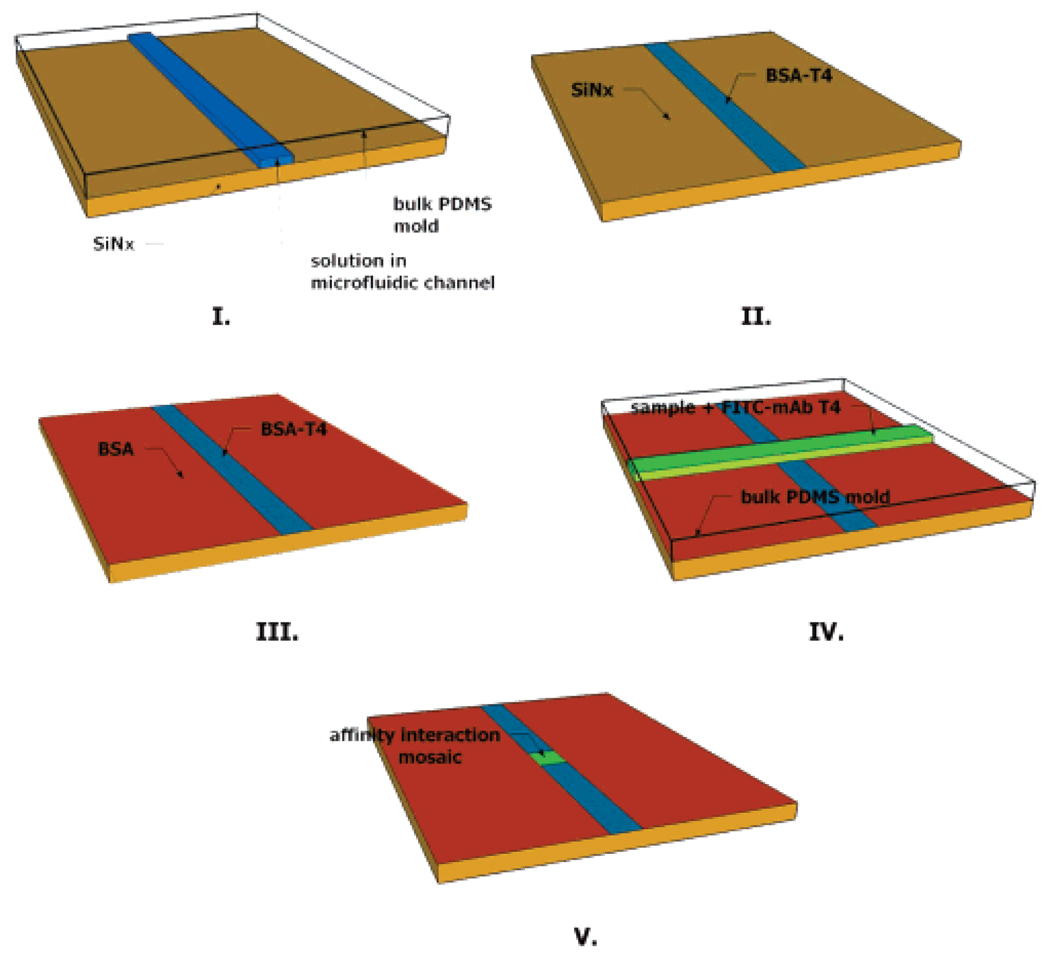
All silicon nitride substrates were modified with a thiol-reactive maleimide group to facilitate covalent surface immobilization of affinity reagents as previously reported.22 Briefly, substrates were first silanized using EDS which functionalized the surface with a primary amine. Derivatization of the amine with the heterobifunctional cross-linker Sulfo-SMCC produced a maleimide-modified substrate capable of reaction with protein sulfhydryls. Protein attached in such a manner was expected to present the sample with a population of heterogeneously oriented receptors. BSA conjugates were found to adsorb to modified and unmodified substrates; however, functional levels of mAb-CRP bound only to modified substrates. µFNs were rendered hydrophilic by exposure to air plasma (18 W) for 30 s (first-dimension patterning) or 40 s (second-dimension patterning) at 25 Torr. Hydrophilic µFNs were sealed to 2 cm × 2 cm silicon nitride substrates using very light pressure. Sample ports were filled with <1 µL of solution, which could subsequently be observed with the naked eye traversing the length of the channel under capillary action. First-dimension patterning was allowed to proceed for 10 min, at which time the µFN was removed under a constant flow of PBS containing 0.05% Tween 20 (PBS–T) to prevent further surface patterning. Substrates were rinsed copiously with PBS–T solution and water. Remaining reactive sites on the surface were blocked with a solution of 5% BSA and 1 mM 8-anilino-1-naphthalene sulfonic acid (ANS) in PBS for 5 min. The concentration of BSA in the blocking solution required for a complete surface passivation in 5 min time was determined empirically. The same rinse procedure followed the blocking step, and substrates were then dried under a stream of nitrogen. Orthogonal second-dimension patterning followed the same parameters as the first, with µFN removal after 20 min. Patterning beyond 20 min did not produce a change in signal, indicating binding under saturating conditions. Substrates were given a final wash, then dried under nitrogen, before fluorescence measurements were made. A schematic of the overall procedure for an indirect competitive T4 assay is show in Figure 1. Total assay time including the fluorescence measurement was approximately 45 min.
Figure 1.
Schematic of patterning steps for T4 immunoassay. (I) BSA–T4 is patterned through a microfluidic network (µFN) on the substrate. (II) The substrate is washed, leaving the patterned feature. (III) Remaining reactive sites are blocked from nonspecific adsorption using BSA. (IV) A sample containing FITC-labeled monoclonal antibody for T4 is patterned perpendicular to the first feature using a second µFN. (V) Affinity interactions are observed in a mosaic pattern on the substrate using fluorescence imaging.
RESULTS AND DISCUSSION
Specificity of Fluorescent Tracers for Surface-Bound Capture Reagents
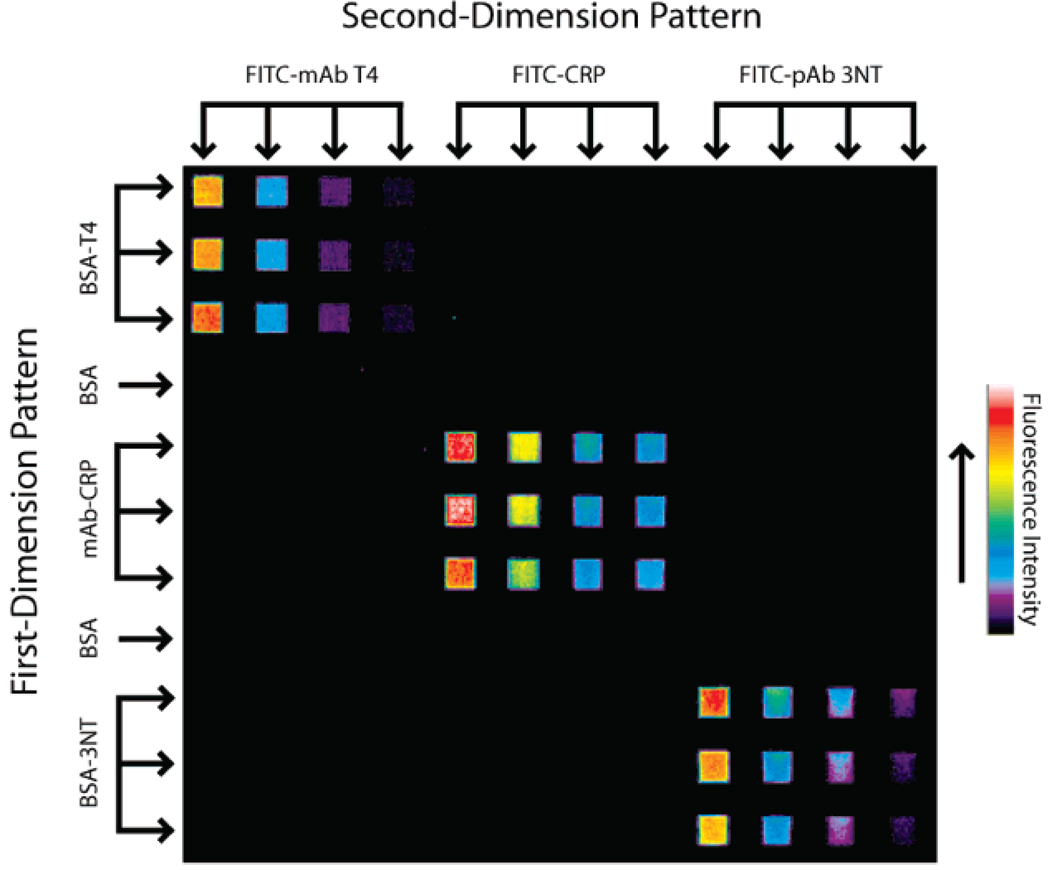
Immunoassays derive much of their usefulness from the high specificity of antibodies for antigens or haptens in complex samples. However, cross-reactivity between antibodies and other nontarget serum metabolites, solutes, or proteins is a concern in every immunoassay. It is therefore important to assess reagent cross-reactivity before a multianalyte immunoassay can be performed. An experiment was designed to examine cross-reactivity between the two competitive immunoassay formats and three fluorescent reagents. For first-dimension patterning, BSA–T4 (0.24 mg/mL), CRP mAb (0.025 mg/mL), and BSA–3NT (0.14 mg/mL) were patterned in triplicate in one direction across a silicon nitride substrate. Channels containing 2 mg/mL BSA in PBS were used as a negative control between channels containing conjugates and antibody. After washing and blocking, four dilutions each of FITC–T4-mAb, FITC–CRP, and FITC–3NT-pAb were patterned perpendicular to and over the surface-bound receptors. A representative fluorescent image of this micromosaic is shown in Figure 2. Labeled ligands in this system clearly bind only to their intended targets on the substrate, as indicated by each fluorescent signal at mosaics where there is a matched affinity pair. Nonspecific binding at BSA-blocked locations outside of the mosaic was also below a detectable level and did not interfere with the experiment at the protein concentrations employed. This result demonstrates that all three corresponding analytes can be assayed simultaneously using the micromosaic approach, without interference due to reagent cross-reactivity.
Figure 2.
Specificity assessment of the three surface receptor/fluorescent ligand pairs. Receptors were immobilized to the substrate during first-dimension patterning. Dilutions of fluorescent ligands patterned orthogonally to the first dimension demonstrate the affinity and specificity properties of the system. Cross-reactivity and nonspecific binding were below the fluorescent detection limit employed here.
Optimization of Competitive Immunoassays
All competitive immunoassays rely on the premise that a labeled or immobilized reagent can compete with sample analyte for the same binding site on an antibody. Dose–response curves produced in this manner show an inverse relationship between signal and analyte concentration.23 These sigmoidal curves have a variable slope, the steeper part of the curve being the most useful for quantitation. One advantage of competitive immunoassays is that dose–response curves can be adjusted so that signal response is most sensitive over the concentration range of interest, often defined by the reference range.23 The position of the curve in relation to analyte concentration is determined by several factors, most notably the ratio of labeled reagent to analyte. This parameter was easily manipulated for competitive micromosaic immunoassays used in this study. Determination of the appropriate labeled reagent or “tracer” concentration was accomplished empirically. Analyte standards spanning the appropriate reference range were spiked with different concentrations of tracer, and the resulting signals evaluated for dose–response sensitivity. Finally, solutions containing all three standards were spiked with tracer at concentrations of 23.3 µg/mL FITC–mAb T4, 7.3 µg/mL FITC–CRP, and 17.8 µg/mL FITC–pAb 3NT. Solutions also contained 0.2 mM ANS, a molecule used to displace T4 from binding with serum proteins.24 It should be noted that the original intent of this study was to assay the unconjugated 3NT amino acid as a marker for oxidative damage.25 However, after labeling pAb-3NT with FITC, the specific antibody used in these experiments did not respond to the free amino acid in solution. FITC–pAb 3NT did respond competitively to the BSA–3NT conjugate in solution, and thus for the purpose of these experiments the conjugate was used as an analyte. This phenomenon has been previously reported in other immunoassays for 3NT.26
Competitive Immunoassay for T4, CRP, and BSA–3NT
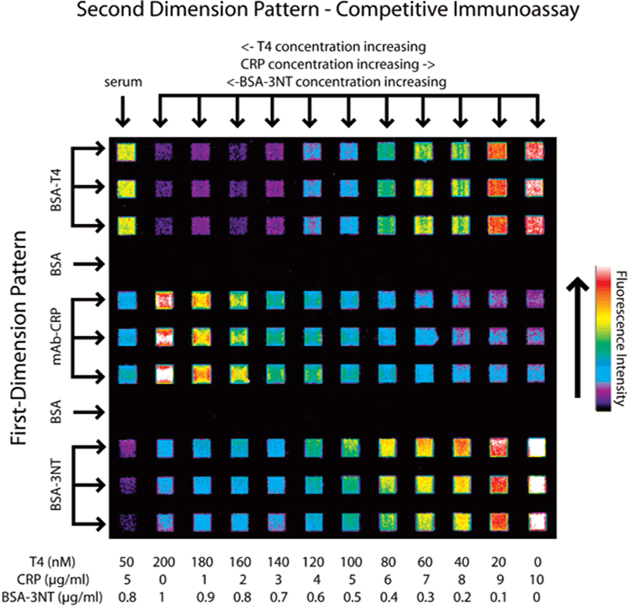
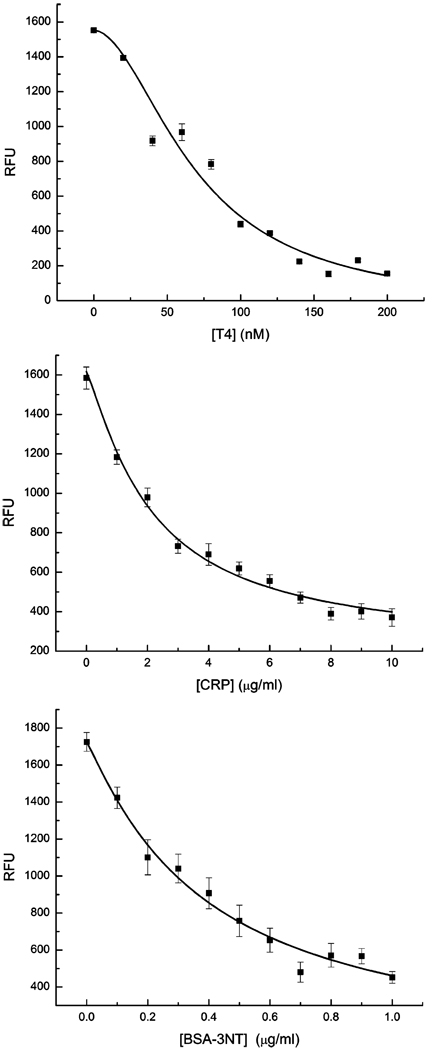
Standard buffer solutions (PBS, 45 mg/mL human serum albumin) containing each of the three analytes were prepared and spiked with the appropriate amounts of tracer and ANS. Affinity-purified human serum spiked with known values of each analyte was prepared similarly to evaluate assay applicability with true biological samples. First-dimension affinity reagent patterning was undertaken as in Figure 2, followed by second-dimension patterning of the 11 standard solutions of known concentrations and one serum sample (Figure 3). Relative fluorescent signals for each standard solution mosaic were plotted against their respective analyte concentrations, shown in Figure 4. Error bars represent signal variation between each of the three mosaic squares for each standard. Each curve was fit to a four-parameter logistic model equation:
| (1) |
where Y is the fluorescent signal, a is the signal response in the absence of analyte, d is the response at infinite analyte concentration (nonspecific binding of tracer), c is the concentration of analyte which gives a signal Y = (a + d)/2, T is the analyte concentration, and b is the absolute value of the slope of the curve when expressed in a log–logit format.23 Curves were fit using the nonlinear curve fit function in OriginPro 7 (logistic, 100 iterations). Correlation coefficients were 0.961, 0.991, and 0.982 for T4, CRP, and BSA–T4, respectively. The logistic equation curve fits were used to determine the detection limits (LOD) at both extremes of each curve. LOD at the low-concentration/high-signal end of the curve was calculated as the concentration that produced signal 2 standard deviations of the zero-analyte signal below the zero-analyte signal. At the opposite end of the curve, LOD was calculated as the concentration which produced a signal 3 times that of the nonspecific binding (parameter d in the logistic equation.) These results are listed in Table 1. Although the assay for CRP does not cover the entire clinical range of interest, 0–100 µg/mL, it is noted that dilution of samples above the upper LOD may allow for quantification on this curve.10 Currently the assay not optimized for detection at the lower reference limit of CRP (0.1 µg/mL) necessary for coronary heart disease prognosis.10 All errors were calculated as a single standard deviation of the three mosaic signals for each standard solution and analyte.
Figure 3.
Fluorescent image of the competitive immunoassay for T4, CRP, and BSA–3NT. Solutions containing each analyte were prepared with a fluorescent tracer for each analyte at a constant, empirically determined concentration. Decreasing signal with increasing analyte concentration demonstrates the competitive effect for each analyte. An affinity-purified serum sample was prepared at known concentrations of each analyte, which is analyzed in the far left column.
Figure 4.
Dose–response curves for each analyte. Each fluorescent intensity plot was constructed from fluorescence data taken from the image in Figure 3 as described in the text.
Table 1.
Detection Limits and Serum Response for the Analytes T4, CRP, and BSA–3NT
| T4 (nM) | CRP (µg/mL) | BSA-3NT (µg/mL) | |
|---|---|---|---|
| LODs | 7.7–257.2 | 0.3–4.2 | 0.03–22.4 |
| serum value | 49 ± 1.4 nM | 5.0 ± 0.7 | 2.3 ± 0.47 |
| actual value | 50 | 5 | 0.8 |
Spiked serum samples gave readings for T4 (49 ± 1.4 nM) and CRP (5.0 ± 0.7 µg/mL) that were within error of the intended standard concentrations (50 nM T4, 5 µg/mL CRP). BSA–3NT was spiked into the serum at 0.8 µg/mL but produced a signal reading 2.3 ± 0.47 µg/mL. As with CRP, a more accurate result might be obtained through dilution of the sample to a concentration producing a signal on the more sensitive portion of the dose—response curve. The difference between measured and spiked levels of BSA–3NT may be the result of systematic error and/or nonspecific cross-reactivity of the antibody with another sample component. In Figure 3, signal from the BSA–3NT mosaics appear to decrease descending vertically. This effect could be due to depletion of the antibody/immunocomplex in solution as it binds to the mosaic, combined with a slower diffusion rate. The problems associated with this particular assay, including the low reactivity with free 3NT, could be addressed by examining assay performance using different antibodies.
Calculation of Affinity Constants
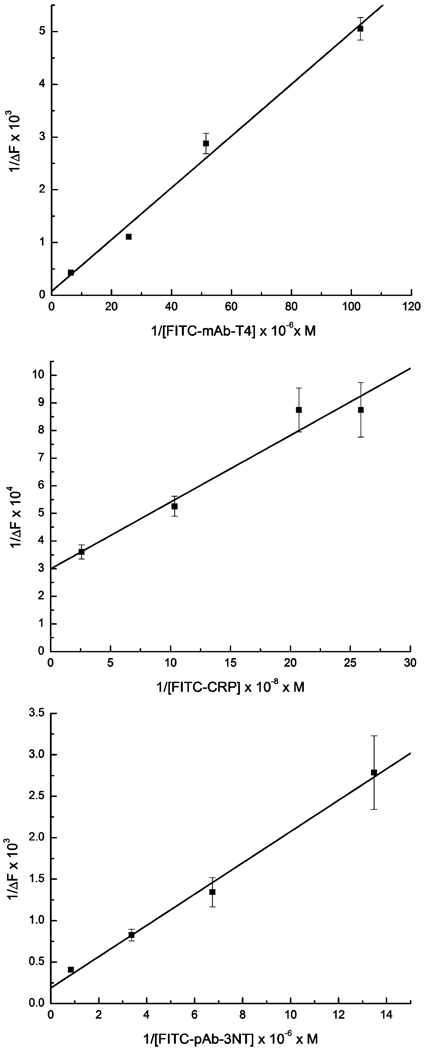
If a Langmuir-type adsorption model is assumed (concentration of analyte ≫ immobilized affinity reagent), data from Figure 2 and Figure 3 can be used to estimate the dissociation constants (KD) between each affinity pair in the system. Similar calculations have been used for SPR-based competitive immunoassays.27 These calculations are straightforward because they do not require quantification of the surface affinity reagent. Although a linear regression approach is operationally simple, error measurements are distorted; therefore, calculated constants should be used as estimates only. It is important to mention that the notation used below assumes a direct format such as that used here for CRP, although the same calculations were used for indirect format assays such as those performed for T4 and BSA–3NT.
The amount of receptor–ligand immunocomplex [RL] can be expressed as
| (2) |
where [R] denotes the concentration of free surface binding sites and [L] the ligand, with KD(L) as the dissociation constant. A mass balance for the surface receptor can be written as
| (3) |
where [RT] is the total concentration of binding sites on the surface over a given area. Combining and rearranging the two equations gives
| (4) |
The relationship of this ratio with the fluorescent signal can be written as
| (5) |
where ΔF is the fluorescent signal at a given [L] (and thus [RL]) and ΔF0max is the signal when the surface receptor binding sites are saturated with labeled ligand. After rearrangement, this becomes
| (6) |
A plot of 1/[L] versus 1/ΔF allows the calculation of KD(L) and ΔF0max from the slope and intercept. The dilutions of fluorescent reagent and the signals taken from Figure 1 were used to produce the plots in Figure 5 using eq 6. The KD(L) between the ligand and surface receptor was calculated for each pair in the three-analyte system.
Figure 5.
Plots of 1/ΔF vs 1/[L] for each antibody–antigen system shown in Figure 2. The slope and intercept for each curve can be used to estimate the dissociation constants (KD) between a tracer and its surface receptor.
During a competitive immunoassay, the labeled reagent is held at a fixed concentration while the analyte concentration varies. Under these conditions, concentration and affinity constants determine fractional binding of each competitor to the antibody. When an analyte [A] competes with labeled ligand [L] a new equilibrium expression may be written as
| (7) |
where [A] is the analyte concentration, [RA] the receptor–analyte immunocomplex, and KD(A) the dissociation constant for [RA]. A mass balance for the three-component system can be written for the surface receptor as
| (8) |
Combining eqs 2, 3, 5, and 8,we can write
| (9) |
Finally, by substituting eq 7 and rearranging, we can write
| (10) |
A plot of [A] versus 1/ΔF produces a slope from which KD(A) can be calculated, as KD(L), ΔF0max, and [L] (now constant) are known (data not shown). Dissociation constants calculated as described are presented in Table 2. Values found for these dissociation constants are typical for antibody–antigen/hapten interactions.23 This result shows that neither labeling with fluorophore nor surface immobilization significantly detracted from reagent performance. Furthermore, these results show that the competitive format is entirely compatible with the micromosaic immunoassay technique.
Table 2.
Estimated KD Values for Each Affinity Pair Assayed
| affinity pair | est KD (M) |
|---|---|
| BSA–T4 (substrate) and FITC–mAb-T4 | 6.4 × 10⁻⁷ |
| T4 and FITC–mAb-T4 | 1.0 × 10⁻⁸ |
| mAb-CRP (substrate) and FITC–CRP | 8.1 × 10⁻¹⁰ |
| mAb-CRP (substrate) and CRP | 1.6 × 10⁻¹⁰ |
| BSA–3NT (substrate) and FITC–pAb-3NT | 1.0 × 10⁻⁶ |
| BSA–3NT (solution) and FITC–pAb-3NT | 1.6 × 10⁻⁹ |
CONCLUSIONS
Previous research involving micromosaic immunoassays has utilized as many as eight independent microchannels in each dimension allowing for simultaneous detection of protein biomarkers. 3,10 This work demonstrates the first implementation of a 12-channel approach for analysis of both proteins and metabolites by competitive immunoassay. Because small molecules such as T4 are epitope-limited for antibody capture, the sandwich immunoassay format was inappropriate and competitive strategies were used. Therefore, an indirect format competitive assay has been developed to demonstrate small-molecule analysis. Addition of a direct format competitive assay for CRP indicates that the micromosaic platform can host both competitive assay formats and can be used for protein analysis as well. Complementary analysis of BSA–3NT suggests that this technology can address the demand for multianalyte analysis, particularly for clinically grouped biomarkers. Linear regression was used as a straight-forward method to estimate affinity constants; however, a more accurate result could also be obtained through nonlinear regression analysis.
ACKNOWLEDGMENT
We thank Professor David Grainger and his research group for technical advice and help with surface modification of silicon nitride. We also thank Dr. Dandy’s research group for their help and advice. This work was supported by National Institutes of Health Grant EB00726.
References
- 1.Yalow RS, Berson SA. Nature. 1959;184:1648–1649. doi: 10.1038/1841648b0. [DOI] [PubMed] [Google Scholar]
- 2.Butler JE. In: Immunoassay. Diamandis E, Christopoulos T, editors. San Diego, CA: Academic Press; 1996. [Google Scholar]
- 3.Bernard A, Michel B, Delamarche E. Anal. Chem. 2001;73:8–12. doi: 10.1021/ac0008845. [DOI] [PubMed] [Google Scholar]
- 4.Delamarche E, Bernard A, Schmid H, Michel B, Biebuyck H. Science. 1997;276:779–781. doi: 10.1126/science.276.5313.779. [DOI] [PubMed] [Google Scholar]
- 5.Whitesides GM, Ostuni E, Takayama S, Jiang XY, Ingber DE. Annu. Rev. Biomed. Eng. 2001;3:335–373. doi: 10.1146/annurev.bioeng.3.1.335. [DOI] [PubMed] [Google Scholar]
- 6.Juncker D, Schmid H, Bernard A, Caelen I, Michel B, de Rooij N, Delamarche E. J. Micromech. Microeng. 2001;11:532–541. [Google Scholar]
- 7.Delamarche E, Bernard A, Schmid H, Bietsch A, Michel B, Biebuyck H. J. Am. Chem. Soc. 1998;120:500–508. [Google Scholar]
- 8.Dandy DS, Wu P, Grainger DW. Proc. Natl. Acad. Sci. U.S.A. 2007;104:8223–8228. doi: 10.1073/pnas.0606054104. [DOI] [PMC free article] [PubMed] [Google Scholar]
- 9.Benn JA, Hu J, Hogan BJ, Fry RC, Samson LD, Thorsen T. Anal. Biochem. 2006;348:284–293. doi: 10.1016/j.ab.2005.10.033. [DOI] [PubMed] [Google Scholar]
- 10.Juncker D, Michel B, Hunziker P, Delamarche E. Biosens. Bioelectron. 2004;19:1193–1202. doi: 10.1016/j.bios.2003.11.003. [DOI] [PubMed] [Google Scholar]
- 11.Rowe CA, Tender LM, Feldstein MJ, Golden JP, Scruggs SB, MacCraith BD, Cras JJ, Ligler FS. Anal. Chem. 1999;71:3846–3852. doi: 10.1021/ac981425v. [DOI] [PubMed] [Google Scholar]
- 12.Wolf M, Zimmermann M, Delamarche E, Hunziker P. Biomed. Microdev. 2007;9:135–141. doi: 10.1007/s10544-006-9006-6. [DOI] [PubMed] [Google Scholar]
- 13.Yuan GW, Lear KL, Stephens MD, Dandy DS. Appl. Phys. Lett. 2005;87:191107. doi: 10.1063/1.2981212. [DOI] [PMC free article] [PubMed] [Google Scholar]
- 14.Gonzalez-Martinez MA, Morais S, Puchades R, Maquieira A, Abad A, Montoya A. Anal. Chem. 1997;69:2812–2818. [Google Scholar]
- 15.Wu AHB. Clin. Chim. Acta. 2006;369:119–124. doi: 10.1016/j.cca.2006.02.045. [DOI] [PubMed] [Google Scholar]
- 16.Caulum MM, Henry CS. Analyst. 2006;131:1091–1093. doi: 10.1039/b608722a. [DOI] [PubMed] [Google Scholar]
- 17.McDonald JC, Duffy DC, Anderson JR, Chiu DT, Wu HK, Schueller OJA, Whitesides GM. Electrophoresis. 2000;21:27–40. doi: 10.1002/(SICI)1522-2683(20000101)21:1<27::AID-ELPS27>3.0.CO;2-C. [DOI] [PubMed] [Google Scholar]
- 18.Vickers JA, Henry CS. Electrophoresis. 2005;26:4641–4647. doi: 10.1002/elps.200500508. [DOI] [PubMed] [Google Scholar]
- 19.Lee JN, Park C, Whitesides GM. Anal. Chem. 2003;75:6544–6554. doi: 10.1021/ac0346712. [DOI] [PubMed] [Google Scholar]
- 20.Englebienne P. Immune and Receptor Assays in Theory and Practice. Boca Raton, FL: CRC Press; 2000. [Google Scholar]
- 21.Smith PK, Krohn RI, Hermanson GT, Mallia AK, Gartner FH, Provenzano MD, Fujimoto EK, Goeke NM, Olson BJ, Klenk DC. Anal. Biochem. 1985;150:76–85. doi: 10.1016/0003-2697(85)90442-7. [DOI] [PubMed] [Google Scholar]
- 22.Wu P, Hogrebe P, Grainger DW. Biosens. Bioelectron. 2006;21:1252–1263. doi: 10.1016/j.bios.2005.05.010. [DOI] [PubMed] [Google Scholar]
- 23.Diamandis E, Christopoulos TK. Immunoassay. San Diego, CA: Academic Press; 1996. pp. 45–46. [Google Scholar]
- 24.Matsuda M, Sakata S, Komaki T, Nakamura S, Kojima N, Takuno H, Miura K. Clin. Chim. Acta. 1989;185:139–146. doi: 10.1016/0009-8981(89)90036-3. [DOI] [PubMed] [Google Scholar]
- 25.Schwemmer M, Fink B, Kockerbauer R, Bassenge E. Clin. Chim. Acta. 2000;297:207–216. doi: 10.1016/s0009-8981(00)00247-3. [DOI] [PubMed] [Google Scholar]
- 26.Khan J, Brennan DM, Bradley N, Gao BR, Bruckdorfer R, Jacobs M. Biochem. J. 1998;330:795–801. doi: 10.1042/bj3300795. [DOI] [PMC free article] [PubMed] [Google Scholar]
- 27.Sakai G, Ogata K, Uda T, Miura N, Yamazoe N. Sens. Actuators, B. 1998;49:5–12. [Google Scholar]


