Abstract
Mutations in BEST1, encoding bestrophin-1 (Best1), cause Best vitelliform macular dystrophy (BVMD), a dominantly inherited macular degeneration characterized by a diminished electrooculogram light peak (LP), lipofuscin in retinal pigment epithelial cells (RPE), and fluid- and debris-filled retinal detachments. To understand the pathogenesis of BVMD we generated knock-in mice carrying the BVMD-causing mutation W93C in Best1. Both Best1+/W93Cand Best1W93C/W93C mice had normal ERG a- and b-waves, but exhibited an altered LP luminance response reminiscent of that observed in BVMD patients. Morphological analysis identified fluid- and debris-filled retinal detachments in mice as young as 6 months of age. By 18–24 months of age Best1+/W93Cand Best1W93C/W93C mice exhibited enhanced accumulation of lipofuscin in the RPE, and a significant deposition of debris composed of unphagocytosed photoreceptor outer segments and lipofuscin granules in the subretinal space. Although Best1 is thought to function as a Ca2+-activated Cl− channel, RPE cells from Best1W93C mice exhibited normal Cl− conductances. We have previously shown that Best1−/− mice exhibit increased [Ca2+]i in response to ATP stimulation. However, ATP-stimulated changes in [Ca2+]i in RPE cells from Best1+/W93C and Best1W93C/W93C mice were suppressed relative to Best1+/+ littermates. Based on these data we conclude that mice carrying the Best1W93C mutation are a valid model for BVMD. Furthermore, these data suggest that BVMD is not because of Best1 deficiency, as the phenotypes of Best1+/W93C and Best1W93C/W93C mice are distinct from that of Best1−/− mice with regard to lipofuscin accumulation, and changes in the LP and ATP Ca2+ responses.
INTRODUCTION
Members of the bestrophin family of proteins are thought to function as Ca2+-activated Cl− channels (CaCCs) (1,2). Mutations in the gene BEST1 cause Best vitelliform macular dystrophy (BVMD; 3,4), an autosomal dominant form of macular degeneration clinically characterized by fluid- and debris-filled retinal detachments, accumulation of lipofuscin in the retinal pigment epithelium (RPE), and a reduction in the electrooculogram (EOG) light peak (LP) accompanied by a normal clinical electroretinogram (ERG) (1,5). The LP is generated by a Ca2+-dependent Cl− conductance across the basal membrane of the RPE (6–8), where we have shown Best1, an integral membrane protein, to be localized (9). These observations led to the hypothesis that Best1 and other bestrophins are CaCCs (10). Indeed, there is a substantial body of data in which heterologous expression of bestrophins from a diverse array of organisms results in Ca2+-dependent anion conductances (reviewed in (2)). In humans, there are four members of the bestrophin family, and bestrophins have been identified in epithelial, neuronal and muscle tissues (1,2). As such, the bestrophins have received a great deal of attention as potential CaCCs.
The observation that bestrophins can function as CaCCs was accompanied by the finding that mutations causing BVMD dominantly inhibit bestrophin Cl− conductances resulting in the hypothesis that BVMD results from a loss of CaCC activity (10). In recent years mutations in BEST1 have been attributed to four additional retinal degenerative diseases in man; adult onset vitelliform maculopathy (AVMD; 11–13), autosomal dominant vitreoretinal choroidopathy (ADVIRC; 14), autosomal recessive bestrophinopathy (ARB; 15) and retinitis pigmentosa (RP; 16). Similar to BVMD, AVMD and ADVIRC exhibit dominant inheritance. ARB is a recessive disease, and RP was found in both dominant and recessive forms. AVMD is most similar to BVMD and the disorders are distinguished by the EOG LP, which is not impaired in AVMD (17). ARB, is thought to be owing to a ‘null’ mutation, resulting in the absence of functional Best1 (15). It is difficult to reconcile this clinical complexity with a disease model in which BVMD simply results from a loss of CaCC function. Furthermore, tissues from mice in which Best1 or Best2 are disrupted do not exhibit a deficit in CaCC activity [(7,18) and our unpublished observations], although bestrophins may be required to facilitate those conductances (19). Best1−/− mice exhibit an enhanced LP to low luminance stimuli and a greater release of [Ca2+]i in response to stimulation of their RPE with extracellular ATP than is observed in RPE cells from wild-type (WT) littermates (7). Best2−/− mice exhibit a decreased intraocular pressure resulting from unusual changes in aqueous humor dynamics that are not simply explained by the loss of a Cl− conductance (20,21).
To clarify the functional role of Best1 in the RPE and to better understand the pathogenesis of BVMD, we generated knock-in mice carrying one or two copies of the BVMD-causing mutation W93C in Best1. Our data show that these mice exhibit the major symptoms of BVMD, an abnormal LP luminance-response function, accumulation of lipofuscin in RPE cells, and the formation of fluid- and debris-filled retinal detachments. Whole-cell Cl− conductances recorded from the RPE of these mice do not differ from those of their WT littermates. However, and in contrast to Best1−/− mice, RPE explants from these mice fail to respond with an elevation in [Ca2+]i when stimulated by extracellular ATP. These data confirm that BVMD is not the result of Best1 deficiency, but rather BVMD must result from Best1 dysfunction. These data also suggest that Best1 plays an important role in the regulation of Ca2+ signaling.
RESULTS
Generation of knock-in mice carrying the W93C mutation in mBest1
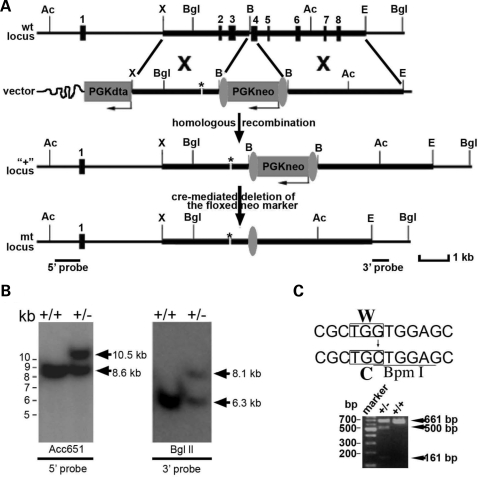
To create a model of BVMD, we chose to generate a knock-in mice carrying the W93C mutation in the endogenous Best1 loci (Fig. 1). This mutation was chosen because a multi-generational family from Sweden carrying this mutation has been exceptionally well characterized with regard to disease progression and histopathology (22–24). In the mouse model the mutant allele replaces one or both of the endogenous WT alleles such that heterozygotes (Best1+/W93C) carry one mutant and one WT allele, and homozygotes (Best1W93C/W93C) carry two mutant alleles and no WT alleles. Consistent with the phenotype of BVMD patients, both Best1+/W93C and Best1W93C/W93C mice were born with an expected Mendelian frequency. Their outward appearance, lifespan and reproduction were similar to those of their Best1+/+ littermates. Consistent with human bestrophinopathies, no obvious abnormalities outside of the eye were noted on autopsy of animals up to 32 months of age.
Figure 1.
Generation of Best1 knock-in mice containing the W93C mutation. Schematic diagram (A) of the wild-type (wt) locus, targeting vector for the mutation, and mutant loci before (‘ + ’) and after (mt) the cre-mediated deletion of the floxed neor marker. Thick lines represent genomic DNA fragments used for constructing the targeting vector 5′ and 3′ arms. Restriction enzyme sites: Ac, Acc65I; X, XbaI; Bgl, BglII; B, BamHI; E, EcoRI are indicated. Numbered solid boxes depict Best1 exons. The neor and DTA gene expression cassettes are indicated by the labeled grey boxes. Vertical grey ovals indicate loxP sequences. Asterisk (*) marks the location of the W93C mutation. Homologous recombination between the wt locus and the targeting vector was confirmed using genomic Southern blot (B) analysis of wt and heterozygous ES cell DNA was performed with the external 5′ and 3′ probes indicated in (A). For the 5′ probe, the Acc65I digested wt fragment is 8.6 kb, and the mutant (‘ + ’) fragment is 10.5 kb. For the 3′ probe, BglII digestion yields a wt fragment of 6.3 kb and a mutant fragment of 8.1 kb. Nucleotide changes generating the W93C mutation and a BpmI restriction site (C) permit analysis of wt and heterozygous offspring tail genomic DNA by polymerase chain reaction resulting in a 661 bp fragment in wt and both 500 bp and a 161 bp fragments from the mutant (‘ + ’) locus.
Altered LP luminance response in Best1W93C knock-in mice
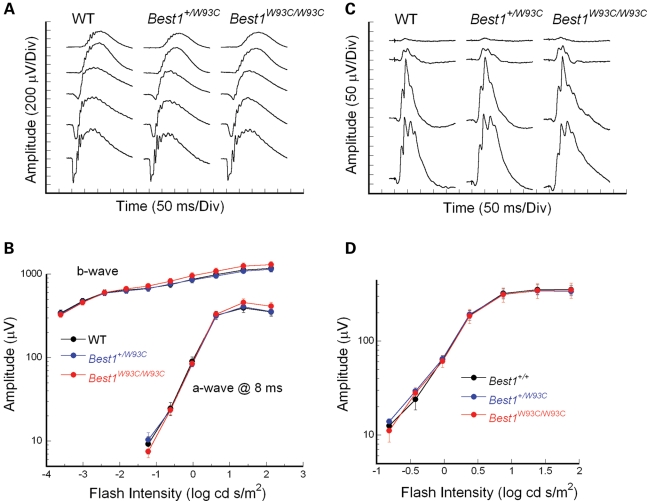
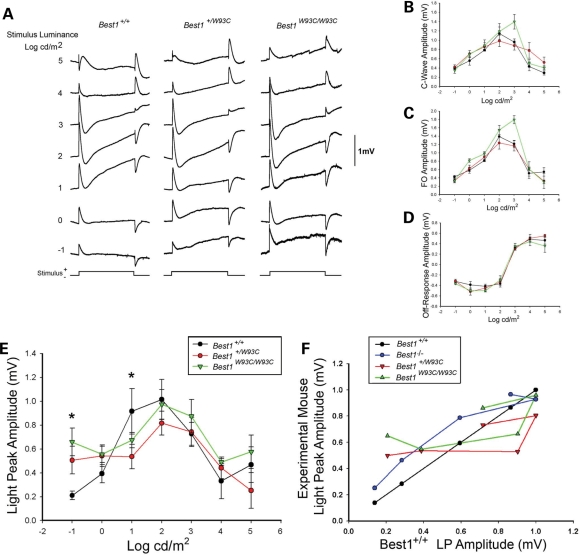
BVMD is characterized by a diminished EOG LP with a normal ERG. We analyzed both rod and cone-driven ERGs in young (<6 month old) mice and found no differences among genotypes (Fig. 2). However, consistent with the LP deficits in BVMD patients, dc-ERG recordings revealed significant differences in the LP component of W93C mice. Compared with Best1+/+ littermates, LP responses of Best1+/W93C and Best1W93C/W93C mice were enhanced at low stimulus intensities, and reduced in the middle of the intensity range (Fig. 3A and E; Table 1). As a result, in W93C mice there was little modulation of LP amplitude between −1.0 and +1.0 log cd/m2, whereas the LP in WT animals exhibits a marked increase. In this intensity range, the LP of Best1+/W93C and Best1W93C/W93C mice also differ from Best1−/− mice (7), whose LP is also consistently greater than that of Best1+/+ mice but is modulated by stimulus intensity (Fig. 3E and F). A plot of the LPs from Best1W93C mutant mice against those of Best1+/+ littermates (Fig. 3F) demonstrates a clear difference in the LP luminance response function between knock-in and knock-out animals. Specifically, both Best1+/W93C and Best1W93C/W93C mice exhibited intensity-dependent reductions and enhancements of the LP, whereas the only change noted in Best1−/− mice was an enhancement at low stimulus intensities. Analysis of the LP luminance response functions using ANOVA confirms significant differences between genotypes (P < 0.001). We conclude that Best1+/W93C and Best1W93C/W93C mice reproduce the sole fully penetrant symptom of BVMD and that the diminished LP in human BVMD patients, at least in early phases of the disease, is most likely owing to a shift in the luminance-response function, a feature of the EOG that is not routinely examined (25). The other major components of the dc-ERG were unaffected with the exception that Best1W93C/W93C mice had a significant increase in c-wave and fast oscillation amplitude at a single stimulus intensity (3 log cd/m2; Fig. 3A–D).
Figure 2.
Electroretinography. Flash ERGs obtained from representative WT, Best1+/W93C and Best1W93C/W93C mice to strobe flash stimuli presented to the dark-adapted eye (A) or superimposed upon a steady adapting field (C). Intensity-response functions for the major ERG components are plotted for dark-adapted (B) and light-adapted (D) stimulus conditions. Data points indicate the average (±SEM) for seven to eight mice.
Figure 3.
RPE-generated ERG responses. Dc-ERGs were recorded from Best1+/+, +/W93C or W93C/W93C littermates in response to a 7-min light stimulus varying over a 6 log range. Grand average waveforms for each genotype (A) reflect clear differences in the LP at intensities of −1 to +1 log cd/m2. This difference is most obvious at a stimulus luminance of 1 log cd/m2, a stimulus intensity similar to that used in human EOG testing. Stimulus response functions for the c-wave (B), FO (C) and off response (D) indicate that these functions are unchanged in Best1+/W93C mice, but do demonstrate a larger c-wave and FO amplitude at a single stimulus luminance for Best1W93C/W93C mice. Significant differences were observed in the LP luminance response (E) with a significantly (P < 0.02) enhanced response in Best1+/W93C and Best1W93C/W93C mice at −1 log cd/m2 and a significantly (P < 0.05) diminished response at 1 log cd/m2. LPs normalized by plotting the amplitude of the WT response on the X-axis and experimental mouse on the Y-axis were used to compare response functions from Best1W93C mice and Best1−/− mice (F). Note that the Best1+/W93C and Best1W93C/W93C responses were similar, but substantially different from the Best1−/− responses.
Table 1.
LP amplitudes by genotype
| Luminance (log cd/m2) | Best1+/+ | n | Best1+/W93C | n | Best1W93C/W93C | n |
|---|---|---|---|---|---|---|
| Mean ± SE (mV) | Mean ± SE (mV) | Mean ± SE (mV) | ||||
| −1 | 0.21 ± 0.04 | 6 | 0.51 ± 0.12 | 7 | 0.66 ± 0.12 | 6 |
| 0 | 0.39 ± 0.08 | 8 | 0.54 ± 0.09 | 8 | 0.56 ± 0.07 | 12 |
| 1 | 0.92 ± 0.19 | 6 | 0.54 ± 0.10 | 9 | 0.67 ± 0.07 | 7 |
| 2 | 1.02 ± 0.17 | 6 | 0.82 ± 0.10 | 8 | 0.97 ± 0.12 | 6 |
| 3 | 0.73 ± 0.10 | 11 | 0.74 ± 0.12 | 13 | 0.87 ± 0.14 | 9 |
| 4 | 0.33 ± 0.15 | 4 | 0.44 ± 0.09 | 5 | 0.49 ± 0.03 | 6 |
| 5 | 0.47 ± 0.15 | 3 | 0.25 ± 0.15 | 3 | 0.57 ± 0.14 | 3 |
Morphological characteristics of Best1W93C mice
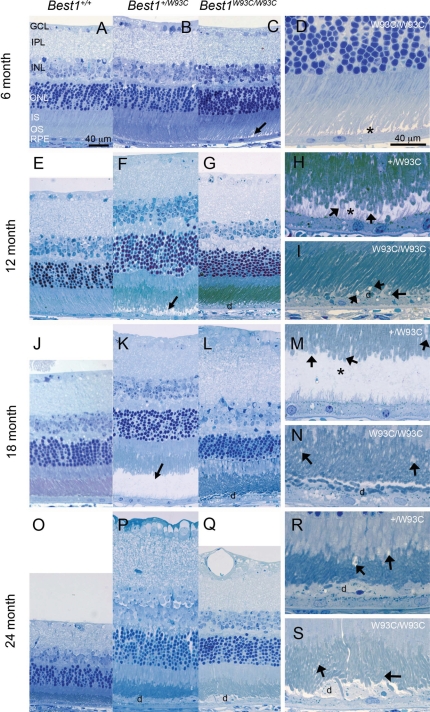
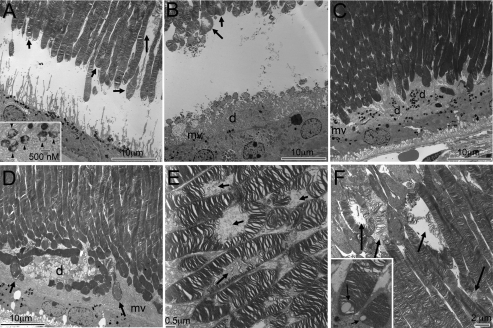
To determine whether Best1W93C mice exhibit abnormalities in the eye, we performed fundoscopy and histological analysis on animals ranging in age from 2 to 32 months. Well-demarcated retinal detachments were observed in approximately 40 per cent of Best1+/W93C and Best1W93C/W93C mice aged 12 months and older (n ≥ 5 mice of each genotype at 6, 12, 18 and 24 months) and appeared to have resolved by 2 years of age regardless of genotype. These detachments were located in the central region of the eye temporal to the optic nerve head and varied with the largest observed being approximately 2–3 disc diameters in size. Examination of eyes by light (Fig. 4) and electron (Fig. 5) microscopy confirmed the presence of localized serous retinal detachments in Best1+/W93C and Best1W93C/W93C eyes as early as 6 months of age (Fig. 4A–D, though detachments were not typically observed until 12–18 months of age (Figs 4E–N and 5A and B). In many mice the retina appeared to have been detached and re-attached, with RPE microvilli stacked in ‘piles’ between the RPE and outer segments (OS) of photoreceptors (Figs 4N, P–S and 5C and D). Often these piles contained additional debris including shed OS and lipofuscin granules (Figs 4G, I, K–N, P–S and 5B–D) forming a debris zone between the RPE and OS. Interestingly, both IS and OS appeared longer in Best1+/W93C and Best1W93C/W93C mice. We also often noted small vacuoles in the OS and to a lesser degree inner segments (IS) of photoreceptors in Best1+/W93C and Best1W93C/W93C mice (Fig. 4F–I, K–N and P–S). A detailed examination of OS in Best1W93C mice by electron microscopy revealed that what appeared to be vacuoles were actually disrupted discs (Fig. 5E–F). In addition, we noted the accumulation of an amorphous material at the tips of some OS and occasionally the accumulation of what appeared to be lipid droplets. Inner segment vacuoles appeared to correlate with disruption of mitochondria in the oldest mice (2 years and older, not shown).
Figure 4.
Development and progression of serous retinal detachments and debris-filled apical deposits in Best1W93C knock-in mice. Representative micrographs of Toluidine blue-stained thick sections from mice aged 6 (A–D), 12 (E–I), 18 (J–N) or 24 (O–S) months of age as indicated in the left margin. Genotypes for A–C, E–G, J–L and O–Q are indicated at the top of the figure. Panels D, H, I, M, N, R and S are identical to panels C, F, G, K, L, P and Q, respectively, but were photographed at a higher magnification. Their genotypes are indicated in the upper right hand corner of the panel. Serous detachments (arrows in C, F and K, asterisks in D, H and M) were noted as early as 6 months of age. Following detachment, we often found piles of RPE microvilli laying horizontal and containing debris (d) including OS. Disruption of OS was noted in many animals as early as 12 months of age (arrows in H, I, M, N, R and S).
Figure 5.
Transmission electron micrographs of serous detachments in a 12 month (A) and 18 month old (B) Best1+/W93C mice. Many lipofuscin granules have accumulated in the RPE even at 12 months (A). The inset in (A) shows lipofuscin granules at a higher magnification. Note the debris (d) entangled within the RPE microvilli (mv) in (B). In 2-year-old mice (C–F), the retina appeared to have re-attached, but regions of debris (d) containing OS and lipofuscin granules entangled in RPE microvilli were frequent findings. Photoreceptor OS, in mice at all ages exhibited disrupted disks (arrows in A, B, E and F) or unusual patterns of membrane folding/wrapping (arrows in D). Occasionally lipid droplets were observed at the tips of some OS (inset, F).
BVMD is characterized by the accumulation of lipofuscin granules in the RPE (7,26–30). Examination of unfixed cryosections revealed an apparent increase in autofluorescence in the RPE of Best1+/W93C and Best1W93C/W93C mice by 18 months of age (Fig. 6). Electron microscopy revealed that the number of lipofuscin granules in 2-year-old Best1W93C mice was indeed increased (Fig. 6A–C). Counts of lipofuscin granules were made in randomly chosen 4400× fields. At 23–26 months of age, Best1+/+ mice had accumulated 17 ± 3 granules/field (mean ± SD), while significantly (P < 0.05) more lipofuscin granules/field were observed in Best1+/W93C (53 ± 5) and Best1W93C/W93C (42 ± 9) mice (all measures are from seven fields analyzed in each of seven mice).
Figure 6.
Photomicrographs of RPE autofluorescence in unfixed cryosections of Best1+/+, Best1+/W93C and Best1W93C/W93C. The apparent increase in autofluorescence in (B) and (C) compared to (A) correlates with increased accumulation of lipofuscin in the RPE of Best1W93C mice.
Normal Cl− conductances in RPE from Best1W93C knock-in mice
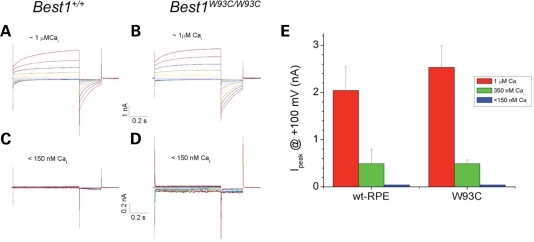
Since Best1 and other bestrophins have been suggested to function as CaCCs (1,2,10), we examined whole-cell Cl− conductances in RPE cells isolated from Best1+/+ and Best1W93C/W93C mice. Similar to our previous findings in Best1−/− mice (7), no differences were observed between genotypes regardless of the concentration of Ca2+ in the patch pipette (Fig. 7).
Figure 7.
Whole-cell Cl− currents. Single RPE cells were isolated from Best1+/+ (A, C) or Best1W93C/W93C (B, D) littermates. Voltage-dependent Cl− conductances were recorded with 750 ms voltage steps from −100 to +100 mV (A–D) using whole-cell patch clamp in pipette solutions containing a range of Ca2+ concentrations from 20 nm to 1 µm. Representative current traces activated with 1 µm (A, B) or <150 nm (C, D) Ca2+ are shown. Peak currents (Ipeak) recorded at +100 mV were determined (average ± SD, n > 5 cells) for both genotypes at varied Ca2+ concentrations (E). Data are expressed as mean ± SEM. Statistical differences between means was evaluated using two-tailed t-test. Significance was assumed at P < 0.05. No significant differences in Ipeak were observed between Best1+/+ and Best1W93C/W93C mice.
Best1W93C suppresses ATP-stimulated Ca2+ signaling
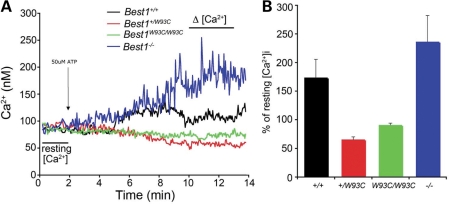
We and others have shown that Best1 interacts with VDCCs (7,15,31,32) and that the increase in [Ca2+]i following ATP stimulation in RPE cells from Best1−/− mice exceeds that of Best1+/+ mice (7; Fig. 8). We examined the effect of extracellular ATP on [Ca2+]i in Best1+/W93C, Best1W93C/W93C, Best1+/+ and Best1−/− mice. In agreement with prior observations (7), the ATP-induced increase in [Ca2+]i in Best1−/− RPE exceeds that of Best1+/+ RPE (Fig. 8). In comparison, [Ca2+]i in Best1+/W93C and Best1W93C/W93C mice did not change significantly with response to 50 µm extracellular ATP (Fig. 8).
Figure 8.
Effect of Best1 and Best1W93C on [Ca2+]i in RPE cells following stimulation with extracellular ATP. RPE cells in mouse eyecup preparations from Best1W93C and Best1−/− mice were loaded with the Ca2+ indicator dye Fura-2 and their response to 50 µm ATP recorded (A). The percent of resting [Ca2+]i (B) for each genotype was determined from the difference between the average [Ca2+]i measured in the regions marked resting [Ca2+] and Δ[Ca2+] in (A). Data in (B) are mean ± SEM from more than 7 experiments using ≥10 cells/experiment.
DISCUSSION
BVMD is the second most common form of inherited macular degeneration following Stargardt's disease (1). Here, we have described a mouse line that carries the mutation W93C in Best1, which is the same mutation found in a large well-characterized family of Swedish origin (22–24). The mice reconstitute several of the hallmark symptoms of BVMD. These are a deficit in the LP (Fig. 3), serous/debris-filled retinal detachments (Figs 4 and 5), and accumulation of lipofuscin in RPE cells (Fig. 6). These similarities indicate that Best1W93C mice constitute a viable model of BVMD and can be used to better understand this retinal disorder. We also noted that photoreceptor OS are disrupted in these mice exhibiting vacuoles that on closer inspection were disrupted disks (Fig. 5E and F), and that OS were often found within the debris fields (Figs 3 G, I, L, N, P–S and 5B–D). These morphological findings suggest that the phagocytosis of shed OS by RPE cells may be partially impaired in BVMD.
Prior studies have suggested that Best1 is a CaCC and that BVMD results from a dominant negative inhibition of Best1 Cl− channel activity (1,2,10). Though consistent with many in vitro studies in which bestrophin-associated Cl− conductances were observed following transfection with bestrophin cDNA (reviewed in (2)), this hypothesis was not supported by data obtained from Best1−/− and Best2−/− mice (7,20), and does not account for AVMD, ADVIRC, RP and ARB, other diseases caused by mutations in Best1. In particular, a deficit in CaCC activity has not been identified in either Best1−/− or Best2−/− mice (7,18). A recent study (19) reports that CaCC activity in regenerating peripheral nerve was dependent on expression of Best1 or Best3, but notes that expression of Best1 or Best3 alone was not sufficient to produce a CaCC current. Similarly, we did not observe a deficit in whole cell Cl− conductances in the RPE of Best1W93C/W93C mice (Fig. 7).
Although it has been notoriously difficult to detect mBest1 Cl− currents (2), mBest1 currents have been observed in vitro (33), and several recent studies have examined putative mBest1 Cl− currents in tissue following siRNA knock-down of mBest1 (19,34,35). Based on our findings with the Best1W93C mouse (Fig. 3), and the Best1−/− mouse (7), if Best1 functions in the RPE as a Cl− channel, that function is minor and does not contribute substantially to the LP. How then does Best1 affect the LP?
The LP is stimulated by a ‘LP substance’ secreted by photoreceptors (8). The identity of the LP substance is currently unknown, but ATP is a leading candidate (8). We have previously shown that the LP requires VDCCs, and that the luminance response of the LP is impaired in mice lacking VDCC subunits (6,7,32). Furthermore, Best1 interacts with VDCCs physically and/or functionally and Best1W93C can cause a substantial delay in the activation and inactivation kinetics of VDCCs (15,31,32). Stimulation of RPE cells from Best1−/− mice with extracellular ATP results in an increase in [Ca2+]i that is significantly greater (P < 0.05) than that of Best1+/+ littermates (Fig. 8A and B) (7). As shown in Figure 8A and B, Best1W93C mice exhibit the opposite effect. For these mice, extracellular ATP stimulates no increase in [Ca2+]i, but instead appears to cause a significant (P < 0.05) decrease in [Ca2+]i. Based on this finding it is reasonable to conclude that the diminished LP characteristic of BVMD results from the constitutive suppression of Ca2+ signaling owing to the W93C mutation. Most likely this results from the alteration of VDCC kinetics owing to the W93C mutation in Best1.
In summary, we have generated a mouse model that develops many of the important features of the BVMD phenotype. Based on these data we propose that Best1 is a protein with at least two functions. Best1 appears to function as an anion channel and an antagonist of VDCCs. The W93C mutation has been demonstrated in multiple studies to exert a dominant negative effect on Best1 anion channel activity (2). It has become clear, however, that any Cl− conductance associated with Best1 in mouse is not critical to the health of the RPE, as the absence of Best1 does not induce a BVMD phenotype. Instead, the differences in Ca2+ signaling observed in Best1−/− mice and Best1W93C mice suggest that it is the suppression of Ca2+ signaling that may underlie the pathogenesis of BVMD. We propose that Best1 also acts to suppress Ca2+ signaling through its known interactions with VDCCs (15,31,32), and that the W93C mutation serves to activate Best1 constitutively in this regard. This raises the possibility that the effects of Best1 on VDCCs are regulated by Best1 channel activity. If so, channel closing would promote the suppressive effect of Best1 on Ca2+ signaling and channel opening would diminish the suppressive effect of Best1 on Ca2+ signaling. Future studies will address the relationship between Best1 channel activity, its VDCC regulatory function, and its effects on ATP-stimulated Ca2+ signaling with regard to RPE physiology and disease pathogenesis.
MATERIALS AND METHODS
All experiments involving mice were carried out with the ethical approval of the Institutional Animal Care and Use Committees of the University of Arizona and the Cleveland Clinic Foundation.
Generation of Best1 knock-in mice carrying the W93C mutation
Best1+/W93C and Best1W93C/W93C mice carrying the W93C mutation in Best1 were generated as described in the legend for Figure 1 using the same backbone vector, PGKneolox2DTA, used previously to construct the Best1 knock-out targeting vector (7). A 7 kb XbaI–EcoRI fragment from intron I to VIII was used as the homology sequence in the vector construction. The neor gene expression cassette floxed by two direct loxP sequences was inserted in inverse orientation with respect to the endogenous Best1gene at a BamHI site so the floxed cassette was introduced into intronic sequence. The 3 kb XbaI–BamHI fragment constitutes the 5′ arm, and the 4 kb BamHI–EcoRI fragment constitutes the 3′ arm (Fig. 1A). The arm–vector junction sequences were confirmed by sequencing. To generate the targeting vector for introducing the W93C mutation, a 31-mer primer and its complimentary anti-sense primer containing one nucleotide change (G to C) were used: 5′-GGTGGTGAGCCGCTGCTGGAGCCAGTACGAG-3′. The changed nucleotide is shown in bold letter. The nucleotide change also created a new restriction site BpmI, which provides a means to distinguish the mutant and WT loci in the subsequent verification steps (Fig. 1). The mutation site was verified by sequencing. The targeting construct was linearized using a unique SacI restriction site and electroporated into 129 Sv/J ES cells (Cell and Molecular Technologies, Phillipsburg, NJ, USA). Cells were injected into C57BL/6 blastocysts, yielding three germline-transmitting chimeras that were crossed with transgenic Balb/c females expressing Cre-recombinase.
The generation of Best−/− mice has been described (7).
Electroretinography
ERGs were recorded in two recording sessions. To measure ERG components generated by the RPE, responses were recorded from the corneal surface of the left eye in response to 7-min duration stimuli presented to the dark-adapted eye, as described in detail elsewhere (6,7,36). To measure ERG components generated by the outer layers of the neural retina, responses were recorded from the corneal surface of the left eye in response to strobe flash stimuli presented to the dark- or light-adapted eye, as described in detail elsewhere (37). Differences in ERG luminance responses were compared using ANOVA. Differences occurring at specific stimulus luminances were evaluated using Student's t-test.
Light and electron microscopy
Mice were sacrificed by CO2 asphyxiation and their eyes enucleated and fixed in half-strength Karnovsky's fixative (2.5% glutaraldehyde and 2% paraformaldehyde in 0.1 m cacodylate buffer, pH 7.2) for two nights at 4°C, after which they were transferred to 0.1 m cacodylate buffer (pH 7.2). Anterior segments were removed, the tissues post-fixed in 1% osmium tetroxide, and then dehydrated in a graded series of alcohols. Following embedding in Spurr's resin, thick sections (0.5 µm) and thin sections (60 nm) were cut on a Reichert Ultracut microtome. Thick sections were stained with Toluidine blue and inspected using a Nikon E-600 microscope and photographed using a color charge-coupled device (CCD) camera. Thin sections were stained with uranyl acetate and lead citrate and inspected using a FEI CM12 (Philips Electronics, Mahwah, NJ, USA) transmission electron microscope and photographed using a MACROFIRE AMT542 (Optronics, Goleta, CA, USA) camera.
Electrophysiological recordings
Mice were euthanized via CO2 asphyxiation. The eyes were enucleated and RPE cells were dissected from Best1W93C/W93C mutant mice and WT littermate controls. Single RPE cells were isolated with 30-min treatment of papain (4 U/ml, Sigma) and plated in DMEM (Invitrogen) supplemented with 10% fetal bovine serum and penicillin (200 U/ml)–streptomycin (200 mg/ml). Studies were performed within 24 h after the acute isolation. RPE cells were recorded using a conventional patch-clamp technique and the amplifier (EPC-7, HEKA). Fire-polished borosilicate glass patch pipettes were 3–5 MΩ. Experiments were conducted at room temperature (20–24°C). Since the liquid junction potentials were small (<2 mV), no correction was made. The standard pipette solution contained (mm): 146 CsCl, 2 MgCl2, 5 (Ca2+)–EGTA, 10 HEPES, 10 sucrose, pH 7.3, adjusted with NMDG. Ca2+–EGTA was replaced with EGTA to make a ‘0’ Ca2+ pipette solution. The calculated Ca2+ concentrations were approximately 1 mm in high Ca2+ solution and <20 nm in ‘0’ Ca2+ solution, and confirmed by fura-2 (Molecular Probes) measurements using an LS-50B luminescence spectrophotometer (Perkin-Elmer). The standard extracellular solution contained (mm): 140 NaCl, 5 KCl, 2 CaCl2, 1 MgCl2, 15 glucose, 10 HEPES, pH 7.4 with NaOH. This combination of intracellular and extracellular solutions set Erev for Cl− currents to zero, while cation currents carried by Na+ or Cs+ had very positive or negative Erev, respectively. Osmolarity was adjusted with sucrose to 303 mOsm for all solutions.
Ca2+ imaging
Mice were euthanized via CO2 asphyxiation. The eyes were enucleated and placed in a dish with Hanks' balanced salt solution (Sigma, USA). Using a dissecting microscope any extra-ocular tissue was removed, the anterior portion of the eye dissected away, and the lens and retina then removed. The remaining eye cup containing the RPE was then butterfly cut so it could be laid flat for imaging. The eye cup was incubated at 37°C for approximately 1 h in chee's essential medium with 1% fetal bovine serum prior to loading with the Ca2+ indicator dye FURA-2 AM. Tissues were then secured in a perfusion chamber on the stage of a Nikon TE200 microscope with a Xenon light source. The chamber was continuously perfused with Ringers' solution containing in (mm): 113.4 NaCl, 5 KCl, 5.6 glucose, 0.8 MgCl2, 2 glutathione, 1.8 CaCl2 and 26.2 NaHCO3, pH 7.4, bubbled with 5% CO2/95% air and warmed to 37°C using an in-line heater. FURA-2 AM fluorescence was excited sequentially with 340 nm and 380 nm light and acquired with a 515/70 nm band pass filter and 40× air or oil objective using a Cascade 512b cooled CCD camera (Photometrics, USA). Data were collected on a cell-by-cell basis every 5 s and analyzed using MetaFluor Software (Molecular Devices, USA) and Excel 2004. After the cells had maintained a stable baseline for at least 3 min, 50 µm ATP was added to the Ringer's solution. Following each experiment, [Ca2+]i was determined from the ratios of the intensity of emissions at 340 nm/380 nm for each individual cell in a field. Absolute values of [Ca2+]i were estimated as before (7) according to Grynkiewicz et al. (38) using bath solution with 10 µm ionomycin to saturate Fura-2 with Ca2+ and Ca2+-free bath solution with 10 µm ionomycin to deplete Fura-2 from Ca2+. Resting [Ca2+]i was determined from the average [Ca2+]i of all cells in a field recorded for 3 min prior to the addition of a stimulus. The percent change in [Ca2+]i was determined by multiplying with 100; the average [Ca2+]i of all cells in a field recorded 7–10 min after addition of ATP, divided by the resting [Ca2+]i determined for the same field. Differences in the percent change in [Ca2+]i were analyzed using Student's t-test.
FUNDING
Work in the author's laboratories is funded by grants from the NIH (EY13160 to A.D.M., EY13847 to L.Y.M., EY14465 to N.S.P., EY014852 and GM60448 to H.C.H.), the Veterans Administration (N.S.P.), the Macular Vision Research Foundation (A.D.M.), Hope for Vision (N.S.P.), the American Health Assistance Foundation (A.D.M. and N.S.P.) and a Career Development Award (L.Y.M.) and unrestricted grants to the Department of Ophthalmology and Vision Science at the University of Arizona, and the Department of Ophthalmology at the Cleveland Clinic College of Medicine of Case Western Reserve University from Research to Prevent Blindness.
ACKNOWLEDGEMENTS
The authors are indebted to Precious McLaughlin and John Yocom for excellent technical assistance.
Conflict of Interest statement. None declared.
REFERENCES
- 1.Marmorstein A.D., Cross H.E., Peachey N.S. Functional roles of bestrophins in ocular epithelia. Prog. Ret. Eye Res. 2009;28:206–226. doi: 10.1016/j.preteyeres.2009.04.004. [DOI] [PMC free article] [PubMed] [Google Scholar]
- 2.Hartzell H.C., Qu Z., Yu K., Xiao Q., Chien L.T. Molecular physiology of bestrophins: multifunctional membrane proteins linked to best disease and other retinopathies. Physiol. Rev. 2008;88:639–672. doi: 10.1152/physrev.00022.2007. [DOI] [PubMed] [Google Scholar]
- 3.Marquardt A., Stohr H., Passmore L.A., Kramer F., Rivera A., Weber B.H. Mutations in a novel gene, VMD2, encoding a protein of unknown properties cause juvenile-onset vitelliform macular dystrophy (Best's disease) Hum. Mol. Genet. 1998;7:1517–1525. doi: 10.1093/hmg/7.9.1517. [DOI] [PubMed] [Google Scholar]
- 4.Petrukhin K., Koisti M.J., Bakall B., Li W., Xie G., Marknell T., Sandgren O., Forsman K., Holmgren G., Andreasson S., et al. Identification of the gene responsible for Best macular dystrophy. Nat. Genet. 1998;19:241–247. doi: 10.1038/915. [DOI] [PubMed] [Google Scholar]
- 5.Blodi C.F., Stone E.M. Best's vitelliform dystrophy. Ophthal. Paediatr. Genet. 1990;11:49–59. [PubMed] [Google Scholar]
- 6.Wu J., Marmorstein A.D., Striessnig J., Peachey N.S. Voltage-dependent calcium channel CaV1.3 subunits regulate the light peak of the electroretinogram. J. Neurophysiol. 2007;97:3731–3735. doi: 10.1152/jn.00146.2007. [DOI] [PMC free article] [PubMed] [Google Scholar]
- 7.Marmorstein L.Y., Wu J., McLaughlin P., Yocom J., Karl M.O., Neussert R., Wimmers S., Stanton J.B., Gregg R.G., Strauss O., et al. The light peak of the electroretinogram is dependent on voltage-gated calcium channels and antagonized by bestrophin (best-1) J. Gen. Physiol. 2006;127:577–589. doi: 10.1085/jgp.200509473. [DOI] [PMC free article] [PubMed] [Google Scholar]
- 8.Gallemore R.P., Hughes B.A., Miller S.S. In: Light induced responses of the retinal pigment epithelium. Marmor M.F., Wolfensberger T.J., editors. New York, NY: Oxford University Press; 1998. pp. 175–198. [Google Scholar]
- 9.Marmorstein A.D., Marmorstein L.Y., Rayborn M., Wang X., Hollyfield J.G., Petrukhin K. Bestrophin, the product of the Best vitelliform macular dystrophy gene (VMD2), localizes to the basolateral plasma membrane of the retinal pigment epithelium. Proc. Natl Acad. Sci. USA. 2000;97:12758–12763. doi: 10.1073/pnas.220402097. [DOI] [PMC free article] [PubMed] [Google Scholar]
- 10.Sun H., Tsunenari T., Yau K.W., Nathans J. The vitelliform macular dystrophy protein defines a new family of chloride channels. Proc. Natl Acad. Sci. USA. 2002;99:4008–4013. doi: 10.1073/pnas.052692999. [DOI] [PMC free article] [PubMed] [Google Scholar]
- 11.Allikmets R., Seddon J.M., Bernstein P.S., Hutchinson A., Atkinson A., Sharma S., Gerrard B., Li W., Metzker M.L., Wadelius C., et al. Evaluation of the Best disease gene in patients with age-related macular degeneration and other maculopathies. Hum. Genet. 1999;104:449–453. doi: 10.1007/s004390050986. [DOI] [PubMed] [Google Scholar]
- 12.White K., Marquardt A., Weber B.H. VMD2 mutations in vitelliform macular dystrophy (Best disease) and other maculopathies. Hum. Mutat. 2000;15:301–308. doi: 10.1002/(SICI)1098-1004(200004)15:4<301::AID-HUMU1>3.0.CO;2-N. [DOI] [PubMed] [Google Scholar]
- 13.Kramer F., White K., Pauleikhoff D., Gehrig A., Passmore L., Rivera A., Rudolph G., Kellner U., Andrassi M., Lorenz B., et al. Mutations in the VMD2 gene are associated with juvenile-onset vitelliform macular dystrophy (Best disease) and adult vitelliform macular dystrophy but not age-related macular degeneration. Eur. J. Hum. Genet. 2000;8:286–292. doi: 10.1038/sj.ejhg.5200447. [DOI] [PubMed] [Google Scholar]
- 14.Yardley J., Leroy B.P., Hart-Holden N., Lafaut B.A., Loeys B., Messiaen L.M., Perveen R., Reddy M.A., Bhattacharya S.S., Traboulsi E., et al. Mutations of VMD2 splicing regulators cause nanophthalmos and autosomal dominant vitreoretinochoroidopathy (ADVIRC) Invest. Ophthalmol. Vis. Sci. 2004;45:3683–3689. doi: 10.1167/iovs.04-0550. [DOI] [PubMed] [Google Scholar]
- 15.Burgess R., Millar I.D., Leroy B.P., Urquhart J.E., Fearon I.M., De Baere E., Brown P.D., Robson A.G., Wright G.A., Kestelyn P., et al. Biallelic mutation of BEST1 causes a distinct retinopathy in humans. Am. J. Hum. Genet. 2008;82:19–31. doi: 10.1016/j.ajhg.2007.08.004. [DOI] [PMC free article] [PubMed] [Google Scholar]
- 16.Davidson A.E., Millar I.D., Urquhart J.E., Burgess-Mullan R., Shweikh Y., Parry N., O'Sullivan J., Maher G.J., McKibbin M., Downes S.M., et al. Missense mutations in a retinal pigment epithelium protein, bestrophin-1, cause retinitis pigmentosa. Am. J. Hum. Genet. 2009;85:581–592. doi: 10.1016/j.ajhg.2009.09.015. [DOI] [PMC free article] [PubMed] [Google Scholar]
- 17.Marmor M.F., Small K. Dystrophies of the retinal pigment epithelium. In: Marmor M. F., Wofensberger T. J., editors. The retinal pigment epithelium. New York, NY: Oxford University Press; 1998. pp. 326–344. [Google Scholar]
- 18.Pifferi S., Dibattista M., Sagheddu C., Boccaccio A., Al Qteishat A., Ghirardi F., Tirindelli R., Menini A. Calcium-activated chloride currents in olfactory sensory neurons from mice lacking bestrophin-2. J. Physiol. 2009;587:4265–4279. doi: 10.1113/jphysiol.2009.176131. [DOI] [PMC free article] [PubMed] [Google Scholar]
- 19.Boudes M., Sar C., Menigoz A., Hilaire C., Pequignot M.O., Kozlenkov A., Marmorstein A., Carroll P., Valmier J., Scamps F. Best1 is a gene regulated by nerve injury and required for Ca2+-activated Cl− current expression in axotomized sensory neurons. J. Neurosci. 2009;29:10063–10071. doi: 10.1523/JNEUROSCI.1312-09.2009. [DOI] [PMC free article] [PubMed] [Google Scholar]
- 20.Zhang Y., Davidson B.R., Stamer W.D., Barton J.K., Marmorstein L.Y., Marmorstein A.D. Enhanced inflow and outflow rates despite lower IOP in bestrophin-2-deficient mice. Invest. Ophthalmol. Vis. Sci. 2009;50:765–770. doi: 10.1167/iovs.08-2501. [DOI] [PMC free article] [PubMed] [Google Scholar]
- 21.Bakall B., McLaughlin P., Stanton J.B., Zhang Y., Hartzell H.C., Marmorstein L.Y., Marmorstein A.D. Bestrophin-2 is involved in the generation of intraocular pressure. Invest. Ophthalmol. Vis. Sci. 2008;49:1563–1570. doi: 10.1167/iovs.07-1338. [DOI] [PMC free article] [PubMed] [Google Scholar]
- 22.Bakall B., Radu R.A., Stanton J.B., Burke J.M., McKay B.S., Wadelius C., Mullins R.F., Stone E.M., Travis G.H., Marmorstein A.D. Enhanced accumulation of A2E in individuals homozygous or heterozygous for mutations in BEST1 (VMD2) Exp. Eye Res. 2007;85:34–43. doi: 10.1016/j.exer.2007.02.018. [DOI] [PubMed] [Google Scholar]
- 23.Nordstrom S., Thorburn W. Dominantly inherited macular degeneration (Best's disease) in a homozygous father with 11 children. Clin. Genet. 1980;18:211–216. doi: 10.1111/j.1399-0004.1980.tb00874.x. [DOI] [PubMed] [Google Scholar]
- 24.Nordstrom S., Barkman Y. Hereditary maculardegeneration (HMD) in 246 cases traced to one gene-source in central Sweden. Hereditas. 1977;84:163–176. doi: 10.1111/j.1601-5223.1977.tb01394.x. [DOI] [PubMed] [Google Scholar]
- 25.Brown M., Marmor M., Vaegan, Zrenner E., Brigell M., Bach M. ISCEV standard for clinical electro-oculography (EOG) 2006. Doc. Ophthalmol. 2006;113:205–212. doi: 10.1007/s10633-006-9030-0. [DOI] [PMC free article] [PubMed] [Google Scholar]
- 26.Mullins R.F., Oh K.T., Heffron E., Hageman G.S., Stone E.M. Late development of vitelliform lesions and flecks in a patient with best disease: clinicopathologic correlation. Arch. Ophthalmol. 2005;123:1588–1594. doi: 10.1001/archopht.123.11.1588. [DOI] [PubMed] [Google Scholar]
- 27.O'Gorman S., Flaherty W.A., Fishman G.A., Berson E.L. Histopathologic findings in Best's vitelliform macular dystrophy. Arch. Ophthalmol. 1988;106:1261–1268. doi: 10.1001/archopht.1988.01060140421045. [DOI] [PubMed] [Google Scholar]
- 28.Frangieh G.T., Green W.R., Fine S.L. A histopathologic study of Best's macular dystrophy. Arch. Ophthalmol. 1982;100:1115–1121. doi: 10.1001/archopht.1982.01030040093017. [DOI] [PubMed] [Google Scholar]
- 29.Mullins R.F., Kuehn M.H., Faidley E.A., Syed N.A., Stone E.M. Differential macular and peripheral expression of bestrophin in human eyes and its implication for best disease. Invest. Ophthalmol. Vis. Sci. 2007;48:3372–3380. doi: 10.1167/iovs.06-0868. [DOI] [PubMed] [Google Scholar]
- 30.Weingeist T.A., Kobrin J.L., Watzke R.C. Histopathology of Best's macular dystrophy. Arch. Ophthalmol. 1982;100:1108–1114. doi: 10.1001/archopht.1982.01030040086016. [DOI] [PubMed] [Google Scholar]
- 31.Yu K., Xiao Q., Cui G., Lee A., Hartzell H.C. The Best disease-linked Cl− channel hBest1 regulates CaV1 (L-type) Ca2+ channels via src-homology-binding domains. J. Neurosci. 2008;28:5660–5670. doi: 10.1523/JNEUROSCI.0065-08.2008. [DOI] [PMC free article] [PubMed] [Google Scholar]
- 32.Rosenthal R., Bakall B., Kinnick T., Peachey N., Wimmers S., Wadelius C., Marmorstein A., Strauss O. Expression of bestrophin-1, the product of the VMD2 gene, modulates voltage-dependent Ca2+ channels in retinal pigment epithelial cells. FASEB J. 2006;20:178–180. doi: 10.1096/fj.05-4495fje. [DOI] [PubMed] [Google Scholar]
- 33.O'Driscoll K.E., Hatton W.J., Burkin H.R., Leblanc N., Britton F.C. Expression, localization, and functional properties of Bestrophin 3 channel isolated from mouse heart. Am. J. Physiol. Cell Physiol. 2008;295:C1610–C1624. doi: 10.1152/ajpcell.00461.2008. [DOI] [PMC free article] [PubMed] [Google Scholar]
- 34.Barro Soria R., Spitzner M., Schreiber R., Kunzelmann K. Bestrophin-1 enables Ca2+-activated Cl− conductance in epithelia. J. Biol. Chem. 2009;284:29405–29412. doi: 10.1074/jbc.M605716200. [DOI] [PMC free article] [PubMed] [Google Scholar]
- 35.Barro-Soria R., Schreiber R., Kunzelmann K. Bestrophin 1 and 2 are components of the Ca(2+) activated Cl(−) conductance in mouse airways. Biochim. Biophys. Acta. 2008;1783:1993–2000. doi: 10.1016/j.bbamcr.2008.06.016. [DOI] [PubMed] [Google Scholar]
- 36.Wu J., Peachey N.S., Marmorstein A.D. Light-evoked responses of the mouse retinal pigment epithelium. J. Neurophysiol. 2004;91:1134–1142. doi: 10.1152/jn.00958.2003. [DOI] [PMC free article] [PubMed] [Google Scholar]
- 37.Chang B., Heckenlively J.R., Bayley P.R., Brecha N.C., Davisson M.T., Hawes N.L., Hirano A.A., Hurd R.E., Ikeda A., Johnson B.A., et al. The nob2 mouse, a null mutation in Cacna1f: anatomical and functional abnormalities in the outer retina and their consequences on ganglion cell visual responses. Vis. Neurosci. 2006;23:11–24. doi: 10.1017/S095252380623102X. [DOI] [PMC free article] [PubMed] [Google Scholar]
- 38.Grynkiewicz G., Poenie M., Tsien R.Y. A new generation of Ca2+ indicators with greatly improved fluorescence properties. J. Biol. Chem. 1985;260:3440–3450. [PubMed] [Google Scholar]


