

Abstract
The ability of cells to modulate interactions with each other and the substrate is essential for epithelial tissue remodeling during processes such as wound healing and tumor progression. However, despite strides made in the field of proteomics, proteins involved in adhesion have been difficult to study. Here, we report a method for the enrichment and analysis of proteins associated with the basal surface of the cell and its underlying matrix. The enrichment involves deroofing the cells with 20 mm ammonium hydroxide and the removal of cytosolic and organellar proteins by stringent water wash. Proteomic profiling was achieved by LC-FTMS, which allowed comparison of differentially expressed or shared proteins under different cell states. First, we analyzed and compared the basal cell components of mouse keratinocytes lacking the cell-cell junction molecule plakoglobin with their control counterparts. Changes in the molecules involved in motility and invasion were detected in plakoglobin-deficient cells, including decreased detection of fibronectin, integrin β4, and FAT tumor suppressor. Second, we assessed the differences in basal cell components between two human oral squamous cell carcinoma lines originating from different sites in the oral cavity (CAL33 and UM-SCC-1). The data show differences between the two lines in the type and abundance of proteins specific to cell adhesion, migration, and angiogenesis. Therefore, the method described here has the potential to serve as a platform to assess proteomic changes in basal cell components including extracellular and adhesion-specific proteins involved in wound healing, cancer, and chronic and acquired adhesion-related disorders.
There is an urgent need for tools to comprehensively identify markers of normal and pathological processes at the molecular level. DNA microarrays have enabled researchers to follow gene expression changes with respect to many of these processes, including individual tumors in the case of cancer (1). Direct detection of proteins is typically required to validate changes at the gene product level; however, the changes in protein levels do not always reflect changes in gene expression because of post-translational modifications, differential compartmentalization, recycling, and degradation. Because it is ultimately the proteins that convey cellular phenotypes, it is necessary to develop methods for direct screening of proteins, and mass spectrometry shows promise for this purpose. However, the usefulness of mass spectrometry as an analytical tool to detect proteins in cells or tissue is limited to the extent to which the sample is sufficiently enriched for the specific fraction of interest. It is still challenging to identify molecules involved in specific normal or pathological processes because the relevant proteins are often difficult to isolate from the majority of cellular proteins that are not correlated to the process of interest. In this context, an ideal proteomics approach would require a minimal amount of starting material, be amenable to an efficient enrichment strategy, and would provide results quickly.
It has been well established that molecules directly involved in cell-cell and cell-substrate adhesions are critical for processes such as epithelial to mesenchymal transition and wound healing. Their further role in regulation of tissue integrity, cell polarity, motility, and invasion is emphasized by a variety of disorders stemming from their inappropriate expression and mutations (2, 3). Selectins, intercellular adhesion molecule 1, and vascular cell adhesion molecule 1 have been established both as biomarkers (4) and predictive factors (5, 6) for the development of accelerated atherosclerosis and heart disease. In epithelial tissues, reduced expression of the cell-cell adhesion molecule E-cadherin correlates with epithelial to mesenchymal transition, tissue invasion, and metastasis and is a prognostic biomarker of poor clinical outcome in many cell types (7–9). Furthermore, up-regulating E-cadherin is considered as a treatment option in several types of cancer (10). Therefore, methods are also needed to not only identify adhesion molecules as disease markers but to also understand the pathology of underlying medical problems caused by impairment in adhesion molecule function (e.g. inability to heal chronic wounds (11)). However, the lack of knowledge about regulation and functional interactions of the specific adhesion-related proteins has so far thwarted the attempts at direct targeting of these molecules in basic and clinical research (12, 13). Therefore, a comprehensive understanding of how proteins that function in adhesive processes work together to maintain proper tissue form and function is critical.
Some of the same barriers to effective application of mass spectrometry as an analytical tool (as discussed above) have impeded analysis of cell-cell and cell-matrix adhesion-dependent processes such as wound healing and cancer (14). The study of extracellular matrix (ECM)1 and adhesion-related proteins is further complicated by the difficulty in sample preparation because compared with cytosolic proteins basal cell proteins are often highly insoluble (e.g. transmembrane and plaque components) and difficult to isolate from intracellular proteins. One general strategy involves using ECM-specific enzymes to dislodge the cells at their points of attachment (15). The supernatant from the partial digest is collected for further proteomics analysis. However, most mass spectrometric analyses depend on detection of peptides with specific ionization and fragmentation properties that are most readily achieved using trypsin as the sole enzyme. The use of ECM-specific enzymes may result in a distribution of peptides that are not optimal for detection (i.e. the generation of non-tryptic termini). The other general approach to isolate components of the ECM involves using detergents to lyse cells on the surfaces to which they are attached and collect the remaining cell debris for analysis (15). Although progress has been made with respect to the creation of “mass spectrometry-friendly” detergents (16), the use of chemicals for the purpose of protein solubilization is generally not ideal. To overcome these problems, we adapted a fast, simple method of isolating extracellular, transmembrane, and associated proteins (from here on collectively referred to as “basal cell proteins”) from cells attached to a solid substrate. The method consists of “deroofing” the cells attached to glass coverslips by 20 mm NH4OH solution followed by rapid water rinses to remove the bulk of the cell and its remaining debris (17). Our results show efficient removal of cytoplasm and organelles and detection of basal cell proteins by mass spectrometry, including those involved in cell-cell and cell-extracellular matrix interactions. These proteins were liberated from the surface with trypsin, and the subsequently generated peptides were detected and profiled for differences using LC-FTMS.
The approach was first validated by comparing basal cell protein composition in mouse keratinocytes with or without a critical cell-cell junction protein called plakoglobin (PG). This desmosomal protein is required for cell-cell adhesion and maintenance of tissue integrity (18). Plakoglobin inhibits keratinocyte motility (19) and is down-regulated in several distinct tumor types, including bladder, breast, and cervical cancers (20–22). Moreover, we were able to dissect the molecular differences between an independent isolate of PG−/− keratinocytes that behaved differently in motility assays from the rest of the PG-null cells, further emphasizing the potential for using the method to differentiate between cells with distinct adhesive and motile behaviors. The method was then evaluated in clinically relevant human tumor cell lines by extending the analysis to include two human oral squamous cancers of different origin. Because they lack precisely defined changes in cell adhesion molecules and phenotype, we compared the basal cell protein expression of UM-SCC-1 (23) and CAL33 (24) cell lines isolated from the roof of the mouth and tongue, respectively. These experiments revealed 40 proteins differentially expressed between the cell lines among over 100 detected. Moreover, the proteomic profile reveals a set of motility- and invasion-related genes unique to tongue-derived CAL33 cells. This could indicate the difference between oral cancers derived from different parts of the mouth, or it may indicate a potential difference in aggressiveness between these cell lines. These results show that our detection method is applicable for both detection and comparative studies in human cancer model systems.
EXPERIMENTAL PROCEDURES
Cell Culture
Keratinocyte cultures established from PG knock-out (PG−/−, PG−/− B2, and PG−/− B3) or heterozygous control (PG+/−) mouse skin (25) were cultured in defined keratinocyte serum-free medium (Invitrogen) supplemented with 10 ng/ml epidermal growth factor, and 10−10 m cholera toxin. Calcium levels were adjusted to 0.07 mm using 1 m CaCl2. Human oral squamous cell carcinoma lines UM-SCC-1 (a gift from Dr. Thomas Carey, University of Michigan) and CAL33 (a gift from Dr. Gerard Milano, Centre Antoine Lacassagne, Nice, France) were grown in Dulbecco's modified Eagle's medium (Invitrogen) supplemented with 10% fetal bovine serum.
Transwell Migration Assay
The Transwell migration assay was performed as described (19). Briefly, the undersides of Biocoat Cell Environment (BD Biosciences) control inserts (8-μm pore size) were coated with 0.1 mg/ml human placenta collagen (Sigma) at 37 °C for 1 h. A total of 105 cells were plated into each insert and allowed to migrate at 37 °C for 48 h. Migrating cells were fixed and stained with the DiffQuik kit (Dade Behring, Newark, DE). The total number of cells from 12 × 20 microscopic fields on each membrane was counted. Each experiment was performed in triplicate, and the averages were presented with whiskers representing ±S.D.
Basal Cell Protein Isolation and Proteolysis
Cells were plated on tissue culture dishes or 22 × 22-mm glass coverslips and allowed to reach confluency. The culture medium was removed, and the cells were washed in sterile PBS. The cells were ruptured by treating them for 5 min in sterile 20 mm NH4OH followed by the removal of cellular debris by three rapid washes in sterile distilled water according to the method of Gospodarowicz (17). The remaining extracellular matrix and basal cell components (“deroofed” cells) were then washed several times in sterile PBS followed by water. Protein digestion occurred in a humid chamber at 37 °C. Approximately 150 μl of 100 mm NH4HCO3 (Fluka), pH 8.0, containing 0.5 μg of trypsin (Promega) was added to the surface of each glass coverslip. Samples were digested for 1 h at 37 °C, and then the liquid containing the peptides was transferred into tubes designed to prevent nonspecific adsorption to the surface (LoBind, Eppendorf). The enzymatic reaction was stopped by adding acetic acid (Sigma) to lower the pH to 3–4. Samples were stored at −80 °C or on dry ice until analysis.
Western Blotting
Whole and deroofed cell samples were prepared using urea sample buffer. The amount of protein in whole cell lysates was measured using the Amido Black assay (26). Equal amounts of protein were fractionated on a 7.5% SDS-polyacrylamide gel, and immunoblotting was performed as described (27). The following mouse monoclonal antibodies were used: 6D8 anti-desmoglein 2 (a gift from J. Wahl III, University of Nebraska Medical Center, Omaha, NE), anti-β4 integrin (BD Transduction Laboratories), 12G10 anti-α-tubulin (University of Iowa Developmental Studies Hybridoma Bank, Iowa City, IA), and 23A8 anti-Rac1 (Upstate). Polyclonal antibodies used included J18 rabbit anti-laminin α3 chain (a gift from Jonathan Jones, Northwestern University, Chicago, IL), 1407 chicken anti-plakoglobin (28), rabbit anti-lamin A/C (Santa Cruz Biotechnology, Inc.), rabbit anti-fibronectin (Sigma), rabbit anti-βIg-h3 (Cell Signaling Technology), rabbit anti-β1 integrin (Chemicon), rabbit anti-collagen XVIIα1 (Abcam), and rabbit anti-glyceraldehyde-3-phosphate dehydrogenase (Abcam). The following secondary antibodies were used: horseradish peroxidase-conjugated goat anti-mouse and anti-rabbit (Kirkegaard & Perry Laboratories, Gaithersburg, MD).
Indirect Immunofluorescence
Whole and deroofed PG+/− and PG−/− mouse keratinocytes were fixed with 4% paraformaldehyde and stained for nuclei and laminin α3 chain using Hoescht (Molecular Probes) and anti-laminin α3 (J18) antibody, respectively. Alexa Fluor 488 goat anti-rabbit (Molecular Probes, Eugene, OR) (1:400 dilution) was used as the secondary antibody. Alternatively, cells were rinsed with PBS, fixed in anhydrous methanol for 2 min at −20 °C, stained with 6D8 (1:100) antibody, and visualized with Alexa Fluor 488-conjugated secondary goat anti-mouse antibody (1:400).
Flow Cytometry
PG+/− and PG−/− mouse keratinocytes were plated (5 × 10⁵/well) in a 6-well plate overnight. Cells were detached with cell detachment solution (sterile, calcium-free PBS containing 2.5 mm EDTA and 0.1% glucose), resuspended in their growth medium, and collected by centrifugation at 1500 rpm for 10 min at 4 °C. Cells were resuspended in 100 μl of blocking solution (2% BSA in PBS) and incubated in the dark for 30 min on ice with phycoerythrin-conjugated antibodies against integrins α6 (BioLegend) and β4 (Santa Cruz Biotechnology, Inc.), phycoerythrin-conjugated rat isotype control IgGs (BioLegend), or no antibody. Cells were centrifuged at 1500 rpm for 5 min, washed twice in 1 ml of washing solution (2% FCS, 0.1% sodium azide in PBS), and then fixed in 0.5% paraformaldehyde. Fluorescence was measured using a Dako Cytomation CyAn benchtop multilaser flow cytometer.
Cell Imaging
Mouse keratinocytes were plated at 10–20% density on a four-chamber borosilicate cover glass. After cells were attached and spread (2 h), medium was changed to eliminate debris, and DIC cell imaging was conducted with a Leica DMI 6000 microscope (20× DIC) using a Hamamatsu digital camera. Images were processed using SimplePCI (Hamamatsu).
Mass Spectrometry
The peptides from ∼50% of each sample were separated by reverse phase chromatography using a Waters nanoACQUITY ultraperformance LC system (Milford, MA), a Waters BEH C18 1.7-μm, 100-μm × 10-cm column and the following gradient: 1–10% acetonitrile in 5 min, 10–35% in 65 min, 35–70% in 5.2 min, hold 0.8 min, 70–1% in 0.2 min, and hold 13.8 min. A concentration of 0.1% formic acid was maintained throughout LC runs. Peptides were directly eluted into a ThermoElectron LTQ-FT mass spectrometer (San Jose, CA) with an electrospray ionization source at a flow rate of 1 μl/min. Data-dependent software allowed the top four most abundant ions to be selected with a 30-s exclusion list time and repeat count of 2. Singly charged ions were disallowed for collision-induced dissociation.
Data Analysis
Tandem mass spectra were extracted and converted to .mzXML format by the Readw program provided by the Chicago Biomedical Consortium University of Illinois at Chicago Research Resources Center Proteomics and Informatics Services Facility, which was established by a grant from The Searle Funds at the Chicago Community Trust to the Chicago Biomedical Consortium. Spectra were then searched with SorcererTM-SEQUEST® (ThermoFinnigan, San Jose, CA; version v.27, revision 11), which was instructed to use the ipi.MOUSE.v3.44.HuKeratin (containing 55,278 entries) or IPI_ human_20080927 (74,017 entries) database and X! Tandem (29) (TORNADO 2008.02.01.7) provided by the Global Proteome Machine (30). Search parameters were defined as follows: tryptic cleavage (disallowed after prolines), one allowed missed cleavage, fragment ion mass tolerance of 1.00 Da, parent ion tolerance of 0.015 Da, and variable oxidation of methionines. Scaffold_2.1.03 (Proteome Software Inc., Portland, OR) was used to report spectral counts (i.e. the number of unique spectra per protein) and validate MS/MS-based peptide and protein identifications, which were accepted if each could be established at greater than 95.0% probability as specified by the Peptide Prophet and Protein Prophet algorithms (31, 32). Proteins that contained similar peptides and could not be differentiated based on MS/MS analysis alone were grouped to satisfy the principles of parsimony. Proteins with a minimum of two peptides and expectation values (generated by X! Tandem) of log(e) ≤−3 were considered for comparison between data sets. Justification for thresholds was based on the greatest consistency between the two search algorithm outputs. Importantly, because cell culture media contained serum, proteins of serum origin were identified using control samples (surfaces without cells). This allowed serum proteins to be filtered out of the protein lists generated for the deroofed cells, leaving only monolayer-isolated proteins for comparison by spectral counting. ProteinCenterTM (Proxeon, Cambridge, MA) was used to report gene ontologies of proteins detected.
RESULTS
Ammonium Hydroxide Treatment of Cells Enriches ECM, Adhesion-related, and Membrane Components
To obtain samples enriched in ECM and membrane-associated proteins, we adopted a previously described method for matrix preparation using a basic, hypotonic solution (33). This method removes organelles and cytoskeletal and cytosolic proteins while leaving behind secreted, transmembrane, and peripheral membrane proteins associated with the ventral aspect of the cell (referred to here as basal cell proteins), which remain adsorbed to the glass coverslip (Fig. 1A). These proteins can be digested with a protease (usually trypsin) to generate peptides that can be identified after separation by LC-FTMS. To test whether basal cell proteins remained attached to the surface after the treatment with high pH, PG+/− mouse keratinocytes were plated on small glass coverslips (22 × 22 mm), and the apical cell bodies were removed by incubating with 20 mm ammonium hydroxide (control cells were treated with PBS). Samples were stained for the presence of the α3 chain of the basement membrane protein laminin and nuclei (Fig. 1B), clearly showing that deroofed samples still contained protein secreted by the cells attached to the coverslips but that the nuclei were eliminated. Furthermore, Western blot analysis of the control and treated samples showed a dramatic decrease in nuclear (lamin A/C) and cytoskeletal (tubulin) proteins in the deroofed sample, whereas the levels of laminin were comparable to levels in the non-treated cells control (Fig. 1C). These results show that treatment of cells with a basic, hypotonic solution enriches the matrix and membrane fractions by eliminating a substantial amount of the nuclear and cytoplasmic molecules.
Fig. 1.

Cellular deroofing enriches basal cell protein component. A, scheme representing the process of enriching the basal cell fraction by deroofing and the subsequent proteomics analysis of the sample by ESI LC-FTMS. B, presence of the extracellular matrix and nuclei in whole and deroofed cells was analyzed by immunofluorescence (bar, 10 μm). C, levels of basal cell, nuclear, and cytoskeletal markers in whole and deroofed cells were determined by Western blot. LAM, laminin; Lmn, lamin.
Identification and Analysis of Relative Abundance of Basal Cell Proteins in Mouse Keratinocytes
To analyze the basal cell component-enriched protein preparation, proteins were digested, chromatographically separated, and analyzed by a high mass accuracy Fourier transform mass spectrometer. Comparable amounts of protein were analyzed per cell type as based on the chromatograms generated from PG+/−- (Fig. 2A) and PG−/− (Fig. 2B)-containing cells, ensuring that differences in protein expression observed were not due to differences in sample loading. Usually sample preparation for proteomics analysis starts with enrichment of intact proteins that can be quantified followed by digestion into peptides for subsequent analysis. With this method, the isolated proteins are liberated from the surface as peptides by trypsin. Therefore, it is difficult to obtain absolute quantification of the amount of total proteins isolated by this method. Nevertheless, only half of the generated sample volume was required to obtain robust (e.g. 6 × 10⁶) signal. In addition, the observed m/z values 523, 421, and 738 are generated by autodigestion of trypsin, which corresponds to ∼0.25 μg of enzyme per injection and served as an internal loading control between samples (Fig. 2, A and B).
Fig. 2.

Deroofed PG+/− and PG−/− cells produce similar peptide abundances after release of proteins by conversion into peptides from surface by trypsin digestion. A, base peak chromatogram of tryptic peptides detected from deroofed PG+/− cells (contains plakoglobin). B, base peak chromatogram of tryptic peptides recovered from deroofed plakoglobin-null (PG−/−) cells. Peptide abundances are similar between the cell preparations, indicating similar amounts of sample loaded. In addition, equivalent loading could be monitored by three m/z values from autodigestion of trypsin (523, 421, and 738). C, protein intensity (log(I)) values were summed according to each respective cell compartmentalization category to determine the fraction of overall signal recorded from the mass spectrometer. D, the number of proteins per cell compartment is further defined. Note that a protein may be represented in more than one category so that the total number of proteins per pie chart does not equal the total number of proteins detected per analysis. E, a Venn diagram shows the overlap between the number of proteins identified from each cell type.
To assess the quality of the basal cell preparation in its entirety, we summed protein intensities from the log(I) values generated by the X! Tandem algorithm (see supplemental Table S1). As shown in Fig. 2C, the highest signals from the detected proteins belonged to those that were compartmentalized to the basal side of the cell (extracellular, plasma membrane, or adhesion regions) as determined by gene ontology categories given by UniProt and ProteinCenter. The distribution of these proteins by number (as opposed to intensity) is shown in Fig. 2D. Note that cell compartment categories are non-exclusive, so a single protein may reside in more than one region of the cell. In addition, although 51 and 42 proteins from PG+/− and PG−/− were described as nuclear, respectively, the contribution of these proteins to the overall signal detected by the mass spectrometer is low (Fig. 2C), highlighting the need to ensure that the highest fraction of proteins detected from the overall signal belongs to the category of interest. Sixty-nine proteins were shared between PG+/− and PG−/− deroofed cells (Fig. 2E). Those that did not overlap either represent proteins unique to each cell line or proteins present at lower levels whose detection may vary between preparations. A representative set of robustly identified proteins from the mouse keratinocytes along with their respective properties and identification scores is shown in Table I. The full list of proteins detected can be found in supplemental Tables S1 and S2.
Table I. Representative proteins detected from deroofed PG+/− cells.
| Gene | log(e)a | %/%b | Unique peptides | Total peptides | Molecular mass | Identifierc | Locationd | Cellular rolese |
|---|---|---|---|---|---|---|---|---|
| kDa | ||||||||
| Plec1 | −1470 | 36/45 | 133 | 168 | 517 | IPI00400209 | PM | Anchors intermediate filaments to desmosomes or hemidesmosomes |
| Fat1 | −946.2 | 25/41 | 83 | 104 | 507 | IPI00623114 | TM | Cadherin, up-regulated in migration, necessary for efficient wound healing |
| Lama3 | −488.4 | 16/22 | 46 | 62 | 331 | IPI00125058 | Sec | Major component of basement membranes; mediates the attachment, migration, and organization of cells into tissues during embryonic development by interacting with other extracellular matrix components |
| Lamb3 | −381.4 | 31/39 | 34 | 51 | 129 | IPI00117093 | Sec | Major component of basement membranes; mediates the attachment, migration, and organization of cells into tissues during embryonic development by interacting with other extracellular matrix components |
| ITGB4 | −376.9 | 29/41 | 37 | 51 | 195 | IPI00313479 | TM | Receptor for laminins, heterodimerizes with ITGA6, participates in invasive carcinomas |
| Ctnna1 | −334.3 | 39/53 | 28 | 38 | 100 | IPI00112963 | PM | Associates with the cytoplasmic domain of a variety of cadherins for cell adhesion |
| Fn1 | −311.4 | 17/27 | 28 | 38 | 272 | IPI00113539 | Sec | Involved in cell adhesion, cell motility, opsonization, wound healing, and maintenance of cell shape |
| Lamc2 | −298.6 | 26/36 | 28 | 38 | 130 | IPI00117115 | Sec | Major component of basement membranes; mediates the attachment, migration, and organization of cells into tissues during embryonic development by interacting with other extracellular matrix components |
| Ctnnd1 | −195 | 26/42 | 19 | 26 | 107 | IPI00751207 | PM | May associate with and regulate the cell adhesion properties of both C- and E-cadherins |
| ITGA6 | −189.9 | 20/31 | 18 | 21 | 120 | IPI00227969 | TM | Receptor for laminin in epithelial cells, plays a critical structural role in the hemidesmosome |
| Htra | −188.7 | 41/65 | 20 | 29 | 51.2 | IPI00128040 | Sec | Serine protease that regulate the availability of IGFs by cleaving IGF-binding proteins |
| Tnc | −156.4 | 11/16 | 15 | 18 | 222 | IPI00420656 | Sec | Extracellular matrix protein, may play a role in supporting the growth of epithelial tumors |
| Jup | −134.5 | 23/33 | 13 | 16 | 81.7 | IPI00229475 | PM | Component of desmosomes and intermediate junctions, structure and function of submembranous plaques |
| Angptl2 | −122.5 | 29/37 | 12 | 16 | 57.1 | IPI00126864 | Sec | Induces sprouting in endothelial cells through an autocrine and paracrine action |
| Col17a1 | −107.2 | 8.6/16 | 10 | 10 | 148 | IPI00284644 | Sec | Integrity of hemidesmosome and the attachment of basal keratinocytes to the underlying basement membrane |
| ITGB1 | −52 | 9.1/18 | 6 | 6 | 88.2 | IPI00132474 | TM | Recognizes the extracellular protein sequence RGD in a wide array of ligands |
| Timp3 | −17 | 12/21 | 3 | 3 | 24.2 | IPI00110370 | Sec | Irreversibly inactivates metalloproteases such as collagenase in response to tissue remodeling |
a X! Tandem measure of how likely the match occurred by chance.
b Actual percent coverage vs. percent coverage when corrected for peptides unlikely to be detected by MS with trypsin.
c IPI, International Protein Index.
d PM, peripheral membrane; TM, transmembrane; Sec, secreted.
e Description taken from UniProt. IGF, insulin-like growth factor.
Several of the proteins in the sample were transmembrane proteins including integrin receptors α6 and β4, which have important roles in cell adhesion, signaling, and migration. The presence of membrane proteins is notable because isolation and purification of these proteins is difficult because of their hydrophobic nature and chemical properties (34). Supplemental Fig. S1 illustrates the protein coverage (29%) of integrin β4, a great improvement over the highest protein coverage reported for the integrin family (17%) (35). A unique feature of X! Tandem is that peptides that are unlikely to be detected by MS due to unfavorable lengths are color-coded and excluded from the denominator during percent coverage calculations so that a more realistic coverage is reported. Using this feature, we covered 41% of detectable amino acids in integrin β4 (Table I).
Mass Spectral Counting Enables Detection of Differentially Expressed Proteins
We profiled changes in protein expression by comparing mouse keratinocytes with or without expression of the junctional protein PG. In recent work, we showed that PG regulates keratinocyte motility in both a cell-cell adhesion-dependent and -independent manner (19). Moreover, we demonstrated that PG regulates cell motility through changes in basal cell proteins, including deposition of ECM and integrin membrane presentation.2 Because little is known about cell-substrate interaction regulation by cell-cell adhesion and especially desmosomal molecules, we studied the change in an overall expression pattern of adhesion-related molecules in PG-null and heterozygous mouse keratinocytes. PG-null cells exhibited enhanced cell motility compared with PG heterozygous cells, raising the possibility that PG may play a role in regulating the expression of proteins required for adhesion and migration. Triplicate analyses of independently prepared samples showed that PG was detected by LC-FTMS in the positive control (PG+/−, heterozygous cells) but not in the PG-deficient (PG−/−) cells (Fig. 3A). Furthermore, the results showed that differential expression of PG was correlated to differential expression of a variety of molecules. The spectral count values were further corroborated by flow cytometry (cell surface protein) (Fig. 3B) and Western blot (total protein) (Fig. 3E) as a secondary method to confirm some of the observed changes.
Fig. 3.

Detection and differential comparison of basal cell proteins in mouse keratinocytes. A, spectral counts per protein detected from deroofed plakoglobin-containing (PG+/−) or plakoglobin-null (PG−/−) cells are reported as the average of triplicate analyses of independent sample preparations. Error bars indicate standard deviation. B, flow cytometry showing the diminished cell surface expression of integrins β4 and α6 in PG−/− keratinocytes when compared with control cells (PG+/−). C, motility of PG+/−, PG−/−, PG−/− B2, and PG−/− B3 cells was compared in a Transwell migration assay. The y axis represents the percentage of migrated cells compared with PG+/− control. Error bars indicate standard deviation. D, DIC images of PG−/− B2 and PG−/− B3 keratinocytes show differences in cell morphology (bar, 20 μm). E, Western blots showing the differential expression of selected basal cell molecules in PG+/−, PG−/− B2, and PG−/− B3 cells. ITG, integrin; LAM, laminin; COL, collagen; N/A, not applicable; FN, fibronectin; HTRA, High temperature requirement protein A; ANGPT, angiopoietin; CTNN, catenin; TIMP, tissue inhibitor metalloproteinases.
In light of different motility exhibited by PG+/− and PG−/− cells (Fig. 3C and Ref. 19), the differences in expression of FAT tumor suppressor, fibronectin, and collagen XVIIα1 (BP180) among others are particularly interesting. FAT1 is up-regulated in migration, induces cellular process formation when overexpressed, and is necessary for efficient wound healing (36). Fibronectin is an extracellular matrix component important for the regulation of motility of many cell types, including keratinocytes (37). BP180 is a component of hemidesmosomes, an integrin-containing structure anchoring keratinocytes to the basement membrane (38).
We also observed that the B2 variant of the PG−/− cells exhibited reduced cell motility when compared with other PG−/− cell isolates (Fig. 3C). Moreover, the B2 variant displayed long, sticky protrusions that hampered their motility and made them morphologically distinct from B3 and other PG-null cells (Fig. 3D). To address whether proteomics analysis would reveal a possible explanation for this phenotypic difference, we prepared the basal cell proteins and screened them by mass spectrometry. Unlike the other PG−/− cell isolates, the levels of fibronectin and β1 integrin were increased in the B2 variant. Other molecules differentially expressed between PG+/− and PG−/− cells, such as collagen XVII (BP180), showed no change in expression in the B2 cell population. It remains to be seen whether these specific changes in the expression of fibronectin and its receptor β1 integrin (α5β1) are sufficient to account for the differences in morphology and motility between different PG−/− keratinocyte populations (Fig. 3, C–E).2 However, these data demonstrate that the method of basal cell component screening presented here is able to define the molecular differences between cell populations exhibiting different behaviors.
Differential Expression of Basal Cell Proteins in Human Squamous Cell Carcinoma Lines
Because the metastatic progression of head and neck carcinomas is correlated with the loss of cell-cell adhesion, extracellular matrix remodeling, and changes in motility and invasion (39, 40), the method was next applied to cancer cells derived from oral tissue. We analyzed human oral squamous carcinoma lines CAL33 and UM-SCC-1, which originate from different affected areas, tongue and the roof of the mouth, respectively. The analysis revealed nearly 40 differentially expressed proteins (supplemental Fig. S2), some of which we chose to analyze further because of their roles in tumor progression and metastasis (Fig. 4A). The full list of the proteins detected from CAL33 and UM-SCC-1 deroofed cells is provided in supplemental Tables S3 and S4, respectively. Western blots of selected proteins that are known to be involved in tumor progression through their roles in regulating cell-cell adhesion (desmoglein 2 and PG) (41, 42), cell-matrix interactions (β4 integrin and βIg-h3) (43–45), motility and invasion (Rac1) (46), and cell growth and death regulation (βIg-h3) (47, 48) revealed differential expression and corroborated the mass spectrometry findings (Fig. 4B). Moreover, immunofluorescence analysis confirmed the decrease in overall and cell surface expression of desmoglein 2 in the UM-SCC-1 cell line (Fig. 4C).
Fig. 4.
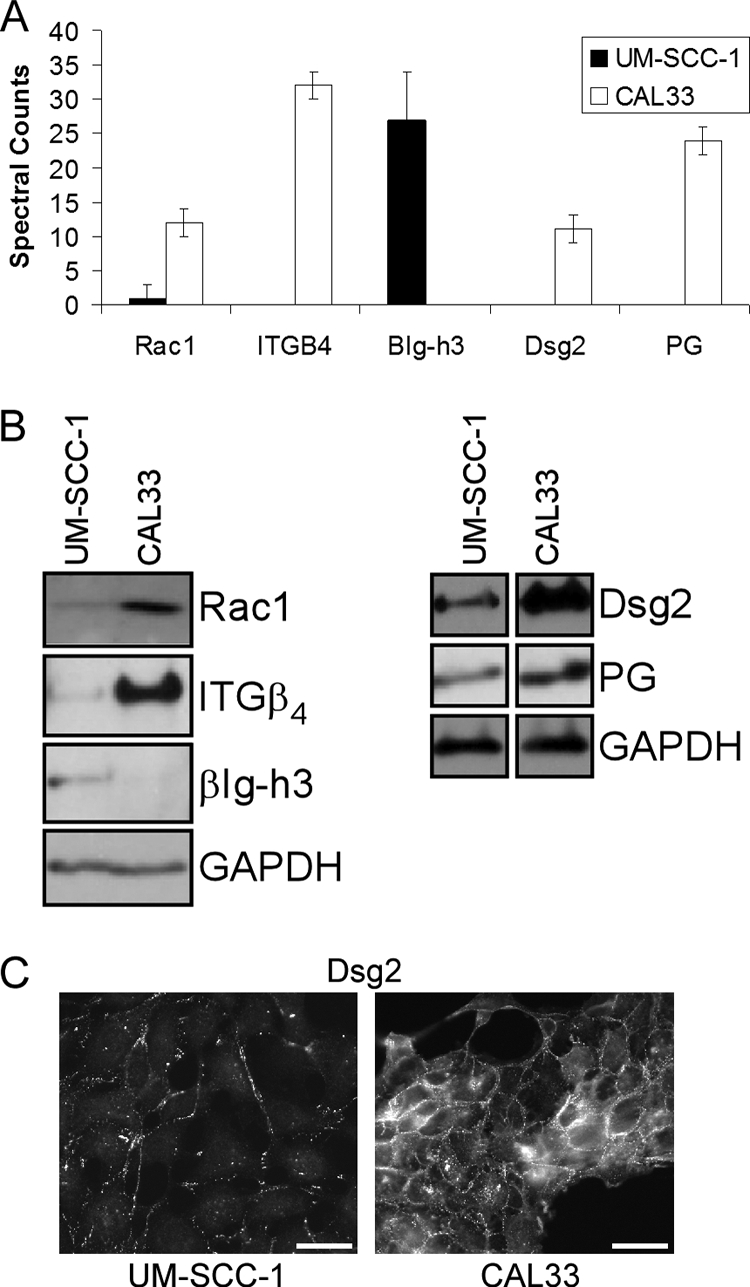
Detection and differential comparison of basal cell proteins in human squamous cell carcinomas. A, spectral counts per protein detected from deroofed UM-SCC-1 or CAL33 cells are reported as the average of triplicate analyses. B, Western blots showing the differential expression of selected basal cell proteins in UM-SCC-1 and CAL33 cells. C, the difference in expression and subcellular localization of desmoglein 2 in UM-SCC-1 and CAL33 cells was analyzed by immunofluorescence (bar, 10 μm). Dsg, desmoglein; ITG, integrin; GAPDH, glyceraldehyde-3-phosphate dehydrogenase.
DISCUSSION
This study presents a method for profiling the proteins that participate in cell-cell and cell-matrix interactions that are associated with distinct cellular states. The method is based on a simple procedure for isolating the proteins followed by identification by mass spectrometry (LC-FTMS). We report high protein coverages and reproducible differences in expression of several peripheral membrane, transmembrane, and extracellular proteins that likely play a role in keratinocyte motility, wound healing, and carcinoma pathology.
The strategy presented here is valuable because it provides an efficient method for profiling cell-cell and cell-matrix adhesion molecules. Such methods are needed to better understand how these molecules function both in normal and diseased states. On one hand, the complex regulation of expression and function of many adhesion molecules is still not well understood. This method would provide a platform for assaying the downstream effect of the modulation of a wide variety of molecules (e.g. transcription factors, signaling proteins, drug candidates, etc.) in the functional regulation of basal cell components. On the other hand, the method has the potential to address challenges of studying many inherited and acquired disorders associated with complex alterations in matrix and adhesion molecules. The method reported here addresses these challenges and has important implications from both a methodological and biological discovery standpoint.
With respect to methodology, the majority of proteomic enrichment strategies depend on protein solubilization with detergents, which are not compatible with most mass spectrometry-based methods, so their removal is critical for successful analysis (49). Furthermore, profiling of complex proteomes involving thousands of proteins to identify disease-specific markers requires multiple separation and sample handling steps (50), but such measures are not warranted when only a small fraction of the proteome is sufficient for comparison. In this report, both the use of detergents and multiple separation steps were avoided by incubating a confluent cell monolayer on a small adsorptive (glass) surface with a basic, hypotonic solution. This treatment ruptures cells, thus removing nuclear and cytoplasmic components while precipitating the proteins at the basal side of the cells. This afforded rapid isolation of basal cell proteins, including those involved in cell-cell and cell-ECM adhesion, thus achieving a level of enrichment required for successful profiling of the subset of proteins of interest.
In this study, we routinely detected ∼100 proteins with two or more peptides from the mouse and human deroofed cancer cell lines. Both X! Tandem and Scaffold provided measures of protein intensity (log(I) and spectral counts, respectively). However, although both outputs revealed similar trending, the spectral counts generated by Scaffold provided better sensitivity for discerning differences. On the other hand, X! Tandem provided more comprehensive information to meet current requirements for publication of proteomics data. Both informatics approaches lent value to this method.
With respect to the evaluation of differences between cell types, variability between replicates was minimized for proteins present at greater than five spectral counts, so this served as the limit of detection to qualify a protein for comparisons between samples. Because the most abundant protein in the samples was present at ∼250 spectral counts, comparison of proteins with a 50-fold difference was possible. However, others have reported a dynamic range capabilities for spectral counting at 2 orders of magnitude (51), so although our samples did not span the full extent of this range, it is possible that other cell types that produced higher protein dynamic ranges could still be successfully screened. It is important to note that this screening platform is easily adaptable to other quantitation methods (e.g. stable isotope labeling by amino acids in cell culture (52), ICAT (53), and isobaric tags for relative and absolute quantitation (54)) and subsequent post-translational modification enrichment methods, allowing for great experimental flexibility. Although detection of post-translational modifications was not the goal of this study, we do not expect the treatment of cells with 20 mm NH4OH, pH 10.5, for 5–10 min to result in the loss of phosphoric acid or significant deamidation, which requires much harsher conditions for chemical modification (55).
It is equally important to note that not all cell lines may be amenable to this enrichment strategy as it relies on cell types that secrete high levels of basement membrane-type proteins for adhesion to a surface. Furthermore, not all matrix proteins are expected to be readily and equally detected by both mass spectrometry and Western blot. High quality antibodies are not always available, but in those we tested, the differences in signals we observed matched the spectral count trending very well. Extracellular matrix proteins are often heavily post-translationally modified or covalently cross-linked (collagen IV, for instance, contains a putative methionine to hydroxylysine covalent linkage (56, 57)) in a way that may mask tryptic sites or create peptide linkages not detected by the protein identification algorithm used. To maximize experimental efficiency during proteomic profiling, enzymatic deglycosylation of O- and N-linked sugars and reduction/alkylation of disulfide bonds were not performed. However, future experiments could be designed to include steps to maximize coverage of specific proteins of interest with only a modest increase in sample preparation time. Despite these potential issues, high protein coverages of many secreted, transmembrane, and peripheral membrane proteins were observed.
After validating the method with mouse keratinocytes, we profiled the differences in basal cell components of two human squamous carcinoma cell lines of different origin. The two cell lines, CAL33 and UM-SCC-1, showed striking differences in basal cell proteins related to adhesion, cell-matrix interactions, motility, and angiogenesis, all of which play a significant role in determination of the metastatic potential of tumor. It is tempting to speculate that genetic manipulation of some of these regulated proteins might change the metastatic potential of these two cell lines. These results highlight the practicality of applying of proteomic profiling in quickly determining the molecular background of observed phenotypic differences between cancer cell populations.
Taken collectively, our results clearly demonstrate that this method is applicable to global profiling of proteins located at the cell substrate interface, including ECM and adhesion-related molecules in both mouse and human model systems. We report a fast, simple strategy that achieves the goals of specific isolation, successful identification, and reproducible differential detection of proteins involved in cell-cell and cell-surface adhesion. Our method would allow one to study the biology of many adherent tissue types with the ultimate goal to use the data acquired in this manner to develop global screens for biomarkers for cancer, wound healing, and chronic and acquired adhesion-related disorders.
Supplementary Material
Acknowledgments
We thank Eliane Mueller for the PG+/− and PG−/− mouse keratinocytes, Thomas Carey and Gerard Milano for the SCC lines, Jim Wahl and J. C. R. Jones for antibody reagents, and J. C. R. Jones and the Jones laboratory (especially Kevin Hamill and Kristina Kligys) for helpful discussions. We also acknowledge the Chicago Biomedical Consortium University of Illinois at Chicago Research Resources Center Proteomics and Informatics Services Facility, which was established by a grant from The Searle Funds at the Chicago Community Trust.
Footnotes
* This work was supported, in whole or in part, by National Institutes of Health Grants R01 AR43380, R01 AR41836, and R01 CA122151 (to K. J. G.) and Training Grants T32 CA070085 and F32 AR055444 (to V. T.). This work was also supported by the National Science Foundation (to M. M.) and the DePaul Department of Chemistry (to M. J. S. P.).
 The on-line version of this article (available at http://www.mcponline.org) contains supplemental Figs. S1 and S2 and Tables S1–S4.
2 V. Todorović, B. V. Desai, M. J. Schroeder Patterson, E. Amargo, A. D. Dubash, J. C. Jones, and K. J. Green, manuscript in preparation.
1 The abbreviations used are:
- ECM
- extracellular matrix
- PG
- plakoglobin
- DIC
- differential interference contrast.
REFERENCES
- 1.Kunz M. ( 2008) Genomic signatures for individualized treatment of malignant tumors. Curr. Drug Discov. Technol 5, 9– 14 [DOI] [PubMed] [Google Scholar]
- 2.Giancotti F. G., Ruoslahti E. ( 1999) Integrin signaling. Science 285, 1028– 1032 [DOI] [PubMed] [Google Scholar]
- 3.Nollet F., Berx G., van Roy F. ( 1999) The role of the E-cadherin/catenin adhesion complex in the development and progression of cancer. Mol. Cell. Biol. Res. Commun 2, 77– 85 [DOI] [PubMed] [Google Scholar]
- 4.Blankenberg S., Barbaux S., Tiret L. ( 2003) Adhesion molecules and atherosclerosis. Atherosclerosis 170, 191– 203 [DOI] [PubMed] [Google Scholar]
- 5.Malik I., Danesh J., Whincup P., Bhatia V., Papacosta O., Walker M., Lennon L., Thomson A., Haskard D. ( 2001) Soluble adhesion molecules and prediction of coronary heart disease: a prospective study and meta-analysis. Lancet 358, 971– 976 [DOI] [PubMed] [Google Scholar]
- 6.Pradhan A. D., Rifai N., Ridker P. M. ( 2002) Soluble intercellular adhesion molecule-1, soluble vascular adhesion molecule-1, and the development of symptomatic peripheral arterial disease in men. Circulation 106, 820– 825 [DOI] [PubMed] [Google Scholar]
- 7.Voulgari A., Pintzas A. ( 2009) Epithelial-mesenchymal transition in cancer metastasis: mechanisms, markers and strategies to overcome drug resistance in the clinic. Biochim. Biophys. Acta 1796, 75– 90 [DOI] [PubMed] [Google Scholar]
- 8.Paschos K. A., Canovas D., Bird N. C. ( 2009) The role of cell adhesion molecules in the progression of colorectal cancer and the development of liver metastasis. Cell. Signal 21, 665– 674 [DOI] [PubMed] [Google Scholar]
- 9.Carneiro F., Oliveira C., Leite M., Seruca R. ( 2008) Molecular targets and biological modifiers in gastric cancer. Semin. Diagn. Pathol 25, 274– 287 [DOI] [PubMed] [Google Scholar]
- 10.Howard E. W., Camm K. D., Wong Y. C., Wang X. H. ( 2008) E-cadherin upregulation as a therapeutic goal in cancer treatment. Mini Rev. Med. Chem 8, 496– 518 [DOI] [PubMed] [Google Scholar]
- 11.Fernandez M. L., Broadbent J. A., Shooter G. K., Malda J., Upton Z. ( 2008) Development of an enhanced proteomic method to detect prognostic and diagnostic markers of healing in chronic wound fluid. Br. J. Dermatol 158, 281– 290 [DOI] [PubMed] [Google Scholar]
- 12.DeClerck Y. A., Mercurio A. M., Stack M. S., Chapman H. A., Zutter M. M., Muschel R. J., Raz A., Matrisian L. M., Sloane B. F., Noel A., Hendrix M. J., Coussens L., Padarathsingh M. ( 2004) Proteases, extracellular matrix, and cancer: a workshop of the path B study section. Am. J. Pathol 164, 1131– 1139 [DOI] [PMC free article] [PubMed] [Google Scholar]
- 13.Hynes R. O. ( 2002) A reevaluation of integrins as regulators of angiogenesis. Nat. Med 8, 918– 921 [DOI] [PubMed] [Google Scholar]
- 14.Aden N., Shiwen X., Aden D., Black C., Nuttall A., Denton C. P., Leask A., Abraham D., Stratton R. ( 2008) Proteomic analysis of scleroderma lesional skin reveals activated wound healing phenotype of epidermal cell layer. Rheumatology 47, 1754– 1760 [DOI] [PubMed] [Google Scholar]
- 15.Xiao Z., Blonder J., Zhou M., Veenstra T. D. ( 2009) Proteomic analysis of extracellular matrix and vesicles. J. Proteomics 72, 34– 45 [DOI] [PubMed] [Google Scholar]
- 16.Hansen K. C., Kiemele L., Maller O., O'Brien J., Shankar A., Fornetti J., Schedin P. ( 2009) An in-solution ultrasonication-assisted digestion method for improved extracellular matrix proteome coverage. Mol. Cell. Proteomics 8, 1648– 1657 [DOI] [PMC free article] [PubMed] [Google Scholar]
- 17.Gospodarowicz D. ( 1984) Preparation of extracellular matrices produced by cultured bovine corneal endothelial cells and PF-HR-9 endodermal cells: their use in cell culture, in Methods for Preparation of Media, Supplements and Substrata for Serum Free Animal Cell Culture ( Barnes D. W., Sirbasku D. A., Stao G. H. eds) pp. 275– 293, Alan R. Liss, Inc., New York [Google Scholar]
- 18.Bierkamp C., Mclaughlin K. J., Schwarz H., Huber O., Kemler R. ( 1996) Embryonic heart and skin defects in mice lacking plakoglobin. Dev. Biol 180, 780– 785 [DOI] [PubMed] [Google Scholar]
- 19.Yin T., Getsios S., Caldelari R., Kowalczyk A. P., Müller E. J., Jones J. C., Green K. J. ( 2005) Plakoglobin suppresses keratinocyte motility through both cell-cell adhesion-dependent and -independent mechanisms. Proc. Natl. Acad. Sci. U.S.A 102, 5420– 5425 [DOI] [PMC free article] [PubMed] [Google Scholar]
- 20.Giroldi L. A., Bringuier P. P., Shimazui T., Jansen K., Schalken J. A. ( 1999) Changes in cadherin-catenin complexes in the progression of human bladder carcinoma. Int. J. Cancer 82, 70– 76 [DOI] [PubMed] [Google Scholar]
- 21.Sommers C. L., Gelmann E. P., Kemler R., Cowin P., Byers S. W. ( 1994) Alterations in beta-catenin phosphorylation and plakoglobin expression in human breast cancer cells. Cancer Res 54, 3544– 3552 [PubMed] [Google Scholar]
- 22.Denk C., Hülsken J., Schwarz E. ( 1997) Reduced gene expression of E-cadherin and associated catenins in human cervical carcinoma cell lines. Cancer Lett 120, 185– 193 [DOI] [PubMed] [Google Scholar]
- 23.Baker S. R. ( 1985) An in vivo model for squamous cell carcinoma of the head and neck. Laryngoscope 95, 43– 56 [DOI] [PubMed] [Google Scholar]
- 24.Gioanni J., Fischel J. L., Lambert J. C., Demard F., Mazeau C., Zanghellini E., Ettore F., Formento P., Chauvel P., Lalanne C. M., Courdi A. ( 1988) Two new human tumor cell lines derived from squamous cell carcinomas of the tongue: establishment, characterization and response to cytotoxic treatment. Eur. J. Cancer Clin. Oncol 24, 1445– 1455 [DOI] [PubMed] [Google Scholar]
- 25.Caldelari R., de Bruin A., Baumann D., Suter M. M., Bierkamp C., Balmer V., Müller E. ( 2001) A central role for the armadillo protein plakoglobin in the autoimmune disease pemphigus vulgaris. J. Cell Biol 153, 823– 834 [DOI] [PMC free article] [PubMed] [Google Scholar]
- 26.Sheffield J. B., Graff D., Li H. P. ( 1987) A solid-phase method for the quantitation of protein in the presence of sodium dodecyl sulfate and other interfering substances. Anal. Biochem 166, 49– 54 [DOI] [PubMed] [Google Scholar]
- 27.Kowalczyk A. P., Bornslaeger E. A., Borgwardt J. E., Palka H. L., Dhaliwal A. S., Corcoran C. M., Denning M. F., Green K. J. ( 1997) The amino-terminal domain of desmoplakin binds to plakoglobin and clusters desmosomal cadherin-plakoglobin complexes. J. Cell Biol 139, 773– 784 [DOI] [PMC free article] [PubMed] [Google Scholar]
- 28.Gaudry C. A., Palka H. L., Dusek R. L., Huen A. C., Khandekar M. J., Hudson L. G., Green K. J. ( 2001) Tyrosine phosphorylated plakoglobin is associated with desmogleins but not desmoplakin after EGFR activation. J. Biol. Chem 276, 24871– 24880 [DOI] [PubMed] [Google Scholar]
- 29.Craig R., Beavis R. C. ( 2003) A method for reducing the time required to match protein sequences with tandem mass spectra. Rapid Commun. Mass Spectrom 17, 2310– 2316 [DOI] [PubMed] [Google Scholar]
- 30.Craig R., Cortens J. P., Beavis R. C. ( 2004) Open source system for analyzing, validating, and storing protein identification data. J. Proteome Res 3, 1234– 1242 [DOI] [PubMed] [Google Scholar]
- 31.Keller A., Nesvizhskii A. I., Kolker E., Aebersold R. ( 2002) Empirical statistical model to estimate the accuracy of peptide identifications made by MS/MS and database search. Anal. Chem 74, 5383– 5392 [DOI] [PubMed] [Google Scholar]
- 32.Nesvizhskii A. I., Keller A., Kolker E., Aebersold R. ( 2003) A statistical model for identifying proteins by tandem mass spectrometry. Anal. Chem 75, 4646– 4658 [DOI] [PubMed] [Google Scholar]
- 33.Langhofer M., Hopkinson S. B., Jones J. C. ( 1993) The matrix secreted by 804G cells contains laminin-related components that participate in hemidesmosome assembly in vitro. J. Cell Sci 105, 753– 764 [DOI] [PubMed] [Google Scholar]
- 34.Fischer F., Wolters D., Rögner M., Poetsch A. ( 2006) Toward the complete membrane proteome: high coverage of integral membrane proteins through transmembrane peptide detection. Mol. Cell. Proteomics 5, 444– 453 [DOI] [PubMed] [Google Scholar]
- 35.Zanivan S., Gnad F., Wickström S. A., Geiger T., Macek B., Cox J., Fässler R., Mann M. ( 2008) Solid tumor proteome and phosphoproteome analysis by high resolution mass spectrometry. J. Proteome Res 7, 5314– 5326 [DOI] [PubMed] [Google Scholar]
- 36.Braun G. S., Kretzler M., Heider T., Floege J., Holzman L. B., Kriz W., Moeller M. J. ( 2007) Differentially spliced isoforms of FAT1 are asymmetrically distributed within migrating cells. J. Biol. Chem 282, 22823– 22833 [DOI] [PubMed] [Google Scholar]
- 37.O'Toole E. A. ( 2001) Extracellular matrix and keratinocyte migration. Clin. Exp. Dermatol 26, 525– 530 [DOI] [PubMed] [Google Scholar]
- 38.Powell A. M., Sakuma-Oyama Y., Oyama N., Black M. M. ( 2005) Collagen XVII/BP180: a collagenous transmembrane protein and component of the dermoepidermal anchoring complex. Clin. Exp. Dermatol 30, 682– 687 [DOI] [PubMed] [Google Scholar]
- 39.Lo Muzio L., Santarelli A., Panzarella V., Campisi G., Carella M., Ciavarella D., Di Cosola M., Giannone N., Bascones A. ( 2007) Oral squamous cell carcinoma and biological markers: an update on the molecules mainly involved in oral carcinogenesis. Minerva Stomatol 56, 341– 347 [PubMed] [Google Scholar]
- 40.Kramer R. H., Shen X., Zhou H. ( 2005) Tumor cell invasion and survival in head and neck cancer. Cancer Metastasis Rev 24, 35– 45 [DOI] [PubMed] [Google Scholar]
- 41.Chidgey M., Dawson C. ( 2007) Desmosomes: a role in cancer? Br. J. Cancer 96, 1783– 1787 [DOI] [PMC free article] [PubMed] [Google Scholar]
- 42.Klessner J. L., Desai B. V., Amargo E. V., Getsios S., Green K. J. ( 2009) EGFR and ADAMs cooperate to regulate shedding and endocytic trafficking of the desmosomal cadherin desmoglein 2. Mol. Biol. Cell 20, 328– 337 [DOI] [PMC free article] [PubMed] [Google Scholar]
- 43.Mercurio A. M., Rabinovitz I., Shaw L. M. ( 2001) The alpha 6 beta 4 integrin and epithelial cell migration. Curr. Opin. Cell Biol 13, 541– 545 [DOI] [PubMed] [Google Scholar]
- 44.LeBaron R. G., Bezverkov K. I., Zimber M. P., Pavelec R., Skonier J., Purchio A. F. ( 1995) Beta IG-H3, a novel secretory protein inducible by transforming growth factor-beta, is present in normal skin and promotes the adhesion and spreading of dermal fibroblasts in vitro. J. Invest. Dermatol 104, 844– 849 [DOI] [PubMed] [Google Scholar]
- 45.Ohno S., Noshiro M., Makihira S., Kawamoto T., Shen M., Yan W., Kawashima-Ohya Y., Fujimoto K., Tanne K., Kato Y. ( 1999) RGD-CAP ((beta)ig-h3) enhances the spreading of chondrocytes and fibroblasts via integrin alpha(1)beta(1). Biochim. Biophys. Acta 1451, 196– 205 [DOI] [PubMed] [Google Scholar]
- 46.Evers E. E., Zondag G. C., Malliri A., Price L. S., ten Klooster J. P., van der Kammen R. A., Collard J. G. ( 2000) Rho family proteins in cell adhesion and cell migration. Eur. J. Cancer 36, 1269– 1274 [DOI] [PubMed] [Google Scholar]
- 47.Kim J. E., Kim S. J., Jeong H. W., Lee B. H., Choi J. Y., Park R. W., Park J. Y., Kim I. S. ( 2003) RGD peptides released from beta ig-h3, a TGF-beta-induced cell-adhesive molecule, mediate apoptosis. Oncogene 22, 2045– 2053 [DOI] [PubMed] [Google Scholar]
- 48.Skonier J., Bennett K., Rothwell V., Kosowski S., Plowman G., Wallace P., Edelhoff S., Disteche C., Neubauer M., Marquardt H., Rodgers J., Purchio A. F. ( 1994) beta ig-h3: a transforming growth factor-beta-responsive gene encoding a secreted protein that inhibits cell attachment in vitro and suppresses the growth of CHO cells in nude mice. DNA Cell Biol 13, 571– 584 [DOI] [PubMed] [Google Scholar]
- 49.Ahmed F. E. ( 2009) Sample preparation and fractionation for proteome analysis and cancer biomarker discovery by mass spectrometry. J. Sep. Sci 32, 771– 798 [DOI] [PubMed] [Google Scholar]
- 50.Washburn M. P., Wolters D., Yates J. R., 3rd ( 2001) Large-scale analysis of the yeast proteome by multidimensional protein identification technology. Nat. Biotechnol 19, 242– 247 [DOI] [PubMed] [Google Scholar]
- 51.Liu H., Sadygov R. G., Yates J. R., 3rd ( 2004) A model for random sampling and estimation of relative protein abundance in shotgun proteomics. Anal. Chem 76, 4193– 4201 [DOI] [PubMed] [Google Scholar]
- 52.Ong S. E., Blagoev B., Kratchmarova I., Kristensen D. B., Steen H., Pandey A., Mann M. ( 2002) Stable isotope labeling by amino acids in cell culture, SILAC, as a simple and accurate approach to expression proteomics. Mol. Cell. Proteomics 1, 376– 386 [DOI] [PubMed] [Google Scholar]
- 53.Smolka M. B., Zhou H., Purkayastha S., Aebersold R. ( 2001) Optimization of the isotope-coded affinity tag-labeling procedure for quantitative proteome analysis. Anal. Biochem 297, 25– 31 [DOI] [PubMed] [Google Scholar]
- 54.Wiese S., Reidegeld K. A., Meyer H. E., Warscheid B. ( 2007) Protein labeling by iTRAQ: a new tool for quantitative mass spectrometry in proteome research. Proteomics 7, 340– 350 [DOI] [PubMed] [Google Scholar]
- 55.Karty J. A., Reilly J. P. ( 2005) Deamidation as a consequence of beta-elimination of phosphopeptides. Anal. Chem 77, 4673– 4676 [DOI] [PubMed] [Google Scholar]
- 56.Than M. E., Henrich S., Huber R., Ries A., Mann K., Kühn K., Timpl R., Bourenkov G. P., Bartunik H. D., Bode W. ( 2002) The 1.9-A crystal structure of the noncollagenous (NC1) domain of human placenta collagen IV shows stabilization via a novel type of covalent Met-Lys cross-link. Proc. Natl. Acad. Sci. U.S.A 99, 6607– 6612 [DOI] [PMC free article] [PubMed] [Google Scholar]
- 57.Vanacore R. M., Friedman D. B., Ham A. J., Sundaramoorthy M., Hudson B. G. ( 2005) Identification of S-hydroxylysyl-methionine as the covalent cross-link of the noncollagenous (NC1) hexamer of the alpha1alpha1alpha2 collagen IV network: a role for the post-translational modification of lysine 211 to hydroxylysine 211 in hexamer assembly. J. Biol. Chem 280, 29300– 29310 [DOI] [PubMed] [Google Scholar]
Associated Data
This section collects any data citations, data availability statements, or supplementary materials included in this article.