

Abstract
Objectives
This study assessed whether ultra-small particles of iron oxide (USPIO) intravascular contrast agent could enhance visualization of tumor microvascularity in F98 glioma bearing rats by means of ultra high field (UHF) high-resolution gradient echo (GRE) magnetic resonance imaging (MRI). In an effort to explain differences in visualization of microvascularity before and after USPIO administration, hypoxia and vessel diameters were assessed on corresponding histopathologic sections.
Materials and Methods
F98 glioma cells were implanted stereotactically into the brains of syngeneic Fischer rats. Based on clinical criteria, rats were imaged 1 to 2 days before their death with and without USPIO contrast on an 8 Tesla MRI. To identify hypoxic regions of the brain tumor by immunohistochemical, a subset of animals also received a nitroimidazole-based hypoxia marker, EF5, before euthanasia. These sections then were compared with noncontrast enhanced MR images. The relative caliber of tumor microvasculature, compared with that of normal brain, was analyzed in a third group of animals.
Results
After USPIO administration, UHF high-resolution GRE MRI consistently predicted increased microvascular density relative to normal gray matter when correlated with histopathology. The in-plane visibility of glioma microvascularity in 22 rats increased by an average of 115% and signal intensity within the tumor decreased by 13% relative to normal brain. Tumor microvascularity identified on noncontrast MR images matched hypoxic regions identified by immunohistochemical staining with a sensitivity of 83% and specificity of 89%. UHF GRE MRI was able to resolve microvessels less than 20 μ in diameter, although differences in tumor vessel size did not consistently account for differences in visualization of microvascularity.
Conclusions
USPIO administration significantly enhanced visualization of tumor microvascularity on gradient echo 8 T MRI and significantly improved visualization of tumor microvascularity. Microvascularity identified on pre-contrast images is suspected to be partly associated with hypoxia.
Keywords: 8T MRI, USPIO, tumor, hypoxia, microvascularity, SHU 555C
Improved signal-to-noise ratio with ultra high field (UHF) 8 T magnetic resonance imaging (MRI) allows acquisition of high- resolution (HR) images of the central nervous system. One major advantage of UHF MRI has been its ability to delineate cortical vascular anatomy.1 MRI (8 T) can resolve microvessels with a diameter as small as 100 μm, using gradient echo (GRE) sequences with an in-plane resolution of 196 μm in normal human brain2–4 and in glial tumors.5,6 This 100-micron dimension is smaller than the voxel size used in acquisition, although the paramagnetic properties of deoxyhemoglobin, combined with increasing magnetic susceptibility effects at high field, allow microvessels to be resolved on T2*-weighted images.3,7 Ultra-small superparamagnetic particles of iron oxide (USPIO) are intravascular magnetic resonance (MR) contrast agents that have been shown to increase microvascular visibility in rats by means of UHF MRI on GRE sequences.8–11 On the basis of these observations, we hypothesized that USPIO contrast agents could be used to enhance the resolution of microvasculature within the F98 rat glioma and allow us to assess microvascularity by visual inspection. As a secondary aim, this work evaluated discrepancies in the visualization of microvascularity within the tumor bed between contrast and noncontrast enhanced images. Vessel size and presence of deoxyhemoglobin were considered as possible explanations for discrepancies. With this in mind, the areas of microvascularity identified on unenhanced GE MRI were compared with regions of hypoxia identified by immunohistochemical (IHC) stained sections. To determine whether the visualization of the microvasculature on noncontrast images was because of enlarged microvessels within the tumor, microvessel caliber was measured on histologic sections and compared with images. The primary purpose of this study, however, was to determine whether visualization of tumoral microvascularity on UHF HR GRE MRI within the F98 glioma improves with the addition of USPIO contrast agent.
MATERIALS AND METHODS
Tumor Model
This study was performed in accordance with the guidelines of the National Institutes of Health and the protocol was approved by the Ohio State University Institutional Animal Care and Use Committee. Twenty-seven male Fischer 344 rats (Charles River Laboratories, Wilmington, MA), weighing 200 to 240 g, were implanted intracerebrally) with F98 glioma cells.12–15 Briefly, rats were anesthetized with ketamine/xylazine, placed in a stereotactic headframe (David Kopf Instruments, Tujunga, CA), and 105 F98 cells were implanted into the right caudate nucleus. Cells were suspended in 10 μL of serum-free Dulbecco modified Eagle medium containing 1.4% agarose with a low-gelling temperature (<30°C) and injected over 10 to 15 seconds through a central entry port of a plastic screw (Arrow Machine Manufacturing Inc., Richmond, VA) that had been embedded in the skull. Approximately 3 weeks later, when the animals began to display clinical signs of impending death (weight loss, ataxia, periorbital hemorrhage), they were imaged. All rats underwent imaging with and without USPIO as well as hematoxylin and eosin (H and E) histopathology. A group of 9 rats underwent IHC stain for hypoxia and another group of 9 rats underwent intravascular formalin fixation for vessel size measurements (Fig. 1).
FIGURE 1.
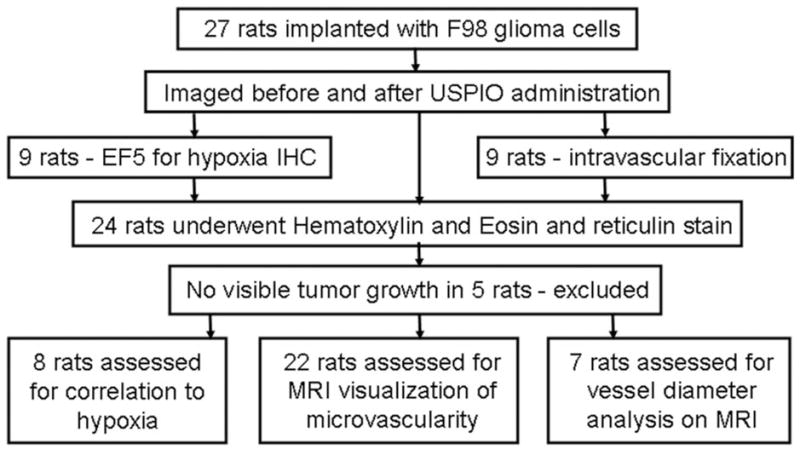
Overview of experiments. Rodents were implanted with F98 glioma cells and imaged. They were subsequently prepared for histopathology. A total of 20 rodents were included in the analysis (see text).
MR Imaging
Anesthesia initially was induced by spontaneous inhalation of 5% isoflurane, mixed with O2, at a rate of 1000 mL/min, and after endotracheal intubation, it was continued using 1.5% to 2% isoflurane, mixed in 500 mL/min of 100% O2. To facilitate injection of USPIO and EF5, a 0.47-mm outer-diameter silicone cannula, filled with 2% heparin, was inserted into the right femoral vein. Body temperature was maintained at 37° ± 1°C during the operative procedure by means of a preheated isothermal pad (Deltaphase, Braintree Scientific, MA). Animals then were mounted on a custom-made 4-cm diameter birdcage coil, which was tuned to the head of the rat at 340 MHz. Sixteen 1-mm thick (0.1 mm gap) coronal images were acquired using a T2*-weighted GRE sequence (TR/TE: 600/14.6 milliseconds, flip angle: 45 degrees, number of excitations = 2, field of view = 4.0 × 4.0 cm, matrix = 512 × 512, acquisition time: 10 minutes 34 seconds, and 78 μm in-plane resolution), and a rapid acquisition with relaxation enhancement sequence (TR/TE: 5000/18.4 milliseconds, rapid acquisition with relaxation enhancement factor = 4, number of excitations = 1, field of view = 4.0 × 4.0 cm, matrix = 256 × 256, slice thickness = 1 mm with 0.1 mm gap, acquisition time: 5 minutes 20 seconds, and in-plane resolution of 156 μm). A second set of GRE images were acquired approximately 30 to 60 seconds after infusion of USPIO (2 mg Fe/kg) (SHU 555 C, Supravist, Bayer Healthcare AG, Berlin) administration. The USPIO dose previously had been optimized for the imaging parameters used in this study.9 The SHU 555 C solution was diluted with 0.9% sodium chloride to 0.1 mmol/mL at room temperature before injection. To facilitate pre- and postcontrast image comparisons, the rats’ position remained constant within the magnet throughout all imaging.
In Vivo Preparations for Hypoxia IHC With EF5, Animal Euthanization, and Fixation
The nitroimidazole EF5 (2-(2-nitro-1H-imidazol-1-yl)-N-(2,2,3,3,3-pentafluoro-propyl) acetamide) (provided by Cameron Koch, University of Pennsylvania) previously has been employed as a marker for hypoxia and this has been described in detail elsewhere.16–18 Briefly, 10 mM EF5 (dissolved in 5% glucose) was administered intravenously in a volume equal to 1% of the animal body weight (2.0–2.4 mL) at a rate of 1 mL/min. Animals were euthanized 2 hours later to allow for adequate binding of EF5 to hypoxic tissue. All but 9 animals were euthanized under anesthesia by decapitation, using a guillotine (Braintree Scientific, Braintree, MA) and their brains were removed immediately and frozen on dry ice for 2 minutes, after which coronal brain sections were cut at 2 mm intervals. Brain sections from rats that had received EF5 were stored in liquid nitrogen. The brains of the other 9 rats were set aside for H and E and reticulin staining to assess vessel caliber. Anesthetized rats were perfused intracardially at ambient temperature with 100 mL of phosphate buffered saline (PBS) followed by 80 mL 10% formaldehyde, after which their brains were removed and fixed in 10% formaldehyde for 24 hours before H and E and reticulin staining was carried out.
Histopathologic and IHC Staining for Hypoxia
Brain sections were placed on separate paraffin blocks. From each block, one 5-μm slice was cut for H and E staining and a second slice was cut for reticulin staining. In addition, one 10 μm thick section was cut from the brains of tumor-bearing animals that had received EF5 for IHC analysis. The detailed procedure for in vivo EF5-hypoxia IHC staining has been described previously.17,19 Briefly, each IHC slice was fixed using acetone for 5 minutes. and immersed in PBS at 0°C. The monoclonal antibody (mAb), ELK3-51 was kindly provided by Dr Koch, University of Pennsylvania, and this had been conjugated to Cy3, a red fluorochrome. Each slide was rinsed, blocked, and stained with ELK3-51:Cy3 at a concentration of 75 μg/mL. Photomicrographs were taken using a Nikon immunofluorescent microscope (E800, Nikon) equipped with an automatic stage (Proscan Motorized stage system, Prior scientific, MA). Each IHC or immunofluorescent image was overlaid on both the corresponding GRE MR image and the H and E slide for comparison.
Identification and Histopathologic Confirmation of Tumor Microvascularity
Tumors were identified on GRE images and correlated to histopathologic sections to confirm that increased microvascularity observed on UHF GRE MRI corresponded to increased microvascularity, as determined by histopathologic examination. Microvascularity was assessed on images which include the tumor. The presence of serpiginous flow voids was used to identify a focus of microvascularity on UHF GRE MRI. Furthermore, microvessels would be expected to lose signal after intravascular contrast administration. Increased tumor microvascularity was assessed relative to microvascular appearance in the normal cortex of the contralateral cerebral hemisphere. There was some concern that foci of microhemorrhage might be confused with foci of microvascularity. Features distinguishing microhemorrhage from microvascularity were defined before image analysis. In general, foci of microvascularity contained serpiginous signal voids, whereas foci of hemorrhage tend to produce a more globular appearance. Signal loss relative to normal brain after contrast administration indicated that the focus under examination more likely was related to microvascularity because USPIO remains intravascular for at least 90 minutes following injection and imaging is performed within 11 minutes following injection10,20–23 (Fig. 2).
FIGURE 2.
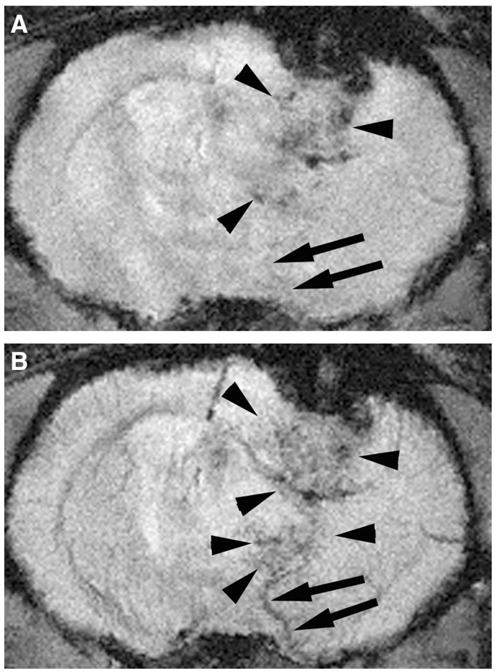
UHF GRE MRI of a tumor bearing rodent brain before (A) and after USPIO administration (B). Tumor microvessels are more readily identified on postcontrast images as serpiginous structures (arrowheads) that enhance after USPIO administration. The enlarged venous structure draining the tumor is more readily recognized on the postcontrast images (arrows). This draining vein is readily distinguished from tumor microvascularity (arrowheads). Note the relative enlargement of veins which drain tumor bed (arrows) compared with comparable vessels on the normal contralateral hemisphere.
Identification of foci of increased tumor microvascularity on MRI relative to that within gray matter was confirmed by histopathologic findings. It was hypothesized that increased visibility of tumoral microvasculature relative to normal brain would correspond to increased tumoral microvascular density on histopathology. A single MRI slice was chosen through the center of the neoplasm for each tumor-bearing rat. Three types of foci not larger than 3 millimeters were identified: the first showing increased microvascularity on the noncontrast images, the second showing increased microvascularity on the contrast image only, and the third showing no increase in microvascularity. Foci selected were thought to be unambiguously representative of each type of focus. An automated co-registration method was not possible because of distortion introduced by tissue preparation. Tissue specimens from the central portion of the tumor were used for comparison. The images were examined visually and histopathologic slices were chosen based on adjacent anatomic structures. MR images were reviewed by 4 radiologists (G.C., M.Y., M.K., D.L.). Histopathologic specimens were reviewed by 2 pathologists (A.C., R.B.) for the presence of increased microvascularity within predefined imaging foci visually coregistered on reticulin and H and E stained sections relative to normal gray matter in the contralateral normal brain on visual inspection. Coregistration was on the basis of the nearest anatomic structures, such as the ventricle, the caudate nucleus on the site of tumor cell implantation. Tissue sections were evaluated for increased microvascularity relative to normal brain tissue, as well as for the presence of hemorrhagic foci.
Quantitation of Tumor Microvascularity
Methods for assessing tumor microvascularity by 8 T MRI before and after contrast administration were reviewed and validated. These included: (1) measurement of in-plane visibility of increased tumor microvascularity on imaging, and (2) measurement of signal loss within this same measured tumoral microvascularity. On each GRE UHF MRI slice before and after contrast administration which displayed the tumor, the area within the tumor that the radiologist interpreted to represent tumoral microvascularity—based on the criteria described above—was manually outlined using image analysis software (MIPAV 2.7, NIH). Both the area and signal intensity were measured. Total in-plane visibility was calculated by summing the area measured of each slice and multiplying it by the slice thickness. In-plane visibility is thus a volume estimate. The difference in in-plane visibility of microvascularity visualized before and after contrast administration was calculated and the percent difference relative to preinjection in-plane visibility was determined.
Signal loss within the areas outlined after contrast administration was assessed relative to the signal within normal cortical brain tissue. The ratios of the average signal from the areas outlined for microvascular in-plane visibility to the average signal from normal brain in the contralateral nontumor-bearing cerebral hemisphere were measured and calculated before and after USPIO administration. For each pre- and postcontrast image, the exact same area outlined on the postcontrast image was superimposed on the precontrast image. Because the rats were not moved during administration of USPIO, it was possible to use the exact same areas before and after contrast administration (Fig. 3). Average signal measurements, therefore, were calculated from identical areas of both abnormal and normal brain within the contralateral hemisphere before and after contrast administration. The average signal measured from each image was weighted for the number of pixels outlined on the image.
FIGURE 3.
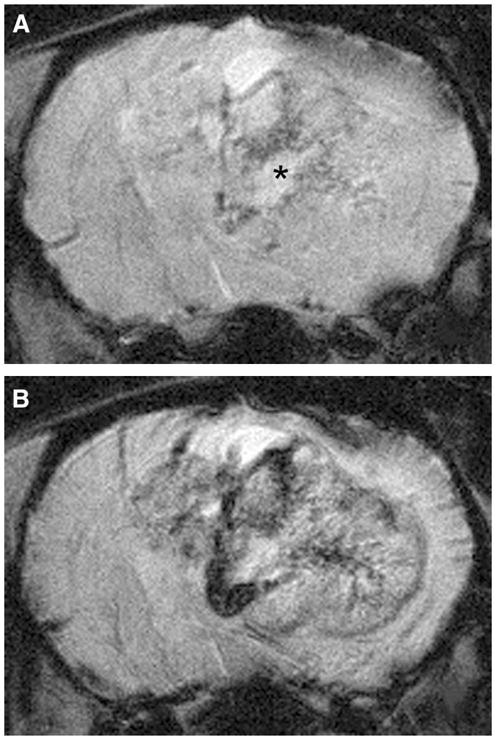
Enhanced visualization of microvascularity within the F98 glioma using USPIO as an intravascular contrast agent. F98 glioma bearing rats were imaged without (A) and following USPIO administration (B). Note the enhanced visualization of hypointense serpiginous vessels within the tumor. Microvascularity within the noncontrast images surrounding the area of necrosis (asterisk, A) is where tumor hypoxia is typically found.
Comparison of MR Imaging to Histopathologic Specimens for Tumor Microvascular Size
Histopathologic sections from rats killed by intracardiac injection of PBS and formaldehyde were compared with UHF GRE MRI images to assess the microvascular size detected. The MR images were visually inspected for tumor microvascular structures. On the basis of adjacent anatomic structures, as described earlier, corresponding histopathologic sections were selected. Within the tumor bed, the largest vessels visible on postcontrast images were presumed to be the largest vessels visible on histolopathologic sections. Their diameter was measured with a micrometer to estimate of vessel size visible on HR GE UHF MRI (Fig. 4).
FIGURE 4.
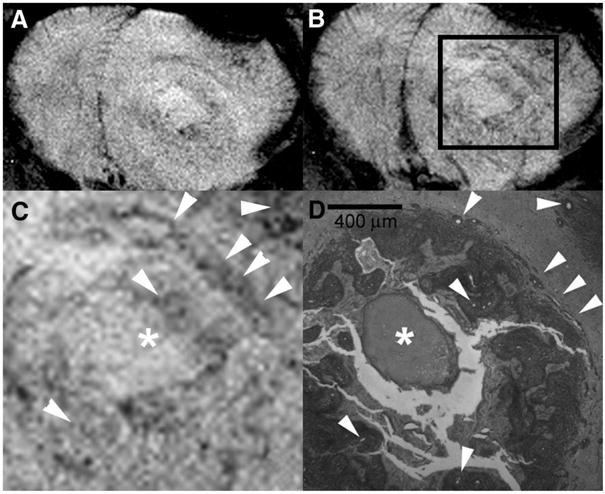
UHF GRE HR MRI of the brain of F98 glioma bearing rat before (A) and after (B) USPIO administration with magnification (C) of the area within the box (B) is compared with a corresponding histopathologic section (40×) using reticulin stain (D) in a rat that received an intracardiac injection of formalin. Arrowheads indicate vessels within the tumor and the asterisk depicts a focus of necrosis. Assessment of tumoral microvessel diameters measured on histopathology (D) indicate that there was often a difference in microvessel diameter between vessels identified on the precontrast images (A) and those identified only on the postcontrast images (B). Microvessels at least as small as 20 μm diameter are visualized.
Comparison of MR Imaging to Histopathologic and IHC Analysis for Tumor Hypoxia
To determine whether regions, which were thought to show tumor microvascularity on noncontrast MRI, were associated with hypoxic tumor tissue, MR images were compared with H and E and IHC stained sections. Two or 3 8 T images derived from the central portion of each tumor was chosen and 4 foci were selected from each slice. At least 2 foci were from areas of microvascularity, identified on precontrast images, 1 from an area, identified as microvascularity on postcontrast images but not the precontrast images, and 1 in which no microvascularity was identified on either pre- or postcontrast imaging. The microvascular foci identified on imaging were then coregistered to the IHC stained sections that were overlaid on H and E stained sections by visually assessing their spatial relation to known anatomic structures (Fig. 5). The MR images were reviewed by 2 radiologists (G.C., M.Y.) and the histopathologic specimens were reviewed by a neuropathologist (A.R.C.). Contingency analysis was used to determine correlation between imaging analysis and histopathologic analysis. Agreement between imaging and histopathologic analysis was assessed using the kappa statistic.
FIGURE 5.

UHF GRE HR MRI of a F98 glioma bearing rat before (A) and after (B) USPIO administration compared with EF5 IHC stain for hypoxia (red), overlaid on to corresponding H and E stained section (C). Note the concurrence between the regions of hypoxia identified with the EF5 stain (C) and the areas of microvascularity identified on the noncontrast 8 T image (A). Hypoxic regions primarily surround the central area of necrosis, Microvascularity along the periphery of the tumor identified on the postcontrast images does not correspond to the hypoxic regions.
Statistical Analysis
Statistical analysis was performed using JMP 5.1 software (SAS; Cary, NC). For identification of presence of microvascularity, contingency analysis was used to determine correlation between imaging analysis and histopathologic analysis. Agreement between imaging and histopathologic analysis was assessed using the kappa statistic. For in-plane visibility of microvascularity and signal loss relative to the normal brain, interobserver reproducibility was calculated using the Bland-Altman method in 10 rats studied by 2 independent observers.24 Matched pair analysis was used to determine whether a significant difference in in-plane visibility and ratio of microvascular signal intensity to normal brain existed before versus after contrast administration and the percent signal loss within the tumor bed after USPIO administration relative to normal brain tissue. A bivariate linear fit was used to determine whether a correlation existed between tumor in-plane visibility and relative signal intensity before and after contrast administration.
RESULTS
Identification and Histopathologic Confirmation of Tumor Microvascularity
Comparison of histopathologic sections, coregistered to regions of interest on postcontrast 8 T MRI, indicated a statistically significant correlation between the visualization of increased microvascular density relative to normal brain on the 8 T image to that of the tissue section. Increased microvascular density relative to normal brain was considered to be either present or absent. There was agreement in 57 of 57 foci on the contrast enhanced images (κ = 0.99) and 38 of 57 in the noncontrast images with 33% false negatives and no false positives for increased microvascularity (κ = 0.41).
Quantitation of Tumor Microvascularity
Matched pair analysis indicated that the in-plane visibility of microvascularity visualized within the tumor on GRE HR UHF MRI increased from 77.8 (σ = 59.0) mm3 to 158.6 (σ = 102.4) mm3 after contrast administration (P < 0.0001; t test; correlation = 0.9619; matched pairs analysis). The average percent increase in in-plane visibility of microvascularity was 123.6% (σ = 62.8). A linear relationship was found between the in-plane visibility of microvascularity within the tumor visualized before and after contrast administration (Fig. 6). Interobserver reproducibility for in-plane visibility of microvascularity using the Bland-Altman statistic24 is reported on Table 1.
FIGURE 6.

Bivariate linear fit for calculated in-plane visibility of microvascularity (MV) before (x-axis) versus after (y-axis) USPIO administration. The derived linearly fitted equation is: post contrast MV = 1.67 (precontrast MV) + 28 (P < 0.0001; r-square = 0.93). This indicates that USPIO significantly increases visualization of microvessels using UHF HR GRE MRI.
TABLE 1.
Bland-Altman Assessment of Reproducibility for Quantitative Measures
| Measurement | Mean | Mean difference | 95% CI | Mean ICC | Individual ICC |
|---|---|---|---|---|---|
| IPV before USPIO | 75.71 | −2.47 | 47.7–98.8 | 0.9875 | 0.9737 |
| IPV after USPIO | 152.6 | −3.43 | 92.6–205.7 | 0.9679 | 0.9377 |
| % increase IPV | 119.9 | +2.99 | 63.7–170.3 | 0.8817 | 0.7884 |
| RSI before USPIO | 0.955 | 0.0227 | 0.896–1.06 | 0.9639 | 0.9303 |
| RSI after USPIO | 0.803 | 0.00127 | 0.692–0.917 | 0.9359 | 0.8794 |
| % signal loss | 15.8 | 1.74 | 11.6–23.4 | 0.9311 | 0.8710 |
Reproducibility of microvascular quantitation between 2 observers and across 10 rats. Intraclass correlation (ICC) assumes the same raters rate all cases and the raters are a subset of a larger set of raters.
IPV indicates in-plane visibility of tumoral microvascularity; RSI, ratio of tumoral microvascular signal intensity to normal contralateral brain; % signal loss, percentage change in RSI before versus after USPIO administration.
The ratio of signal intensity within the areas of microvascularity in the tumor relative to normal brain was 0.921 (σ = 0,116) before contrast administration and 0.774 (σ = 0.101) after contrast administration. Matched pairs analysis indicated that the signal intensity within the tumor-bearing region relative to the nontumor-bearing hemisphere decreased by an average of 14.7% (95% CI = [11.4–18.0]; correlation = 0.771; P < 0.0001) after USPIO administration. A linear relationship was identified between the ratio of the tumor signal intensity relative to normal brain before and after contrast administration (Fig. 7). Tumor signal intensity after contrast administration was always lower than normal brain tissue. Inter-observer reproducibility for microvascular signal calculations using the Bland-Altman statistic24 are reported on Table 1. In tumors containing a necrotic focus (n = 12), confirmed by histopathologic examination, this part of the tumor demonstrated no signal loss (0.1%; σ = 0.8%).
FIGURE 7.

Bivariate linear fit for ratio of signal intensity derived from entire volume of tumoral microvascularity relative to normal contralateral brain (rSI) before (x-axis) versus after (y-axis) USPIO administration. The derived linearly fitted equation is: post USPIO rSI = 0.67 (precontrast rSI) + 0.15 (P < 0.0001; r-square = 0.59). The dashed line represents the point at which the relative tumor signal loss before versus after USPIO administration would be equal. All points fall below the dashed line indicating that a greater concentration of USPIO is present within this tumor at the time of imaging. Because USPIO at the time of imaging is expected to be entirely intravascular, this suggests that tumor microvascular density within the F98 glioma is greater than that of normal tissue.
Comparison of MR Imaging to Histopathologic Specimens for Tumor Microvascular Size
Vessel size determination on histopathologic specimens, prepared after intracardiac formalin infusion, coregistered to 8 T MRI images indicated that vessels less than 20 μm in diameter were visible following contrast administration. The same vessels were not consistently identified on noncontrast images (Fig. 4).
Comparison of MR Imaging to Histopathologic and IHC Analysis for Tumor Hypoxia
Foci of tumor microvascularity, identified on precontrast images, were coregistered to IHC specimens (Fig. 5). Analysis of 76 regions of interest for hypoxia identified 5.3% false positive and 9.2% false negative readings from the MR images (Table 2) using the IHC specimens as the standard for hypoxia. UHF HR GRE MRI has 82.9% sensitivity and 88.5% specificity for hypoxia (κ = 0.71).
TABLE 2.
Correlation of Regions of Hypoxia and Microvascularity
| Regions demonstrating hypoxia on both UHFMRI and EF5 IHC | 34/38 |
| Regions demonstrating no hypoxia on both UHFMRI and EF5 IHC | 31/38 |
| Total | 4 (5.3%) false positives |
| 7 (9.2%) false negatives |
Seventy-six regions of interest were obtained from 8 rats which underwent 8 T high resolution gradient echo MRI and were also stained for hypoxia using IHC EF5 nitroimidazole staining (see text). There was a high degree of correlation between the regions of interest selected.
DISCUSSION
As previously reported, microvascularity within high grade gliomas can be visualized directly on HR GRE UHF MRI.5,6,9,25 In the present study we have demonstrated that the use of USPIO as a blood pool agent enhanced the visualization of microvessels in the F98 glioma using HR GRE UHF MRI. Theoretically, visualization of microvascularity before contrast administration could have been due to vessel size or paramagnetic effects attributable to deoxyhemoglobin, which may be a surrogate marker for tumor hypoxia.12 Histopathologic and IHC analysis suggested that enhanced visualization of microvascularity before the administration of USPIO may have been associated with tissue hypoxia. Higher grade gliomas tend to form areas of necrosis with surrounding hypoxic zones. Identifying hypoxic regions could assist in the planning of external beam radiation and chemotherapy because hypoxia is associated with lower tumor susceptibility to these treatment modalities.26–35 Although not clear on the basis of results presented here, use of deoxyhemoglobin as a surrogate marker for hypoxia may deserve further exploration. Increased microvascularity within gliomas has been shown to correlate with tumor aggressiveness and thereby provide a target for the selection of a biopsy site, as well as for therapy.25,36,37 MRI methods, previously shown to correlate with microvascularity within gliomas, primarily have measured cerebral blood volume using time-dependant acquisitions and differentiate brain tissue using functional parameters.38–41 In contrast, direct visualization of tumor microvascularity, on static images as shown in the present study, provides higher resolution images relative to dynamic acquisitions and differentiate tissues based on anatomic parameter. This method could serve as an alternative or complimentary method and may be acquired following at dynamic acquisition whether USPIO is used as the contrast agent.
Because of T2* influencing factors, gradient echo acquisitions are especially sensitive to paramagnetic and superparamagnetic agents such as iron and deoxyhemoglobin, and relaxation rates increase as a function of the concentration of the latter.42 Intravascular susceptibility effects of deoxyhemoglobin and USPIO are influenced by geometric factors, such as vessel size and spacing of field inhomogenities, rate of water diffusion, field strength, echo times, as well as the orientation of the blood vessels relative to the magnetic field.43–45 Microvascularity identified on UHF HR GRE MRI, correlated better with histopathologic findings on contrast compared with noncontrast enhanced images. Visualization of microvessels on noncontrast images could have been due to susceptibility effects from either deoxyhemoglobin within dilated vessels or hemosiderin, deposited adjacent to microvessels. In the present study, hemosiderin deposition rarely was identified within the tumor on H and E stained sections. Determination of the presence versus absence of microvascularity on post-intravascular contrast imaging, may serve as a reproducible method for assessing tumor microvascularity. Foci of increased microvascularity, identified on postcontrast images, were highly sensitive and specific for increased microvascularity, as determined by histopathologic analysis.
Susceptibility effects from the superparamagnetic USPIO contrast agent, used in this study, significantly enhanced the detection of microvascularity within the tumor relative to noncontrast images. Both an increase in the extent of microvascularity within the tumor and signal loss because of the presence of the intravascular contrast agent was detected. Susceptibility effects induced by iron particles in blood vessels shortened the transverse T2 and T2* relaxation times and caused signal loss on T2* sensitive sequences. Susceptibility effects were enhanced in this study via the use of long TE and a field strength of 8 T. USPIO has a prolonged intravascular half-life, varying from 2 to 5 hours in animals, and they have been shown to remain intravascular for 90 minutes.10,20–23 Thus, UHF HR GE MRI immediately after USPIO administration can improve the visualization of microvessels, even with prolonged imaging times without significant leakage of USPIO into the surrounding tissues.10,11,20,46–49 In the present study, images were acquired immediately after administration of the contrast agent to take advantage of the highest possible blood pool concentration of the agent. As a result, signal loss after contrast administration was representative of microvascularity and not permeability. Percent signal loss in this study was approximately 2.6 times greater within the tumor than within normal brain, which indicated that there was increased microvascularity. Furthermore, areas known to be poorly vascularized, such as the necrotic center of the tumor, showed no significant signal loss.
Regions within the tumor in which microvessels were visualized on GRE UHF HR GRE MRI, without USPIO contrast administration (Fig. 5), were more likely to correspond to hypoxic tissue on IHC stained sections than regions within the tumor in which microvessels were only visualized following USPIO administration. This finding is corroborated by previous studies demonstrating that gradient echo imaging methods can detect hypoxic regions in tumors and stroke.12,25,50–55 Alternatively, the presence of deoxyhemoglobin within tumor microvessels could be attributed to their diminished vasoreactivity. Under these circumstances, microvessels within the tumor would perfuse and extract oxygen, but they would have a limited capacity to shunt oxygenated blood toward venous drainage.56–59 As a result, venous drainage would be more likely to contain deoxyhemoglobin. The association between deoxyhemoglobin and hypoxia in the F98 glioma, although frequent, was not constant. Indeed, much like normoxic regions within normal brain, which contain veins and venules carrying deoxyhemoglobin, within the tumor they may also contain deoxyhemoglobin. Variability in the visualization of microvascularity in noncontrast images within the tumor may reflect differences in tumor oxygenation or vasoregulation. The less than absolute specificity and sensitivity of UHF HR GRE MRI to hypoxia observed in the present study suggest that the enhanced visualization of microvessels to deoxyhemoglobin was not entirely explained by hypoxia. Vascular prominence on GRE HR UHF MRI depends on the relative effect of the concentration of deoxyhemoglobin, vessel size, and vasoregulation. Further evaluation of this observation may yield more conclusive results.
Although differences in deoxyhemoglobin concentration within the tumor may be a dominant factor leading to enhanced visualization of microvascularity within the tumor, vessel size also can affect microvessel visualization. It was not possible to determine whether vessel size influenced visibility of microvascularity. Visual inspection of images correspondingly used to explain the enhanced visualization of microvascularity within the tumor on noncontrast images. Comparison of vessel diameters, within the tumors of rats that had received an intracardiac injection of formalin, demonstrated that although diameters within the tumor were often larger than adjacent normal brain, there was no measurable difference in microvessel diameter within regions of the tumor that were identified on noncontrast images relative to those identified only on contrast enhanced images (Fig. 4). This suggests that vessel size alone could not account for the enhanced visualization of microvessels on noncontrast images. Because this corresponded to hypoxia, and vessel size did not differ significantly, observations derived from this study suggest that the enhanced visualization of microvascularity on noncontrast images was influenced more by the concentration of deoxyhemoglobin than vessel diameter.
All of the above notwithstanding, one must be cautious about drawing inferences from a rat glioma to a human brain tumor. Whereas the F98 glioma is highly vascular and it has a number of characteristics in common with glioblastoma multiforme,15,60,61 it is not as infiltrative of normal brain cortex as glioblastoma multiformes, nor is it as histologically pleomorphic. The incidence of hemorrhage identified within tumors imaged for this study was very low. It is suspected that within human gliomas, hemorrhage could interfere with visualization of microvascularity. As a consequence of this, direct inferences of microvascular enhancement identified in this study may not apply to human gliomas. Nevertheless, the results from our study are encouraging and may provide supportive data for the use of USPIO to help visualize tumor microvascularity in human studies. Because the F98 glioma is a highly vascular tumor,62 our study only determined whether intravascular USPIO increased microvascular visualization within this tumor. Whether this is predictive of tumor behavior remains to be determined? Comparison of microvascular enhancement within the F98 glioma to that of other rat glioma models including less aggressive rat gliomas,63–66 or evaluation of microvascularity in varying grades of human gliomas, may help assess whether microvascular enhancement is predictive of outcome or treatment response. Although, volume estimates from MR images are prone to large interobserver variability,66–69 this does not deter from the conclusion that USPIO administration increased microvascular visibility in this study. Further studies are needed, however, to determine the relative contribution of vessel size and deoxyhemoglobin concentration when visualizing microvascularity by means of HR GRE UHF MRI or other susceptibility related effects.70 Some bias was introduced when assessing hypoxic regions, because foci were selected from predefined regions of the tumor bed. As a result, prediction of foci of hypoxia within the tumor bed using the methods described here requires further investigation. Finally, although vessels as small as 20 μm were identified on this study, there is no indication based on results presented here that all vessels larger than 20 μm should be visible using HR GRE UHF MRI.
In conclusion, USPIO administration significantly enhanced the visualization of tumor microvascularity on gradient echo high resolution 8 T MRI in F98 glioma bearing rats. Vessels as small as 20 μ were visualized in this study. Visualization of microvascularity within the tumor on noncontrast images could be partly attributed to presence of deoxyhemoglobin in hypoxic regions and in this context could help identify difficult-to-treat targets for therapy. Although direct visualization of microvascularity within the F98 glioma was possible using GE HR UHF MRI techniques, comparison with other methods which assess microvascularity will help further validate USPIO-enhanced microvascular assessment on GE HR UHF MRI.
Acknowledgments
Supported by NCI grants 1R21CA/NS92846-01A1 (to G.A.C.) and 1R01CA098945 (to R.F.B.)
The authors would like to thank Pierre Robitaille for helpful suggestions, Michelle Basso for immunofluorescence photography, and Cameron Koch of the University of Pennsylvania for providing the EF5 powder.
References
- 1.Burgess RE, Yu Y, Christoforidis GA, et al. Human leptomeningeal and cortical vascular anatomy of the cerebral cortex at 8 Tesla. J Comput Assist Tomogr. 1999;23:850–856. doi: 10.1097/00004728-199911000-00007. [DOI] [PubMed] [Google Scholar]
- 2.Dashner RA, Kangarlu A, Clark DL, et al. Limits of 8-Tesla magnetic resonance imaging spatial resolution of the deoxygenated cerebral microvasculature. J Magn Reson Imaging. 2004;19:303–307. doi: 10.1002/jmri.20006. [DOI] [PubMed] [Google Scholar]
- 3.Christoforidis GA, Bourekas EC, Baujan M, et al. High resolution MRI of the deep Brain vascular anatomy at 8 Tesla: susceptibility-based enhancement of the venous structures. J Comput Assist Tomogr. 1999;23:857–866. doi: 10.1097/00004728-199911000-00008. [DOI] [PubMed] [Google Scholar]
- 4.Dashner RA, Chakeres DW, Kangarlu A, et al. MR Imaging visualization of the cerebral microvasculature: a comparison of live and postmortem studies at 8 T. AJNR. 2003;24:1881–1884. [PMC free article] [PubMed] [Google Scholar]
- 5.Christoforidis GA, Kangarlu A, Abduljalil AM, et al. Susceptibility-based imaging of glioblastoma microvascularity at 8 T: correlation of MR imaging and postmortem pathology. AJNR. 2004;25:756–760. [PMC free article] [PubMed] [Google Scholar]
- 6.Christoforidis GA, Grecula JC, Newton HB, et al. Visualization of microvascularity in glioblastoma multiforme with 8-T high-spatial-resolution MR imaging. AJNR. 2002;23:1553–1556. [PMC free article] [PubMed] [Google Scholar]
- 7.Abduljalil AM, Robitaille PM. Macroscopic susceptibility in ultra high field MRI. J Comput Assist Tomogr. 1999;23:832–841. doi: 10.1097/00004728-199911000-00004. [DOI] [PubMed] [Google Scholar]
- 8.Weissleder R, Elizondo G, Wittenberg J, et al. Ultrasmall superparamagnetic iron oxide: characterization of a new class of contrast agents for MR imaging. Radiology. 1990;175:489–493. doi: 10.1148/radiology.175.2.2326474. [DOI] [PubMed] [Google Scholar]
- 9.Yang M, Christoforidis GA, Figueredo T, et al. Dosage determination of ultrasmall particles of iron oxide for the delineation of microvasculature in the Wistar rat brain. Invest Radiol. 2005;40:655–660. [PMC free article] [PubMed] [Google Scholar]
- 10.Tombach B, Reimer P, Bremer C, et al. First-pass and equilibrium-MRA of the aortoiliac region with a superparamagnetic iron oxide blood pool MR contrast agent (SH U 555 C): results of a human pilot study. NMR Biomed. 2004;17:500–506. doi: 10.1002/nbm.906. [DOI] [PubMed] [Google Scholar]
- 11.Clarke SE, Weinmann HJ, Dai E, et al. Comparison of two blood pool contrast agents for 0.5-T MR angiography: experimental study in rabbits. Radiology. 2000;214:787–794. doi: 10.1148/radiology.214.3.r00mr25787. [DOI] [PubMed] [Google Scholar]
- 12.Kobayashi N, Allen N, Clendenon NR, et al. An improved rat brain-tumor model. J Neurosurg. 1980;53:808–815. doi: 10.3171/jns.1980.53.6.0808. [DOI] [PubMed] [Google Scholar]
- 13.Koestner A, Swenberg JA, Wechsler W. Transplacental production with ethylnitrosourea of neoplasms of the nervous system in Sprague-Dawley rats. Am J Pathol. 1971;63:37–56. [PMC free article] [PubMed] [Google Scholar]
- 14.Ko L, Koestner K, Wechsler W. Morphological characterization of nitrosourea-induced glioma cell lines and clones. Acta Neuropathol (Berl) 1980;51:23–31. doi: 10.1007/BF00688846. [DOI] [PubMed] [Google Scholar]
- 15.Barth RF. Rat brain tumor models in experimental neuro-oncology: the 9L, C6, T9, F98, RG2 (D74), RT-2, and CNS-1 gliomas. J Neurooncol. 1998;36:91–102. doi: 10.1023/a:1005805203044. [DOI] [PubMed] [Google Scholar]
- 16.Lord EM, Harwell L, Koch CJ. Detection of hypoxic cells by monoclonal antibody recognizing 2-nitroimidazole adducts. Cancer Res. 1993;53:5721–5726. [PubMed] [Google Scholar]
- 17.Evans SM, Joiner B, Jenkins WT, et al. Identification of hypoxia in cells and tissues of epigastric 9L rat glioma using EF5 [2-(2-nitro-1H-imidazol-1-yl)-N-(2,2,3,3,3-pentafluoropropyl) acetamide] Br J Cancer. 1995;72:875–882. doi: 10.1038/bjc.1995.427. [DOI] [PMC free article] [PubMed] [Google Scholar]
- 18.Koch CJ, Lord EM, Shapiro IM, et al. Imaging hypoxia and blood flow in normal tissues. Adv Exp Med Biol. 1997;428:585–593. doi: 10.1007/978-1-4615-5399-1_83. [DOI] [PubMed] [Google Scholar]
- 19.Koch CJ, Evans SM, Lord EM. Oxygen dependence of cellular uptake of EF5 [2-(2-nitro-1H-imidazol-1-yl)-N-(2,2,3,3,3-pentafluoropropyl)acetamide]: analysis of drug adducts by fluorescent antibodies vs bound radioactivity. Br J Cancer. 1995;72:869–874. doi: 10.1038/bjc.1995.426. [DOI] [PMC free article] [PubMed] [Google Scholar]
- 20.Dennie J, Mandeville JB, Boxerman JL, et al. NMR imaging of changes in vascular morphology because of tumor angiogensis. Magn Reson Med. 1998;40:793–799. doi: 10.1002/mrm.1910400602. [DOI] [PubMed] [Google Scholar]
- 21.Frericks BB, Wacker F, Loddenkemper C, et al. Magnetic resonance imaging of experimental inflammatory bowel disease: quantitative and qualitative analyses with histopathologic correlation in a rat model using the ultrasmall iron oxide SHU 555 C. Invest Radiol. 2009;44:23–30. doi: 10.1097/RLI.0b013e3181899025. [DOI] [PubMed] [Google Scholar]
- 22.Rohrer M, Bauer H, Mintorovitch J, et al. Comparison of magnetic properties of MRI contrast media solutions at different magnetic field strengths. Invest Radiol. 2005;40:715–724. doi: 10.1097/01.rli.0000184756.66360.d3. [DOI] [PubMed] [Google Scholar]
- 23.Persigehl T, Matuszewski L, Kessler T, et al. Prediction of antiangiogenic treatment efficacy by iron oxide enhanced parametric magnetic resonance imaging. Invest Radiol. 2007;42:791–796. doi: 10.1097/RLI.0b013e3180d5cbd9. [DOI] [PubMed] [Google Scholar]
- 24.Bland JM, Altman DG. Measuring agreement in method comparison studies. Stat Meth Med Res. 1999;8:135–160. doi: 10.1177/096228029900800204. [DOI] [PubMed] [Google Scholar]
- 25.Neeman M, Provenzale JM, Dewhirst MW. Magnetic resonance imaging applications in the evaluation of tumor angiogenesis. Semin Radiat Oncol. 2001;11:70–82. doi: 10.1053/srao.2001.18105. [DOI] [PubMed] [Google Scholar]
- 26.Krishna MC, Subramanian S, Kuppusamy P, et al. Magnetic resonance imaging for in vivo assessment of tissue oxygen concentration. Semin Radiat Oncol. 2001;11:58–69. doi: 10.1053/srao.2001.18104. [DOI] [PubMed] [Google Scholar]
- 27.Evans SM, Jenkins WT, Joiner B, et al. 2-Nitroimidazole (EF5) binding predicts radiation resistance in individual 9L s. c. tumors. Cancer Res. 1996;56:405–411. [PubMed] [Google Scholar]
- 28.Jensen RL. Hypoxia in the tumorigenesis of gliomas and as a potential target for therapeutic measures. Neurosurg Focus. 2006;20:E24. doi: 10.3171/foc.2006.20.4.16. [DOI] [PubMed] [Google Scholar]
- 29.Gatenby RA, Kessler HB, Rosenblum JS, et al. Oxygen distribution in squamous cell carcinoma metastases and its relationship to outcome of radiation therapy. Int J Radiat Oncol Biol Phys. 1988;14:831–838. doi: 10.1016/0360-3016(88)90002-8. [DOI] [PubMed] [Google Scholar]
- 30.Rice GC, Hoy C, Schimke RT. Transient hypoxia enhances the frequency of dihydrofolate reductase gene amplification in Chinese hamster ovary cells. Proc Natl Acad Sci U S A. 1986;83:5978–5982. doi: 10.1073/pnas.83.16.5978. [DOI] [PMC free article] [PubMed] [Google Scholar]
- 31.Sanna K, Rofstad EK. Hypoxia-induced resistance to doxorubicin and methotrexate in human melanoma cell lines in vitro. Int J Cancer. 1994;58:258–262. doi: 10.1002/ijc.2910580219. [DOI] [PubMed] [Google Scholar]
- 32.Wilson RE, Keng PE, Sutherland RM. Drug resistance in chinese hamster ovary cells during recovery from severe hypoxia. J Natl Cancer Inst. 1989;81:1235–1240. doi: 10.1093/jnci/81.16.1235. [DOI] [PubMed] [Google Scholar]
- 33.Brizel DM, Sibley GS, Prosnitz LR, et al. Tumor hypoxia adversely affects the prognosis of carcinoma of the head and neck. Int J Radiat Oncol Biol Phys. 1997;38:285–289. doi: 10.1016/s0360-3016(97)00101-6. [DOI] [PubMed] [Google Scholar]
- 34.Fyles AW, Milosevic M, Wong R, et al. Oxygenation predicts radiation response and survival in patients with cervix cancer. Radiother Oncol. 1998;48:149–156. doi: 10.1016/s0167-8140(98)00044-9. [DOI] [PubMed] [Google Scholar]
- 35.Unruh A, Ressel A, Mohamed HG, et al. The hypoxia-inducible factor-1a is a negative factor for tumor therapy. Oncogene. 2003;22:3213–3220. doi: 10.1038/sj.onc.1206385. [DOI] [PubMed] [Google Scholar]
- 36.Costouros NG, Diehn FE, Libutti SK. Molecular imaging of tumor angiogenesis. J Cell Biochem Suppl. 2002;39:72–78. doi: 10.1002/jcb.10426. [DOI] [PubMed] [Google Scholar]
- 37.Carmeliet P, Jain RK. Angiogenesis in cancer and other diseases. Nature. 2000;407:249–257. doi: 10.1038/35025220. [DOI] [PubMed] [Google Scholar]
- 38.Villringer A, Rosen BR, Belliveau JW, et al. Dynamic imaging with lanthanide chelates in normal brain: contrast because of magnetic susceptibility effects. Magn Reson Med. 1988;6:164–174. doi: 10.1002/mrm.1910060205. [DOI] [PubMed] [Google Scholar]
- 39.Covarrubias DJ, Rosen BR, Lev MH. Dynamic magnetic resonance perfusion imaging of brain tumors. Oncologist. 2004;9:528–537. doi: 10.1634/theoncologist.9-5-528. [DOI] [PubMed] [Google Scholar]
- 40.Pauliah M, Saxena V, Haris M, et al. Improved T(1)-weighted dynamic contrast-enhanced MRI to probe microvascularity and heterogeneity of human glioma. Magn Reson Imaging. 2007;25:1292–1299. doi: 10.1016/j.mri.2007.03.027. [DOI] [PubMed] [Google Scholar]
- 41.Slotboom J, Schaer R, Ozdoba C, et al. A novel method for analyzing DSCE-images with an application to tumor grading. Invest Radiol. 2008;43:843–853. doi: 10.1097/RLI.0b013e3181893605. [DOI] [PubMed] [Google Scholar]
- 42.Ogawa S, Lee TM, Kay AR, et al. Brain magnetic resonance imaging with contrast dependent blood level oxygenation. Proc Natl Acad Sci (USA) 1990;87:9868–9872. doi: 10.1073/pnas.87.24.9868. [DOI] [PMC free article] [PubMed] [Google Scholar]
- 43.Ogawa S, Lee TM. Magnetic resonance imaging of blood vessels at high fields: in vivo and in vitro measurements and image simulation. Magn Reson Med. 1990;16:9–18. doi: 10.1002/mrm.1910160103. [DOI] [PubMed] [Google Scholar]
- 44.Kennan RP, Zhong J, Gore JC. Intravascular susceptibility contrast mechanisms in tissues. Magn Reson Med. 1994;31:9–21. doi: 10.1002/mrm.1910310103. [DOI] [PubMed] [Google Scholar]
- 45.Punwani S, Ordidge RJ, Cooper CE, et al. MRI measurements of cerebral deoxyhaemoglobin concentration [dHb]-correlation with near infrared spectroscopy (NIRS) NMR Biomed. 1998;11:281–289. doi: 10.1002/(sici)1099-1492(199810)11:6<281::aid-nbm529>3.0.co;2-6. [DOI] [PubMed] [Google Scholar]
- 46.Dousset V, Gomez C, Petry KG, et al. Dose and scanning delay using USPIO for central nervous system macrophage imaging. MAGMA. 1999;8:185–189. doi: 10.1007/BF02594597. [DOI] [PubMed] [Google Scholar]
- 47.Taupitz M, Schnorr J, Abramjuk C, et al. New generation of monomerstabilized very small superparamagnetic iron oxide particles (VSOP) as contrast medium for MR angiography: preclinical results in rats and rabbits. J Magn Reson Imaging. 2000;12:905–911. doi: 10.1002/1522-2586(200012)12:6<905::aid-jmri14>3.0.co;2-5. [DOI] [PubMed] [Google Scholar]
- 48.Laghi A, Paolantonio P, Panebianco V, et al. Decrease of signal intensity of myometrium and cervical stroma after ultrasmall superparamagnetic iron oxide (USPIO) particles administration: an MR finding with potential benefits in T staging of uterine neoplasms. Invest Radiol. 2004;39:666–670. doi: 10.1097/00004424-200411000-00004. [DOI] [PubMed] [Google Scholar]
- 49.Taschner CA, Wetzel SG, Tolnay M, et al. Characteristics of ultrasmall superparamagnetic iron oxides in patients with brain tumors. AJR. 2005;185:1477–1486. doi: 10.2214/AJR.04.1286. [DOI] [PubMed] [Google Scholar]
- 50.Tamura H, Hatazawa J, Toyoshima H, et al. Detection of deoxygenation-related signal change in acute ischemic stroke patients by t2*-weighted magnetic resonance imaging. Stroke. 2002;33:967–971. doi: 10.1161/01.str.0000013672.70986.e2. [DOI] [PubMed] [Google Scholar]
- 51.Hermier M, Nighoghossian N. Contribution of susceptibility-weighted imaging to acute stroke assessment. Stroke. 2004;35:1989–1994. doi: 10.1161/01.STR.0000133341.74387.96. [DOI] [PubMed] [Google Scholar]
- 52.Yetkin FZ, Mendelsohn D. Hypoxia imaging in brain tumors. Neuroimaging Clin N Am. 2002;12:537–552. doi: 10.1016/s1052-5149(02)00029-1. [DOI] [PubMed] [Google Scholar]
- 53.Baudelet C, Ansiaux R, Jordan BF, et al. Physiological noise in murine solid tumours using T2*-weighted gradient-echo imaging: a marker of tumour acute hypoxia? Phys Med Biol. 2004;49:3389–3411. doi: 10.1088/0031-9155/49/15/006. [DOI] [PubMed] [Google Scholar]
- 54.Thomas DL, Lythgoe MF, Gadian DG, et al. Rapid simultaneous mapping of T2 and T2* by multiple acquisition of spin and gradient echoes using interleaved echo planar imaging (MASAGE-IEPI) Neuroimage. 2002;15:992–1002. doi: 10.1006/nimg.2001.1042. [DOI] [PubMed] [Google Scholar]
- 55.Lin W, Paczynski RP, Celik A, et al. Experimental hypoxemic hypoxia: effects of variation in hematocrit on magnetic resonance T2*-weighted brain images. J Cereb Blood Flow Metab. 1998;18:1018–1021. doi: 10.1097/00004647-199809000-00011. [DOI] [PubMed] [Google Scholar]
- 56.Packard SD, Mandeville JB, Ichikawa T, et al. Functional response of tumor vasculature to PaCO2: determination of total and microvascular blood volume by MRI. Neoplasia. 2003;5:330–338. doi: 10.1016/S1476-5586(03)80026-X. [DOI] [PMC free article] [PubMed] [Google Scholar]
- 57.Nwaigwe CI, Roche MA, Grinberg O, et al. Effect of hyperventilation on brain tissue oxygenation and cerebrovenous PO2 in rats. Brain Res. 2000;868:150–156. doi: 10.1016/s0006-8993(00)02321-0. [DOI] [PubMed] [Google Scholar]
- 58.Robinson SP, Collingridge DR, Howe FA, et al. Tumour response to hypercapnia and hyperoxia monitored by FLOOD magnetic resonance imaging. NMR Biomed. 1999;12:98–106. doi: 10.1002/(sici)1099-1492(199904)12:2<98::aid-nbm556>3.0.co;2-i. [DOI] [PubMed] [Google Scholar]
- 59.Måseide K, Rofstad EK. Intratumour heterogeneity in microvessel oxyhaemoglobin saturations. Cancer Lett. 2001;162:245–251. doi: 10.1016/s0304-3835(00)00670-4. [DOI] [PubMed] [Google Scholar]
- 60.Seitz RJ, Deckert M, Wechsler W. Vascularization of syngenic intracerebral RG2 and F98 rat transplantation tumors: a histochemical and morphometric study by use of ricinus communis agglutinin I. Acta Neuropathol (Berl) 1988;76:599–605. doi: 10.1007/BF00689599. [DOI] [PubMed] [Google Scholar]
- 61.Kaur B, Barth RF. Rat glioma models for preclinical evaluation of novel therapeutic and diagnostic modalities. In: Van Meir EG, editor. CNS Cancer, Models, Prognostic Factors and Targets. New York, NY: Springer Publishing; 2009. [Google Scholar]
- 62.Mathieu D, Lecomte R, Tsanaclis AM, et al. Standardization and detailed characterization of the syngeneic Fischer/F98 glioma model. Can J Neurol Sci. 2007;347:296–306. doi: 10.1017/s0317167100006715. [DOI] [PubMed] [Google Scholar]
- 63.Zhang J, van Zijl PCM, Laterra J, et al. Unique patterns of diffusion directionality in rat brain tumors revealed by high-resolution diffusion tensor MRI. Magn Reson Med. 2007;58:454–462. doi: 10.1002/mrm.21371. [DOI] [PMC free article] [PubMed] [Google Scholar]
- 64.Blanchard J, Mathieu D, Patenaude Y, et al. MR-pathological comparison in F98-Fischer glioma model using a human gantry. Can J Neurol Sci. 2006;33:86–91. doi: 10.1017/s0317167100004753. [DOI] [PubMed] [Google Scholar]
- 65.Valable S, Lemasson B, Farion R, et al. Assessment of blood volume, vessel size, and the expression of angiogenic factors in tow rat glioma models: a longitudinal in vivo and ex vivo study. NMR Biomed. 2008;21:1043–1056. doi: 10.1002/nbm.1278. [DOI] [PubMed] [Google Scholar]
- 66.Ferrier MC, Sarin H, Fung SH, et al. Validation of dynamic contrast-enhanced magnetic resonance imaging-derived vascular permeability measurements using quantitative autoradiography in the RG2 rat brain tumor model. Neoplasia. 2007;9:546–555. doi: 10.1593/neo.07289. [DOI] [PMC free article] [PubMed] [Google Scholar]
- 67.Wetzel SG, Cha S, Johnson G, et al. Relative cerebral blood volume measurements in intracranial mass lesions: interobserver and intraobserver reproducibility study. Radiology. 2002;224:797–803. doi: 10.1148/radiol.2243011014. [DOI] [PubMed] [Google Scholar]
- 68.Weltens C, Menten J, Feron M, et al. Interobserver variations in gross tumor volume delineation of brain tumors on computed tomography and impact of magnetic resonance imaging. Radiother Oncol. 2001;60:49–59. doi: 10.1016/s0167-8140(01)00371-1. [DOI] [PubMed] [Google Scholar]
- 69.Vos Mj, Uitdehaag BMJ, Barkhof F, et al. Interobserver variability in the radiological assessment of response to chemotherapy in glioma. Neurology. 2003;60:826–830. doi: 10.1212/01.wnl.0000049467.54667.92. [DOI] [PubMed] [Google Scholar]
- 70.Mori N, Miki Y, Kasahara S, et al. Susceptibility-weighted imaging at 3 tesla delineates the optic radiation. Invest Radiol. 2009;44:140–145. doi: 10.1097/RLI.0b013e318193ff25. [DOI] [PubMed] [Google Scholar]