

Abstract
The objective of this study was to determine time-course changes in gene expression within two regions of the extended amygdala following binge-like alcohol drinking by alcohol-preferring (P) rats. Adult male P rats were given 1-hr access to 15 and 30% ethanol three times daily for 8 weeks. Rats (n = 10/time point for ethanol and n = 6/time point for water) were killed by decapitation 1, 6 and 24 hr after the last drinking episode. RNA was prepared from individual micropunch samples of the nucleus accumbens shell (ACB-shell) and central nucleus of the amygdala (CeA); analyses were conducted with Affymetrix Rat 230.2 chips. Ethanol intakes were 1.5–2 g/kg for each of the 3 sessions. There were no genes that were statistically different between the ethanol and water groups at any individual time point. Therefore, an overall effect, comparing the water and ethanol groups, was determined. In the ACB-shell and CeA, there were 276 and 402 probe sets for named genes, respectively, that differed between the two groups. There were 1.5- to 3.6- fold more genes with increased than decreased expression in the ethanol drinking group, with most differences between 1.1- to 1.2-fold. Among the differences between the ethanol and water groups were several significant Biological Processes categories that were in common between the 2 regions (e.g., synaptic transmission, neurite development); however, within these categories, there were few genes in common between the two regions. Overall, the results indicate that binge-like alcohol drinking by P rats produces region-dependent changes in the expression of genes that could alter transcription, synaptic function and neuronal plasticity in the ACB-shell and CeA; within each region, different mechanisms may underlie these alterations, since there were few common ethanol-responsive genes between the ACB-shell and CeA.
Keywords: alcohol-preferring rat, binge-like alcohol drinking, nucleus accumbens shell, central nucleus of the amygdala, gene expression, microarrays
Introduction
Examining changes in gene expression resulting from chronic ethanol drinking could provide clues to identifying genes and gene networks involved in maintaining high alcohol drinking behavior, as well as identifying genes involved in the neurotoxic consequences of chronic alcohol consumption. There have been several studies that applied genomics and proteomics analyses to examining the effects of ethanol in rodent models (Bell et al., 2006; Kerns et al., 2005; Mulligan et al., 2006; Rodd et al., 2008; Saito et al., 2002, 2004; Treadwell and Singh, 2004). Studies conducted on post-mortem human tissue examined the neurotoxic effects of chronic alcohol consumption (Alexander-Kaufman et al., 2006, 2007; Flatscher-Bader et al., 2005; Lewohl et al., 2000, 2004; Liu et al., 2004, 2006; Matsumoto et al., 2007; Mayfield et al., 2002). Collectively, these studies indicate that differences between alcoholics and controls could be detected in several brain regions, and these differences could alter neuronal function.
Alterations in gene expression produced by exposure to alcohol have been reported in several studies with rats and mice. Acute ethanol injections (6 g/kg; i.p.) produced changes in whole brain of C57BL/6J and DBA/2J mice (high and low alcohol drinkers, respectively) in expression of genes involved in regulating cell signaling, gene regulation, and homeostasis/stress response (Treadwell and Singh, 2004). Kerns et al. (2005) reported that acute i.p. ethanol injections altered expression of genes involved in glucocorticoid signaling, neurogenesis, myelination, neuropeptide signaling, and retinoic acid signaling in the nucleus accumbens (ACB), prefrontal cortex and ventral tegmental area (VTA) of C57BL/6J and DBA/2J mice. Differences in expression of genes coding for oxido-reductases and ADP-ribosylation factors were found in the dorsal hippocampus of Lewis rats given 12% ethanol or water for 15 months (Saito et al., 2002). In contrast, Saito et al. (2004) found no statistically significant effects of chronic free-choice alcohol drinking on gene expression in the striatum of C57BL/6By mice. The above studies were conducted using ethanol injections or 24-hr free-choice drinking. Moreover, other then the study of Kerns et al. (2005) using i.p. ethanol injections, none of the above studies reported data on limbic regions that are involved in mediating alcohol drinking.
Bell et al. (2006) examined the effects of chronic alcohol drinking by alcohol-preferring (P) rats on protein levels in the ACB and amygdala, and reported a small number of changes in each region with chronic alcohol drinking. Recently, Rodd et al. (2008) examined the effects of operant ethanol self-administration on changes in gene expression in the ACB and amygdala of inbred P rats 24 hr after the last 1-hr session. In the ACB, approximately 200 genes significantly differed between the ethanol and water control groups, whereas, in the amygdala, few significant differences were observed. In another recent study (Bell et al., 2009), gene expression changes were determined in the ACB of P rats following two different alcohol drinking conditions, i.e., continuous 24-hr access and multiple 1-hr daily scheduled access periods. Significant differences in expression of genes involved in intracellular signaling pathways and transcription factors were found between the continuous access and water control groups, whereas no significant differences were observed in the ACB between the multiple scheduled access and the water control groups, when measured the day after the last drinking episode. Studies on changes in gene expression within discrete regions of the extended amygdala following alcohol drinking have not yet been undertaken. Since the extended amygdala is an important system involved in regulating alcohol drinking and dependence-induced drinking (Koob and LeMoal, 2008; Koob et al., 1998; McBride, 2002; Roberts et al., 1996), it would be important to determine the effects of alcohol drinking on gene expression changes within this system.
Animal models have been used to study the influence of genetic factors on the effects of alcohol and on alcohol drinking behavior (reviewed in Bell et al., 2005; McBride and Li, 1998; Murphy et al., 2002). Demonstrating that animals will drink alcohol for its CNS effects and will attain relevant blood alcohol concentrations (BACs) is crucial for establishing a valid animal model to study brain mechanisms leading to the development and maintenance of excessive alcohol drinking. Among the rodent models, only the P line has been shown to satisfy all of the perceived criteria for an animal model of alcoholism (reviewed in McBride and Li, 1998; Murphy et al., 2002; Bell et al., 2005). In addition, innate differences in levels of gene expression in 5 CNS regions, including the ACB, have been reported between inbred P and inbred alcohol-non-preferring (NP) rats (Kimpel et al., 2007). Previously, it was established that P rats, given one-hour access to 10% ethanol 4 times during the dark cycle (water available ad lib), will consume nearly as much alcohol as rats given 24-hr free-choice access to 10% ethanol (Murphy et al., 1986). Another study (Bell et al., 2005) demonstrated that if 15 and 30% ethanol were concurrently available during the multiple 1-hr sessions (water available ad lib), then ethanol intakes of 1.5–2.0 g/kg/session were obtained by P rats, which produced BACs in the range of 100 mg%. This paradigm qualifies as a ‘binge-like’ alcohol-drinking model, since drinking occurred within a 1-hr time frame and produced BACs over 80 mg%.
Evidence supports the involvement of the ACB in mediating ethanol drinking (reviewed in Koob et al., 1998; McBride and Li, 1998). In particular, the shell portion of the ACB is involved in supporting reinforcement (Ikemoto et al., 1997) and reinforcing effects of drugs of abuse (reviewed in Kalivas et al., 1993). The central nucleus of the amygdala (CeA) has also been implicated in mediating the effects of ethanol (Koob and Le Moal, 2008; McBride, 2002) and dependence-induced alcohol drinking (Roberts et al., 1996). Therefore, changes in gene expression in the ACB-shell and CeA (2 regions that are part of the extended amygdala), following binge-like alcohol drinking that produces high BACs (> 80 mg%), were undertaken. In addition, time-course effects were also determined to better characterize ethanol-induced changes in gene expression following a drinking episode. The hypothesis to be tested was ‘binge-like’ alcohol drinking will produce differential changes in the expression of genes involved in synaptic function and intracellular signaling within the extended amygdala that will be time- and region- dependent.
Materials and methods
Subjects were adult (approximately 90 days old at the start of the experiment), ethanol-naïve, male selectively-bred P rats from the 61st generation. The rats were single-housed on a reverse 12 hr/12 hr dark-light cycle (light off at 0900 hr). Animals had ad libitum access to food and water. Rats were randomly divided into two groups: (1) the water control group (n = 18) had access to water as their sole fluid; and (2) the ethanol group (n = 30) received daily three 1-hr access periods to 15 and 30 % (v/v) ethanol separated by 2 hr starting 1 hr into the dark cycle (i.e., 1000—1100, 1300—1400, 1600—1700) for 5 consecutive days each week. Multiple concentrations, instead of a single concentration, of ethanol were used to further increase alcohol intakes (Rodd-Henricks et al., 2001). The animals did not have access to ethanol on weekends. Measurements of water and ethanol intake, and body weights were taken Monday through Friday at 1100 hr; ethanol intakes were determined at the end of each 1-hr access period.
The animals used in these experiments were maintained in facilities fully accredited by the Association for the Assessment and Accreditation of Laboratory Animal Care (AAALAC). All research protocols were approved by the institutional animal care and use committee and are in accordance with the guidelines of the Institutional Care and Use Committee of the National Institute on Drug Abuse, National Institutes of Health, and the Guide for the Care and Use of Laboratory Animals (Institute of Laboratory Animal Resources, Commission on Life Sciences, National Research Council 1996).
In the 8th week, rats (in this single cohort) were killed by decapitation 1, 6 or 24 hr (n = 10/time point for ethanol groups; n = 6/time point for water groups) after the first drinking episode of the day; the brains were quickly removed and frozen in isopentane in dry ice. Rats were habituated to the guillotine during the 7th week. The 1-hr time point was chosen to measure expression levels when high in vivo concentrations of ethanol were present. The 6-hr time point was selected to detect gene expression changes as a result of episodic drinking but without alcohol being present. The 24-hr time point was selected to (a) determine the effects of chronic exposure to alcohol, and (b) allow comparison with other 24-hr time point data (Bell et al., 2009; Rodd et al., 2008).
Brains were stored at −70° C until sectioned. On the day of preparation of micro-punch samples, brains were transferred to a cryostat set at −6 to −10° C at least 2 hr prior to sectioning. Sections (300 μm) were obtained and transferred to glass slides that had been pre-cooled in the cryostat. Micro-punch sampling was done on a frozen stage (−25 to −35° C) with an anatomic microscope equipped with a cool microscope lamp. The stereotaxic atlas of Paxinos and Watson (1998) was used to identify the ACB-shell and CeA. Microdissection needles (Fisher Scientific) with an inner diameter of 0.77 mm were used to obtain samples of the ACB-shell and CeA. This inner diameter fits within the entire region and minimizes contamination from adjacent tissue. Punches are taken bilaterally from 2–3 sections. A different fresh sterile micro-punch needle is used between regions and for each animal. After withdrawing the micro-punch sample, a distinct demarcated hole remained; this hole was used to validate the micro-dissection method. All equipment used to obtain tissue was treated with RNAse Zap (Ambion, Inc. Austin, TX) to prevent RNA degradation. A second trained individual independently verified the quality of the micro-punch dissections.
The micro-punched samples were immediately homogenized in Trizol reagent (Invitrogen, Carlsbad, CA) and processed according to the manufacturer’s protocol, but with twice the suggested ratio of Trizol to tissue (Edenberg et al., 2005). Ethanol precipitated RNA was further purified through RNeasy® columns (Qiagen, Valencia, CA) according to the manufacturer’s protocol. The yield, concentration and purity of the RNA were determined by running a spectrum from 210 to 350 nm, and analyzing the ratio of large and small ribosomal RNA bands using an Agilent Bioanalyzer. Yields, purity and quality of the RNA were excellent; RNA integrity numbers (RIN) averaged 8.5 for the samples, showing little or no degradation.
Microarray procedures
Separate preparations of total RNA were made from individual CNS regions from each animal. Samples were not pooled. Standard Affymetrix protocols (GeneChip® Expression Analysis Technical Manual, Rev. 5 and updates) were used to synthesize biotinylated cRNA, using the Affymetrix kits for cDNA synthesis, in vitro transcription and sample cleanup. The fragmented, biotinylated cRNA from each independent sample was mixed into 300 μl of hybridization cocktail, of which 200 μl were used for each sample. Hybridization was carried out for 17 hr at 42°C. Samples were hybridized to the Affymetrix Rat Genome 230 2.0 GeneChips. Washing and scanning of the GeneChips were carried out according to standard protocols, as previously described (Edenberg et al., 2005; McClintick et al., 2003).
To minimize potential systematic errors, all stages of the experiment were balanced across experimental groups. That is, equal numbers of animals in each group were sacrificed within the same 2-hr time frame each day. For the ACB-shell samples, equal numbers of RNA preparations from the representative groups were processed through the labeling, hybridization, washing and scanning protocols on a given day, ensuring that the sets of samples labeled together were not also hybridized together, using premixes of reagents. However, the CeA samples were done several weeks after the ACB-shell samples, and, for the CeA, the sets of samples labeled together were also hybridized together; which led to a significant batch effect. Therefore, we incorporated ‘batch’ as a co-variate into the statistical analysis of the CeA samples.
Each GeneChip® was scanned using an Affymetrix Model 3000 scanner and underwent image analysis using Affymetrix GCOS software. Microarray data are available from the National Center for Biotechnology Information’s Gene Expression Omnibus (Barrett et al. 2005; Edgar, Domrachev, and Lash 2002) under accession GSE15407.
Statistical and neuroinformatics analysis of microarray data
Raw cel files were imported into the statistical programming environment R (R: A language and environment for statistical computing Ver 2.2.0; R Foundation for Statistical Computing, 2005) for further analysis with tools available from the Bioconductor Project (Gentleman et al., 2004). Expression data from the 48 arrays of each region were normalized within-region and converted to log(2) using the Robust Multi-chip Average (RMA) method (Irizarry et al., 2003) implemented in the Bioconductor package RMA. As a standardization step to facilitate later comparisons with other experiments, expression levels were scaled such that the mean expression of all arrays was log2(1000). As we were primarily concerned with identifying genes that could be subjected to further bioinformatic analysis, all probe sets currently annotated by Affymetrix as “expressed sequence tags” or whose gene names contain the words “riken”, “predicted”, or “similar to” were filtered out. We next filtered out probe sets that were not detectable above background in our samples,; this has been shown to reduce noise in microarray experiments (McClintick and Edenberg, 2003) Probe sets that did not have at least 25% of samples with normalized scaled expression greater than 64 were not analyzed. Linear modeling to calculate gene-wise p-values for the contrasts of the ethanol group versus water group was performed using the package Limma (Smyth, 2004). For each region, models including treatment, time of sacrifice after last drinking session (time), labeling batch, and hybridization batch, including interaction effects for all factors, were constructed. For each region, the most parsimonious model was chosen. For the Acb-shell, the model included only treatment; for the CeA the model included both treatment and labeling/hybridization batch. Probe sets were considered to be statistically significant at p < 0.01, which, because of differences in the p-value distribution, was equivalent to a false discovery rate (FDR; calculated according to Storey et al., 2004) less than 0.25 for the ACB-shell and 0.10 for the CeA. These FDR values were selected to provide sufficient numbers of ‘named’ genes to conduct Gene Ontology (GO) and Ingenuity pathways analyses. Any false positives would be expected to be random with respect to clustering within GO categories or being incorporated into a pathway analysis.
Testing for over-representation of GO (Harris et al., 2004; Ashburner et al., 2000) biological processes (BP) and molecular function (MF) categories was performed using the Bioconductor package GOstats (Gentleman, 2004). Briefly, for each gene set tested, a list of unique Entrez-Gene identifiers was constructed. This list was then compared to the list of all known Entrez-Gene identifiers that are represented on the Affymetrix chipset Rat Genome 230 2.0. Identification of over-represented GO categories was then accomplished within GOstats using the hypergeometric distribution. Only categories with greater than 9 and less than 300 genes represented on the chipset were included in the analysis; only categories with more than 5 significant genes are listed. GO and Kyoto Encyclopedia of Genes and Genomes (KEGG) categories were called significant at p < 0.05. Curated pathway analyses on significant genes were conducted with Ingenuity® Pathways Analyses.
Results
Daily ethanol intakes of the P rats were 1.5 to 2 g/kg/session over the 8 weeks of access (Fig. 1). Blood ethanol levels were not measured in the present study. However, intakes of 1.5 to 2 g/kg have previously been shown to produce blood alcohol concentrations greater than 80 mg% (Bell et al., 2005). Measures of intoxication following the 1-hr drinking periods were not assessed; in addition, measures of development of dependence and tolerance were not undertaken. There was no significant weight difference between the water and ethanol groups. Water intake during the ethanol access periods was negligible so that ethanol preference scores were > 99%.
Fig. 1.

Ethanol intakes (g/kg) by P rats for each of the three one-hr access periods to 15 and 30% ethanol during the dark cycle. Ethanol was given consecutive 5 days each week over the 8 weeks of access. Data are presented in 5-day blocks for each 1-hr period of access. Data are the means ± SEM (n = 30).
Changes in gene expression in the ACB-shell
There were 85 probe sets at the 1-hr time point, 169 probe sets at the 6-hr time point, and 113 probe sets at the 24-hr that were different (p < 0.01) between the water and ethanol groups. These probe-sets included named genes and ESTs. However, with a FDR = 0.25 adjustment, there were no significant differences at any of the time points. In addition, there was no effect of time within the water or ethanol groups. Therefore, an overall ethanol effect was determined by combining the data for the 3 time points into a single water group and a single ethanol group.
Setting the maximum FDR at 0.25 in an analysis that combined data from the 3 time points, there were 748 total probe sets that were significantly different in the ACB-shell between the water and ethanol groups, representing 276 unique named genes and 472 ESTs (Table 1). There were approximately 3.6-fold more named genes that had higher expression than lower expression in the ethanol versus the water group (Table 1). Most of the differences between the ethanol and water groups were in the range of 1.1- to 1.2- fold, with a few as high as 1.3- to 1.7-fold (see Supplemental Table A for a complete list of significant probe sets for the ACB-shell).
Table 1.
Overall summary of significant effects of binge-like ethanol drinking on changes in gene expression in the ACB-shell and CeA of P rats
| ACB-sh | CeA | |
|---|---|---|
| Probe sets after A/P filter | 20,361 | 22,324 |
| Significant Probe sets | 748* | 1,156* |
| Significant ESTs | 472* | 754* |
| Increased with EtOH drinking | 206 | 451 |
| Decreased with EtOH drinking | 266 | 303 |
| Significant named genes** | 276* | 402* |
| Increased with EtOH drinking | 216 | 242 |
| Decreased with EtOH drinking | 60 | 160 |
| Unique named genes*** | 276* | 384* |
| Within rat EtOH QTLs | 36 | 75 |
| Within both rat and mouse EtOH QTLs | 7 | 4 |
| GO Biological Process categories (p < 0.05) | 38 | 34 |
The level of significance was set at a Storey False Discovery Rate of 0.25 for the ACB-shell and 0.10 for the CeA.
Significant named genes shows total number of probe sets annotated to named genes (some genes were represented by more than one probe set).
Unique named genes with duplicate probe sets removed.
EST = Expressed Sequence Tag; GO = Gene Ontology; QTL = Quantitative Trait Loci
GO analysis indicated there were 38 biological processes (BP) categories that differed significantly between the water and ethanol groups. There were several BP categories with 15 or more genes, e.g., neurogenesis, neurological process, neuron differentiation, response to external stimulus, synaptic transmission and translation.
The ‘synaptic transmission’ category included significant genes listed in ‘regulation of transmission of nerve impulse’ and ‘regulation of synaptic plasticity’ categories. In addition, individual literature searches of the genes that were significantly different between the control and ethanol groups indicated that 8 more genes could be included within the combined category of ‘synaptic transmission-regulation of nerve impulse-synaptic plasticity’ in the ACB-shell (Table 2). Of the 23 named genes that were different between the ethanol and water groups in this combined BP category, 21 had higher expression levels in the ethanol group.
TABLE 2.
Significant Genes Listed within Gene Ontology (GO) Biological Processes Categories in the Nucleus Accumbens-Shell (ACB-shell; p < 0.01, FDR = 0.25) and Central Nucleus of the Amygdala (CeA; p < 0.01, FDR = 0.10) of the Ethanol (EtOH) versus Water Group
| Region/GO category | Increased expression-EtOH | Reduced expression-EtOH |
|---|---|---|
| ACB-shell | ||
| Synaptic transmission, regulation of nerve impulse & synaptic plasticity | 21 genes: Apoe, Axin2, Camk2g, Drd1ip, Egfr, Gria1, Grin1, Hras, Kcnd2, Lin7a, Myo5a, Ncdn, Nrgn, Nrxn1, Ntrk3, Rab14, Rab27b, Snap29, Syn2, Syt10, Syt5 | 2 genes: Htr5b, Stx5a |
| Neurite development, cell projection morphogenesis, axonogenesis | 17 genes: Apbb1, Apoe, Chl1, Egrf, Git1, Gnao, Map1b, Map1lc3a, Mapre3, Mt3, Mtap2, Ncdn, Nrgn, Nexn1, Ntrk3, Tiam1, Uchl1 | 1 gene: Ptprz1 |
| Positive regulation of transcription from RNA polymerase II promotor | 8 genes: Apbb1, Psmc3ip, Psmd9, Ptpmt1, Tcea, Tcf4, Thra, Thrb | 1 gene: Ncoa2 |
| Translation | 18 genes: Akt1, Egfr, Ehd2, Eif2b2, Eif2b5, Eif2c2, Eif3s9, Farsla, Fau, Hras, Mvk, Rpl11, Rpl41, Rplp1, Rps10, Sars1, Tars, Wbscr1 | 2 genes: Rpl28, Zfp36l1 |
| Response to external stimulus | 11 genes: Akt1, Apoe, Bckdha, Chl1, Ensa, Hras, Mgll, Mif, Ntrk3, Serpina1, Vwf | 7 genes: Acsl1, Bmp2, Cybb, F8, Pld1, Stc1, Tek |
| CeA | ||
| Synaptic transmission, GABA signaling | 27 genes: Abat, Accn1, Apba2, Axin2, Camk4, Cd24, Fyn, Gabbr1, Gabrg1, Gad2, Gnai2, Gria1, Gria2, Grik2, Grik5, Grin3a, Hap1, Ncam1, Nrxn3, Nsf, Ntrk2, Oprk1, P2ry1, Sst, Stx3, Syt10, Vapb | 8 genes: Acp1, Camk2n1, Chma7, Cyp2d22, Gabra1, Gabrg2, Rab2b, Snapap |
| Cell projection morphogenesis, neurite development | 18 genes: Actb, Ank3, Bbs2, Capzb, Dpysl5, Evl, Fgfr1, Grin3a, Klf5, Mtap2, Negr1, Nrxn3, Ntrk2, Ptprk, Sema4f, Sox11, Ube2b, Vgf | 3 genes: Cdh11, Cxcl12, Nrcam |
| Cytoskeletal organization & biogenesis | 17 genes: Actb, Add1, Bbs2, Capzb, Clasp2, Cttnbp2, Dctn2, Evl, Fath, Hap1, Hook3, Kif1a, Mtap2, Pclo, Rnd3, Tpm1, Ube2b | 7 genes: Arhgef2, Epb4.1l3, Kif11, Map1lc3b, Nefl, Shc1, Unc119 |
| 2nd-messenger-mediated signaling | 10 genes: Dgkg, Gabbr1, Gipr, Gkap1, Gnai2, Mc4r, Pprk1, P2ry1, Pclo, Ptpm | 2 genes: F2r, Rgn |
| Enzyme linked receptor protein signaling | 12 genes: Acvr2a, Fgfr1, Foxo1a, Grik2, Grik5, Ntrk2, Prkca, Prprf, Prpm, Rgs2, Smad1, Src | 4 genes: Alk, Flt3, Insr, Shc1 |
| Positive regulation nucleic acid metabolism & DNA- dependent transcription | 15 genes: Cask, Cdk7, Crebbp, Ebf1, Ets2, Fus, Hnrpab, Ilf3, Klf5, Nufip1, Plagl1, Smad1, Sox11, Tef, Thra | 1 gene: Nfib |
| Regulation of protein kinase & MAPKKK cascade | 9 genes: Cdk7, Dgkg, Fgfr1, Gnai2, Grik2, Lrrn3, Mapk10, Prkca, Smad1 | 6 genes: Avpi1, Cdc25a, Cdkn1c, Chrna7, F2r, Shc1 |
| Potassium ion transport | 6 genes: Gria1, Gria2, Grik2, Grik5, Kcnc1, Kcnh1 | 5 genes: Kcnc2, Kcnj11, Kcnj16, Kcnj5, Slc12a7 |
Since the ‘neurite development’, ‘cell projection morphogenesis’ and ‘axonogenesis’ categories contained many common genes, these genes were combined into a single ‘neurite development’ category (Table 2). In addition, individual literature searches added 5 more significant genes to the combined category. Among the 18 genes in the ‘neurite development’ category that significantly differed, 17 genes had higher expression in the ethanol group.
Of the 9 genes listed in the ‘positive regulation of transcription’ category (Table 2), 8 genes had higher expression levels in the ethanol group. Similarly, 18 of the 20 genes in the ‘translation’ category had higher mRNA levels in the ethanol drinking group than in the water group. The ‘response to external stimulus’ category also had a high number of genes that were significantly different between the ethanol and water groups, with the expression of 11 genes being higher and 7 genes being lower in the ethanol group.
In the GO molecular function (MF) categories for the ACB-shell, there were only 5 categories, all with a low number (5–8) of significant genes between the ethanol and water groups (data not shown). Three of the categories involved protein transport, homodimerization and heterodimerization, one category involved translation initiation factor, and the 5th category had to do with ‘receptor signaling protein activity’.
KEGG analysis of the ACB-shell indicated only 6 groups, containing 5–8 genes each (data not shown). Two of the groups involved cancer, two dealt with metabolism (purine, glycolysis) and only one with nervous system function (i.e., ‘long-term potentiation’).
Ingenuity® pathways analysis indicated several different networks were altered by ethanol drinking (Table 3). One network involved in transcription had 24 genes up-regulated and only 5 down-regulated in the ethanol group compared to the water control group. Similar differences in up-regulated versus down-regulated genes were observed for other networks, e.g., Wnt/beta-catenin signaling, glucocorticoid receptor signaling, NFKB signaling, and long-term potentiation (Table 3).
TABLE 3.
Summary of Significant Networks in the Nucleus Accumbens-Shell (ACB-shell) and Central Nucleus of the Amygdala (CeA) revealed with Ingenuity® Pathways Analysis that were altered by Binge-like Ethanol (EtOH) Drinking of P rats
| Region/network | Increased expression-EtOH | Decreased expression-EtOH |
|---|---|---|
| ACB-shell | ||
| Network 1: transcription | 24 genes; Aldoa, Apbb1, Atp1b1, Atp6voc, Crip2, Csnk1g, Ef2b2, Ef2b5, Egfr, Git1, H3f3b, Jmjd6, Map1b, Myh7, Ntrk3, Pick1, Pqbp1, Psmc4, Psmd9, Smarca4, Snd1, Syn2, Thap7, Uqcrc1 | 5 genes; Irf9, Mc4r, Ptprz1, Sh3kbp1, Smc4 |
| Network 2: apoptosis, THR activation, Wnt/beta-catenin signaling | 20 genes; Aip, Akt, Apoe, Axin2, Bsg, Cdc37, Cndl1, Eno1, Fdps, Myh6, Nrgn, Polr2f, Psma3, Psmb10, Psmb8, Tcf4, Thra, Thrb, Tnnc1, Ubtf | 6 genes; Acac, Acin1, Ncoa2, Ncstn, Sulf1, Usp18 |
| Network 3; glucocorticoid receptor signaling; NFKB signaling | 16 genes; Akt1, Anp32a, Atp5j, Basp1, Ctsz, Eif2c2, Ensa, Fabp3, Hras, Nucb1, Phb, Rplp1, Rps10, Stub1, Tcp1, Trex1 | 6 genes; Bmp2, Cybb, Nid1, Ptgs1, Stc1, Trpv1 |
| Network 4; Long Term Potentiation (LTP); Ca+2 signaling | 17 genes; Akap9, Basp1, Cacna1h, Calm1, Calm3, Camk2g, Camk2, Ece1, Fbxo2, Gria1, Grin1, Myo5a, Nrxn1, Scf, Skp1, Snta1, Vwf | 4 genes; F8, Gcnt1, Wipf1, Zfp36l1 |
| Network 5; cell death | 11 genes; Cyb5r3, Fhit, Hdac4, Maea, Mif, Mt3, Psmc3ip, Ras, Rnd3, Serpina1, Tiam1 | 8 genes; Hhex, Kdr, Nmnat1, Pias3, Pld, Pld1, Shc1, Tek |
| CeA | ||
| Network 1; transcription | 18 genes; Acvr2a, Ank3, Araf, Arf5, Cdc1, Cdk7, Chd4, Crkrs, Ctr9, Fus, Gda, Khsrp, Mll, Naplll, Nfil3, Olf3, Smad1, Vapb | 8 genes; Ca4, Cznx, Gusb, Ier2, Insr, Mrps9, Msll, Snapin |
Among the 276 genes that differed between the ethanol and water groups in the ACB-shell, 36 genes were located within rat ethanol preference QTLs (Table 1; also see Supplemental Table B). The highest localization of genes occurred in rat ethanol preference QTL Alc 4 on rat chromosome 5 (11 genes) and QTL Alc17 on rat chromosome 6 (10 genes). There were 7 genes located in both a rat and a mouse ethanol QTL, i.e., Rab14, Ptgs1, Nudc, Fabp3, Ncdn, Fbxo2, and Nrgn. Five (Rab14, Ptgs1, Ncdn, Fbxo2, Nrgn) of these 7 genes were listed within a significant GO BP category, i.e., ‘synaptic transmission’ and ‘neurite development’.
Changes in gene expression in the CeA
Statistical analysis of the CeA samples incorporated a ‘batch effect’, which prevented an analysis of the individual time points. In addition, correcting for a batch effect allowed us to use a more critical FDR value for the CeA than was used for the ACB-shell. Setting the maximum FDR at 0.10, there were 1,156 probe sets that were significantly different between the ethanol and water groups, with 754 probe sets for ESTs and 402 probe sets for named genes being different (Table 1). There were 384 unique named genes that were significantly different in the CeA between water and ethanol groups (see Supplemental Table C for a complete list of significantly different probe sets in the CeA). There were 1.5-fold more individual named genes that had higher expression than lower expression levels in the ethanol group compared to the water control group (Table 1).
There were 34 GO BP categories in the CeA that significantly differed between the water and ethanol groups (Table 1), some of which contained 14 or more genes. Table 2 lists the significant genes in several GO BP categories for the CeA. There were 35 genes in the combined ‘synaptic transmission-GABA signaling’ category, of which 27 had greater expression in the ethanol than the water group (Table 2). In addition to several genes involved in GABA signaling (Gabbr1, Gabra1, Gabrg1, Gabrg2, Gad2), there were genes involved in glutamate signaling (Gria1, Gria2, Grik2, Grik5, Grin3a), as well as synaptic vesicle function (Rab2b, Sanpap, Stx3, Syt10, Vapb) that differed between the ethanol and water groups.
In the combined ‘cell projection morphogenesis-neurite development’ category (Table 2), there were 21 individual genes, of which 18 had higher expression in the ethanol than water group. In the ‘cytoskeletal organization and biogenesis’ group, there were 24 genes, of which 17 had higher expression in the ethanol than water group. There were 12 genes (10 genes with higher expression in the ethanol group) within the ‘second-messenger-mediated signaling’ category, and 15 genes (9 genes with higher expression in the ethanol group) within the combined ‘regulation of protein kinase activity-MAPKKK cascade’ grouping, with only two genes (Dgkg, F2r) in common between these two categories. The ‘enzyme-linked receptor protein signaling pathway’ category had 16 genes significantly different between the ethanol and water groups, of which 12 genes were higher in the ethanol than water group (Table 2). In the combined category of ‘positive regulation of nucleic acid metabolism-DNA-dependent transcription’ category, 15 of the 16 genes had higher expression in the ethanol compared to the water group (Table 2). The ‘potassium ion transport’ category had 6 genes with higher and 5 genes with lower expression levels in the ethanol group.
Although there were several GO BP categories in common between the ACB-shell and CeA, there were relatively few genes in common within these categories. The ‘synaptic transmission’ category (Table 2) had only 2 genes in common, i.e., Gria1, Sty10; the ‘neurite development-cell projection morphogenesis’ combined category had one gene (Mtap2) in common between the ACB-shell and CeA.
In contrast to the few significant GO MF categories found in the ACB-shell between the ethanol and water groups, there were 15 significant MF categories in the CeA (results not shown), several of which had 10 or more genes listed, e.g., ‘G-protein coupled receptor activity’, ‘ion channel activity’, ‘receptor signaling protein activity’, and transmembrane ‘receptor activity’. Although the ‘receptor signaling protein activity’ MF category was in common between the ACB-shell and CeA, there were no genes in common in this category between the 2 regions. Most of the genes in the significant MF categories for the CeA could also be found within the BP categories.
KEGG analysis determined that there were 5 significant groups, 4 of which involved cell cycle, junctions or lineage (data not shown). The 5th category, ‘neuroactive ligand-receptor interaction’, had 14 genes, all of which were included in one of the BP categories.
Ingenuity® pathways analysis indicated several networks that were altered by ethanol drinking (Table 3). In 4 of the 5 networks, more genes had higher than lower expression levels in the ethanol compared to the water group, with the transcription and glucocorticoid receptor signaling networks having the highest ratios. Although several networks fell within the same general categories in both the CeA and ACB-shell (i.e., transcription, long-term potentiation, and glucocorticoid receptor signaling), there was almost no overlap between the 2 regions in the genes that changed within each category. In addition, networks involved in axonal guidance signaling and ephrin receptor signaling were altered in the CeA, but not ACB-shell, whereas Wnt/beta-catenin signaling and NFKB signaling were altered in the ACB-shell, but not the CeA, of the ethanol group (Table 3).
Examination of the chromosomal location of the genes that were significantly different between the ethanol and water groups in the CeA indicated that 75 genes were located within rat ethanol preference QTLs (see Supplemental Table D), and 4 genes (Capzb, Prdm2, Nmnat1, Panx3) that were located within both mouse and rat ethanol QTLs. Capzb is listed in two important GO BP categories (Table 2), i.e., ‘cell projection morphogenesis-neurite development’ and ‘cytoskeletal organization and biogenesis’. Both Capzb and Prdm2 are found in the general BP category of ‘biological regulation’. The highest number of genes that differed between the ethanol and water group in the CeA occurred in rat QTL Alc4 on chromosome 5 (21 genes) and QTL Alc17 on chromosome 6 (18 genes). Among the genes located within a rat ethanol preference QTL, only Usp18 was in common between the ethanol and water groups in both regions.
Discussion
The major findings of this study are that binge-like alcohol drinking by P rats produced comparatively small changes (1.1- to 1.2- fold) in gene expression in the ACB-shell and CeA, resulted in more genes having higher than lower expression levels (1.5- to 3.6- fold), and produced region-dependent changes in gene expression, some of which included changes in transcription, synaptic function and neuronal plasticity (Table 2; Figs. 2 and 3; Supplemental Tables A and B). The overall results support part of our hypothesis that region-dependent changes occur with ethanol drinking. However, the results do not indicate that time-dependent changes occurred in the ACB-shell.
Fig. 2.
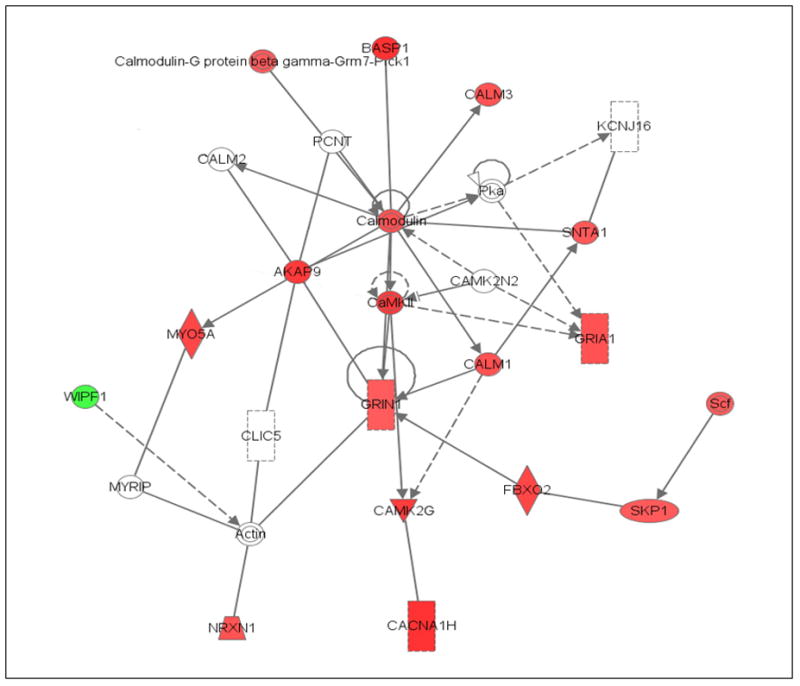
Abridged Ingenuity® Pathways Analysis of effects of ethanol drinking in the nucleus accumbens shell of P rats showing increased expression of genes in calcium/calmodulin and glutamate signaling pathways. Red indicates increased expression, green indicates reduced expression (only Wipf1 had reduced expression), and clear symbol indicates genes that were not identified as differentially expressed, but were linked to multiple genes that had changed significantly. Abbreviations: Akap9 – A kinase anchor protein; Basp1 - brain abundant signal protein; Cacna1h – calcium channel T type; Calm1,2,3 – calmodulin 1,2,3; Camk – calcium/calmodulin-dependent protein kinase; Clic5 – chloride intracellular channel; Fbxo2 – F-box protein; Gria1 – AMPA1 receptor; Grin1 – NMDA1 receptor; Kcnj16 – K+ inwardly-rectifying channel; Myo5a – myosin Va; Myrip – myosin & Rab interacting protein; Nrxn1 – neurexin 1; Pcnt –pericantrin; Pka – protein kinase; Scf - (Skp1-cullen-1, F-box) ubiquitin ligase; Skp1 – S-phase kinase protein; Snta – syntrophin acidic; Wipf1 – Wiskott-Aldrich syndrome-like interacting protein. (For interpretation of the references to color in this figure legend, the reader is referred to the web version of this article.)
Fig. 3.

Abridged Ingenuity® Pathways Analysis of effects of ethanol drinking in the central nucleus of the amygdala of P rats showing increased expression of genes in glutamate signaling pathways and alterations in gene expression in related pathways. Red indicates increased expression, green indicates decreased expression, and clear symbol indicates genes that were not identified as differentially expressed, but were linked to multiple genes that had changed significantly. Abbreviations: 14-3-3 – tyrosine 3-monooxygenase/tryptophan 5-monooxygenase activation protein; Ampar – AMPA receptors; C1qbp – complement component 1, q subcomponent binding protein; Cybb – cytochrome b-245, beta polypeptide; Eif2s2 – eukaryotic translation initiation factor 2, subunit 2 (beta); Gabar-a – GABA receptor associated protein; Gabra1 – gamma-aminobutyric acid (GABA-A) receptor, subunit alpha 1; Gabrg1 – gamma-aminobutyric acid (GABA-A) receptor, subunit gamma 1; Gabrg2 – gamma-aminobutyric acid (GABA-A) receptor, subunit gamma 2; Gnai2 – guanine nucleotide binding protein (G protein), alpha inhibiting 1; Gri – glutamate receptor, ionotropic; Gria1, 2, 3 – glutamate receptor ionotropic AMPA 1 (alpha 1, 2, 3); Grik2 – glutamate receptor, ionotropic, kainate 2 (beta 2); Grik5 – glutamate receptor, ionotropic, kainate 5 (gamma 2); Mek1/2 – mitogen-activated protein kinase kinase ½; Mgmt – O-6-methylguanine-DNA methyltransferase; Nmnat1 – nicotinamide nucleotide adenyltransferase 1; Nsf –N-ethylmaleimide sensitive fusion protein; P2ry1 – purinergic receptor P2Y, G-protein coupled 1; Pkca – protein kinase C alpha; Rgs2 – regulator of G protein signaling 2; Rgs 7 – regulator of G protein signaling 7; Stx3 – syntaxin 3. (For interpretation of the references to color in this figure legend, the reader is referred to the web version of this article.)
The finding that significant effects on gene expression were not observed at the 24-hr time point in the present study are not in agreement with the results of an operant ethanol self-administration study (Rodd et al., 2008), which reported over 200 significant differences (using a similar FDR and cutoff value) between the ethanol and water groups in the whole ACB. This lack of agreement between the operant study and the present scheduled access drinking study suggests that factors associated with the operant procedure may be having a greater effect than chronic alcohol drinking alone on gene expression within the ACB.
Comparison of the overall differences (when the time-course data are combined) in gene expression found in the ACB-shell of P rats between the ethanol and water groups in the present study versus differences in gene expression found in the ACB between inbred P rats operant responding for ethanol versus water or saccharin (Rodd et al., 2008) indicated there were only 10 genes in common between the two studies. There was increased expression of 8 genes (i.e., Cd99, Cox6a1, Cst3, Ftl1, Fau, Bat5, Mt3, Sepw1), with only Snta1 and Thap7 having reduced expression levels. Five of the 8 genes that had higher expression levels are involved in cellular stress response, which may be the result of chronic exposure to high blood levels of alcohol. The relatively low number of changed genes that were in common between the operant study (Rodd et al., 2008) and the present study supports the idea that conditioning, learning and motor activity factors associated with operant ethanol self-administration play an important role in gene expression within the ACB. In addition, operant ethanol self-administration may be activating different neuronal circuits within the shell and core, producing changes in gene expression that are not observed by measuring the ACB-shell alone. These results also suggest that the number of ethanol drinking episodes, and the blood alcohol levels attained have a small impact on gene expression changes in the ACB-shell.
The current results are in agreement with a recent study (Bell et al., 2009), which used a similar multiple scheduled access ethanol drinking procedure, and reported no significant differences in gene expression in the whole ACB 15 hr after the last drinking episode between the ethanol and water groups (n = 9/group). Overall, the results suggest that alcohol drinking produces small changes in the ACB or sub-regions of the ACB that could only be detected with much higher numbers of animals in each group. Therefore, even with repeated high binge-like alcohol intakes (Fig. 1), the changes at any of the time points were too small to establish statistical significance. To detect such small differences would require markedly increasing the number of animals at each time period.
Comparison of the effects of 24-hr free-choice drinking on changes (over 350 named genes differed) in gene expression in the ACB (Bell et al., 2009) with changes observed in the ACB-shell in the present study (Supplemental Table A) indicated almost no common changes, with the exception of Txnl1 (Thioredoxin-like 1) and Nmnat1 (nicotinamide nucleotide adenylyltransferase 1). The finding, that so few genes were in common between the 2 studies, suggests that factors, other than chronic exposure to alcohol, are having a bigger impact on changing gene expression. Since the changes in gene expression in the 24-hr free-choice drinking study (Bell et al., 2009) were measured approximately 15 hrs after alcohol had been removed, and this was the only time that this alcohol drinking group did not have access to alcohol, it is possible that the lack of common changes in gene expression between the two studies is due to different patterns and amounts of ethanol intakes, withdrawal effects, and/or measuring changes in the entire ACB versus the ACB-shell.
The ACB-shell and CeA are involved in mediating alcohol drinking behavior (Koob and Le Moal, 2008; Koob et al., 1998; McBride, 2002; McBride and Li, 1998; Roberts et al., 1996) and are good targets for determining neuronal changes that may occur as a consequence of alcohol drinking and contribute to the maintenance of high alcohol drinking. Because binge drinking is dangerous and could have serious consequences, it is important to understand the effects binge alcohol drinking has on brain functions. With binge-like drinking, in which daily intakes approach 6 g/kg and intakes for each of the 3 sessions are 1.5–2.0 g/kg (Fig. 1), significant effects on changes in gene expression were expected. With the 3 time points (1, 6 and 24 hr) combined, differences of 1.1- to 1.2- fold were observed in the ACB-shell of the ethanol group compared to the water group, suggesting that gene expression may be tightly regulated in this region.
Compared to the water group, the ethanol group had more genes with higher expression levels than lower expression levels in the ACB-shell (3.6-fold) and CeA (1.5-fold), suggesting that binge-like drinking by P rats may be increasing transcription. Increased transcription appears to be occurring in both regions, as indicated by an 8 to 1 ratio of genes with increased expression in the ‘positive regulation of transcription from RNA polymerase II promotor’ category for the ACB-shell (Table 2), and the 15 to 1 ratio of genes with increased expression in the ‘positive regulation of nucleic acid metabolism & DNA-dependent transcription’ category for the CeA (Table 2). However, alterations in different transcription mechanisms may be involved in the CeA and ACB-shell, because, with one exception (i.e., Thra), there were no genes in common between the two regions.
Comparison of the significant BP categories between the ACB-shell and CeA indicated that only 9 of the 34–38 different categories were in common, supporting the idea of region-dependent ethanol effects on gene expression. Furthermore, in some of the BP categories that were similar between the 2 regions, there were few genes in common within these categories. For example, in the synaptic transmission category (Table 2), only two genes (Gria1, Syt10) were in common between the 2 regions. In the ‘neurite development’ category, only one gene (Mtap2) was in common between the 2 regions (Table 2). The observation that different genes were altered within similar categories suggests that similar alterations in neuronal functions may be occurring in both regions, but the actions of ethanol on altering synaptic transmission and neurite development may be occurring by different mechanisms in the two regions. The higher proportion of genes that had increased expression compared to decreased expression in the synaptic transmission and neurite development categories (Table 2) suggest that changes may be taking place that enhance neuronal function, and, possibly, synaptic plasticity.
The results with the Ingenuity® pathways analysis also support the interpretation that binge-alcohol drinking is increasing synaptic plasticity, as evidenced by the higher expression levels of genes involved in transcription and long-term-potentiation in the ethanol group (Table 3). However, in the ACB-shell, development of ethanol-induced long-term-potentiation appears to result from changes in genes mediating calcium-signaling and its interactions with NMDA1 and AMPA 1 receptors (Fig. 2), whereas, in the CeA, alterations in genes for 3 different types of AMPA receptors, 2 different types of kainate receptors, and GABAA receptors appear to be involved (Fig. 3).
Chromosomes 5 (11 and 21 genes for the ACB-shell and CeA, respectively) and 6 (10 and 18 genes for the ACB-sh and CeA, respectively) had the most genes that were significantly different between the ethanol and water groups and were located within a rat ethanol preference QTL (Bice et al., 1998; Carr et al., 1998, 2003; Foroud et al., 2003). There were no genes in common within these QTLs that differed between the ethanol and water groups in both regions, suggesting regional differences in mRNA regulation is influencing the effects of chronic alcohol drinking.
Another study (Carr et al., 2007), using gene expression profiling of congenic rat strains to identify candidate genes for alcohol preference within a QTL interval on chromosome 4, identified 35 genes that were located within this QTL interval. Comparison of these QTL genes (Carr et al., 2007) with the alcohol responsive genes found in the present study indicated only one common gene, i.e., Snx10 (sorting nexin 10) in the CeA. This gene is involved in protein trafficking and formation of vacuoles in mammalian cells (Qin et al., 2006). The identification of Snx10 within a QTL for alcohol preference and the finding that changes in the expression level of this gene occurs in the CeA with ethanol drinking provides converging evidence to support Snx10 as a candidate gene for alcohol preference, and a gene responsive to high alcohol drinking.
Using a similar multiple scheduled access drinking protocol, Bell et al. (2006) reported changes in protein expression in the ACB of inbred P rats. There were 11 significant differences between the ethanol and water groups, with the ethanol group having higher protein expression in all cases. These results are consistent with the present findings and suggest that binge-like alcohol drinking is generally increasing mRNA and protein synthesis. However, there were no genes with increased expression levels in the present study that had a corresponding change in protein levels (Bell et al., 2006). The lack of agreement between protein changes and mRNA changes may be due to many factors, including mRNA changes are occurring mainly in glial and neuronal cell bodies, whereas protein changes can occur throughout the cell, including neuronal inputs to the ACB. In addition, measuring the whole ACB will likely give different results than measuring the ACB-shell, and differences in the P rat strain used (inbred vs. selectively bred) also needs to be considered.
In contrast, there were several common changes between protein levels (McBride et al., 2009) in the ACB-shell of P, produced by repeated i.p. injections of 1 g/kg ethanol, and gene expression in the present study (Supplemental Table A). Increased protein levels for Dctn2, Gnai1, Gnai2, Flot1, Snap25 and Phb2 were observed in the ACB-shell of P rats treated with ethanol, whereas ethanol drinking under scheduled access conditions increased expression of genes for Dctn1, Gnao, Flot1, Snap29 and Phb. The increased expression of Dctn (dynactin), Flot (flotillin) and Snap (Synaptosomal associated protein) suggests increased synaptic function (Frick et al., 2007; Kwinter et al., 2009; Pan et al., 2005; Swanwick et al., 2009) in the ethanol group, whereas the higher expression levels of Gna (guanine nucleotide binding protein) and Phb (prohibitin) may indicate enhanced G-protein coupled intracellular signaling and mitochondrial functioning (Merkwirth and Langer, 2009), respectively.
Kerns et al. (2005) reported on ethanol-responsive genes in 3 brains regions (including the ACB) of C57BL/6J and DBA/2J mice following a single i.p. injection of ethanol. Comparison of the ethanol-responsive genes observed in the ACB of the C57 mice with the ethanol-responsive genes observed in the ACB-shell of P rats in the present study indicated only 5 genes in common, i.e., Psmb6, Myo5a, Mtmr7, Flot1 and Calm3, all of which had higher expression levels in the ethanol group. These results suggest that changes in these genes may be associated with exposure to ethanol.
The current study did not find evidence for demylineation that has been reported for human alcoholics (Lewohl et al., 2000; Liu et al., 2006), although there were indications of neurotoxic effects of binge drinking in the present study, since several genes (Mt3, Cyb5r3, Hdac4, Mif, Tiam1, Maea, Fhit) involved in cell death of eukaryotic cells had increased expression in the ethanol drinking group (Table 3). In addition, comparison of alcohol-responsive genes in the ACB of human alcoholics (Flatscher-Bader et al., 2005) with alcohol-responsive genes in the ACB-shell (Supplemental Table A) indicated that there were no alcohol-responsive genes in common. Many factors could account for this lack of overlap between the 2 studies, which would include species differences, pattern and amount of alcohol drinking, time after death that tissue was procured, region of the ACB examined, etc.
Increased β-catenin levels in the superior frontal cortex has been reported for chronic alcoholics compared to controls (Al-Housseini et al., 2008). The findings of the present study are in agreement with these results, as suggested by the higher expression levels of genes involved in the Wnt/β-catenin signaling pathway, e.g., Akt, Cnd1, Tcf4 and Axin2 (Table 3). The results of the human and rodent studies suggest that chronic alcohol abuse is having a significant effect on a signal transduction pathway that could alter cellular function, and influence alcohol drinking and alcohol’s neurotoxic effects.
There were no candidate genes reported by the Collaborative Studies on the Genetics of Alcoholism (COGA) that were the same as genes with expression differences observed in the ACB-shell and CeA between the control and alcohol drinking groups in the present study. However, there were some genes that were within certain similar receptor classifications and/or biological functions between COGA and the present study. Differences in mRNA expression for certain GABA receptor subtypes, glutathione-S-transferase subtypes, calcium-binding proteins and cytokine/proinflammatory factors were found in the present study, and these genes are also within families of candidate genes reported by COGA (reviewed in Strat et al., 2008). In addition, mRNA expression for genes for certain glutamate receptor subunits (Chen et al., 2009), nicotinic receptor subunits (Wang et al., 2009), and dopamine receptor subtypes (Dick et al., 2007) were in families of candidate genes reported for COGA studies and were also found in the present study. Overall, these results may point toward common neurobiological systems that may contribute to excessive alcohol drinking behavior.
This study attempted to take into consideration (a) the schedule of sacrificing animals by sacrificing water control rats along with each of the time points for the ethanol groups; (b) a cohort effect by conducting the experiments with a single cohort of rats; (c) a batch effect by counterbalancing samples at each step (although this was not completely accomplished with the CeA samples); and (d) number of false positives by placing more emphasis on clustering within GO categories and/or fitting within a pathway analysis. In addition, the KEGG analyses for the ACB-shell and CeA did not add much more information than provided by the GO and Ingenuity analyses. Therefore, the results of the KEGG analyses are not discussed.
It was not possible to conduct confirmatory RT-PCR analysis of key genes within the current experiment. Essentially all of the RNA extracted from each sample was used for the microarray procedure. In two studies from our laboratory (Bell et al., 2009; Rodd et al., 2008), results with quantitative RT-PCR analysis confirmed microarray results in samples of the whole ACB.
In summary, the results of the present study indicated that binge-like alcohol drinking by P rats produced increased expression of genes involved in transcription, and synaptic transmission and plasticity within two limbic regions that mediate alcohol drinking, and that different mechanisms may be involved in the enhancement of these processes within each region.
Supplementary Material
Acknowledgments
This study was supported by AA07611, and INIA projects AA013521, AA013522, AA016652 and AA016660, and INGEN® (which is partially funded by Lilly Endowment Inc.).
Footnotes
Publisher's Disclaimer: This is a PDF file of an unedited manuscript that has been accepted for publication. As a service to our customers we are providing this early version of the manuscript. The manuscript will undergo copyediting, typesetting, and review of the resulting proof before it is published in its final citable form. Please note that during the production process errors may be discovered which could affect the content, and all legal disclaimers that apply to the journal pertain.
References
- Al-Housseini AM, Sivanandam TM, Bradbury EL, Tannenberg RK, Dodd PR, Gu Q. Upregulation of β-catenin levels in superior frontal cortex of chronic alcoholics. Alcohol Clin Exp Res. 2008;32:1080–1090. doi: 10.1111/j.1530-0277.2008.00670.x. [DOI] [PubMed] [Google Scholar]
- Alexander-Kaufman K, James G, Sheedy D, Harper C, Matsumoto I. Differential protein expression in the prefrontal white matter of human alcoholics: a proteomics study. Molecular Psych. 2006;11:56–65. doi: 10.1038/sj.mp.4001741. [DOI] [PubMed] [Google Scholar]
- Alexander-Kaufman K, Harper C, Wilce P, Matsumoto I. Cerebellar vermis proteome of chronic alcoholic individuals. Alcohol Clin Exp Res. 2007;31:1286–1296. doi: 10.1111/j.1530-0277.2007.00437.x. [DOI] [PubMed] [Google Scholar]
- Ashburner M, Ball CA, Blake JA, Botstein D, Butler H, Cherry JM, Davis AP, Dolinski K, Dwight SS, Eppig JT, Harris MA, Hill DP, Issel-Tarver L, Kasarskis A, Lewis S, Matese JC, Richardson JE, Ringwald M, Rubin GM, Sherlock G. Gene ontology: tool for the unification of biology. The Gene Ontology Consortium. Nat Genet. 2000;25:25–29. doi: 10.1038/75556. [DOI] [PMC free article] [PubMed] [Google Scholar]
- Barrett T, Suzek TO, Troup DB, Wilhite SE, Ngau WC, Ledoux P, Rudnev D, Lash AE, Fujibuchi W, Edgar R. NCBI GEO: mining millions of expression profiles--database and tools. Nucleic Acids Res. 2005;33:D562–566. doi: 10.1093/nar/gki022. Database issue. [DOI] [PMC free article] [PubMed] [Google Scholar]
- Bell RL, Rodd ZA, Murphy JM, McBride WJ. Use of selectively bred alcohol-preferring rats to study alcohol abuse, relapse and craving. In: Preedy VR, Watson RR, editors. Comprehensive Handbook of Alcohol Related Pathology. Vol. 3. New York: Academic Press, Elsevier Science; 2005. pp. 1515–1533. [Google Scholar]
- Bell RL, Kimpel MW, Rodd ZA, Strother WN, Bai F, Peper CL, Mayfield RD, Lumeng L, Crabb DW, McBride WJ, Witzmann FA. Protein expression changes in the nucleus accumbens and amygdala of inbred alcohol-preferring rats given either continuous or scheduled access to ethanol. Alcohol. 2006;40:3–17. doi: 10.1016/j.alcohol.2006.10.001. [DOI] [PubMed] [Google Scholar]
- Bell RL, Kimpel MW, McClintick JN, Strother WN, Carr LG, Liang T, Rodd ZA, Mayfield RD, Edenberg HJ, McBride WJ. Gene expression changes in the nucleus accumbens of alcohol-preferring rats following chronic ethanol consumption. Pharmacol Biochem Behav. 2009;94:131–147. doi: 10.1016/j.pbb.2009.07.019. [DOI] [PMC free article] [PubMed] [Google Scholar]
- Bice P, Foroud T, Bo R, Castelluccio P, Lumeng L, Li TK, Carr LG. Genomic screen for QTLs underlying alcohol consumption in the P and NP rat lines. Mamm Genome. 1998;9:949–955. doi: 10.1007/s003359900905. [DOI] [PubMed] [Google Scholar]
- Carr LG, Foroud T, Bice P, Gobbett T, Ivashina J, Edenberg HJ, Lumeng L, Li TK. Mapping of a quantitative trait locus for alcohol consumption in selectively bred rat lines. Alcohol Clin Exp Res. 1998;22:884–887. [PubMed] [Google Scholar]
- Carr LG, Habegger K, Spence J, Ritchotte A, Liu L, Lumeng L, Li TK, Foroud T. Analyses of quantitative trait loci contributing to alcohol preference in HAD1/LAD1 and HAD2/LAD2 rats. Alcohol Clin Exp Res. 2003;27:1710–1717. doi: 10.1097/01.ALC.0000097161.51093.71. [DOI] [PubMed] [Google Scholar]
- Carr LG, Kimpel MW, Liang T, McClintick JN, McCall K, Morse M, Edenberg HJ. Identification of candidate genes for alcohol preference by expression profiling of congenic rat strains. Alcohol Clin Exp Res. 2007;31:1089–1098. doi: 10.1111/j.1530-0277.2007.00397.x. [DOI] [PMC free article] [PubMed] [Google Scholar]
- Chen AC, Tang Y, Rangaswamy M, Wang JC, Almasy L, Foroud T, Edenberg HJ, Hesselbrock V, Nurnberger J, Jr, Kuperman S, O’Connor SJ, Schuckit MA, Bauer LO, Tischfield J, Rice JP, Bierut L, Goate A, Porjesz B. Association of single nucleotide polymorphisms in a glutamate receptor gene (GRM8) with theta power of event-related oscillations and alcohol dependence. Am J Med Genet B Neuropyschiatr Genet. 2009;150B:359–268. doi: 10.1002/ajmg.b.30818. [DOI] [PMC free article] [PubMed] [Google Scholar]
- Dick DM, Wang JC, Plunkett J, Aliev F, Hinrichs A, Bertelsen S, Budde JP, Goldstein EL, Kaplan D, Edenberg HJ, Nurnberger J, JR, Hesselbrock V, Schuckit M, Kuperman S, Tischfield J, Porjesz B, Begleiter H, Bierut LJ, Goate A. Family-based association analyses of alcohol dependence phenotypes across DRD2 and neighboring gene ANKK1. Alcohol Clin Exp Res. 2007;31:1645–1653. doi: 10.1111/j.1530-0277.2007.00470.x. [DOI] [PubMed] [Google Scholar]
- Edenberg HJ, Strother WN, McClintick JN, Tian H, Stephans M, Jerome RE, Lumeng L, Li TK, McBride WJ. Gene expression in the hippocampus of inbred alcohol-preferring and -nonpreferring rats. Genes Brain Behav. 2005;4:20–30. doi: 10.1111/j.1601-183X.2004.00091.x. [DOI] [PubMed] [Google Scholar]
- Edgar R, Domrachev M, Lash AE. Gene Expression Omnibus: NCBI gene expression and hybridization array data repository. Nucleic Acids Res. 2002;30:207–210. doi: 10.1093/nar/30.1.207. [DOI] [PMC free article] [PubMed] [Google Scholar]
- Flatscher-Bader T, van der Brug M, Hwang JW, Gochee PA, Matsumoto I, Niwa S, Wilce PA. Alcohol-responsive genes in the frontal cortex and nucleus accumbens of human alcoholics. J Neurochem. 2005;93:359–370. doi: 10.1111/j.1471-4159.2004.03021.x. [DOI] [PubMed] [Google Scholar]
- Foroud T. Analyses of quantitative trait loci contributing to alcohol preference in HAD1/LAD1 and HAD2/LAD2 rats. Alcohol Clin Exp Res. 2003;27:1710–1717. doi: 10.1097/01.ALC.0000097161.51093.71. [DOI] [PubMed] [Google Scholar]
- Frick M, Bright NA, Riento K, Bray A, Merrified C, Nichols BJ. Coassembly of flotillins induces formation of membrane microdomains, membrane curvature, and vesicle budding. Curr Biol. 2007;17:1151–1156. doi: 10.1016/j.cub.2007.05.078. [DOI] [PubMed] [Google Scholar]
- Gentleman RC. Using GO for statistical analysis. Proc COMPSTAT. 2004;2004:171–180. [Google Scholar]
- Gentleman RC, Carey VJ, Bates DM, Bolstad B, Dettling M, Dudoit S, Ellis B, Gautier L, Ge Y, Gentry J, Hornik K, Hothorn T, Huber W, Iacus S, Irizarry R, Leisch F, Li C, Maechler M, Rossini AJ, Sawitzki G, Smith C, Smyth G, Tierney L, Yang JY, Zhang J. Bioconductor: open software development for computational biology and bioinformatics. Genome Biol. 2004;5:R80. doi: 10.1186/gb-2004-5-10-r80. [DOI] [PMC free article] [PubMed] [Google Scholar]
- Harris MA, Clark J, Ireland A, Lomax J, Ashburner M, Foulger R, Eilbeck K, Lewis S, Marshall B, Mungall C, Richter J, Rubin GM, Blake JA, Bult C, Dolan M, Drabkin H, Eppig JT, Hill DP, Ni L, Ringwald M, Balakrishnan R, Cherry JM, Christie KR, Costanzo MC, Dwight SS, Engel S, Fisk DG, Hirschman JE, Hong EL, Nash RS, Sethuraman A, Theesfeld CL, Botstein D, Dolinski K, Feierbach B, Berardini T, Mundodi S, Rhee SY, Apweiler R, Barrell D, Camon E, Dimmer E, Lee V, Chisholm R, Gaudet P, Kibbe W, Kishore R, Schwarz EM, Sternberg P, Gwinn M, Hannick L, Wortman J, Berriman M, Wood V, de la Cruz N, Tonellato P, Jaiswal P, Seigfried T, White R. The Gene Ontology (GO) database and informatics resource. Nucleic Acids Res. 2004;32:D258–261. doi: 10.1093/nar/gkh036. Database issue. [DOI] [PMC free article] [PubMed] [Google Scholar]
- Ikemoto S, Glazier BS, Murphy JM, McBride WJ. Role of D1 and D2 receptors in the nucleus accumbens in mediating reward. J Neurosci. 1997;17:8580–8587. doi: 10.1523/JNEUROSCI.17-21-08580.1997. [DOI] [PMC free article] [PubMed] [Google Scholar]
- Irizarry RA, Hobbs B, Collin F, Beazer-Barclay YD, Antonellis KJ, Scherf U, Speed TP. Exploration, normalization, and summaries of high density oligonucleotide array probe level data. Biostatistics. 2003;4:249–264. doi: 10.1093/biostatistics/4.2.249. [DOI] [PubMed] [Google Scholar]
- Kalivas PW, Churchill L, Klitenick MA. The circuitry mediating the translation of motivational stimuli into adaptive motor responses. In: Kalivas PW, Barnes CD, editors. Limbic Motor Circuits and Neuropsychiatry. CRC Press; Boca Raton: 1993. pp. 237–288. [Google Scholar]
- Kerns RT, Ravindranathan A, Hassan S, Cage MP, York T, Sikela JM, Williams RW, Miles MF. Ethanol-responsive brain region expression networks: Implications for behavioral responses to acute ethanol in DBA/2J versus C57BL/6J mice. J Neurosci. 2005;25:2255–2266. doi: 10.1523/JNEUROSCI.4372-04.2005. [DOI] [PMC free article] [PubMed] [Google Scholar]
- Kimpel MW, Strother WN, McClintick JN, Carr LG, Edenberg HJ, McBride WJ. Functional gene expression differences between inbred alcohol-preferring (iP) and –non-preferring (iNP) rats in five brain regions. Alcohol. 2007;41:95–132. doi: 10.1016/j.alcohol.2007.03.003. [DOI] [PMC free article] [PubMed] [Google Scholar]
- Koob GF, Le Moal M. Neurobiological mechanisms for opponent motivational processes in addiction. Philos Trans R Soc Lond B Biol Sci. 2008;363:3113–3123. doi: 10.1098/rstb.2008.0094. [DOI] [PMC free article] [PubMed] [Google Scholar]
- Koob GF, Roberts AJ, Schulteis G, Parsons LF, Heyser CJ, Hyytia P, Merlopich E, Weiss F. Neurocircuitry targets in ethanol reward and dependence. Alcohol Clin Exp Res. 1998;22:3–9. [PubMed] [Google Scholar]
- Kwinter DM, Lo K, Mafi P, Silverman MA. Dynactin regulates bidirectional transport of dense-core vesicles in the axon and dendrites of cultured hippocampal neurons. Neuroscience. 2009;162:1001–1010. doi: 10.1016/j.neuroscience.2009.05.038. [DOI] [PubMed] [Google Scholar]
- Lewohl JM, Wang L, Miles MF, Zhang L, Dodd PR, Harris RA. Gene expression in human alcoholism: microarray analysis of frontal cortex. Alcohol Clin Exp Res. 2000;24:1873–1882. [PubMed] [Google Scholar]
- Lewohl JM, Van Dyk DD, Craft GE, Innes DJ, Mayfield RD, Cobon G, Harris RA, Dodd PR. The application of proteomics to the human alcoholic brain. Ann NY Acad Sci. 2004;1025:14–26. doi: 10.1196/annals.1316.002. [DOI] [PubMed] [Google Scholar]
- Liu J, Lewohl JM, Dodd PR, Randall PK, Harris RA, Mayfield RD. Gene expression profiling of individual cases reveals consistent transcriptional changes in alcoholic human brain. J Neurochem. 2004;90:1050–1058. doi: 10.1111/j.1471-4159.2004.02570.x. [DOI] [PubMed] [Google Scholar]
- Liu J, Lewohl JM, Harris RA, Iyer VR, Dodd PR, Randall PK, Mayfield RD. Patterns of gene expression in the frontal cortex discriminate alcoholic from nonalcoholic individuals. Neuropsychopharmacology. 2006;31:1574–1582. doi: 10.1038/sj.npp.1300947. [DOI] [PubMed] [Google Scholar]
- Matsumoto I, Alexander-Kaufman K, Iwazaki T, Kashem MA, Matsuda-Matsumoto H. CNS proteomes in alcohol and drug abuse and dependence. Expert Rev Proteomics. 2007;4:539–552. doi: 10.1586/14789450.4.4.539. [DOI] [PubMed] [Google Scholar]
- Mayfield RD, Lewohl JM, Dodd PR, Herlihy A, Liu J, Harris RA. Patterns of gene expression are altered in the frontal and motor cortices of human alcoholics. J Neurochem. 2002;81:802–813. doi: 10.1046/j.1471-4159.2002.00860.x. [DOI] [PubMed] [Google Scholar]
- McBride WJ. Central nucleus of the amygdala and the effects of alcohol and alcohol-drinking behavior in rodents. Pharmacol Biochem Behav. 2002;71:509–515. doi: 10.1016/s0091-3057(01)00680-3. [DOI] [PubMed] [Google Scholar]
- McBride WJ, Li TK. Animal models of alcoholism: neurobiology of high alcohol-drinking behavior in rodents. Crit Rev Neurobiol. 1998;12:339–369. doi: 10.1615/critrevneurobiol.v12.i4.40. [DOI] [PubMed] [Google Scholar]
- McBride WJ, Schultz JA, Kimpel MW, McClintick JN, Wang M, You J, Rodd ZA. Differential effects of ethanol in the nucleus accumbens shell of alcohol-preferring (P), alcohol-non-preferring (NP) and Wistar rats: A proteomics study. Pharmacol Biochem Behav. 2009;92:304–313. doi: 10.1016/j.pbb.2008.12.019. [DOI] [PMC free article] [PubMed] [Google Scholar]
- McClintick JN, Jerome RE, Nicholson CR, Crabb DW, Edenberg HJ. Reproducibility of oligonucleotide arrays using small samples. BMC Genomics. 2003;4:1–15. doi: 10.1186/1471-2164-4-4. [DOI] [PMC free article] [PubMed] [Google Scholar]
- Merkwirth C, Langer T. Prohibitin function within mitochondria: essential roles for cell proliferation and cristae morphogenesis. Biochim Biophys Acta. 2009;1793:27–32. doi: 10.1016/j.bbamcr.2008.05.013. [DOI] [PubMed] [Google Scholar]
- Mulligan MK, Ponomerav I, Hitzemann RJ, Belknap JK, Tabakoff B, Harris RA, Crabbe JC, Blednov YA, Grahame NJ, Phillips TJ, Finn DA, Hoffman PL, Iyer VR, Koob GJ, Bergeson SE. Toward understanding the genetics of alcohol drinking through transcriptome meta-analysis. Proc Natl Acad Sci USA. 2006;103:6368–6373. doi: 10.1073/pnas.0510188103. [DOI] [PMC free article] [PubMed] [Google Scholar]
- Murphy JM, Gatto GJ, Waller MB, McBride WJ, Lumeng L, Li TK. Effects of scheduled access on ethanol intake by the alcohol-preferring P line of rats. Alcohol. 1986;3:331–336. doi: 10.1016/0741-8329(86)90010-8. [DOI] [PubMed] [Google Scholar]
- Murphy JM, Stewart RB, Bell RL, Badia-Elder NE, Carr LG, McBride WJ, Lumeng L, Li TK. Phenotypic and genotypic characterization of the Indiana University rat lines selectively bred for high and low alcohol preference. Behav Genet. 2002;32:363–388. doi: 10.1023/a:1020266306135. [DOI] [PubMed] [Google Scholar]
- Pan PY, Cai Q, Lin L, Lu PH, Duan S, Sheng AH. SNAP-29-mediated modulation of synaptic transmission in cultured hippocampal neurons. J Biol Chem. 2005;280:25769–25779. doi: 10.1074/jbc.M502356200. [DOI] [PMC free article] [PubMed] [Google Scholar]
- Paxinos G, Watson C. The Rat Brain in Stereotaxic Coordinates. New York: Academic Press; 1998. [Google Scholar]
- Qin B, He M, Chen X, Pei D. Sorting nexin 10 induces giant vacuoles in mammalian cells. J Biol Chem. 2006;281:36891–36896. doi: 10.1074/jbc.M608884200. [DOI] [PubMed] [Google Scholar]
- Roberts AJ, Cole M, Koob GF. Intra-amygdala muscimol decreases operant ethanol self-administration in dependent rats. Alcohol Clin Exp Res. 1996;20:1289–1298. doi: 10.1111/j.1530-0277.1996.tb01125.x. [DOI] [PubMed] [Google Scholar]
- Rodd ZA, Kimpel MW, Edenberg HJ, Bell RL, Strother WN, McClintick JN, Carr LG, Liang T, McBride WJ. Differential gene expression in the nucleus accumbens with ethanol self-administration in inbred alcohol-preferring rats. Pharmacol Biochem Behav. 2008;89:481–498. doi: 10.1016/j.pbb.2008.01.023. [DOI] [PMC free article] [PubMed] [Google Scholar]
- Rodd-Henricks ZA, Bell RL, Kuc KA, Murphy JM, McBride WJ, Lumeng L, Li TK. Effects of concurrent access to multiple ethanol concentrations and repeated deprivations on alcohol intake of alcohol-preferring rats. Alcohol Clin Exp Res. 2001;25:1140–1150. [PubMed] [Google Scholar]
- Saito M, Smiley J, Toth R, Vadasz C. Microarray analysis of gene expression in rat hippocampus after chronic ethanol treatment. Neurochem Res. 2002;27:1221–1229. doi: 10.1023/a:1020937728506. [DOI] [PubMed] [Google Scholar]
- Saito M, Szakall I, Toth R, Kovacs KM, Oros M, Prasad VV, Blumenberg M, Vadasz C. Mouse striatal transcriptome analysis: effects of oral self-administration of alcohol. Alcohol. 2004;32:223–241. doi: 10.1016/j.alcohol.2004.02.005. [DOI] [PubMed] [Google Scholar]
- Smyth GK. Linear models and empirical Bayes methods for assessing differential expression in microarray experiments. Statistical Applications in Genetics and Molecular Biology. 2004;3(1) doi: 10.2202/1544-6115.1027. [DOI] [PubMed] [Google Scholar]
- Storey JD, Taylor JE, Siegmund D. Strong control, conservative point estimation, and simultaneous conservative consistency of false discovery rates: A unified approach. J Royal Statistical Soc, Series B. 2004;66:187–205. [Google Scholar]
- Strat YL, Ramoz N, Schumann G, Gorwood P. Molecular genetics of alcohol dependence and related endophenotypes. Curr Genomics. 2008;9:444–451. doi: 10.2174/138920208786241252. [DOI] [PMC free article] [PubMed] [Google Scholar]
- Swanwick CC, Shapiro ME, Yi Z, Chang K, Wenthold RJ. NMDA receptors interact with flotillin-1 and -2, lipid raft-associated proteins. FEBS Lett. 2009;583:1226–1230. doi: 10.1016/j.febslet.2009.03.017. [DOI] [PubMed] [Google Scholar]
- Treadwell JA, Singh SM. Microarray analysis of mouse brain gene expression following acute ethanol treatment. Neurochem Res. 2004;29:357–369. doi: 10.1023/b:nere.0000013738.06437.a6. [DOI] [PubMed] [Google Scholar]
- Wang JC, Grucza R, Cruchaga C, Hinrichs AL, Bertelsen S, Budde JP, Fox L, Goldstein E, Reyes O, Saccone N, Saccone S, Xuei X, Bucholz K, Kuperman S, Nurnberger J, Jr, Rice JP, Schuckit M, Tischfield J, Hesselbrock V, Porjesz B, Edenberg HJ, Bierut LJ, Goate AM. Genetic variation in the CHRNA5 gene affects mRNA levels and is associated with risk for alcohol dependence. Mol Psychiatry. 2009;14:501–510. doi: 10.1038/mp.2008.42. [DOI] [PMC free article] [PubMed] [Google Scholar]
Associated Data
This section collects any data citations, data availability statements, or supplementary materials included in this article.