Abstract
Alcohol-sensitive type 1 equilibrative nucleoside transporter (ENT1) regulates adenosine-mediated glutamate neurotransmission in the brain. Our behavioral studies suggest that the diminished aversive effects of ethanol and the increased resistance to acute ethanol intoxication in mice lacking ENT1, could be related to increased voluntary ethanol self-seeking behavior. In addition, we found that ENT1 null mice were resistant to the ataxic effects of glutamate antagonists when tested on a rotarod. Using microdialysis experiments, we examined glutamate levels in the dorsal and ventral striatum in response to ethanol. In the dorsal striatum of ENT1 null mice, a low intoxicating dose of ethanol (1.5 g/kg) induced a greater increase of glutamate levels, while a higher hypnotic dose of ethanol (3.0 g/kg) decreased to a lesser degree the glutamate levels, compared with that of wild-type mice. In the ventral striatum, however, the low (1.5 g/kg) and the high (3.0 g/kg) ethanol doses altered glutamate levels similarly in both genotypes. Our results suggest that adenosine-regulated glutamatergic signaling contributes to a reduced level of alcohol response, which might be associated with a higher susceptibility for alcoholism in humans.
1. Introduction
Alcohol intake alters the homeostasis between excitatory and inhibitory neurotransmitters and the subsequent receptor-mediated signaling cascade in the brain [1]. One initial response to alcohol intoxication is the increase of adenosine, which potentiates GABA and dampens glutamate neurotransmission in the brain [2,3]. ENT1 (type 1 equilibrative nucleoside transporter), an ethanolsensitive adenosine transporter, is known to regulate adenosine levels in response to acute ethanol treatment in cultured cells [4]. ENT1 null (ENT1−/−) mice displayed reduced acute intoxicating effects of ethanol and increased alcohol consumption compared to wild-type (ENT1+/+) littermates [5]. One of the neural mechanisms underlying these behaviors is attributed to increased glutamate neurotransmission in the striatum [5].
Since increased glutamate levels regulate several attributes of alcoholism including withdrawal seizures [6] and excessive ethanol drinking [7,8], ENT1−/− mice would be a suitable model to understand adenosine-mediated glutamate signaling in alcoholism [9]. However, it is yet unknown whether alterations in reward and/or reinforcement contribute to the excessive alcohol consumption in ENT1−/− mice or what the relevant consequences are for increased glutamate levels in the striatum of ENT1−/− mice.
Here we report that ENT1−/− mice display reduced ethanol-induced aversion and increased motivational effects of ethanol as compared to ENT1+/+ littermates, which appear to be, in part, regulated by glutamate neurotransmission in the dorsal striatum.
2. Materials and Methods
2.1. Animals
ENT1−/− mice were generated as described [5]. The genetic background of ENT1−/− and ENT1+/+ mice was ~50% C57BL/6J and ~50% 129X1/SvJ. We used 8–16 week old male littermates for experiments. Mice were housed in standard Plexiglas cages with food and water ad libitum. The colony room was maintained on a 12 h light/dark cycle with lights on at 6:00 a.m. Animal care and handling procedures were approved by the Mayo Clinic Institutional Animal Care and Use Committees in accordance with NIH guidelines.
2.2. Place Conditioning
Conditioned place preference (CPP) and conditioned place aversion (CPA) experiments were performed using two-compartment computerized chambers with a dimension of 13 × 26 × 16 cm for each chamber (Med Associates, VT) as described [10,11]. One compartment had a stainless steel rod floor consisting of 3.2 mm rods placed on 7.9 mm centers and the other had a stainless steel mesh floor (6.35 × 6.35 mm). Movement of mice was detected by beam breaks and data were analyzed using the Activity Monitor software provided by the manufacturer. The experiment consisted of three phases: pretest, conditioning, and test. In phase I, mice were allowed to explore both compartments for 30 min. Mice that spent more than 65% of the time in the same compartment were excluded from the tests in order to follow an unbiased procedure. Phase II consisted of two 5-min daily sessions on four consecutive days. In CPP experiments, in the morning (8:00 am) mice were injected with saline and confined to one compartment for 5 5 min; in the afternoon (2:00 pm), they were injected with ethanol (1.0, 1.5, 2.0, 2.5 g/kg, 20% v/v in saline) and confined to the other compartment for 5 min. In CPA experiments, mice were injected with saline in the morning or ethanol (1.5 g/kg, 20% v/v in saline) in the afternoon, immediately after being exposed to either of the two compartments for 5 min. In phase III, mice were tested as in phase I with free access to both compartments for 30 min in the morning. A score of preference was calculated as the percentage of time spent in the ethanol-paired compartment.
2.3. Operant ethanol self-administration
The self-administration experiment was performed using a modified sucrose substitution procedure [12–14]. In computer-controlled mouse operant chambers (Model ENV-307W, Med Associates, VT), syringe pumps delivered fluid (0.01 ml) after every third lever press (FR = 3) to each receptacle. First, mice were trained to orally self-administer 10% sucrose (10S) until they successfully learned lever pressing FR = 3. During this sucrose acquisition period, we examined whether mice showed any side preference by altering active (sucrose) side. Then, ethanol was added to the 10% sucrose and the sucrose concentration was reduced over sessions until 10% ethanol alone in water was presented as the reinforcement. The following concentrations were employed in this order: 10S, 10S10E (10% sucrose and 10% ethanol), 5S10E, and 10E. Mice were tested in daily 30 min sessions with one lever producing ethanol and the other producing water. We measured the number of lever presses per session.
2.4. Locomotor activity
Locomotor activity was measured in open field chambers (27 × 27 cm) that automatically recorded activity via photo beam breaks (Med Associates, VT). Spontaneous locomotor activity and habituation were measured over three consecutive days (once daily), during which time mice were placed in the center of the open field chamber and the horizontal distance traveled (cm) was recorded for 60 min. For the ethanol-stimulated locomotor activity test, mice were injected with ethanol (1.5 g/kg, i.p., 20% v/v in saline) and the total distance traveled was measured for 20 min. Baseline locomotor activity was measured by injecting an equivalent volume of saline in the same mice. Data for each subject were corrected for baseline variation by subtracting the distance traveled following saline injection from the distance traveled following ethanol injection.
2.5. Stationary dowel test
Acute functional tolerance (AFT) was measured by a stationary dowel test as described [15]. Mice were trained to remain on a stationary dowel suspended 50 cm above a bedding of corncobs for more than 1 min. Mice were then given 1.5 g/kg ethanol (i.p., 20% v/v in saline) and placed on the dowel every 5 min until it was able to remain on the dowel for 1 min. At this time, a blood sample (BEC1) was taken by a tail vein incision and collected in 50-µl heparinized capillary tubes (Fisher Scientific, Pittsburgh, PA). Mice were immediately given a second injection of 1.5 g/kg ethanol and tested every 5 min until it was again able to remain on the dowel for 1 min, and then a second blood sample (BEC2) was taken. The duration of ataxia after the first and second ethanol injection were recorded. Approximately 50 µl blood samples were collected to determine blood ethanol concentration (BEC) using an Analox AM-1 analyzer (Analox Instruments, Luneburg, MA). We measured 1) the difference between BEC2 and BEC1 (ΔBEC) which was defined as the magnitude of AFT, 2) the rate of AFT calculated as ΔBEC/duration of ataxia following the second injection, and 3) the threshold for sensitivity to the ataxic effect of ethanol calculated by extrapolating the line determined by the BEC1 and BEC2 values to zero time [16].
2.6. Rotarod tests
Motor in-coordination (ataxia) was measured by using a mouse rotarod treadmill (UGO Basile, Italy) rotating at a fixed speed of 20 rpm as described [17]. Mice were placed on the rotarod every 15 min after administration of drugs and latency to fall was measured. We examined the pharmacological effects of competitive NMDA receptor antagonist (R,S)-(E)-2-amino-4-methyl-5-phosphono-3-pentenoic acid monohydrate (CGP37849, 10 mg/kg, Ascent Scientific, Princeton, NJ), uncompetitive NMDA receptor blocker 10-11-dihydro-5-methyl-5H-dibenzo[a,d] cyclohepten-5,10-imine hydrogen maleate (MK-801, 0.5 mg/kg, Sigma, St. Louis, MO), glycine site NMDAR antagonist (S)-(-)-3-amino-1-hydroxypyrrolid-2-one (HA-966, 5 mg/kg, Tocris Bioscience, Bristol, UK), and AMPA receptor antagonist, 2,3-dihydroxy-6-nitro-7-sulfamoylbenzo[f]quinoxaline-2,3-dione (NBQX, 100 mg/kg, Sigma, St. Louis, MO). All drugs were dissolved in isotonic saline and injected intraperitoneally (i.p., 10 ml/kg).
2.7. Microdialysis
To measure extracellular glutamate levels in the brain, a guide cannula was implanted into the shell of the nucleus accumbens (AP: 1.3 mm; ML: 0.5 mm; DV: -3.5 mm) or caudate putamen (AP: 0.5 mm; ML: -2.0 mm; DV: -2.0 mm) as previously described [18]. Mice were given 7 to 10 days for recovery. During this period, mice were placed in the test chamber for 1 h daily to habituate the handling procedure and experimental environment. A microdialysis probe with 2.0 mm cellulose membrane (Eicom, Kyoto, Japan; MW cut off: 50,000 Da) was inserted and secured to the guide cannula. The probe was connected to a microsyringe pump (Eicom, Kyoto, Japan), which delivered Ringer’s solution (145 mM NaCl, 2.7 mM KCl, 1.2 mM CaCl2, 1.0 mM MgCl2, pH 7.4) at a 1.0 µl/min flow rate. To measure glutamate level changes in response to ethanol, a low (1.5 g/kg) or a high (3.0 g/kg) dose of ethanol was i.p. injected after a 3-h stabilization period, samples were collected every 20 min and immediately frozen and stored at −80 °C until analyzed.
2.8. HPLC-ECD analysis
Dialysate samples were analyzed to quantify the glutamate concentration using HPLC-ECD (HTEC-500, Eicom) coupled with an auto-sampler (719D, Alcott, GA). HPLC separation was done using a separation column (GU-GEL, 4.6 × 150 mm, Eicom) and an enzyme column (E-ENZYMPAK, 3 × 4 mm, Eicom), with detection by a platinum electrode detector set at +450 mV (against an Ag/AgCl reference) (WE-PT, Eicom). The mobile phase consisted of 60 mM NH4Cl-HH4OH, 250 mg hexadecyltrimethylammonium bromide, and EDTA-2Na (0.1 mg/L). Separation was performed at a column temperature of 33 °C with a mobile phase flow rate of 0.4 ml/min. Data were collected through an EPC-500 processor, and peak areas were calculated using the PowerChrom software (Eicom).
2.9. Statistical analysis
Data are presented as the mean ± s.e.m (standard error of the mean). For conditioned place preference, aversion, rotarod, and microdialysis experiments, we analyzed data using two-way repeated measures ANOVA followed by a Tukey post hoc test for individual comparisons. For ethanol-induced locomotor activity, we examined data using two-way ANOVA. For other data, we used two-tailed t-tests. Results were considered significantly different when p < 0.05.
3. Results
3.1. Conditioned place preference and aversion
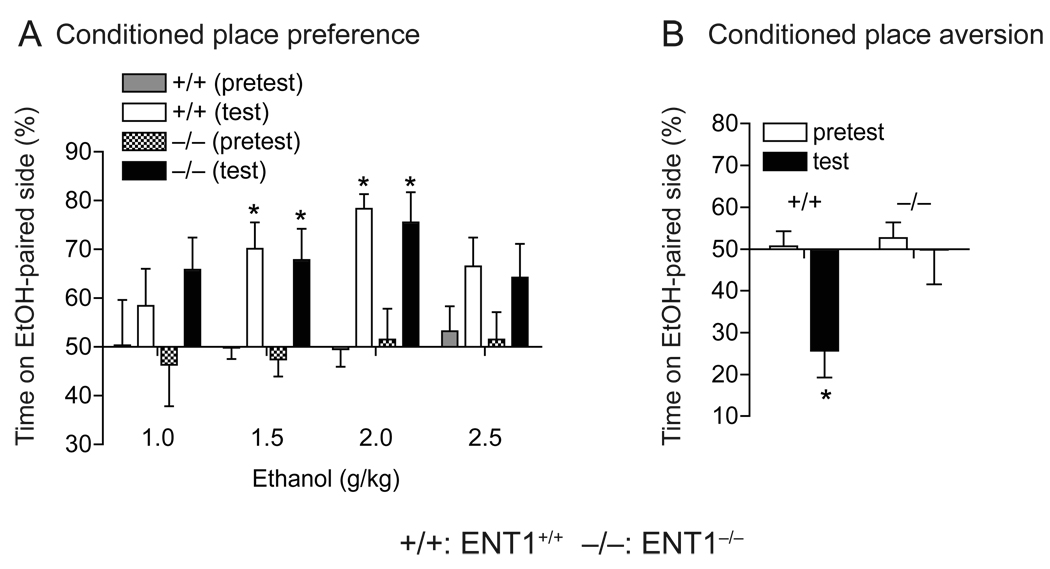
First, we investigated whether excessive alcohol consumption observed in ENT1−/− mice [5] was associated with a change in the rewarding properties of ethanol. We examined ethanol reward and aversion using place-conditioning experiments. Mice displayed an ethanol-induced conditioned place preference (CPP) in a dose-dependent manner without a significant difference between genotypes (F1,22 = 0.02, p = 0.889, two-way repeated measures ANOVA) (Fig. 1A). Two-way repeated measures ANOVA revealed that both ENT1−/− and ENT1+/+ mice showed an increase in time spent in the ethanol paired side after conditioning at 1.5 (F1,11 = 24.2, p < 0.001), 2.0 (F1,11 = 39.9, p < 0.001), and 2.5 (F1,11 = 8.1, p = 0.016) g/kg ethanol doses, but not at 1.0 g/kg (F1,11 = 1.3, p = 0.295) ethanol dose when compared to the saline-treated groups. There were no differences between genotypes at 1.0, 1.5, and 2.0 g/kg ethanol doses. Interestingly, at 2.5 g/kg ethanol dose, ENT1−/− mice showed no effect of ethanol treatment (p > 0.05, Tukey post hoc test) while ENT1+/+ mice displayed a significant effect of ethanol treatment (p = 0.041).
Fig. 1.
Conditioned place preference and aversion in response to ethanol. (A) ENT1−/− mice (−/−) showed similar levels of ethanol reward as compared to ENT1+/+ mice (+/+). At doses of 1.5 and 2.0 g/kg (i.p.), ethanol developed conditioned place preference in both genotypes. There was no significant difference in preference scores between genotypes (n = 12 for each genotype; *p < 0.05 compared to pretest by Tukey tests). (B) Absence of ethanol-induced aversion in ENT1−/− mice. Ethanol (1.5 g/kg, i.p.) produced a significant conditioned place aversion in ENT1+/+ mice, but this was not altered in ENT1−/− mice (n = 10 for each genotype; *p < 0.05 compared to pretest by Tukey tests). Data are presented as mean ± s.e.m.
Next, we examined the aversive effects of ethanol using a conditioned place aversion (CPA) paradigm [10,11]. In the CPA experiment, ENT1+/+ mice displayed expected conditioned place aversion induced by eight consecutive conditionings with 1.5 g/kg ethanol while there was no significant place aversion induced by the same dose of ethanol observed in ENT1−/− mice as compared to the saline-treated control group for each genotype. Two-way repeated measures ANOVA showed significant effects of genotype (F1,9 = 6.77, p = 0.028) and a marginal significance in ethanol treatment (F1,9 = 5.09, p = 0.05), with significant interaction between genotype and ethanol treatment (F1,9 = 14.01, p = 0.005) (Fig. 1B).
3.2. Operant ethanol self-administration
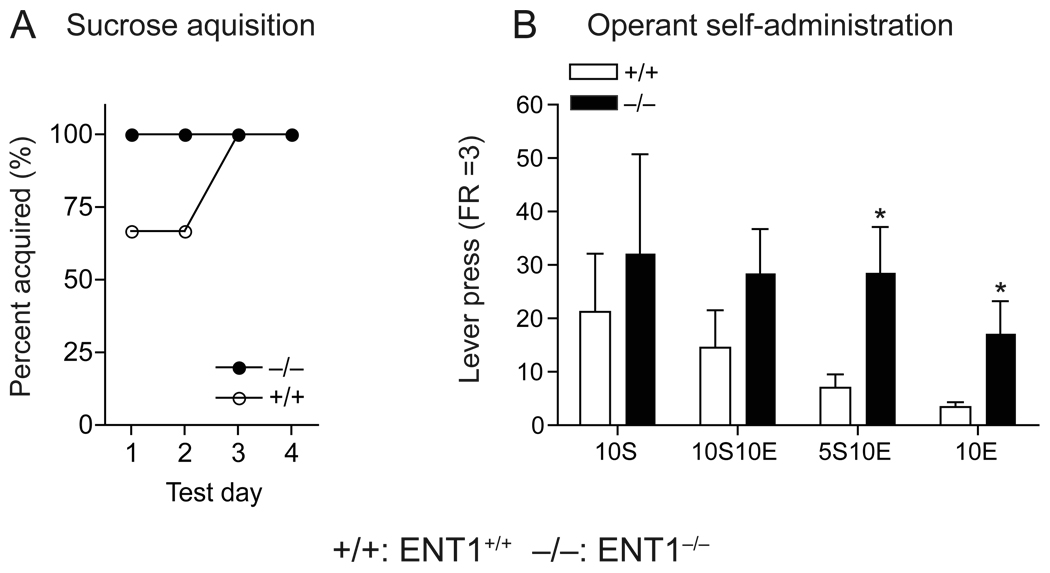
We tested whether a reduction in the aversive properties of ethanol could increase the reinforcing properties of ethanol using an operant ethanol self-administration procedure in which mice were trained in daily 30 min sessions to lever press to obtain ethanol orally. During the sucrose acquisition period, neither genotype demonstrated a side preference (data not shown) and both genotypes successfully learned to lever press at FR = 3 (Fig. 2A). While data showed no significant difference in the 10% sucrose (10S) and 10% sucrose and 10% ethanol (10S10E) self-administration between genotypes, ENT1−/− mice displayed higher rates of lever pressing for 5S10E and 10E as compared to ENT1+/+ mice (Fig. 2B). Consistent with our previous data showing that ENT1−/− mice consumed more ethanol compared to ENT1+/+ littermates in a two-bottle ethanol drinking experiment [5], our findings suggest that ENT1−/− mice voluntarily seek more ethanol, which is possibly due to the reduced aversive effects of ethanol.
Fig. 2.
Operant ethanol self-administration. (A) Similar sucrose acquisition (FR = 3) between genotypes. (B) Similar self-administration for 10% sucrose (10S) and 10% sucrose/10% ethanol (10S10E) between genotypes. ENT1−/− mice (n = 6) showed significantly higher rates of lever pressing than did ENT1+/+ mice (n = 7) when 10% ethanol was added to the 5% sucrose (5S10E) or 10% ethanol alone in water (10E) (*p < 0.05 compared to ENT1+/+ mice by two-tailed t test). Data are presented as mean ± s.e.m.
3.3. Ethanol-induced locomotion
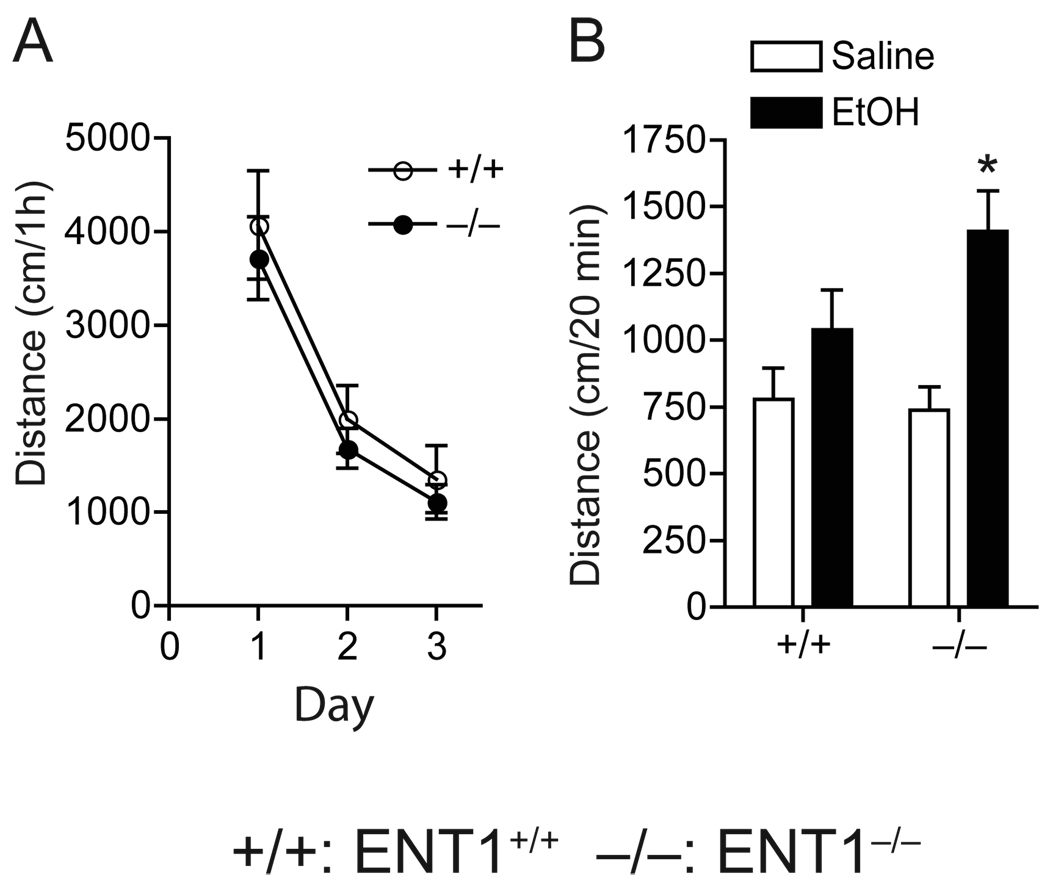
To investigate whether the absence of ethanol aversion in ENT1−/− mice could be associated with the elevated locomotor-stimulating effects and/or decreased ataxic effects induced by a low ethanol dose (1.5 g/kg), we first examined the ethanol-induced locomotor-stimulating effect in an open field chamber. Baseline locomotor activity was similar between genotypes (Fig. 3A). Two-way ANOVA showed no significant differences in genotype (F1,60 = 0.94, p = 0.33) or interaction between genotype and day (F2,60 = 0.01, p = 0.98), but showed a significant effect of day (F2,60 = 26.74, p < 0.001). However, when mice were given 1.5 g/kg ethanol (i.p.), we found that ENT1−/− mice demonstrated increased spontaneous locomotion stimulated by alcohol as compared to saline treated mice when we analyzed the effect of ethanol by subtracting baseline locomotor activity (p = 0.001, unpaired two-tailed t-test), but no significant changes were observed in ENT1+/+ mice upon alcohol administration (p = 0.179, unpaired two-tailed t-test) (Fig. 3B).
Fig. 3.
Ethanol-induced spontaneous locomotor stimulation. (A) Basal locomotor activity was similar between genotypes (n = 11 for each genotype). (B) Acute ethanol (1.5 g/kg, i.p. in saline) induced an increase in locomotor activity in ENT1−/− mice, but not in ENT1+/+ mice (+/+) (n = 12 for each genotype; *p < 0.05 compared to EtOH-treated group by unpaired two-tailed t-test). Data are presented as mean ± s.e.m.
3.4. Initial sensitivity
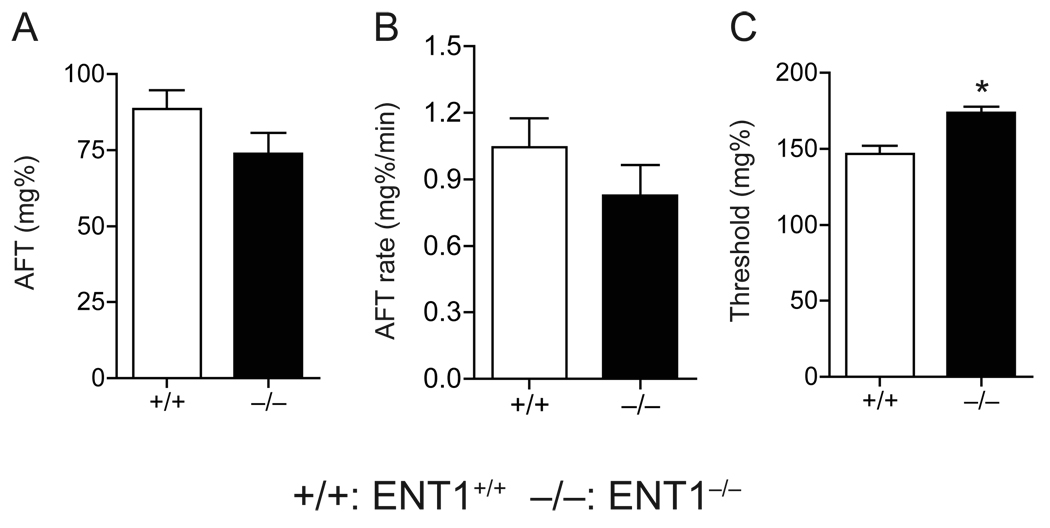
Because ENT1−/− mice showed a decreased response to the ataxic effects of ethanol at 1.5 g/kg ethanol [5], we further investigated whether higher levels of ethanol intake correlated to reduced initial sensitivity and/or increased acute functional tolerance (AFT) in ENT1−/− mice. To determine the initial sensitivity and AFT, we measured ethanol-induced impairment of balance using a stationary dowel test [16,19]. As shown in Table 1 and Figure 4, we found that the magnitude of AFT (Fig. 4A) and the rate at which AFT developed (Fig. 4B) were similar between genotypes. However, as expected, the level of initial sensitivity was decreased in ENT1−/− mice as indicated by an increased threshold blood ethanol concentration when compared to ENT1+/+ mice (Fig. 4C).
Table 1.
Acute functional tolerance (AFT) to the ataxic effects of ethanol
| +/+ | −/− | |
|---|---|---|
| BEC1 (mg%) | 174.1 ± 5.3 | 186.0 ± 3.3 |
| BEC2 (mg%) | 262.7 ± 8.8 | 259.9 ± 6.2 |
| Duration of ataxia 1 (min) | 27.8 ± 3.7 | 16.0 ± 1.2 |
| Duration of ataxia 2 (min) | 91.7 ± 7.5 | 97.0 ± 5.9 |
Data are presented as mean ± s.e.m.
+/+: ENT1+/+, −/−: ENT1−/−
Fig. 4.
Acute functional tolerance (AFT) using a dowel test. The magnitude of AFT (A) and the rate at which AFT develops (B) were similar between genotypes. (C) The level of initial sensitivity is higher in ENT1−/− mice (n = 10) compared to ENT1+/+ (n = 9). *p < 0.05 compared to ENT1+/+ group by unpaired two-tailed t-test). Data are presented as mean ± s.e.m.
3.5. Ataxic effects of glutamate receptor antagonists
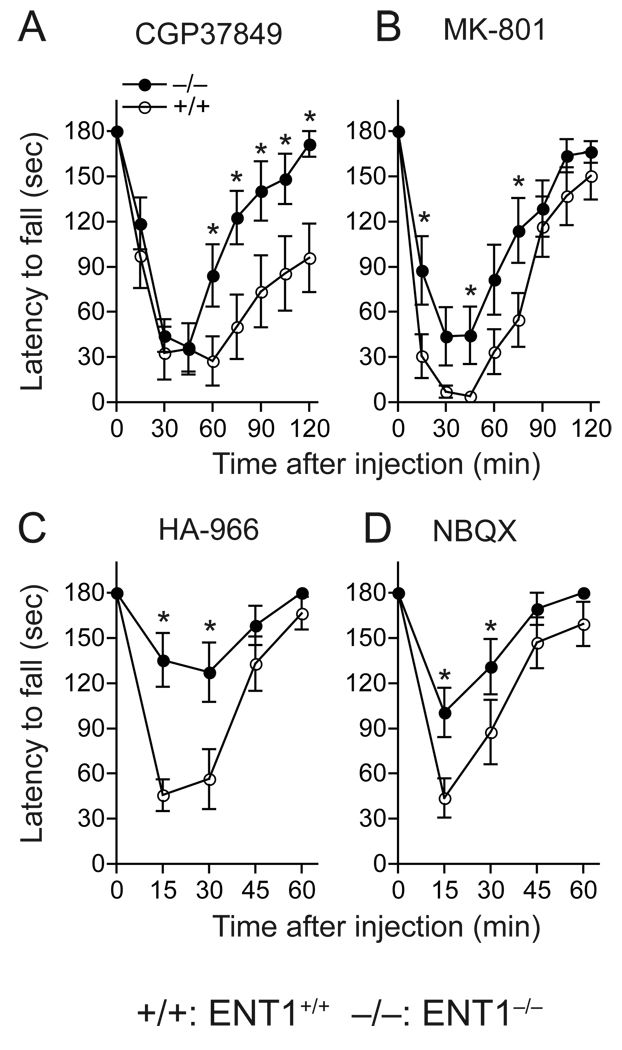
Next, we asked whether the reduced sensitivity to ethanol in ENT1−/− mice is attributed to altered glutamatergic neurotransmission since glutamate receptors are one of initial targets in the brain on which ethanol exerts its effects. Because both NMDA and AMPA receptor antagonists induce motor-impairing effects similar to ethanol [20,21], we examined whether ENT1−/− mice showed reduced ataxic effects of three NMDA receptor-specific and one AMPA receptor-specific antagonists as compared to ENT1+/+ littermates on the rotarod. We used four glutamate antagonists including CGP37849 (competitive NMDA-specific glutamate site antagonist), MK-801 (uncompetitive NMDA receptor blocker), HA-966 (NMDA-specific inhibitor on glycine site) and NBQX (AMPA receptor antagonist). As shown in Fig 5, CGP37849 (Fig. 5A), MK-801 (Fig. 5B), HA-966 (Fig. 5C), and NBQX (Fig. 5D) induced significantly less ataxia in ENT1−/− mice. Two-way repeated measures ANOVA showed a significant main genotype effect for CGP37849 (F1,88 = 5.98, p = 0.033), MK-801 (F1,88 = 5.82, p = 0.034), HA-966 (F1,40 = 9.50, p = 0.012), and NBQX (F1,44 = 10.37, p = 0.008). These data suggest that the reduced sensitivity to ethanol in ENT1−/− mice may be related to NMDA and AMPA receptors–mediated glutamate transmission.
Fig. 5.
Ataxic effect of glutamate receptor antagonists. (A) CGP37849. (B) MK-801. (C) HA-966. (D) NBQX. ENT1−/− mice (−/−) compared to ENT1+/+ mice (+/+) (n = 12 for each genotype; *p < 0.05 compared to ENT1+/+ group by Tukey test). Data are presented as mean ± s.e.m.
3.6. Glutamate levels in the CPu and NAc in response to acute ethanol
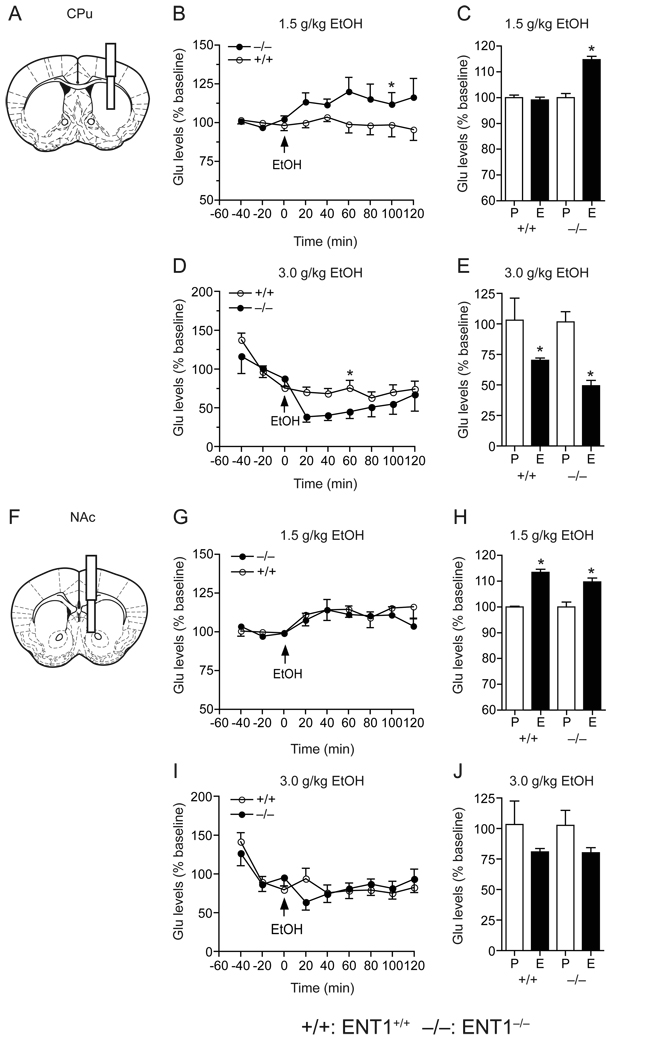
Additionally, as ENT1−/− mice exhibited altered glutamate neurotransmission which may affect their sensitivity to ethanol, we examined whether extracellular glutamate levels in response to ethanol in the dorsal striatum (caudate-putamen, CPu) or ventral striatum (nucleus accumbens, NAc) were different in ENT1−/− mice as compared to ENT1+/+ mice using microdialysis (Fig. 6). Since it is known that low to moderate doses of ethanol (0.5–1.0 g/kg) increase extracellular glutamate levels while >2.0 g/kg ethanol treatment decreases glutamate levels [22,23], we used both a low ethanol dose (1.5 g/kg, i.p.), which induced ataxia [5] and increased locomotor activity (Fig. 3C), and a high ethanol dose (3.0 g/kg, i.p.), which induced hypnosis [5].
Fig. 6.
Extracellular glutamate concentrations in the CPu and NAc in response to ethanol. (A, F) Schematic diagrams showing the location of a guide cannula with a microdialysis probe inserted into the CPu (A) and the NAc (F). (B, C) In the CPu, a low dose of ethanol (1.5 g/kg) increased glutamate levels in ENT1−/− (n = 6) compared to ENT1+/+ (n = 8; *p < 0.05 compared to ENT1+/+ group by Tukey test). Average glutamate levels were increased in ENT1−/− mice (*p < 0.05 when compared pretreated phase (P) to ethanol-treated phase (E) by unpaired two-tailed t-test). (D, E) However, with a high dose of ethanol (3.0 g/kg), ENT1−/− mice (n = 10) were slightly more sensitive to ethanol-induced suppression of extracellular glutamate levels in the CPu, compared to ENT1+/+ group (n = 8; *p < 0.05 compared to ENT1+/+ group by Tukey test). Average glutamate levels were decreased in both genotypes (*p < 0.05 compared pretreated phase (P) to ethanol-treated phase (E) by unpaired two-tailed t-test) in the CPu. (G, H) In the NAc, a low dose of ethanol (1.5 g/kg) increased extracellular glutamate levels in both genotypes (n = 8 for each genotype). Average of glutamate levels were increased in both genotypes (*p < 0.05 compared pretreated phase (P) with ethanol-treated phase (E) by unpaired two-tailed t-test) in the NAc. (I, J) At a high dose (3.0 g/kg), ethanol failed to alter glutamate levels in both genotypes (ENT1−/− mice, n = 10 and ENT1+/+ mice, n = 8) Data are presented as mean ± s.e.m.
In response to 1.5 g/kg ethanol, dialysates from the CPu of ENT1−/− mice (Fig. 6A) contained significantly higher amounts of glutamate as compared to those of ENT1+/+ mice (Fig. 6B). Two-way repeated measures ANOVA showed significant differences in genotype (F1,40 = 7.94, p = 0.037), without significant effects of time (F8,40 = 0.927, p = 0.505) or interaction between genotype and time (F8,40 = 1.20, p = 0.32). The average increases of glutamate levels in response to ethanol, at 40 min before and 120 min after the ethanol administration, was significant in the CPu of ENT1−/− mice but not in ENT1+/+ littermates (Fig. 6C). In contrast, there was no difference in glutamate efflux in response to 1.5 g/kg ethanol between genotypes in dialysates analyzed from the NAc (Fig. 6G), while the average glutamate levels were increased in both genotypes to a similar degree (Fig. 6H). Two-way repeated measures ANOVA showed no significant effect of genotype (F1,55 = 0.55, p = 0.48) or interaction between genotype and time (F8,55 = 0.50, p = 0.84), but did display a significant effect of time (F8,55 = 3.52, p = 0.002).
In response to 3.0 g/kg ethanol, glutamate levels were decreased in both genotypes in the CPu (Fig. 6D and E) when compared to basal levels. Two-way repeated measures ANOVA showed no significant effect of genotype (F1,37 = 2.88, p = 0.14), but revealed significant effect of time (F8,37 = 6.96, p < 0.001) and interaction between genotype and time (F8,37 = 2.54, p = 0.026). In contrast, in dialysates of the NAc, glutamate levels were reduced to a similar degree between genotypes (Fig. 6I and J). Two-way repeated measures ANOVA showed no significant effects of genotype (F1,44 = 0.30, p = 0.59) or interaction between genotype and time (F8,44 = 0.81, p = 0.59), but a significant effect of time (F8,44 = 3.01, p = 0.008).
4. Discussion
Our results showed that resistance to acute intoxicating and aversive effects of ethanol are presumably related to increased ethanol consumption [5] and voluntary ethanol seeking behavior. Since both genotypes showed a similar ethanol reward in a conditioned place preference test at 1.5 and 2.0 g/kg ethanol doses, the reduced aversive response to 1.5 g/kg ethanol and increased ethanol seeking behavior in the operant chamber in ENT1−/− mice appeared to be independent of ethanol reward. This finding suggests that enhanced ethanol consumption or preference observed in ENT1−/− mice [5] is attributed to a decreased level of response to an aversive effect that would initially preclude ethanol intake. Our findings suggest that reduced aversion to ethanol might increase “wanting” (reinforcement) component without altering “liking” (reward) component [24,25] in ENT1−/− mice. Further studies are warranted to explore whether ENT1−/− mice have altered responses to ethanol in a reinstatement test.
Interestingly, there is a discrepancy of striatal glutamate changes in response to different doses of ethanol between the the ENT1−/− mice and wild-type mice. This mainly occurred in the dorsal striatum, suggesting that the glutamatergic neurotransmission in the dorsal striatum seems to play a more important role in ethanol sensitivity than that in the ventral striatum. An increase of glutamate release in the striatum can evoke locomotor activation through a “direct” cortico-basal ganglia pathway [26]. Thus, our findings indicate that glutamatergic neurotransmission in the dorsal striatum of the ENT1−/− mice appears more sensitive to the lower dose of ethanol (1.5 g/kg), which may account for the increased locomotor-stimulating effects of ethanol in ENT1−/− mice. On the other hand, the higher dose of ethanol (3.0 g/kg), ENT1−/− mice showed a resistance of dorsal striatal glutamate response which may contribute to the reduced hypnotic effects of ethanol [5].
Notably, a low level of response to ethanol intoxication, or resistance to the aversive effects of ethanol, could be a crucial determinant for alcohol use disorders. Two recent genetic studies using Drosophila and mice demonstrated that the genes regulating increased ethanol resistance are causally related to increased ethanol preference [27,28]. Moreover, it has been shown that brain-derived neurotropic factor (BDNF) in the CPu could also regulate ethanol preference through a similar mechanism [29]. In humans, children of alcoholics show a reduced initial sensitivity to the intoxicating effects of alcohol and thus are more likely to develop alcohol dependence than those of non-alcoholics [30,31]. Consistently, our behavioral and microdialysis results indicate that increased extracellular glutamate levels in the CPu, in response to a low intoxicating dose of ethanol, seem to account for resistance to ataxia and reduced aversive effects of ethanol, which could be a permissive factor for ethanol by reducing intoxicating side effects.
Because it has been proposed that the NAc serves as a gateway in exerting motor function in response to reinforced stimuli [32,33], molecular changes in postsynaptic NAc neurons possibly alter responsiveness to ethanol in the CPu. For substance abuse, acquisition of drug reinforcement and seeking behaviors are regulated by the NAc [34,35] while the establishment of habitual behaviors requires CPu-mediated neural activity [36].
The differential glutamate levels in response to ethanol might be due to different glutamatergic afferents projecting to the CPu and the NAc. Importantly, the NAc receives glutamatergic input from several different brain regions including dorsal (precentral and anterior cingulate) and ventral (prelimbic and infralimbic) sub-divisions of the medial prefrontal cortex [37,38] as well as hippocampus and amygdala [35], while the CPu receives glutamatergic input mainly from the motor cortex. Our results from microdialysis experiments demonstrate that glutamatergic input from the motor cortex to the CPu may be mainly attributed to ethanol-mediated behaviors observed in ENT1−/− mice.
Taken together, our results indicate that ENT1 regulates the ethanol-induced motor-stimulating effects and/or initial sensitivity to the ataxic effects of alcohol and could be a genetic factor that contributes to a low level of response and susceptibility for alcohol use disorders.
Acknowledgement
We thank D. Frederixon for preparing the manuscript, R.O. Messing for advice on behavioral analyses. H.W.N. received postdoctoral fellowship from the Korea Research Foundation. This project was funded by the Samuel Johnson Foundation for Genomics of Addiction Program at Mayo Clinic to D.-S. C, and by grants from the National Institutes of Health (NIH) to D.-S. C.
Footnotes
This is a PDF file of an unedited manuscript that has been accepted for publication. As a service to our customers we are providing this early version of the manuscript. The manuscript will undergo copyediting, typesetting, and review of the resulting proof before it is published in its final citable form. Please note that during the production process errors may be discovered which could affect the content, and all legal disclaimers that apply to the journal pertain.
References
- 1.Diamond I, Gordon AS. Cellular and molecular neuroscience of alcoholism. Physiol Rev. 1997;77:1–20. doi: 10.1152/physrev.1997.77.1.1. [DOI] [PubMed] [Google Scholar]
- 2.Dunwiddie TV, Masino SA. The role and regulation of adenosine in the central nervous system. Annu Rev Neurosci. 2001;24:31–55. doi: 10.1146/annurev.neuro.24.1.31. [DOI] [PubMed] [Google Scholar]
- 3.Koob GF, Le Moal M. Neurobiology of Addiction. London: Elsevier; 2006. [Google Scholar]
- 4.Nagy LE, Diamond I, Casso DJ, Franklin C, Gordon AS. Ethanol increases extracellular adenosine by inhibiting adenosine uptake via the nucleoside transporter. J Biol Chem. 1990;265:1946–1951. [PubMed] [Google Scholar]
- 5.Choi DS, Cascini MG, Mailliard W, Young H, Paredes P, McMahon T, Diamond I, Bonci A, Messing RO. The type 1 equilibrative nucleoside transporter regulates ethanol intoxication and preference. Nat Neurosci. 2004;7:855–861. doi: 10.1038/nn1288. [DOI] [PubMed] [Google Scholar]
- 6.Tsai G, Coyle JT. The role of glutamatergic neurotransmission in the pathophysiology of alcoholism. Annu Rev Med. 1998;49:173–184. doi: 10.1146/annurev.med.49.1.173. [DOI] [PubMed] [Google Scholar]
- 7.Spanagel R, Pendyala G, Abarca C, Zghoul T, Sanchis-Segura C, Magnone MC, Lascorz J, Depner M, Holzberg D, Soyka M, Schreiber S, Matsuda F, Lathrop M, Schumann G, Albrecht U. The clock gene Per2 influences the glutamatergic system and modulates alcohol consumption. Nat Med. 2005;11:35–42. doi: 10.1038/nm1163. [DOI] [PubMed] [Google Scholar]
- 8.Spanagel R, Kiefer F. Drugs for relapse prevention of alcoholism: ten years of progress. Trends Pharmacol Sci. 2008;29:109–115. doi: 10.1016/j.tips.2007.12.005. [DOI] [PubMed] [Google Scholar]
- 9.Melendez RI, Kalivas PW. Last call for adenosine transporters. Nat Neurosci. 2004;7:795–796. doi: 10.1038/nn0804-795. [DOI] [PubMed] [Google Scholar]
- 10.Cunningham CL, Henderson CM, Bormann NM. Extinction of ethanol-induced conditioned place preference and conditioned place aversion: effects of naloxone. Psychopharmacol. 1998;139:62–70. doi: 10.1007/s002130050690. [DOI] [PubMed] [Google Scholar]
- 11.Cunningham CL, Gremel CM, Groblewski PA. Drug-induced conditioned place preference and aversion in mice. Nat Protoc. 2006;1:1662–1670. doi: 10.1038/nprot.2006.279. [DOI] [PubMed] [Google Scholar]
- 12.Samson HH. Initiation of ethanol reinforcement using a sucrose-substitution procedure in food- and water-sated rats. Alcohol Clin Exp Res. 1986;10:436–442. doi: 10.1111/j.1530-0277.1986.tb05120.x. [DOI] [PubMed] [Google Scholar]
- 13.Ferraro FM, 3rd, Sparta DR, Knapp DJ, Breese GR, Thiele TE. Increased consumption but not operant self-administration of ethanol in mice lacking the RIIbeta subunit of protein kinase A. Alcohol Clin Exp Res. 2006;30:825–835. doi: 10.1111/j.1530-0277.2006.00096.x. [DOI] [PMC free article] [PubMed] [Google Scholar]
- 14.Schroeder JP, Iller KA, Hodge CW. Neuropeptide-Y Y5 receptors modulate the onset and maintenance of operant ethanol self-administration. Alcohol Clin Exp Res. 2003;27:1912–1920. doi: 10.1097/01.ALC.0000098873.80433.BA. [DOI] [PubMed] [Google Scholar]
- 15.Wallace MJ, Newton PM, Oyasu M, McMahon T, Chou WH, Connolly J, Messing RO. Acute functional tolerance to ethanol mediated by protein kinase Cepsilon. Neuropsychopharmacol. 2007;32:127–136. doi: 10.1038/sj.npp.1301059. [DOI] [PubMed] [Google Scholar]
- 16.Wu PH, Tabakoff B, Szabo G, Hoffman PL. Chronic ethanol exposure results in increased acute functional tolerance in selected lines of HAFT and LAFT mice. Psychopharmacol. 2001;155:405–412. doi: 10.1007/s002130100722. [DOI] [PubMed] [Google Scholar]
- 17.Dar MS. Mouse cerebellar adenosinergic modulation of ethanol-induced motor incoordination: possible involvement of cAMP. Brain Res. 1997;749:263–274. doi: 10.1016/s0006-8993(96)01263-2. [DOI] [PubMed] [Google Scholar]
- 18.Chen J, Rinaldo L, Lim SJ, Young H, Messing RO, Choi DS. The type 1 equilibrative nucleoside transporter regulates anxiety-like behavior in mice. Genes Brain Behav. 2007;6:776–783. doi: 10.1111/j.1601-183X.2007.00311.x. [DOI] [PMC free article] [PubMed] [Google Scholar]
- 19.Erwin VG, Gehle VM, Deitrich RA. Selectively bred lines of mice show response and drug specificity for genetic regulation of acute functional tolerance to ethanol and pentobarbital. J Pharmacol Exp Ther. 2000;293:188–195. [PubMed] [Google Scholar]
- 20.Deitrich RA, Dunwiddie TV, Harris RA, Erwin VG. Mechanism of action of ethanol: Initial central nervous system actions. Pharmacol Rev. 1989;41:489–537. [PubMed] [Google Scholar]
- 21.Swedberg MD, Jacobsen P, Honore T. Anticonvulsant, anxiolytic and discriminative effects of the AMPA antagonist 2,3-dihydroxy-6-nitro-7-sulfamoyl-benzo(f)quinoxaline (NBQX) J Pharmacol Exp Ther. 1995;274:1113–1121. [PubMed] [Google Scholar]
- 22.Selim M, Bradberry CW. Effect of ethanol on extracellular 5-HT and glutamate in the nucleus accumbens and prefrontal cortex: comparison between the Lewis and Fischer 344 rat strains. Brain Res. 1996;716:157–164. doi: 10.1016/0006-8993(95)01385-7. [DOI] [PubMed] [Google Scholar]
- 23.Yan QS, Reith ME, Yan SG, Jobe PC. Effect of systemic ethanol on basal and stimulated glutamate releases in the nucleus accumbens of freely moving Sprague-Dawley rats: a microdialysis study. Neurosci Lett. 1998;258:29–32. doi: 10.1016/s0304-3940(98)00840-4. [DOI] [PubMed] [Google Scholar]
- 24.Robinson TE, Berridge KC. The neural basis of drug craving: an incentive-sensitization theory of addiction. Brain Res Brain Res Rev. 1993;18:247–291. doi: 10.1016/0165-0173(93)90013-p. [DOI] [PubMed] [Google Scholar]
- 25.Robinson TE, Berridge KC. Addiction. Annu Rev Psychol. 2003;54:25–53. doi: 10.1146/annurev.psych.54.101601.145237. [DOI] [PubMed] [Google Scholar]
- 26.Carlsson A. On the neuronal circuitries and neurotransmitters involved in the control of locomotor activity. J Neural Transm Suppl. 1993;40:1–12. [PubMed] [Google Scholar]
- 27.Corl AB, Berger KH, Ophir-Shohat G, Gesch J, Simms JA, Bartlett SE, Heberlein U. Happyhour, a Ste20 family kinase, implicates EGFR signaling in ethanol-induced behaviors. Cell. 2009;137:949–960. doi: 10.1016/j.cell.2009.03.020. [DOI] [PubMed] [Google Scholar]
- 28.Offenhauser N, Castelletti D, Mapelli L, Soppo BE, Regondi MC, Rossi P, D'Angelo E, Frassoni C, Amadeo A, Tocchetti A, Pozzi B, Disanza A, Guarnieri D, Betsholtz C, Scita G, Heberlein U, Di Fiore PP. Increased ethanol resistance and consumption in Eps8 knockout mice correlates with altered actin dynamics. Cell. 2006;127:213–226. doi: 10.1016/j.cell.2006.09.011. [DOI] [PubMed] [Google Scholar]
- 29.Logrip ML, Janak PH, Ron D. Escalating ethanol intake is associated with altered corticostriatal BDNF expression. J Neurochem. 2009 doi: 10.1111/j.1471-4159.2009.06073.x. [DOI] [PMC free article] [PubMed] [Google Scholar]
- 30.Schuckit MA, Smith TL. An 8-year follow-up of 450 sons of alcoholic and control subjects. Arch Gen Psychiatry. 1996;53:202–210. doi: 10.1001/archpsyc.1996.01830030020005. [DOI] [PubMed] [Google Scholar]
- 31.Schuckit MA, Edenberg HJ, Kalmijn J, Flury L, Smith TL, Reich T, Bierut L, Goate A, Foroud T. A genome-wide search for genes that relate to a low level of response to alcohol. Alcohol Clin Exp Res. 2001;25:323–329. [PubMed] [Google Scholar]
- 32.Groenewegen HJ, Wright CI, Beijer AV. The nucleus accumbens: gateway for limbic structures to reach the motor system? Prog Brain Res. 1996;107:485–511. doi: 10.1016/s0079-6123(08)61883-x. [DOI] [PubMed] [Google Scholar]
- 33.Yin HH, Knowlton BJ. The role of the basal ganglia in habit formation. Nat Rev Neurosci. 2006;7:464–476. doi: 10.1038/nrn1919. [DOI] [PubMed] [Google Scholar]
- 34.Schultz W, Dickinson A. Neuronal coding of prediction errors. Annu Rev Neurosci. 2000;23:473–500. doi: 10.1146/annurev.neuro.23.1.473. [DOI] [PubMed] [Google Scholar]
- 35.Everitt BJ, Robbins TW. Neural systems of reinforcement for drug addiction: from actions to habits to compulsion. Nat Neurosci. 2005;8:1481–1489. doi: 10.1038/nn1579. [DOI] [PubMed] [Google Scholar]
- 36.O'Doherty J, Dayan P, Schultz J, Deichmann R, Friston K, Dolan RJ. Dissociable roles of ventral and dorsal striatum in instrumental conditioning. Science. 2004;304:452–454. doi: 10.1126/science.1094285. [DOI] [PubMed] [Google Scholar]
- 37.Dalley JW, Cardinal RN, Robbins TW. Prefrontal executive and cognitive functions in rodents: neural and neurochemical substrates. Neurosci Biobehav Rev. 2004;28:771–784. doi: 10.1016/j.neubiorev.2004.09.006. [DOI] [PubMed] [Google Scholar]
- 38.Kalivas PW. The glutamate homeostasis hypothesis of addiction. Nat Rev Neurosci. 2009;10:561–572. doi: 10.1038/nrn2515. [DOI] [PubMed] [Google Scholar]


