

Abstract
The importance of ethanol (EtOH) metabolism in development of alcoholic liver disease remains controversial. The current study examined the effects of selective inhibition of the cytochrome P450 enzyme CYP2E1 compared to inhibition of overall EtOH metabolism on the development of alcoholic steatohepatitis. Adult male Sprague-Dawley rats were fed via total enteral nutrition for 45 d with or without 10–12 g/kg/d EtOH. Some groups were given 200 mg/kg/d of the CYP2E1 inhibitor diallylsulfide (DAS). Other groups were treated with 164 mg/kg/d of the alcohol dehydrogenase inhibitor 4-methylpyazole (4MP) and dosed at 2–3 g/kg/d EtOH to maintain similar average urine EtOH concentrations. Liver pathology scores and levels of apoptosis were elevated by EtOH (P< 0.05), but did not differ significantly on co-treatment with DAS or 4MP. However, liver triglycerides were lower when EtOH was fed with DAS or 4MP (P< 0.05). Serum alanine aminotransferase (ALT) values were significantly lower in EtOH-fed 4MP-treated rats indicating reduced necrosis. Hepatic oxidative stress and the endoplasmic reticulum (ER) stress marker TRB3 were increased after EtOH (P<0.05); further increased by DAS; but partly attenuated by 4MP. DAS and 4MP both reversed EtOH increases in the cytokine, tumor necrosis factor (TNF)α, and the chemokine CXCL-2 (P<0.05). However, neither inhibitor prevented EtOH suppression of interleukins IL-4 or IL-12. Moreover, neither inhibitor prevented EtOH increases in tumor growth factor (TGF)β mRNA. EtOH and DAS additively induced hepatic hyperplasia (P<0.05). These data suggest that a significant proportion of hepatic injury following EtOH exposure is independent of alcohol metabolism. EtOH metabolism by CYP2E1 may be linked in part to triglyceride accumulation; to induction of TNFα; and to chemokine production. EtOH metabolism by ADH may be linked in part to oxidative and ER stress and necrotic injury.
Keywords: Alcohol, Liver, Metabolism, Acetaldehyde, ADH, CYP2E1
The role played by ethanol metabolism in the development of alcohol-induced liver damage (ALD) remains controversial. It has been suggested that oxidative stress, resulting from reactive oxygen species generated during metabolism of ethanol (EtOH) via a cytochrome P450 enzyme (CYP2E1)-dependent pathway, plays a primary role in hepatocellular necrosis and Kupffer cell activation (Lieber and De Carli, 1991; Ronis et al., 1996; Albano et al., 1996; Lu and Cederbaum, 2008, Butura et al., 2009). Similar claims regarding ALD have been made for acetaldehyde, the major product of ethanol metabolism by alcohol dehydrogenase (ADH) and CYP2E1 and for redox changes associated with increased conversion of NAD to NADH during ADH-dependent and subsequent aldehyde dehydrogenase-dependent metabolism of EtOH to acetaldehyde and acetate (Lieber and DeCarli 1991; Lieber 1993; Anania et al. 1996; Cao et al., 2000; Lieber 2004; Purohit and Brenner, 2006).
Increased ALD has been described in conditions where CYP2E1 is over-expressed (Korourian et al., 1999; Butura et al., 2009). CYP2E1 has been associated with increased liver pathology score; lipid peroxidation; expression of mRNAs for the cytokine tumor necrosis factor alpha (TNFα) and the mitogen-activated protein (MAP) kinase ERK; and increased hepatocyte necrosis and apoptosis in response to TNFα and arachidonic acid (Butura et al, 2009; Lu and Cederbaum, 2008; Wu and Cederbaum, 2008; Caro and Cederbaum, 2007; Fang et al., 1998) and with stellate cell activation (Nieto et al., 2002). On the other hand, CYP2E1 inhibition has been reported to inhibit both ethanol-induced alterations in cytokine expression and liver pathology (Morimoto et al., 1995; Albano et al., 1996; Fang et al. 1998; Gouilon et al., 2000). Over expression of ADH also results in hepatocyte toxicity and acetaldehyde both inhibits hepatocyte proliferation (Lieber, 2004; Clemens, 2007) and generates protein adducts (Latavala et al., 2005).
However, there is also evidence that does not support a role for either CYP2E1 or ADH the development of ALD in vivo. For example, CYP2E1 activity has been reported not to correlate with oxidative stress in human alcoholics (DuPont et al., 2000) and CYP2E1 knockout mice have similar levels of ethanol-induced pathology compared to wild type (Kono et al., 1999). Elevation of acetaldehyde in vivo as the result of ALDH inhibition has been reported to actually decrease alcohol-induced hepatic inflammation and necrosis while having no effect on steatosis (Lindros et al., 1999). The current study examined the effects of CYP2E1 inhibition by diallyl sulfide (DAS) and overall inhibition of ADH and CYP2E1-dependent EtOH metabolism by 4-methylpyrazole (4MP) on development of ALD in a rat model in which an ethanol-containing diet is fed intragastrically.
METHODS
Animals and Experimental Design
All the animal studies described below were approved by the Institutional Animal Care and Use Committee at the University of Arkansas for Medical Sciences. All animals were at an AAALAC approved animal facility at ACHRI. Groups of male Sprague-Dawley rats, 300–350 g were fitted with an intragastric cannula and infused with liquid diets using total enteral nutrition (TEN) as described previously (Badger et al, 1993a; Korourian et al., 1999; Ronis et al., 2004; Ronis et al., 2008). Controls (N = 15) were infused at the NRC recommended caloric intake of 187 kcal/kg.75/d allowing growth at comparable rates to ad libitum chow fed animals (Badger et al., 1993a; Ronis et al. 2004). Control diets contained 16% protein (whey); 41% carbohydrate (dextrose and maltodextrin) and 43% fat (corn oil) together with NRC recommended levels of vitamins and minerals (Badger et al., 1993a; Ronis et al., 2004). In the ethanol-treated (EtOH) group (N = 18), ethanol calories isocalorically replaced carbohydrate calories at a dose of 10–12 g/kg/d to produce a final diet composition of 16% protein; 5% carbohydrate; 43% fat and 36% ethanol calories as described previously (Ronis et al. 2004; Ronis et al. 2008). Additional control (N = 7) and ethanol groups (N = 9) were treated with DAS at 200 mg/kg/d added to the diets. In a third set of groups, 4MP was added to control diets (N = 8) or EtOH diets (N = 15) at 164 mg/kg/d. Since this inhibited ethanol metabolism and clearance, the level of EtOH infusion was reduced substantially to maintain average urine ethanol concentrations (UEC) of the EtOH group at ~200 mg/dL. After 45 days, the animals were sacrificed and tissues collected.
Biochemical Analysis
24 h UECs were measured in urine collected at 0800 h each day and blood ethanol concentration (BEC) at sacrifice was measured using an Analox Instuments GL5 analyzer. We have previously demonstrated that 24 h UECs closely track BECs over periods of weeks since EtOH equilibrates with body water (Badger et al. 1993b). Liver microsomes were prepared by differential ultracentrifugation as described previously (Badger et al., 1993a). CYP2E1-dependent carbon tetrachloride-dependent lipid peroxidation was measured as described by Johansson and Ingelman-Sundberg (1985) and CYP2E1-dependent p-nitrophenol hydroxylase was measured as described by Koop (1986). CYP4A1-dependent lauric acid ω-hydroxylase activity was measured by TLC using 14C-lauric acid as described previously (Ronis et al., 1994). CYP2E1 and CYP4A1 apoprotein expression was measured by Western blot as described previously (Ronis et al., 1994) using a rabbit polyclonal antibody raised against purified rat CYP2E1 or rabbit antibody to sheep IgG in the case of CYP4A1. CYP2E1 was a gift from the laboratory of Dr. Magnus Ingelman-Sundberg (Karolinska Institute, Stockholm, Sweden). CYP4Al was detected using a polyclonal sheep antibody to rat CYP4A1 which was a gift from Dr. Gordon Gibson (University of Surrey, England). Liver lipid peroxidation was assessed as a measureof oxidative stress as described by Ohkawa et al. (1979). Hepatic GSH concentrations were quantified in liver using a commercially available kit (703002) from Cayman Chemical Co. (Ann Arbor, MI).
Pathology
Liver samples were processed and paraffin-embedded sections were stained with hematoxylin and eosin (H&E). H&E stained liver sections were scored for macro- and microsreatosis, inflammation (macrophage infiltration) and necrosis by a board certified pathologist (S.K.) with no prior knowledge of the treatment groups. Scoring was based on a scale encompassing 1 (baseline) to 4 (most extensive) as described elsewhere (Korourian et al., 1999). Steatosis was scored as the percentage of parenchymal cells containing fat (micro- or macrosteatosis) as <25% = 1, 25–50% = 2; 50–75% = 3; >75% = 4. The presence of inflammation based on infiltration by polymorphonuclear cells, leukocytes and mononuclear cells was evaluated using a scale where no inflammation = 1; occasional foci of inflammatory cells = 2; frequently occurring large foci of inflammatory cells = 3; frequently occurring large foci of inflammatory cells = 4. Necrosis was assessed using a scale where occasional (<1%) necrotic hepatocytes = 1; frequent (5–10%) necrotic hepatocytes = 2; small foci of necrosis (clusters of >10 necrotic cells) = 3 and extensive areas of necrosis (>25% of the lobular unit) = 4. Total pathology score was determined by summing the scores for steatosis, inflammation and necrosis. Therefore the total pathology score for a normal liver = 3. Serum alanine aminotransferase (ALT) levels assessed as a biochemical measure of necrotic injury using the Infinity™ ALT liquid stable reagent (Thermo Electron Corp., Waltham, MA) according to manufacturer’s protocols. Apoptosis was assessed by in situ end labeling of free 3′-hydroxyl ends generated during apoptosis (TUNEL) using a commercial kit (Frag-EL DNA Fragmentation Detection Kit, Fisher Scientific, Hampton, NH). The sections were counterstained with Gill’s hematoxylin. Apoptotic bodies and cells appeared brown. At least 2000 cells were counted from each liver section. Hepatic cellular proliferation was measured by immunohistochemical analysis of proliferating cell nuclear antigen (PCNA) expression as described by Greenwell et al. (1991). Nuclei of G0 cells were blue, nuclei of G1 cells were light brown, nuclei of S-phase cells were stained dark brown, G2 cells had brown cytoplasmic staining and M cells had a visible mitotic spindle. Previous studies have used this method to assess cell cycle changes after liver injury (Baumgardner et al. 2007a, Ronis et al. 2008). For each rat, 1000 cells were counted. In addition, total hepatic PCNA expression was quantitated by Western blot (Arab et al., 2009).
Analysis of Gene Expression
Expression of mRNAs coding for the cytokines interleukin IL-4; IL-12; TNFα, TGFβ, for the chemokine CXCL2, for the stellate cell activation marker, smooth muscle actin (SMA), for the ER stress marker/insulin-signaling inhibitor tribbles-related protein (TRB3) were quantified by real time RT-PCR as described previously (He et al., 2006; Baumgarder et al., 2008b, a; 2008b; Ronis et al., 2008). Total RNA was isolated from tissue using SV total RNA Isolation System (Promega, Madison, WI) according to the manufacturer’s protocol. The integrity of the RNA was confirmed by denaturing gel electrophoresis. RNA samples were quantified using the RiboGreen® quantitation assay, after DNase digestion, according to procedures developed by the manufacturer (Molecular Probes, Eugene, OR). Reverse transcription reaction was performed with 0.5 μg of total RNA in a final volume of 10 μl, using M-MLV Reverse Transcriptase (Invitrogen. Stockholm, Sweden) essentially according to procedures developed by the manufacturer. Each PCR reaction contained 2–10 μl of cDNA template, 1x Buffer, 1.25 to 1.5mM MgCl2, 0.2 mM dNTPs, 0.25 μM of each primer, and 0.625 units Taq DNA Polymerase (ABGene, Epsom, U.K.). For primer sequences, see Baumgardner et al. 2007; 2008a; 2008b; Ronis et al. 2008. Each PCR consisted of 95°C for 1 min followed by 25–40 cycles of 95°C for 15 s, 52°C or 60°C for 20 s, and 72°C for 1 min. PCR products were separated on ethylene bromide containing agarose gels. Identity of PCR products was verified by DNA sequencing, using BigDye™ Terminator Cycle Sequencing Ready Reaction Kit (Applied Biosystems) according to the manufacturer’s instructions. Real Time PCR was performed using 5 μl of diluted cDNA template in a 25μl reaction containing 0.25 μM of each primer and 12.5 μl SybrGreen real time PCR MasterMix (Applied Biosystems). Each run consisted of 50°C for 2 min, 95°C for 10 min followed by 40 cycles of 95°C for 15 s, 60°C for 20s and 72°C for 60s and was followed by a melt curve analysis, and separation on ethylene bromide containing agarose gels. PCR was performed using the Applied Biosystems ABI PRISM® 7700 Sequence Detection System. All samples were run blind, and reactions were performed in at least duplicates from separate cDNA reactions. All primers were designed to span at least one intron. Expression of gene products was normalized against mRNA for the housekeeping gene cyclophilin, expression of which did not change significantly across groups.
Statistics
Data are expressed as mean ± standard error. In most cases, groups were compared statistically by two way analysis of variance (ANOVA) followed by Student’s Neuman-Keuls post hoc analysis for specific comparisons between means using SigmaStat for Windows (Jandal Scientific Software). In the case of the liver pathology scores which were not normally distributed median values were compared by two way ANOVA of Ranks followed by Dunn’s test. The specific statistical comparisons between means and medians were as follows: within each diet between rats fed ethanol and controls and within controls or ethanol-treated groups for the effects of DAS or 4MP.
RESULTS
Ethanol Metabolism
In accordance with previously published studies from our laboratory, TEN fed rats grew at similar rates to ad libitum chow-fed animals (Badger et al., 1993a; Ronis et al., 2004). Body weight gains of EtOH-treated rats were either similar or slightly reduced despite isocaloric feeding. DAS treatment reduced body weight gain (P<0.05) while 4MP treatment resulted in a small increase (P<0.05) (Table 1). Chronic treatment with EtOH in the current study resulted in a pulsatile pattern of UECs, (Figure 1) with a periodicity of 6–7 d despite continuous infusion of EtOH diets 23 h/d replicating results described previously (Badger et al. 1993a,b; Ronis et al. 2008). Previous studies suggest that the UEC/BEC pattern reflects periodic changes in EtOH clearance as a result of changes in expression and activity of hepatic ADH 1 (Badger et al, 2000; He et al., 2006). This phenomenon represents an example of time-dependent pharmacokinetics where increases in BECs as a result of saturation of EtOH metabolism produce ER stress in the liver which in turn blocks insulin-dependent suppression of ADH 1 resulting in increased ADH 1 activity and EtOH clearance. Once BECs return to basal values, ER stress disappears and the whole process repeats itself. Consistent with previous findings, block of ADH 1 by treatment with 4MP reduced in vivo EtOH clearance by 80% and abolished the UEC pulses (Figure 1). UEC values in the EtOH + 4MP group were matched to those of the EtOH group by reducing the dose of EtOH to 2.9 ± 0.1 g/kg/d.
Table 1.
Effects of EtOH, DAS and 4MP on UECs, Growth and Liver Parameters
| Group | Dose1 | UEC2 | Weight Gain3 | Liver Weight4 | % Body Weight | Triglycerides5 | Glycogen5 | DNA/Protein6 |
|---|---|---|---|---|---|---|---|---|
| Control | 0 | 0 | 2.20 ± 0.06 | 12.1 ± 0.67 | 2.7 ± 0.11 | 14.1 ± 0.9 | 1.07 ± 0.1 | 1.08 ± 0.1 |
| EtOH | 11.0 ± 0.1 | 221 ± 6 | 1.90 ± 0.05 | 15.6 ± 0.50* | 3.6 ± 0.10* | 45.6 ± 5.3* | 1.05 ± 0.1 | 0.97 ± 0.1 |
| DAS | 0 | 0 | 1.57 ± 0.04** | 18.3 ± 0.8** | 4.9 ± 0.17** | 18.8 ± 6.6 | 1.49 ± 0.1 | 1.32 ± 0.1 |
| EtOH/DAS | 10.5 ± 0.2 | 268 ± 6** | 1.49 ± 0.04** | 27.3 ± 1.5*,** | 7.4 ± 0.23*,** | 30.2 ± 3.0*,** | 0.67 ± 0.1*,** | 1.75 ± 0.2*,** |
| 4MP | 0 | 0 | 2.97 ± 0.05# | 15.9 ± 0.77# | 3.3 ± 0.12# | 19.3 ± 5.4 | 1.28 ± 0.1 | 0.95 ± 0.1 |
| EtOH/4MP | 2.9 ± 0.1# | 217 ± 5 | 2.20 ± 0.05* | 20.8 ± 0.43*,# | 4.7 ± 0.12*,# | 31.7 ± 5.1*,# | 0.66 ± 0.1*,# | 1.15 ± 0.1 |
Data are mean ± SEM:
g ethanol/d;
urine ethanol concentration mg/dl;
g/d;
g;
μg/mg liver;
μg/mg protein
= EtOH effect within Group;
= DAS effect between respective Control;
= 4MP effect between respective Control;
Figure 1.
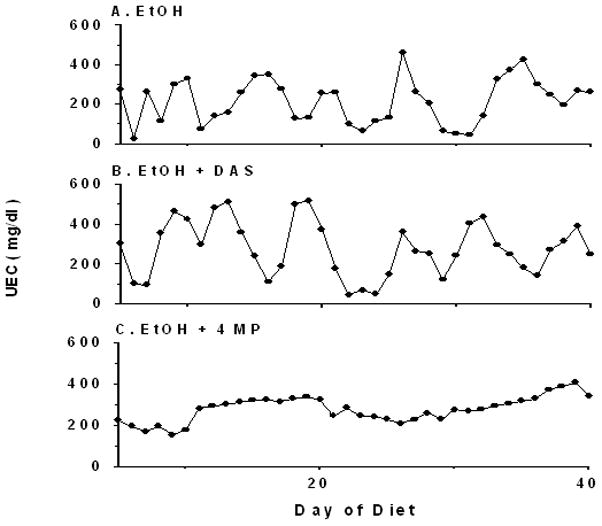
Representative urine ethanol concentration (UEC) profiles during TEN infusion of EtOH-containing diets with or without co-treatment with DAS or 4MP.
Although DAS treatment inhibited EtOH-induced CYP2E1 activity and apoprotein expression (P< 0.05) (Figure 2), no significant effects were observed on the pattern of UECs (Figure 1). However, average UEC values were elevated compared to those of the EtOH group (P<0.05) (Table 1). These data are also consistent with previous studies from our laboratory (Badger et al. 1995).
Figure 2.
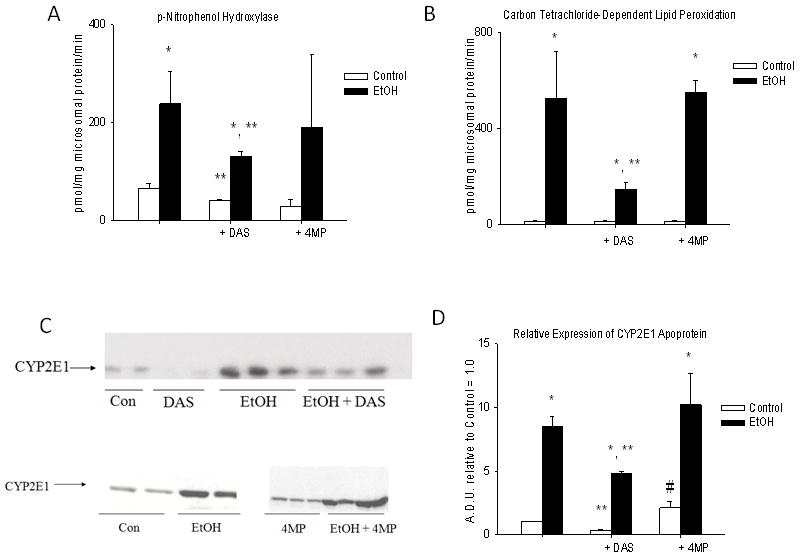
CYP2E1 activity and expression in liver microsomes of rats fed via TEN diets with or without EtOH and DAS or 4MP co-treatment. A. CYP2E1-dependent p-nitrophenol hydroxylase; B. CYP2E1-dependent carbon-tetrachloride-dependent lipid peroxidation – TBARS/mg microsomal protein/min; C. Representative Western immunoblots of CYP2E1 apoprotein, each lane represents a different animal; D. Immunoquantitation of CYP2E1 Western blots. Data represent mean ± SEM for N = 15 control; N = 18 EtOH; N = 7 DAS; N = 9 EtOH + DAS; N = 8 4MP and N = 15 EtOH + 4MP rats/group. * EtOH effect within group; ** DAS effect within group and # 4MP effect within group P<0.05 by two way ANOVA followed by Neuman-Keuls post-hoc multiple pair-wise comparisons comparing EtOH and DAS groups or EtOH and 4MP groups.
Liver Pathology
Chronic infusion of EtOH via TEN for 45 d resulted in the development of alcoholic steatohepatitis. Liver pathology consisted of hypertrophy, a mixture of macro and microsteatosis, the appearance of inflammatory infiltrates, necrotic foci and apoptosis (Table 2, Figure 3). DAS treatment by itself increased liver weight (P< 0.05) and had additive effects with EtOH (Table 1). 4MP by itself also increased liver weight slightly and exacerbated the hypertrophic effects of EtOH (P< 0.05) (Table 1). Pathology scores for steatosis, inflammation and necrosis were all elevated by EtOH treatment (P< 0.05) and 2-way ANOVA analysis of TUNEL staining indicated a modest increase in apoptosis after EtOH-treatment (P< 0.05). However, no protective effects of either DAS or 4MP were observed on increased liver pathology scores or apoptosis (Table 2, Figure 3) produced by EtOH. The only indications of a protective effect associated with inhibition of EtOH metabolism were a reduction in EtOH-induced triglyceride accumulation assessed biochemically in the EtOH+ DAS and EtOH+4MP groups (P<0.05, Table 1), and a reduction of serum ALT values in the EtOH + 4MP group relative to the EtOH group (P< 0.05) (Table 2). However, EtOH still doubled ALT values over 4MP-treated controls (P< 0.05).
Table 2.
Effects of EtOH, DAS and 4MP on Liver Pathology
| Group | Steatosis1 | Inflammation2 | Necrosis2 | Total3 | Apoptosis4 | Serum ALT5 |
|---|---|---|---|---|---|---|
| Control | 1.0 ± 0.1 | 1.0 ± 0.1 | 1.0 ± 0.1 | 3.0 ± 0.3 | 0.09 ± 0.02 | 57 ± 6 |
| EtOH | 4.3 ± 0.3* | 3.0 ± 0.5* | 2.7 ± 0.4* | 10.0 ± 1.2* | 0.15 ± 0.02 | 159 ± 38* |
| DAS | 1.0 ± 0.1 | 1.9 ± 0.2** | 1.0 ± 0.1 | 3.9 ± 0.4** | 0.03 ± 0.03 | 52 ± 11 |
| EtOH/DAS | 4.2 ± 0.4* | 2.8 ± 0.4* | 2.8 ± 0.6* | 9.8 ± 2.0* | 0.12 ± 0.03 | 117 ± 22* |
| 4MP | 1.0 ± 0.1 | 1.0 ± 0.1 | 1.0 ± 0.1 | 3.0 ± 0.3 | 0.09 ± 0.03 | 36 ± 9 |
| EtOH/4MP | 4.3 ± 0.3* | 3.3 ± 0.4* | 2.4 ± 0.4* | 10.1 ± 0.11* | 0.15 ± 0.19 | 61 ± 10# |
Data are mean ± SEM:
pathology score (macrosteatosis + microsteatosis);
pathology score;
Steatosis + Inflammation + Necrosis score (no pathology = 3.0);
% TUNEL positive cells;
SF Units/ml
= EtOH effect within Group
= 4MP effect between respective Control
= DAS effect between respective Control
Figure 3.
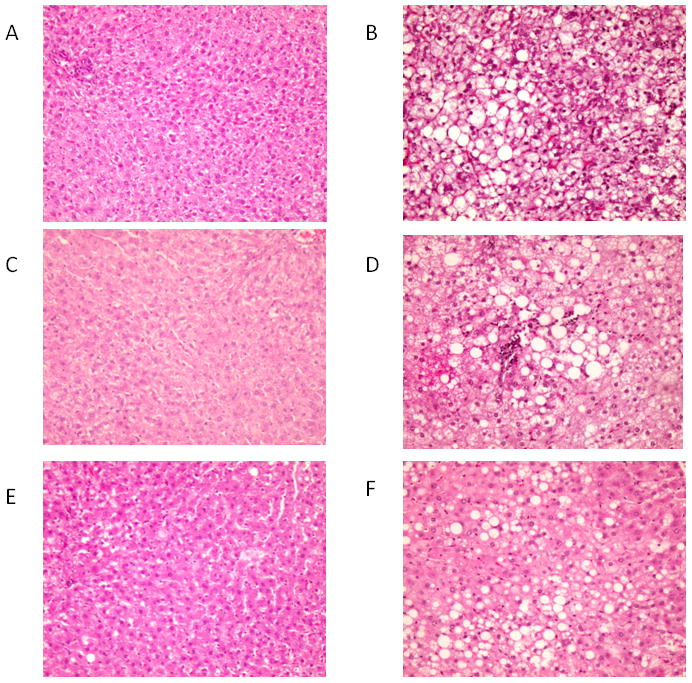
Representative H&E stained liver sections × 10 magnification. A. Control; B. EtOH; C. DAS; D. EtOH + DAS; E. 4MP; F. EtOH + 4MP.
Oxidative Stress
Oxidative stress has long been considered an important factor in progression of alcoholic liver injury (Ronis et al., 1996; Arteel, 2003; Lieber 2004). More recently, chronic ethanol exposure has been demonstrated to produce ER stress which has also been linked to pathology and development of hepatic insulin resistance (Kaplowitz, 2006; He et al., 2006). Two markers of oxidative stress were determined: lipid peroxidation as measured by the appearance of thiobarbituric acid reactive substances (TBARS) in liver homogenates and concentration of the antioxidant glutathione (GSH). TBARS were elevated and GSH depleted (P < 0.05) following EtOH treatment (Table 3). DAS treatment exacerbated EtOH-induced oxidative stress (P<0.05). However, 4MP treatment partly ameliorated the EtOH-associated reduction in GSH (P<0.05, Table 3).
Table 3.
Effects of EtOH, DAS and 4MP on Hepatic Oxidative and ER Stress
| Group | TBARS1 | GSH2 | TRB3 mRNA3 |
|---|---|---|---|
| Control | 0.32 ± 0.03 | 20.5 ± 0.5 | 1.0 ± 0.2 |
| EtOH | 0.74 ± 0.13* | 14.8 ± 0.4* | 3.2 ± 0.5* |
| DAS | 0.33 ± 0.02 | 19.3 ± 0.5 | 1.6 ± 0.4 |
| EtOH/DAS | 1.17 ± 0.22*, ** | 9.5 ± 0.6*, ** | 4.9 ± 0.6*, ** |
| 4MP | 0.33 ± 0.03 | 24.0 ± 0.6 | 0.8 ± 0.3 |
| EtOH/4MP | 0.78 ± 0.13* | 20.2 ± 0.4*,# | 1.8 ± 0.3# |
Data are mean ± SEM:
nmol thiobarbituric acid reactive products/g liver;
μmol/g liver;
mRNA expression relative to control = 1.0.
= EtOH effect within Group
= 4MP effect between respective Control
= DAS effect between respective Control
Cytochrome P450 CYP4A1
In addition to CYP2E1, another cytochrome P450 enzyme, CYP4A, has been demonstrated to be loosely coupled and a source of free radicals (Leclercq et al., 2000). In CYP2E1 knockout mice, CYP4A is elevated and has been suggested to act as an alternate radical source after EtOH treatment of CYP2E1 −/− mice to explain the lack of protection against alcoholic liver injury in these animals (Wan et al., 2001). Therefore, we also examined the effects of DAS and 4MP on CYP4A1 expression. EtOH treatment resulted in a small increase in CYP4A1 expression. DAS treatment by itself reduced microsomal CYP4A1 apoprotein (P < 0.05) but there was no effect of DAS on CYP4A1 expression in EtOH-fed rats. In contrast, 4MP increased CYP4A1 expression by itself (P<0.05) and the combination of EtOH and 4MP substantially increased CYP4A1 apoprotein (P< 0.05) (Figure 4). These effects on CYP4A1 apoprotein expression were largely reflected in parallel changes in hepatic microsomal lauric acid ω-hydroxylase activity, a well studied marker of CYP4A1 activity (Ronis et. al. 1994).
Figure 4.

CYP4A1 activity and expression in liver microsomes of rats fed via TEN diets with or without EtOH and DAS or 4MP co-treatment. A. Representative Western blots; B. immunoquantitation of CYP4A1 apoprotein in liver microsomes; and C. microsomal lauric acid ω-hydroxylase activity, comparing control (TEN) rats with EtOH-treated rats (EtOH) with or without DAS or 4MP co-treatment. Data represent mean ± SEM for N = 15 control; N = 18 EtOH; N = 7 DAS; N = 9 EtOH + DAS; N = 8 4MP and N = 15 EtOH + 4MP rats/group. * EtOH effect within group; ** DAS effect within group and # 4MP effect within group P<0.05 by two way ANOVA followed by Neuman-Keuls post-hoc multiple pair-wise comparisons comparing EtOH and DAS groups or EtOH and 4MP groups.
Endoplamic Reticulum (ER) Stress
EtOH treatment resulted in induction of expression of mRNA encoding TRB3 (P< 0.05), synthesis of which has been shown to be triggered by ER stress (He et al., 2007). DAS co-treatment further increased EtOH-induced TRB3 expression (P<0.05). However, 4MP co-treatment prevented EtOH-induced TRB3 mRNA expression (P < 0.05) (Table 2).
Cytokine and Chemokine Expression
Altered cytokine expression and synthesis of chemokines are another well known featureof alcoholic liver disease (Tiig and Diehl, 2000; Crews et al., 2006, Ronis et al., 2008). Treatment with both DAS and 4MP significantly reduced pro-inflammatory TNFα mRNA expression in EtOH-treated groups (P< 0.05) (Figure 5). However, IL-12 expression was suppressed by EtOH in the presence or absence of DAS or 4MP co-treatment (P < 0.05) (Figure 5). EtOH suppressed expression of IL-4 mRNA (P< 0.05) and this was unaffected by DAS. In contrast, 4MP treatment by itself suppressed IL-4 and the combination of 4MP and EtOH suppressed IL-4 mRNA even further (P< 0.05). EtOH treatment increased CXCL-2 mRNA (P < 0.05) and this was attenuated by both DAS and 4MP co-treatment (P < 0.05) (Figure 5).
Figure 5.

Real-time RT-PCR analysis of the effects of EtOH with or without DAS or 4MP co-treatment on relative expression of cytokine and chemokine mRNAs. A. TNFα; B. IL-4; C. IL-12 and D. CXCL2. Data represent mean ± SEM for N = 15 control; N = 18 EtOH; N = 7 DAS; N = 9 EtOH + DAS; N = 8 4MP and N = 15 EtOH + 4MP rats/group. * EtOH effect within group; ** DAS effect within group and # 4MP effect within group P<0.05 by two way ANOVA followed by Neuman-Keuls post-hoc multiple pair-wise comparisons comparing EtOH and DAS groups or EtOH and 4MP groups.
Stellate Cell Activation
EtOH produces hepatic fibrosis via activation of stellate cells (Anania et al., 1996; Lieber 2004; Purohit and Brenner, 2006; Crews et al. 2006). This process has been shown to involve increased signaling through the cytokine TGFβ (Purohit and Brenner, 2006, Crews et al., 2006). TGFβ mRNA was elevated by EtOH treatment (P < 0.05) and this increase was unaffected by either DAS or 4MP (Figure 6). Two well established early indicators of stellate cell activation are increased expression of smooth muscle actin (SMA) and of platelet-derived growth factor receptor beta (PDGFRβ) (Baumgarder et al. 2008b). Two way ANOVA indicated that increased overall expression of mRNA for both SMA and PDGFRβ occurred in EtOH-treated groups (P < 0.05). However, neither DAS nor 4MP co-treatment affected the ETOH-induced increase in SMA expression. However, no increase in PDGFRβ expression was observed after co-treatment with EtOH and 4MP.
Figure 6.
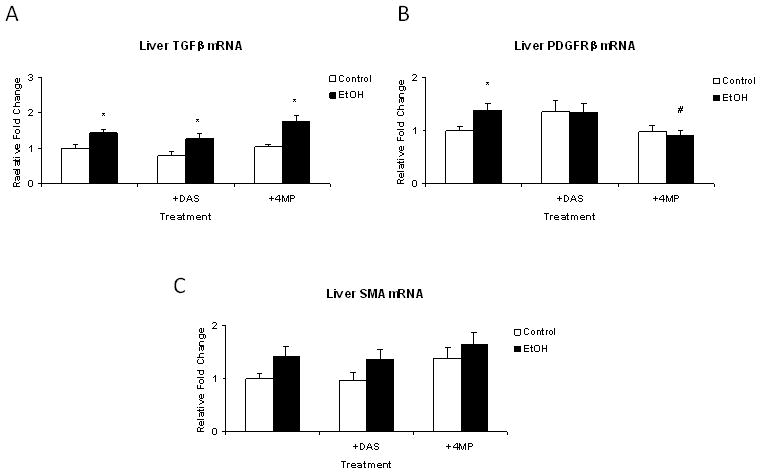
Real-time RT-PCR analysis of the effects of EtOH with or without DAS or 4MP co-treatment on relative expression of TGFβ mRNA and mRNAs for stellate cell activation markers smooth muscle actin (SMA) and PDGF receptor β (PDGFRβ). Data represent mean + SEM for N = 15 control; N = 18 EtOH; N = 7 DAS; N = 9 EtOH + DAS; N = 8 4MP and N = 15 EtOH + 4MP rats/group. * EtOH effect within group; ** DAS effect within group and # 4MP effect within group P<0.05 by two way ANOVA followed by Neuman-Keuls post-hoc multiple pair-wise comparisons comparing EtOH and DAS groups or EtOH and 4MP groups.
Hepatocellular Proliferation
Two way ANOVA indicated an increase in liver weight and hepatocyte proliferation with increased % of cells in S-phase and G2 in the EtOH-treated groups (P < 0.05) (Table 4). Treatment with DAS alone increased liver weight (P<0.05); decreased the % cells in G0 and increased the number in G1, M and G2 (P<0.05) (Table 4). The combination of EtOH and DAS additively increased hepatocyte proliferation. This coincided with significantly increased PCNA expression in Western blots (Figure 7); increased liver weight and increased DNA/protein ratio in the DAS + EtOH group compared to the EtOH group (Table 1). Despite significant but smaller increases in liver weight after 4MP and EtOH + 4MP treatments, cell cycle values were largely unaffected by 4MP.
Table 4.
Effects of EtOH, DAS and 4MP on Hepatocellular Cell Cycle
| Group | G0 | G1 | S | M | G2 |
|---|---|---|---|---|---|
| Control | 93.4 ± 1.6 | 5.1 ± 1.4 | 1.2 ± 0.4 | 0.1 ± 0.05 | 0.17 ± 0.06 |
| EtOH | 89.7 ± 1.3 | 7.5 ± 1.1 | 2.4 ± 0.3* | 0.2 ± 0.04 | 0.34 ± 0.05* |
| DAS | 87.8 ± 2.3 | 10.0 ± 1.9** | 1.6 ± 0.5 | 0.2 ± 0.06 | 0.32 ± 0.09 |
| EtOH/DAS | 87.2 ± 1.9 | 9.1 ± 1.6 | 2.9 ± 0.4* | 0.3 ± 0.05 | 0.46 ± 0.07 |
| 4MP | 92.4 ± 1.2 | 5.5 ± 1.0 | 1.5 ± 0.4 | 0.1 ± 0.04 | 0.30 ± 0.09 |
| EtOH/4MP | 92.3 ± 1.2 | 5.5 ± 1.0 | 1.9 ± 0.3 | 0.1 ± 0.04 | 0.21 ± 0.06# |
Data are mean ± SEM: % hepatocytes in each phase of the cell cycle based on analysis of PCNA staining (See methods). 2 way ANOVA analysis indicates P < 0.05 DAS decreased the number of cells in Go and increased the number of cells in G1,, M and G2; P < 0.05 EtOH-induced increases in cells in S and G2.
= EtOH effect within Group
= 4MP effect between respective Control
= DAS effect between respective Control
Figure 7.
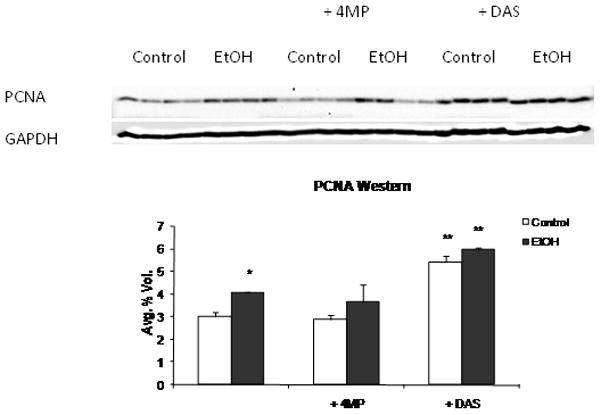
PCNA expression in liver homogenates of rats fed via TEN diets with or without EtOH and DAS or 4MP co-treatment. Data represent mean ± SEM for PCNA protein expression normalized against GAPDH, N = 4 rats/group. * EtOH effect within group; ** DAS effect within group and # 4MP effect within group P<0.05 by two way ANOVA followed by Neuman-Keuls post-hoc multiple pair-wise comparisons comparing EtOH and DAS groups or EtOH and 4MP groups.
DISCUSSION
Despite studies over the past 50 years, the molecular mechanisms underlying ALD are still unclear. It has been suggested that metabolism of EtOH to radical intermediates by CYP2E1, or EtOH metabolism resulting in formation of NADH and acetaldehyde by ADH play a major role in development of liver pathology (Lieber and De Carli, 1991; Ronis et al. 1996; Lieber 2004; Purohit and Brenner 2006; Lu and Cederbaum 2008). However, previous studies on the role of CYP2E1 and ADH in ALD have proven contradictory (Kono et al., 1999; Lindros et al. 1999). In the current experiment, we conducted a side by side comparison of the development of ALD in our previously established rat TEN model (Korourian et al., 1999; Ronis et al. 2004; Ronis et al. 2008) under conditions where CYP2E1 activity was inhibited by DAS or EtOH metabolism by both CYP2E1 and ADH was substantially inhibited by 4MP.
Co-treatment with EtOH and DAS was found to inhibit EtOH-induced CYP2E1 activity and apoprotein expression and unlike studies involving CYP2E1 knockout mice (Wan et al., 2001), there was no evidence compensatory induction of CYP4A1 apoprotein which might provide an alternative source of free radicals. Under these conditions, liver pathology and serum ALT values were unchanged compared to treatment with EtOH alone, but there was a decrease in biochemically determined hepatic triglyceride content. The discrepancy between pathologically determined steatosis score and triglyceride levels may reflect the relative insensitivity of pathological scoring or changes in the triglyceride pool associated with lipoproteins rather than that present as lipid droplets. Increases in oxidative stress and ER stress produced by EtOH treatment were actually exacerbated by EtOH + DAS co-treatment which suggests that CYP2E1 may not be a major factor in development of cellular stress following EtOH exposure. With the exception of TNFα and CXCL2, changes in cytokine and chemokine expression produced by EtOH were also unaffected. These data contradict previous studies by French and co-workers (Morimoto et al., 1995; Albano et al. 1996; Gouilon et al. 2000) but are consistent with data from the laboratory of the late Dr. Ron Thurman using both CYP2E1 knockout mice and non-specific chemical inhibition of cytochrome P450-dependent monooxygenases (Kono et al. 1999; Isayama et al. 2003). Differences in diet composition and pattern of EtOH administration (isocaloric substitution as opposed to caloric supplementation) might in part explain the differences in results between the current study and those of French et al. DAS co-treatment had no effect on EtOH induction of TGFβ mRNA or indicators of stellate cell activation (SMA and PDGFRβ). These data suggest that radical production by CYP2E1 does not play a role in stellate cell activation. Reductions in TNFα mRNA after DAS co-treatment suggest a role for CYP2E1-dependent EtOH metabolism in regulation of this pro-inflammatory cytokine. These data are consistent with previous studies from our laboratory in which CYP2E1 expression was inhibited by administration of chlormethiazole (Fang et al., 1998). Similarly, prevention of CXCL2 mRNA production following EtOH and DAS co-treatment suggests a role for CYP2E1-associated radicals in chemokine production. CXCL-2 is the rat analogue of human IL-8. The status of hepatocellular proliferation and liver regeneration following EtOH consumption has been the subject of many contradictory reports (Diehl, 2002; Koteish et al., 2002; Apte et al., 2004, Baumgardner et al., 2007; Clemens 2007; Ronis et al., 2008; Jung et al. 2009). Previous studies in our laboratory using histochemical analysis of cellular PCNA distribution have observed a modest increase in cellular proliferation following chronic EtOH treatment in the TEN model and increases in EtOH-stimulated proliferation when EtOH was combined with under-nutrition (Baumgardner et al. 2007). The current study confirm these data and suggest DAS and EtOH stimulate hepatocellular proliferation by separate pathways since liver size and number of cells in S-phase were additive with the combined treatment. The increase in overall PCNA expression observed in Western blots may also reflect DNA repair following damage (Essers et al., 2005). The increase in liver size produced by DAS treatment alone was accompanied by an increase in DNA/protein ratio, but was not associated with significant increases in cells in S-phase. Rather there were significant increases in the number of cells in G1. The lack of statistical significance may simply reflect the small number of cells normally in S phase. Alternatively, since DAS is known to be a phenobarbitone-like inducer of CYP2B expression acting via activation of the constitutive androgen receptor CAR, (Fisher et al., 2007), it is possible that like phenobarbitone, DAS can increase liver size by inducing liver cell polyploidisation, where DNA is replicated without subsequent cell division (Martin et al., 2001).
4MP treatment resulted in inhibition of approximately 80% of EtOH clearance and abolished UEC pulses associated with continuous EtOH infusion in the TEN model. This is consistent with previous data from our laboratory (Badger et al., 2000). Since only 2.9 g/kg of EtOH was being infused in the EtOH + 4MP group relative to 11 g/kg in the EtOH group to produce similar mean UEC values, EtOH metabolism to acetaldehyde appears to have been substantially inhibited. 4MP inhibits ADH class I and is also a competitive inhibitor of CYP2E1 (Porubsky et al. 2008). Therefore it is likely that in addition to inhibition of EtOH metabolism by ADH, CYP2E1 is also inhibited in these rats in vivo. However, this is not reflected in in vitro studies with microsomes since 4MP was removed during microsomal preparation. 4MP had no effect on CYP2E1 apoprotein expression. However, the combination of EtOH and 4MP did result in a substantial increase in CYP4A1 expression which could act as a source of free radicals in compensation for in vivo CYP2E1 inhibition in these animals and could contribute to ALD. Under these conditions pathological evaluation of ALD revealed surprisingly small differences in the combined EtOH + 4MP group compared to EtOH alone. Indication of some protective effect associated with blocking a large proportion of EtOH metabolism comes from the reduction of hepatic triglyceride accumulation and the serum ALT data which was significantly attenuated suggesting a reduction in necrotic injury. The effects of 4MP on triglyceride accumulation may be due to inhibition of CYP2E1 activity since a similar effect was observed with DAS. Previous studies have reported contradictory findings related to acetaldehyde and ALD (Lieber 2004; Purohit and Brenner 2006; Lindros et al., 1999). Overexpression of ADH has been reported to increase EtOH-induced hepatotoxicty and acetaldehyde has been linked to suppression hepatocyte proliferation (Lieber 2004; Clemens 2007). On the other hand Lindros et al. (1999) have reported reduced alcoholic liver injury following treatment with the aldehyde dehydrogenase inhibitors disulfiram and benzocoprine despite increased liver acetaldehyde and similar decreases in EtOH-induced ALTs, TNFα and oxidative stress were recently reported in aldehyde dehydrogenase 2 knockout mice (Matsumoto et al. 2008). In the current study a protective effect of 4MP treatment was observed on development of EtOH-induced oxidative stress and ER stress. These data suggest EtOH metabolism is of importance in appearance of cellular stress following alcohol consumption. These data are also consistent with previous reports that acetaldehyde exposure increases ER stress in vitro in HepG2 cells (Lluis et al., 2003) and that ADH over-expression increases EtOH-mediated ER stress in the heart (Li and Ren, 2008). Although EtOH-induced suppression of the cytokines IL-4 and IL-12 was unaffected by co-treatment with 4MP, like DAS, 4MP treatment prevented EtOH-induced increases in expression of mRNA for the cytokine CXCL-2. These data might be explained by inhibition of CYP2E1 activity since a similar effect was observed with DAS. The data are consistent with a previous study by Gomez-Quiroz et al. (2003) that acetaldehyde can stimulate IL-8 production in HepG2 cells in vitro. EtOH-mediated increases in TNFα mRNA were also inhibited by 4MP treatment in a similar fashion to that produced by DAS. Previous in vitro studies have suggested that acetaldehyde can increase TNFα production in both HepG2 cells and Kupffer cells (Hsiang et al., 2005; Cao et al., 2002). Since significant in vitro data from previous studies suggest a role for acetaldehyde in EtOH-mediated increases in TGFβ and stellate cell activation (Anania et al., 1996; Purohit and Brenner, 2006; Novitsky et al. 2005; Zheng et al., 2007), it is surprising that 4MP treatment had no effect in the current study on EtOH-induced TGFβ mRNA or increased expression of SMA. Acetaldehyde has also been reported to inhibit hepatocyte proliferation in vitro (Clemens, 2007). However, EtOH/4MP co-treatment did not increase the proportion of hepatocytes in S-phase compared to EtOH treatment alone.
An important limitation in interpretation of these data is the lack of complete specificity of DAS and 4MP as chemical inhibitors of CYP2E1 and ADH. DAS also acts as a phenobarbitone-like inducer via CAR in addition to inhibiting CYP2E1 (Fisher et al. 2007) and 4MP inhibits both ADH and CYP2E1 (Porubsky et al. 2008). However, genetic approaches to the address the question of the role of EtOH metabolism in ALD have similar drawbacks such as compensatory changes in other enzymes such as CYP4A1 in CYP2E1 knock-out mice (Wan et al., 2001). Based on our data, we conclude that much of the hepatic pathology produced by chronic alcohol exposure is independent of EtOH metabolism. However, our data also suggest that acetaldehyde formation is associated with development of oxidative and ER stress and necrotic injury. In contrast, CYP2E1-dependent EtOH metabolism appears to be associated to some degree with triglyceride accumulation increased TNFα and chemokine production.
Acknowledgments
The authors wish to thank Mat Ferguson, Terry Fletcher, Kim Hale and Renee Till for technical assistance on this paper. Supported in part by NIAAA R01 08645 (T.M.B.).
References
- Albano E, Clot P, Morimoto M, Tomasi A, Ingelman-Sundberg M, French SW. Role of cytochrome P4502E1-dependent formation of hydroxyethyl free radical in the development of liver damage in rats intragastrically fed with ethanol. Hepatology. 1996;23:155–163. doi: 10.1002/hep.510230121. [DOI] [PubMed] [Google Scholar]
- Anania FA, Potter JJ, Rennie-Tankersiery L, Mezey E. Activation by acetaldehyde of the promoter of the mouse alpha2(1)collagen gene when transfected into rat activated stellate cells. Arch Biochem Biophys. 1996;331:187–193. doi: 10.1006/abbi.1996.0297. [DOI] [PubMed] [Google Scholar]
- Apte UM, McRee R, Ramaiah SK. Hepatocyte proliferation is the possible mechanism for the decreased in liver injury during the steatosis stage of alcoholic liver disease. Toxicol Pathol. 2004;32:567–576. doi: 10.1080/01926230490508812. [DOI] [PubMed] [Google Scholar]
- Arab JP, Pizarro M, Solis N, Sun H, Thevananther S, Arrese M. Mild hypothermia does not affect liver regeneration after partial hepatectomy in mice. Liver Int. 2009;29:344–348. doi: 10.1111/j.1478-3231.2008.01834.x. [DOI] [PMC free article] [PubMed] [Google Scholar]
- Arteel G. Oxidants and antioxidants in alcoholic liver disease. Gastroenterology . 203;124:779–790. doi: 10.1053/gast.2003.50087. [DOI] [PubMed] [Google Scholar]
- Badger TM, Ronis MJJ, Lumpkin CK, Shahare M, Irby D, Huang J, Valenine C, Mercado C, Thomas PE, Ingelman-Sundberg M, Crouch J. Effects of chronic ethanol on growth hormone secretion and hepatic P450 isozymes of the rat. J Pharmacol Exp Therap. 1993a;264:438–447. [PubMed] [Google Scholar]
- Badger TM, Crouch J, Irby D, Hakkak R, Shahare M. Episodic excretion of ethanol during chronic intragastric ethanol infusion in the male rat: continuous vs. cyclic ethanol and nutrient infusions. J Pharmacol Exp Ther. 1993b;264:938–943. [PubMed] [Google Scholar]
- Badger TM, Ronis MJJ, Ingelman-Sundberg M, Hakkak R. Administration of CYP2E1 inhibitors does not abolish pulsatile blood alcohol concentrations in a model where ethanol is infused chronically. Eur J Biochem. 1995;230:914–919. doi: 10.1111/j.1432-1033.1995.tb20636.x. [DOI] [PubMed] [Google Scholar]
- Badger TM, Hoog J-0, Ronis MJJ, Ingelman-Sundberg M. Cyclic variation of class I alcohol dehydrogenase in male rats treated with ethanol. Biochem Biophys Res Commun. 2000;274:684–688. doi: 10.1006/bbrc.2000.3186. [DOI] [PubMed] [Google Scholar]
- Baumgardner JN, Shankar K, Korourian S, Badger TM, Ronis MJJ. Undernutrition enhances alcohol-induced hepatocyte proliferation in the liver of rats fed via total enteral nutrition. Am J Physiol Gastrointest Liver Physiol. 2007;293:G335–G364. doi: 10.1152/ajpgi.00038.2007. [DOI] [PubMed] [Google Scholar]
- Baumgardner JN, Shankar K, Hennings L, Badger TM, Ronis MJJ. A new rat model for nonalcoholic steatohepatitis utilizing overfeeding of diets high in polyunsaturated fat by total enteral nutrition. Am J Physiol Gastrointest Liver Physiol. 2008a;294:G27–G38. doi: 10.1152/ajpgi.00296.2007. [DOI] [PubMed] [Google Scholar]
- Baumgardner JN, Shankar K, Hennings L, Badger TM, Ronis MJJ. N-acetylcysteine attenuates progression of liver pathology in a rat model of non-alcoholic steatohepatitis. J Nutr. 2008b;138:1872–1879. doi: 10.1093/jn/138.10.1872. [DOI] [PMC free article] [PubMed] [Google Scholar]
- Butura A, Nilsson K, Morgan K, Morgan TR, French SW, Johansson I, Schuppe-Koistinen I, Ingelman-Sundberg M. The impact of CYP2E1 on the development of alcoholic liver disease as studied in a transgenic mouse model. J Hepatol. 2009;50:572–583. doi: 10.1016/j.jhep.2008.10.020. [DOI] [PubMed] [Google Scholar]
- Cao Q, Mak KM, Lieber CS. Dilineoylphosphatidylcholine decreases acetaldehyde-induced TNF-alpha generation in Kupffer cells of ethanol-fed rats. Biochem Biophys Res Commun. 2002;299:459–464. doi: 10.1016/s0006-291x(02)02672-4. [DOI] [PubMed] [Google Scholar]
- Caro AA, Cederbaum AI. Role of intracellular calcium and phospholipase A2 in arachidonic acid-induced toxicity in liver cells overexpressing CYP2E1. Arch Biochem Biophys. 2007;457:252–263. doi: 10.1016/j.abb.2006.10.018. [DOI] [PMC free article] [PubMed] [Google Scholar]
- Clemens DL. Effects of ethanol on hepatic cellular replication and cell cycle progression. World J Gastroenterol. 2007;13:4955–4959. doi: 10.3748/wjg.v13.i37.4955. [DOI] [PMC free article] [PubMed] [Google Scholar]
- Crews FT, Bachara R, Brown LA, Guidot DM, Mandrekar P, Oak S, Qin L, Szabo G, Wheeler M, Zou J. Cytokines and alcohol. Alcohol Clin Exp Res. 2006;30:720–730. doi: 10.1111/j.1530-0277.2006.00084.x. [DOI] [PubMed] [Google Scholar]
- Diehl AM. Liver disease in alcohol abusers: clinical perspective. Alcohol. 2002;27:7–11. doi: 10.1016/s0741-8329(02)00204-5. [DOI] [PubMed] [Google Scholar]
- DuPont I, Badenez P, Berthou F, Simon B, Bardou LG, Lucas D. Cytochrome P450 2E1 activity and oxidative stress in alcoholic patients. Alcohol Alcohol. 2000;35:98–103. doi: 10.1093/alcalc/35.1.98. [DOI] [PubMed] [Google Scholar]
- Essers J, Theil AF, Baldeyron C, Cappellen WA, Houtsmuller AB, Kanaar R, Vermeulen W. Nuclear dynamics of PCNA in DNA replication and repair. Mol Cell Biol. 2005;25:9350–9359. doi: 10.1128/MCB.25.21.9350-9359.2005. [DOI] [PMC free article] [PubMed] [Google Scholar]
- Fang C, Lindros KO, Ronis MJJ, Badger TM, Ingelman-Sundberg M. Alcohol-dependent regulation of hepatic expression of cytokines and the counteracting effect of chlormethiazole. Hepatology. 1998;27:1304–1310. doi: 10.1002/hep.510270516. [DOI] [PubMed] [Google Scholar]
- Fisher CD, Augustine LM, Maher JM, Nelson DM, Slitt A, Klaassen CD, Lehman-McKeeman LD, Cherrington NJ. Induction of drug metabolizing enzymes by garlic and allyl sulfide compounds via activation of constitutive androstane receptor and nuclear factor E2-related factor 2. Drug Metab Dispos. 2007;35:995–1000. doi: 10.1124/dmd.106.014340. [DOI] [PubMed] [Google Scholar]
- Gomez-Quiroz L, Bucio L, Souza V, Escobar C, Farfan B, Hernandez E, Konigsberg M, Vargas-Vorackova F, Kershenobich D, Gutierrez-Ruiz MC. Interleukin 8 response and oxidative stress in HepG2 cells treated with ethanol, acetaldehyde and lipopolysaccaride. Hepatol Res. 2003;26:134–141. doi: 10.1016/s1386-6346(03)00010-x. [DOI] [PubMed] [Google Scholar]
- Gouilon Z, Lucas D, Li J, Hagbjork AL, French BA, Fu P, Fang C, Ingelman-Sundberg M, Donohue TM, French SW. Inhibition of ethanol-induced liver disease in the intragastric feeding rat model by chlormethiazole. Proc Soc Exp Biol Med. 2000;224:302–308. doi: 10.1046/j.1525-1373.2000.22435.x. [DOI] [PubMed] [Google Scholar]
- Greenwell A, Foley JF, Maronpot RR. An enhancement method for immunohistochemical staining of proliferating cell nuclear antigen in archival rodent tissues. Cancer Lett. 1991;59:251–256. doi: 10.1016/0304-3835(91)90149-c. [DOI] [PubMed] [Google Scholar]
- He L, Simmen FA, Ronis MJJ, Badger TM. Chronic ethanol feeding impairs insulin signaling in rats through disrupting Akt/PKB association with the cell membrane: Role of TRB3 in inhibition of Akt/PKB activation. J Biol Chem. 2006;281:11126–11134. doi: 10.1074/jbc.M510724200. [DOI] [PubMed] [Google Scholar]
- He L, Marecki JC, Serrero G, Simmen FA, Ronis MJJ, Badger TM. Dose-dependent effects of alcohol on insulin signaling: Partial explanation for biphasic alcohol impact on human health. Mol Endocrinol. 2007;21:2541–2550. doi: 10.1210/me.2007-0036. [DOI] [PubMed] [Google Scholar]
- Hsiang CY, Wu SL, Chen SE, Ho TY. Acetaldehyde-induced interleukin-1 beta and tumor necrosis factor alpha production is inhibited by berberine through nuclear factor-kappa B signaling pathway in HepG2 cells. J Biomed Sci. 2005;12:791–801. doi: 10.1007/s11373-005-9003-4. [DOI] [PubMed] [Google Scholar]
- Isayama F, Froh M, Bradford BU, McKim SE, Kadilska MB, Conno HD, Mason RP, Koop DR, Wheeler MD, Arteel GE. The CYP inhibitor 1-aminobenzotriazole does not prevent oxidative stress associated with alcohol-induced liver injury in rats and mice. Free Radic Biol Med. 2003;35:1568–1581. doi: 10.1016/j.freeradbiomed.2003.09.007. [DOI] [PubMed] [Google Scholar]
- Johansson I, Ingelman-Sundberg M. Carbon tetrachloride-induced lipid peroxidation dependent on an ethanol-inducible form of rabbit liver microsomal cytochrome P450. FEBS Lett. 1985;183:265–269. doi: 10.1016/0014-5793(85)80790-0. [DOI] [PubMed] [Google Scholar]
- Jung Y, Omenetti A, Syn WK, Witek R, Chui S, Diehl AM. Regulation of progenitor response to alcohol-induced liver injury. Alc Clin Exp Res. 2009;33S:015. [Google Scholar]
- Kaplowitz N, Ji C. Unfolding new mechanisms of alcoholic liver disease in the endoplasmic reticulum. J Gastroenterol Hepatol. 2006;3:S7–S9. doi: 10.1111/j.1440-1746.2006.04581.x. [DOI] [PubMed] [Google Scholar]
- Kono H, Bradford BU, Yin M, Sulik KK, Koop DR, Peters JM, Gonzalez FJ, McDonald T, Dikalova A, Kadiiska MB, Mason RP, Thurman RG. CYP2E1 is not involved in early alcohol-induced liver injury. Am J Physiol Gastrointest Liver Physiol. 1999;277:G1259–G1267. doi: 10.1152/ajpgi.1999.277.6.G1259. [DOI] [PubMed] [Google Scholar]
- Koop DR. Hydroxylation of p-nitrophenol by rabbit ethanol-inducible cytochrome P450 isozyme 3a. Mol Pharmacol. 1986;29:399–404. [PubMed] [Google Scholar]
- Korourian S, Hakkak R, Ronis MJJ, Shelnut S, Waldren JA, Badger TM. The Effects of Enteral Nutrition and Chronic Alcohol on Hepatic Necrosis. Toxicol Sci. 1999;47:110–118. [Google Scholar]
- Koteish A, Yang S, Lin H, Huang J, Diehl AM. Ethanol induces redox sensitive cell cycle inhibition and inhibits liver regeneration after partial hepatectomy. Alc Clin Exp Res. 2002;26:1710–1718. doi: 10.1097/01.ALC.0000036923.77613.59. [DOI] [PubMed] [Google Scholar]
- Latavala J, Hietala J, Koivisto H, Jarvi K, Anttila P, Niemela O. Immune responses to ethanol metabolites and cytokine profiles differentiates alcoholics with or without liver disease. Am J Gastroenterol. 2005;100:1303–1310. doi: 10.1111/j.1572-0241.2005.41509.x. [DOI] [PubMed] [Google Scholar]
- Leclercq IA, Farell GC, Field J, Bell DR, Gonzalez FJ, Robertson GR. CYP2E1 and CYP4A1 as microsomal catalyst of lipid peroxides in murine nonalcoholic steatohepatitis. J Clin Invest. 2000;105:1067–1075. doi: 10.1172/JCI8814. [DOI] [PMC free article] [PubMed] [Google Scholar]
- Li SY, Ren J. Cardiac overexpression of alcohol dehydrogenase exacerbates chronic ethanol ingestion-induced myocardial dysfunction and hypertrophy: role of insulin signaling and ER stress. J Mol Cell Cardiol. 2008;44:992–1001. doi: 10.1016/j.yjmcc.2008.02.276. [DOI] [PMC free article] [PubMed] [Google Scholar] [Retracted]
- Lieber CS, De Carli LM. Hepatotoxicity of ethanol. J Hepatol. 1991;12:394–401. doi: 10.1016/0168-8278(91)90846-4. [DOI] [PubMed] [Google Scholar]
- Lieber CS. Biochemical factors in alcoholic liver disease. Semin Liver Dis. 1993;13:136–153. doi: 10.1055/s-2007-1007345. [DOI] [PubMed] [Google Scholar]
- Lieber CS. Alcoholic fatty liver: its pathogenesis and mechanism of progression to inflammation and fibrosis. Alcohol. 2004;34:9–19. doi: 10.1016/j.alcohol.2004.07.008. [DOI] [PubMed] [Google Scholar]
- Lindros KO, Jokelainen K, Nanji AA. Acetaldehyde prevents nuclear factor-kappa B activation and hepatic inflammation in ethanol-fed rats. Lab Invest. 1999;79:799–806. [PubMed] [Google Scholar]
- Lluis JM, Colell A, Garcia-Ruiz C, Kaplowitz N, Fernandez-Checa JC. Acetaldehyde impairs mitochondrial glutathione transport in HepG2 cells through endoplasmic reticulum stress. Gastroenterology. 2003;124:708–724. doi: 10.1053/gast.2003.50089. [DOI] [PubMed] [Google Scholar]
- Lu Y, Cederbaum AI. CYP2E1 and oxidative liver injury by alcohol. Free Radic Biol Med. 2008;44:723–738. doi: 10.1016/j.freeradbiomed.2007.11.004. [DOI] [PMC free article] [PubMed] [Google Scholar]
- Martin NC, McGregor AH, Sansom N, Gould S, Harrison DJ. Phenobarbitone-induced ploidy changes in liver occur independently of p53. Toxicol Lett. 119:109–115. doi: 10.1016/s0378-4274(00)00299-x. [DOI] [PubMed] [Google Scholar]
- Matsumoto A, Kawamoto T, Mutoh F, Isse T, Oyama T, Kitagawa K, Nakayama KI, Ichiba M. Effects of 5-week ethanol feeding on the liver of aldehyde dehydrogenase 2-knockout mice. Pharmacogen Genom. 2008;18:847–852. doi: 10.1097/FPC.0b013e328307a0a9. [DOI] [PubMed] [Google Scholar]
- Morimoto M, Hagbjork AL, Wan YJ, Fu PC, Clot P, Albano E, Ingelman-Sundberg M, French SW. Modulation of experimental alcohol-induced liver disease by cytochrome P450 2E1 inhibitors. Hepatology. 1995;21:1610–1617. [PubMed] [Google Scholar]
- Nieto N, Friedman SL, Cederbaum AI. Stimulation and profliferation of primary rat hepatic stellate cells by cytochrome P450 2E1-derived reactive oxygen species. Hepatology. 2002;35:62–73. doi: 10.1053/jhep.2002.30362. [DOI] [PubMed] [Google Scholar]
- Novitsky G, Ravi R, Potter JJ, Rennie-Tankersley L, Wang L, Mezey E. Effects of acetaldehyde and TBF alpha on the inhibitory kappa B alpha protein and nuclear factor kappa B activation in hepatic stellate cells. Alcohol Alcohol. 2005;40:96–101. doi: 10.1093/alcalc/agh116. [DOI] [PubMed] [Google Scholar]
- Ohkawa H, Ohishi N, Yagi K. Assay for lipid peroxidation in animal tissues by thiobarbituric acid reaction. Anal Biochem. 1979;95:351–358. doi: 10.1016/0003-2697(79)90738-3. [DOI] [PubMed] [Google Scholar]
- Porubsky PR, Meneely KM, Scott EE. Structures of human cytochrome P450 2E1: insights into the binding of inhibitors and both small molecular weight and fatty acid substrates. J Biol Chem. 2008;283:33698–33707. doi: 10.1074/jbc.M805999200. [DOI] [PMC free article] [PubMed] [Google Scholar]
- Purohit V, Brenner DA. Mechanisms of alcohol-induced hepatic fibrosis: a summary of the Ron Thurman symposium. Hepatology. 2006;43:872–878. doi: 10.1002/hep.21107. [DOI] [PubMed] [Google Scholar]
- Ronis MJJ, Ingelman-Sundberg M, Badger TM. Induction, Suppression and Inhibition of Multiple Hepatic Cytochrome P450 Isozymes in Male Rat and Bob White Quail By Ergosterol Biosynthesis Inhibiting Fungicides, Biochem. Pharmacol. 1994;48:1953–1965. doi: 10.1016/0006-2952(94)90594-0. [DOI] [PubMed] [Google Scholar]
- Ronis MJJ, Lindros K, Ingelman-Sundberg M. The CYP 2E1 Family. In: Ioneddes C, editor. Cytochrome P450: Biochemical and Toxicological Aspects. CRC Press; 1996. pp. 211–239. [Google Scholar]
- Ronis MJJ, Hakkak R, Korourian S, Albano E, Seokoo Y, Ingelman-Sundberg M, Lindros KO, Badger TM. Alcoholic liver disease in rats fed ethanol as part of oral or intragastric low carbohydrate liquid diets. Exp Biol Med. 2004;229:351–360. doi: 10.1177/153537020422900410. [DOI] [PubMed] [Google Scholar]
- Ronis MJJ, Butura A, Korourian S, Shankar K, Badeaux J, Albano E, Ingelman-Sundberg M, Badger TM. Cytokine and chemokine expression associated with steatohepatitis and hepatocyte proliferation in rats fed ethanol via total enteral nutrition, Exp. Biol Med. 2008;233:344–355. doi: 10.3181/0707-RM-203. [DOI] [PubMed] [Google Scholar]
- Tiig H, Diehl AM. Cytokines in alcoholic and nonalcoholic steatohepatitis. N Eng J Med. 2000;343:1167–1176. doi: 10.1056/NEJM200011163432007. [DOI] [PubMed] [Google Scholar]
- Wan YY, Cai Y, Li J, Yuan Q, French B, Gonzalez FJ, French SW. Regulation of peroxisome proliferator activated receptor alpha-mediated pathways in alcohol fed cytochrome P450 2E1 deficient mice. Hepatol Res. 2001;19:117–130. doi: 10.1016/s1386-6346(00)00089-9. [DOI] [PubMed] [Google Scholar]
- Wu D, Cederbaum AI. Cytochrome P4502E1 sensitizes to tumor necrosis factor alpha-induced liver injury through activation of mitogen-activated protein kinases in mice. Hepatology. 2008;47:1005–1017. doi: 10.1002/hep.22087. [DOI] [PubMed] [Google Scholar]
- Zheng SM, Jiang MD, Zeng WZ, Xu H, Wang YX, Ma HD, Xie FW, Zhang Y, Qin JP, Wu XL. Effects of extracellular signal-regulated kinase on rat cultured stellate cells stimulated by acetaldehyde. J Dig Dis. 2007;8:148–153. doi: 10.1111/j.1443-9573.2007.00302.x. [DOI] [PubMed] [Google Scholar]