Abstract
Extracellular recordings from neurons using microelectrode and field effect transistor arrays suffer from many problems including low signal to noise ratio, signal attenuation due to counter-ion diffusion from the bulk extracellular medium and a modification of the shape of the cell-generated potentials due to the presence of a highly dispersive dielectric medium in the cell-electrode cleft. Attempts to date to study the neuron-electrode interface have focused on point or area contact linear-equivalent-circuit models. We present here the results obtained from a ‘data-true’ nonlinear dynamic characterization of the neuron-electrode junction using Volterra-Wiener modeling. For the characterization, NG108-15 cells were cultured on microelectrode arrays and stimulated with broadband Gaussian white noise under voltage clamp mode. A Volterra-Wiener model was then estimated using the input signal and the extracellular signal recorded on the microelectrode. The existence of the second order Wiener kernel confirmed that the recorded extracellular signal had a nonlinear component. The verification of the estimated model was carried out by employing the intracellular action potential as an input to the Volterra-Wiener model and comparing the predicted extracellular response with the corresponding extracellular signal recorded on the microelectrode. We believe that a ‘data-true’ Volterra-Wiener model of the neuron-electrode junction shall not only facilitate a direct insight into the physicochemical processes taking place at the interface during signal transduction but will also allow one to evolve strategies for engineering the neuron-electrode interface using surface chemical modification of the microelectrodes.
Keywords: neuroelectronic interfacing, neuron-electrode junction, Volterra-Wiener modeling, nonlinear dynamics
1. Introduction
A neuron encodes and expresses its response to environmental cues through a change in the shape and/or firing rate of action potentials generated in response to an activation of the nonlinear ionic currents flowing across voltage gated ion channels in its cell membrane. Detection and analysis of action potential shapes and firing rates, therefore, promises to be a mainstay of applications in high throughput functional screening of drugs or toxins and an important indicator in ascertaining the physiological health of long term neuronal cultures in order to monitor chronic experiments involving neurodegenerative diseases and spinal cord injury. Conventional techniques of studying electrophysiological activity, like the intracellular patch clamp method, limit the life of a neuron to a few hours. Voltage sensitive dyes also prove to be toxic when employed for chronic experimental studies 1, 2. Another problem associated with using voltage sensitive dyes for high throughput drug and toxin detection is that the dyes may themselves interfere with the drug or toxin chemistry. For this reason, the development of technology for non-invasive extracellular recording of neuron-generated potentials using microelectrode (MEAs) and field effect transistor (FET) arrays assumes great significance 3–8.
Unfortunately, the use of extracellular recording methods employing MEAs and FET arrays has been limited to studies of changes in firing rate/pattern of action potentials in response to changes in environmental factors or in chronic experiments while the information pertaining to the activity of individual ion channels obtainable from the shape of the action potential is lost 4, 9–11. This wealth of information present in the action potential shape is inaccessible for analysis in the extracellular recording methods employing MEAs and FET arrays because of problems such as: low signal to noise ratios due to thermal motion and adsorption-desorption of macromolecules; masking of the neuron-generated potentials due to counter-ion diffusion; and, modification and attenuation of the signal waveform due to dielectric relaxation of the medium in the neuron-electrode cleft. There exists, therefore, a need for modeling and engineering the neuron-electrode interface to enable extraction of the relevant electrophysiological parameters in a non-invasive fashion through extracellular recording methods employing MEAs or FET arrays.
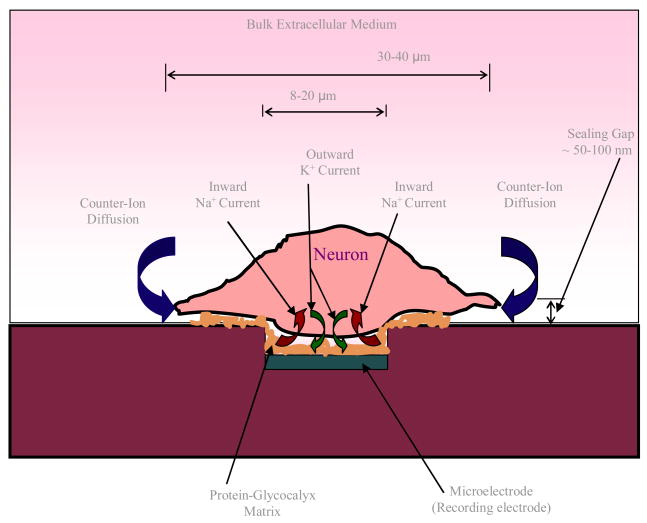
Attempts to date to model the neuron-electrode interface have primarily focused on point (lumped parameter, 12–16) or area contact (distributed parameter, 17, 18) linear-equivalent-circuit models that fail to take in to account the complex processes of electrodiffusion of ions through the porous protein-glycocalyx matrix and the dielectric dispersion involved in signal transduction across the neuron-electrode interface (see figure 1). Consequently, these models have proven to be inadequate for the correlation of the ion channel dynamics of an electrically active neuron with the potentials recorded on the extracellular microelectrode. Development of a realistic model of the neuron-electrode interface is, therefore, important to advance an understanding of the underlying physicochemical processes taking place during signal transduction across the interface and open avenues for engineering the interface to improve the neuron-electrode coupling.
Figure 1.
A schematic of the neuron-electrode junction.
In this paper, we present our results from a ‘data-true’ approach to modeling of the neuron-electrode junction by estimating a nonlinear dynamic Volterra-Wiener model from experimentally obtained input-output data records.
2. Materials and Methods
2.1. Cell Culture
NG108-15 cell line (passage number: 16) was obtained from Dr. M. W. Nirenberg (NIH). NG108-15 cells were cultured according to published protocols 19, 20. Briefly, stock was grown in T-25 and T-75 flasks in 90% Dulbecco’s modified Eagle’s medium (DMEM, GIBCO) supplemented with 10% Fetal Bovine Serum and HAT (GIBCO, 100x) supplement at 37°C and 5% CO2. Differentiation was induced by plating the cells in a serum-free defined medium (DMEM + B27 supplement, GIBCO) on the top of substrate embedded microelectrode arrays (MEAs, Multichannel Systems, Reutlingen, Germany, 10 μm electrode, 200 μm separation) at a density of 40,000 cells/dish. Before plating, MEAs were incubated with poly-D-lysine (Sigma, 10 μg/ml) for 1 hour at 37 °C.
2.2. Electrophysiological recordings
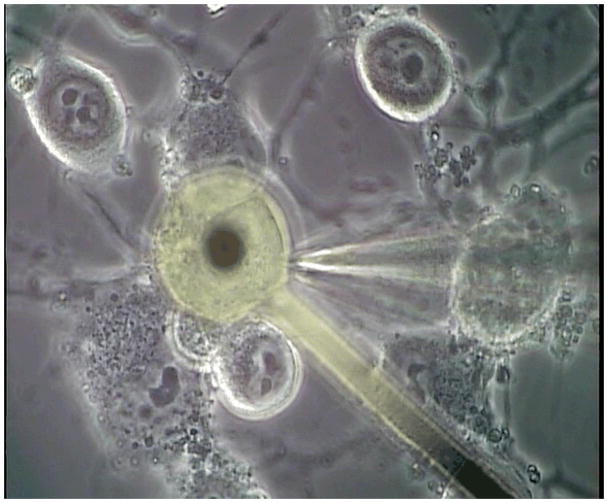
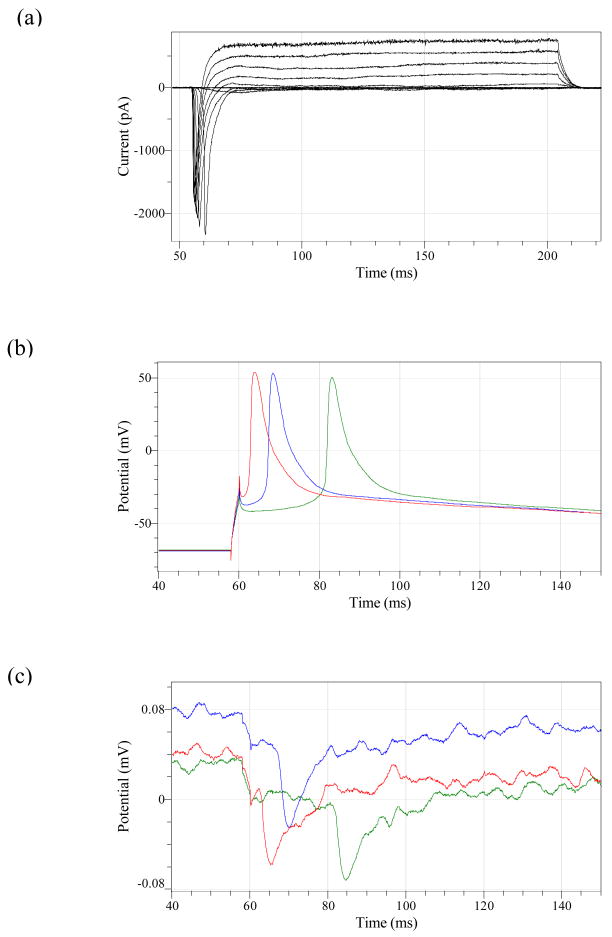
On day 7 after plating of the cells on MEAs, the MEAs with cultured cells were transferred to the stage of a Zeiss Axioskop 2FS Plus microscope. Extracellular recordings from the substrate-embedded electrodes were performed with the help of a custom-made contact pad and an extracellular differential amplifier (Model 3000, A-M Systems). The extracellular solution for the recordings was DMEM (pH adjusted to 7.3 with HEPES, Sigma). Whole-cell patch clamp recordings were performed on neurons covering the microelectrodes completely (Figure 2). Cells on the electrodes were visualized by combining transmitted phase-contrast and reflected bright field illumination. Patch pipettes (4–6 MΩ resistance) were prepared from borosilicate glass (BF150-86-10; Sutter, Novato, CA) with a Sutter P97 pipette puller and were filled with intracellular solution containing (in mM) potassium gluconate 130, MgCl2 2, EGTA 1, HEPES 15, and ATP 5. Voltage clamp and current clamp experiments were performed with a Multiclamp 700A (Axon, Union City, CA) amplifier, Digidata 1322A interface, and pClamp 9 software. The neuronal differentiation of the NG108-15 cells was confirmed by recording sodium and potassium currents in the voltage clamp mode and by measuring action potentials in the current clamp mode using a 200 ms depolarization stimulus (figures 3a and b). The corresponding extracellular responses recorded on the microelectrode are shown in figure 3c.
Figure 2.
Micrograph of a neuron that is over an extracellular microelectrode while simultaneously being stimulated with bandlimited Gaussian white noise through a glass patch-clamp micropipette.
Figure 3.
Examples of (a) Inward sodium and outward potassium currents obtained under voltage clamp from the patch-clamp neuron covering the microelectrode, (b) Intracellular action potentials, and, (c) their corresponding extracellular responses, as recorded from the microelectrode.
Experiments employing white noise stimulation of the neuron-electrode junction were performed if the access resistance for the neuron was less than 15 MΩ and the action potential evoked a detectable signal on the extracellular electrode. For obtaining the input output data records, neurons were stimulated through the intracellular patch pipette in voltage clamp mode with band limited (0–500 Hz) Gaussian white noise sampled at a rate of 9.8 kHz for 100 seconds. The white noise signal was generated in Matlab and imported to pClamp as a stimulus file. Whole cell capacitance and resistance were compensated but no series-resistance compensation was used. The holding membrane potential was −10 mV and the white noise stimulus spanning an amplitude range of ± 50 mV was superposed on this signal. The extracellular signal was high and low pass filtered at 1Hz (using a second order Bessel filter) and 1 kHz (using a fourth order Bessel filter) respectively. The data, thus obtained, was then exported to Matlab for further analysis.
3. Results
3.1. Volterra-Wiener Characterization
In this technique a bandlimited Gaussian white noise spanning the frequency and amplitude range of natural input for the neuron was used to characterize the system. In our case, the neuron-generated intracellular potentials constitute the typical input, with frequency components in the 0–500 Hz range; the recorded extracellular potentials on the microelectrode the output; and, the neuronal membrane and the neuron-electrode cleft the input transforming system. The output of the system was expressed in terms of a Wiener series which forms a power series in x(t), the input to the system. For a second order estimation
| (1) |
where y(t) is the output, (Gi) is an orthogonal set of functionals given by:
| (2) |
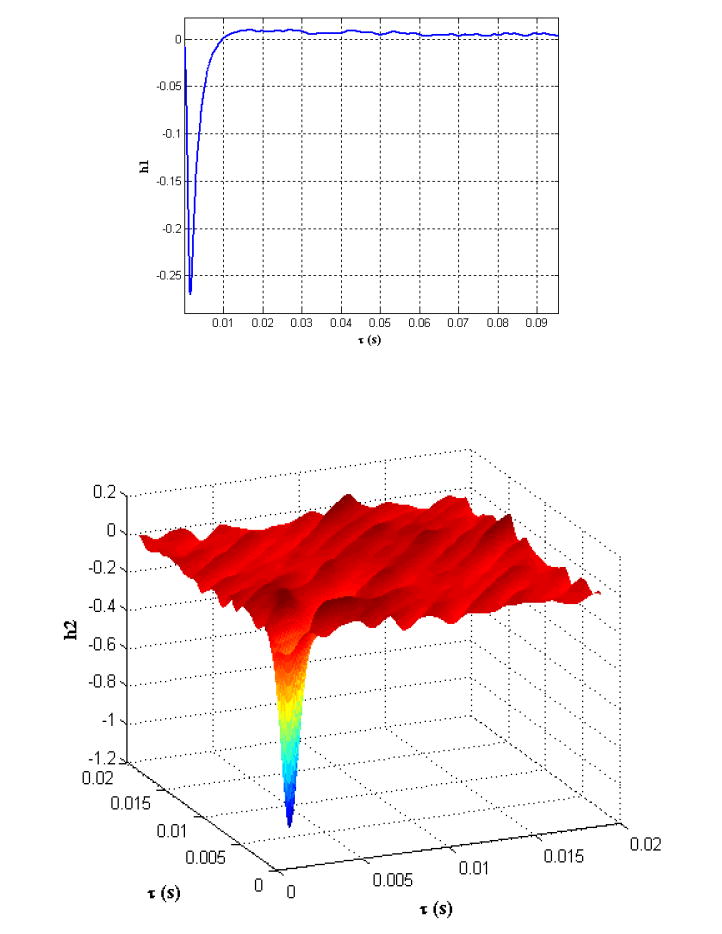
P is the power of the input white noise and {hi} is the set of Wiener kernels that characterize the relationship between the input and the output. The first and second order Wiener kernels (figures 4a and 4b) were computed using a code implemented in Matlab for the Lee-Schetzen technique of cross-correlation 21 that makes use of the Gaussian property of the input stimulus (bandlimited white noise) for the computation of the Wiener kernels.
Figure 4.
(a) First, and (b) second order Wiener kernels computed from the input-output records corresponding to Gaussian white noise stimulus obtained from the neuron-electrode junction.
The zeroth order kernel (h0) is simply the expectation value, E[y(t)], of the system output while the other two higher order kernels were given by the first and second order cross-correlations of the input and the output as
| (3) |
and
| (4) |
where yL (t) = y(t) − G0 and yQ (t) = y(t) − G0 − G1(t).
As described in the experimental methods, the 1 Hz high pass Bessel filter was used to remove the slowly varying non-stationarities in the output signal that led to non-convergence of the first and second order kernels for even very large values of the lags, τ. These slowly varying non-stationarities could possibly be a result of the changes in the physiology of the cell due to a change in intracellular cytosolic factors upon impaling with a glass micropipette and gradual cell death. The 1 kHz low pass (fourth order) Bessel filter was used to limit the contribution of the high frequency noise to the output signal and frequencies at which there is no significant contribution from the frequency components present in the action potential generated by the neuron.
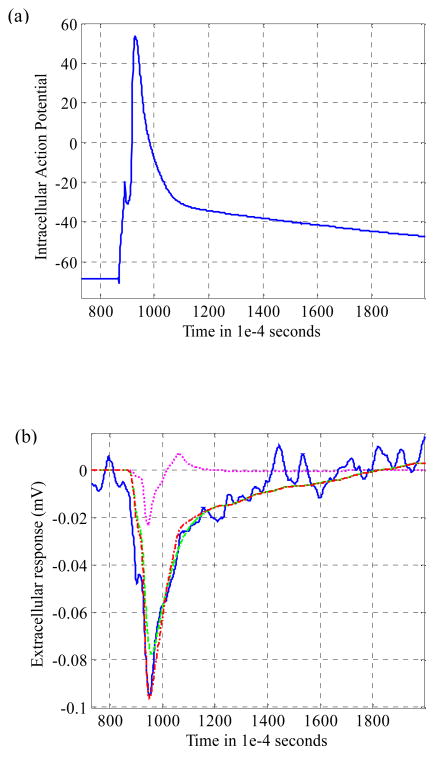
The response of the experimentally obtained Wiener kernels was then verified with the intracellular action potential serving as the test input. Figure 5a shows an intracellular action potential obtained from the neuron-electrode junction shown in figure 1. Figure 5b indicates the corresponding predicted extracellular response with contributions from first and second order reconstructions obtained using the respective Wiener kernels. Also, the actual extracellular response recorded on the microelectrode is shown for comparison. It is evident that the predicted output closely follows the actual output recorded on the extracellular microelectrode.
Figure 5.
(a) Example of an intracellular action potential as recorded from the neuron-electrode system shown in figure 2, and (b) Actual output as recorded on the extracellular microelectrode (solid line), linear predicted output from the first order kernel (dashed), quadratic predicted output from the second order kernel (dotted) and the total predicted output obtained by summing the outputs obtained from the two Wiener kernels (dash-dot-dash).
4. Discussion
Traditionally, the neuron-electrode interface has been modeled as a passive linear equivalent circuit with a combination of resistances and capacitances representing the neuron-electrode cleft and the recording microelectrode 11–16. The intracellular potentials generated through the use of the Hodgkin-Huxley model or other similar models have then been employed as inputs with the linear equivalent circuit (representing the interface) forming the input transforming system. In this paper, we have presented results from Volterra-Wiener characterization for the composite neuron-electrode junction with the intracellular potentials forming the input; the recorded extracellular potentials on the microelectrode the output; and, the neuronal membrane and the neuron-electrode cleft the input transforming system. Our results show the presence of nonlinear effects taking place during the process of signal transduction across the neuron-electrode junction and consequently the assumptions pertaining to the passive linearity of the interface need to be reexamined.
4.1. Possible Hypotheses
Two possible hypotheses can be advanced to explain the origins of the nonlinear portion of the extracellular signal recorded on the microelectrode.
4.1.1. Linear interface
The second order nonlinear response shown in figure 5b is biphasic in nature with the initial negative transient signal coinciding with the timing of the inward sodium current and the latter positive transient with the slow outward potassium current during the time course of the action potential. Based on this coincidence one could ascribe the nonlinear portion of the extracellular response entirely to the active ionic currents flowing across the neuronal membrane, thus allowing one to conveniently model the linear part of the response using an equivalent circuit model 22.
4.1.2. Nonlinear interface
Based on an intuitive understanding of the physics of electrodiffusion governed by a system of coupled nonlinear Poisson-Nernst-Planck and the mass conservation or continuity equations together with the expected dielectric relaxation of biological macromolecules in the neuron-electrode cleft (thickness on the order of 40–110 nm 23) in the presence of high electric fields generated during an action potential, it appears reasonable to expect and observe nonlinear effects in the process of signal transduction across the interface. It is notable in this regard that other researchers have also found it difficult to interpret extracellularly recorded signals based solely on the linear equivalent circuit modeling approach and have felt the need to take into account the electrodiffusion of ions in the neuron electrode cleft 24.
Whether the appearance of nonlinearity is due to the activity of ion channels in the neuronal membrane, or due to the physics of electrodiffusion and dielectric relaxation, or a combination thereof, is difficult to say from the observations presented here and further experiments need to be performed to isolate the sources of nonlinearity. An understanding of the phenomena taking place at the neuron electrode interface during the process of signal transduction shall be a key requirement in the future to correctly interpret the extracellularly recorded potentials on the microelectrode and ascertain their relationship to the corresponding intracellular potentials. Such an understanding would then open up avenues for engineering the neuron-electrode interface towards improving the neuron-electrode coupling, which will be critical for the development of neuroelectronic devices for applications in biological computation, neural prosthetics and cell based biosensors for high throughput drug and toxin detection.
4.3. Higher order effects
In figure 5b, the contribution to the output waveform from the stimulation artifact (87 – 92 ms) present in figure 5a showing the intracellular action potential is not captured in the predicted output waveform. The authors believe that this is possibly due to the fact that the Volterra-Wiener series has been limited to just the first three terms and that a consideration of the higher order terms in the series would allow one to account for this observation. Wiener kernels higher than the second order were not computed because computation of the higher order kernels using the Lee-Schetzen technique of cross-correlation becomes computationally very expensive.
5. Conclusions
The complexity of the process of signal transduction across the interface itself really precludes the possibility of using a direct physics based first principles approach to modeling the neuron-electrode interface. Faced with such a predicament, the technique of Volterra-Wiener characterization circumvents both the difficulties inherent in the physics based modeling approach and the assumptions made in the formulation of equivalent circuit models. Yet, offers a novel way to successfully characterize the neuron-electrode junction in a realistic fashion. Use of Volterra-Wiener characterization, therefore, marks an important, albeit small, step towards gaining an understanding of the processes governing the transformation of the intracellular potentials generated by the neuron into the signals recorded on the extracellular microelectrode.
Acknowledgments
The authors are grateful for funding and support from NIH grants RO1NS050452 and 1 RO1EB005459-01A1, DOE grant DE FG02-4ER-46171 and supplemental funding from the I2 Lab at the University of Central Florida.
References
- 1.Chiappalone M, Vato A, Tedesco MB, Marcoli M, Davide F, Martinoia S. Biosensors & Bioelectronics. 2003;18:627–634. doi: 10.1016/s0956-5663(03)00041-1. [DOI] [PubMed] [Google Scholar]
- 2.Mason TW. Fluorescent and Luminescent Probes for Biological Activity. Academic Press; London: 1993. [Google Scholar]
- 3.Bousse L. Sensors and Actuators B-Chemical. 1996;34:270–275. [Google Scholar]
- 4.Gross GW, Harsch A, Rhoades BK, Gopel W. Biosensors & Bioelectronics. 1997;12:373–393. doi: 10.1016/s0956-5663(97)00012-2. [DOI] [PubMed] [Google Scholar]
- 5.Pancrazio JJ, Bey PP, Cuttino DS, Kusel JK, Borkholder DA, Shaffer KM, Kovacs GTA, Stenger DA. Sensors and Actuators B-Chemical. 1998;53:179–185. [Google Scholar]
- 6.Denyer MCT, Riehle M, Britland ST, Offenhauser A. Medical & Biological Engineering & Computing. 1998;36:638–644. doi: 10.1007/BF02524437. [DOI] [PubMed] [Google Scholar]
- 7.Offenhausser A, Knoll W. Trends in Biotechnology. 2001;19:62–66. doi: 10.1016/s0167-7799(00)01544-4. [DOI] [PubMed] [Google Scholar]
- 8.Jung DR, Cuttino DS, Pancrazio JJ, Manos P, Cluster T, Sathanoori RS, Aloi LE, Coulombe MG, Czamaski MA, Borkholder DA, Kovacs GTA, Bey P, Stenger DA, Hickman JJ. Journal of Vacuum Science & Technology a-Vacuum Surfaces and Films. 1998;16:1183–1188. [Google Scholar]
- 9.Xia Y, Gopal KV, Gross GW. Brain Research. 2003;973:151–60. doi: 10.1016/s0006-8993(03)02367-9. [DOI] [PubMed] [Google Scholar]
- 10.Amigo JM, Szczepanski J, Wajnryb E, Sanchez-Vives MV. Biosystems. 2003;68:57–66. doi: 10.1016/s0303-2647(02)00156-9. [DOI] [PubMed] [Google Scholar]
- 11.Mohan DK, Molnar P, Hickman JJ. Biosensors & Bioelectronics. 2006;21:1804–1811. doi: 10.1016/j.bios.2005.09.008. [DOI] [PMC free article] [PubMed] [Google Scholar]
- 12.Jenkner M, Fromherz P. Physical Review Letters. 1997;79:4705–4708. [Google Scholar]
- 13.Weis R, Fromherz P. Physical Review E. 1997;55:877–889. [Google Scholar]
- 14.Kiessling V, Muller B, Fromherz P. Langmuir. 2000;16:3517–3521. [Google Scholar]
- 15.Bove M, Grattarola M, Martinoia S, Verreschi G. Bioelectrochemistry and Bioenergetics. 1995;38:255–265. [Google Scholar]
- 16.Bove M, Martinoia S, Grattarola M, Ricci D. Thin Solid Films. 1996;285:772–775. [Google Scholar]
- 17.Buitenweg J, Rutten WLC, Marani E. IEEE Transactions on Biomedical Engineering. 2003;50:501–509. doi: 10.1109/TBME.2003.809486. [DOI] [PubMed] [Google Scholar]
- 18.Buitenweg JR, Rutten WLC, Marani E. Ieee Engineering in Medicine and Biology Magazine. 2000;19:46–52. doi: 10.1109/51.887245. [DOI] [PubMed] [Google Scholar]
- 19.Higashida H, Streaty RA, Klee W, Nirenberg M. Proceedings Of The National Academy Of Sciences Of The United States Of America. 1986;83:942–946. doi: 10.1073/pnas.83.4.942. [DOI] [PMC free article] [PubMed] [Google Scholar]
- 20.Ma W, Pancrazio JJ, Coulombe M, Dumm J, Sathanoori R, Barker JL, Kowtha VC, Stenger DA, Hickman JJ. Developmental Brain Research. 1998;106:155–163. doi: 10.1016/s0165-3806(97)00208-3. [DOI] [PubMed] [Google Scholar]
- 21.Lee YW, Schetzen M. International Journal of Control. 1965;2:237. [Google Scholar]
- 22.Buitenweg JR, Rutten WLC, Marani E, Polman SKL, Ursum J. Journal of Neuroscience Methods. 2002;115:211–221. doi: 10.1016/s0165-0270(02)00021-3. [DOI] [PubMed] [Google Scholar]
- 23.Braun D, Fromherz P. Physical Review Letters. 1998;81:5241. doi: 10.1103/PhysRevLett.86.2905. [DOI] [PubMed] [Google Scholar]
- 24.Ingebrandt S, Yeung CK, Krause M, Offenhausser A. European Biophysics Journal with Biophysics Letters. 2005;34:144–154. doi: 10.1007/s00249-004-0437-9. [DOI] [PubMed] [Google Scholar]


