


Abstract
DNA microarray measurements are susceptible to error caused by non-specific hybridization between a probe and a target (cross-hybridization), or between two targets (bulk-hybridization). Search algorithms such as BLASTN can quickly identify potentially hybridizing sequences. We set out to improve BLASTN accuracy by modifying the substitution matrix and gap penalties. We generated gene expression microarray data for samples in which 1 or 10% of the target mass was an exogenous spike of known sequence. We found that the 10% spike induced 2-fold intensity changes in 3% of the probes, two-third of which were decreases in intensity likely caused by bulk-hybridization. These changes were correlated with similarity between the spike and probe sequences. Interestingly, even very weak similarities tended to induce a change in probe intensity with the 10% spike. Using this data, we optimized the BLASTN substitution matrix to more accurately identify probes susceptible to non-specific hybridization with the spike. Relative to the default substitution matrix, the optimized matrix features a decreased score for A–T base pairs relative to G–C base pairs, resulting in a 5–15% increase in area under the ROC curve for identifying affected probes. This optimized matrix may be useful in the design of microarray probes, and in other BLASTN-based searches for hybridization partners.
INTRODUCTION
The gene expression microarray is designed to simultaneously measure the relative abundance of a large number of transcripts in a biological specimen via the specific hybridization between surface-bound probes and their complementary labeled targets. The fluorescence signal measured from a probe spot is taken as an estimate of the relative abundance of bound targets, and thus as an estimate of the abundance of the corresponding transcript in the biological specimen from which the target is derived. Ideally, the measured probe intensity would be determined only by the concentration of its complementary target (Figure 1a). However, hybridization between nucleotide strands can occur even when the two sequences are not perfectly complementary. This unintended, non-specific binding can affect the resulting measurements in at least two ways: first, cross-hybridization between probes and unintended targets can lead to an increase in measured signal (Figure 1b). On the other hand, bulk-hybridization between two target strands competes for regular probe-target binding and thus decreases the measured intensity of the corresponding probe (1) (Figure 1c). Either type of non-specific hybridization can cause false changes in gene expression, as well as reduced sensitivity to gene changes and spurious correlation between genes (2–6).
Figure 1.
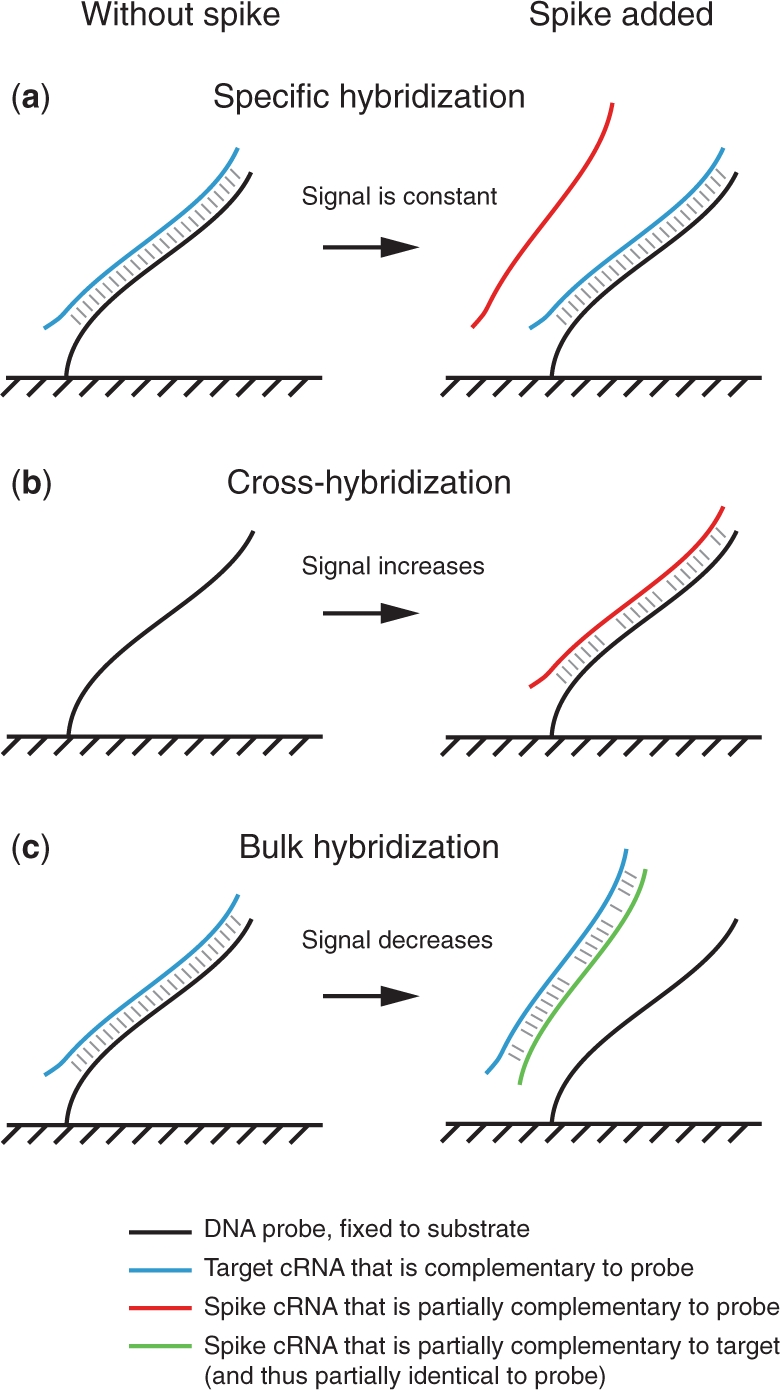
Non-specific hybridization can increase or decrease the observed intensity of a microarray probe. (a) In general, hybridization occurs between a DNA probe and an RNA target with a perfectly complementary sequence, resulting in a signal intensity approximately proportional to the concentration of the RNA target. In the ideal case, the concentration of other transcripts, including the spike, do not affect the intensity. (b) Cross-hybridization is hybridization that occurs between a DNA probe and an RNA target that are partially complementary to each other. Thus, if a spike target happens to be partially complementary to a probe sequence, the observed probe intensity can increase with addition of the spike. (c) Bulk-hybridization can occur between two RNA targets that are partially complementary to each other. Thus, if a spike target happens to be similar to a probe sequence, the spike and the target can form a strong RNA–RNA hybrid, thus reducing the concentration of free target and causing the observed probe intensity to decrease.
The potential for cross-hybridization is a well-known problem and is an important consideration in the design of microarray probes (7). Several methods are available to estimate hybridization affinity between nucleic acid oligomers (8,9), but it may not be computationally feasible to calculate the affinity in this manner between all possible probe-transcript pairs. Thus, a common solution is to search each potential probe using BLASTN (10) for alignments to unintended transcripts (7,11). When an alignment is found, the decision to discard a probe can be based on heuristic rules involving alignment length and percent identity (12) or on an estimate of the affinity between the probe and target using rules inferred from either free solution studies (11,13) or expression data (14).
In a previous work, we generated a spike-in data set using commercially prepared RNA samples from the Jurkat human cell line with or without a high relative concentration of hemoglobin mRNA (hereafter, the hemoglobin data set) (4). We used BLASTN to find the best alignment between each probe sequence and the sequence of the hemoglobin spikes, and we observed that probes with a higher alignment score were more likely to increase in intensity when the spikes were added.
Identification of hybridization between two sequences using BLASTN is based on a high-scoring alignment between the first sequence and the reverse complement of the second sequence. Antisense-type oligo microarrays such as the Affymetrix microarrays used in this work are designed to detect cRNA targets; these are the reverse complements of the mRNA and are typically generated by the Eberwine method (15). Thus, a search for direct alignments between a probe sequence and an mRNA sequence is equivalent to searching for complementary alignments between the probe and the cRNA target. The alignment scoring scheme used in BLASTN is based on a 4 × 4 substitution matrix, which corresponds to a value for each possible pair of bases. The total score of an alignment is equal to the sum of the substitution matrix elements for each aligned base pair, minus a penalty for any introduced gaps.
Although BLASTN is frequently used to identify potential hybridization partners, the algorithm was not designed for this purpose. However, the computational efficiency of the BLASTN algorithm makes it an appealing choice for hybridization applications. We hypothesized that an empirically motivated modification of the BLASTN parameters, including the substitution matrix and gap penalties, could increase the accuracy with which BLASTN predicts hybridizing sequences. We used spike-in data sets to optimize the BLASTN parameters such that the resulting alignment score better correlates with observed changes in intensity. These improved parameters may enable the more accurate detection of potentially error-prone probes in independent data sets.
MATERIALS AND METHODS
Baseline double-stranded cDNA
Saccharomyces cerevisiae strain W303, MATα, with the temperature-sensitive cdc15–2 mutation, was grown at 23°C in minimal media in a fermentor for 340 min after release from restrictive temperature, as described (16). Total RNA was isolated using the FastRNA Pro Red Kit (Qbiogene). Double-stranded cDNA was synthesized using the MessageAmp II-biotin Enhanced Kit (Ambion), following the manufacturer’s protocol for first- and second-strand synthesis.
Spike double-stranded cDNA
Genomic DNA from Schizosaccharomyces pombe was purified, and a 1 kb section of the gene SPAC27D7.09c was PCR amplified using forward primer CTATGTAGGAGACTCTGGCG and reverse primer TTAAACTCGTAAAGTTAATCCCT. The PCR product was purified using QIAquick PCR Purification Kit (Qiagen) and then subjected to a second PCR amplification using the previous forward primer with a reverse primer incorporating a T7 promoter and oligo(dT): GGCCAGTGAATTGTAATACGACTCACTATAGGGAGGCGGTTTTTT TTTTTTTTTTTTTTTTTTTTAAACTCGTAAAGTTAATCCCT. This PCR product was agarose gel purified.
Labeled target and microarrays
Concentration of baseline and spike double-stranded cDNA was determined by UV absorbance (Nanodrop). Labeled target was generated by in vitro transcription of the cDNA mixture in the presence of biotin-11-UTP, using the MessageAmp II-biotin Enhanced Kit, following the manufacturer’s protocol. Labeled target was fragmented and hybridized to Yeast 2.0 microarrays (Affymetrix) according to the manufacturer’s protocol. Arrays were scanned on a GeneChip Scanner 3000 (Affymetrix). Microarray CEL files and spike sequence are available from GEO, accession number GSE16980.
Analysis
All analysis was performed with the R-statistical environment with use of Bioconductor add-on packages (17). BLASTN searches were perfomed with WU-BLAST 2.0 (Gish,W., personal communication), which has recently become unavailable and has been replaced with a commercial version (AB-BLAST, Advanced Biocomputing LLC). The NCBI implementation of BLASTN does not currently support custom nucleotide substitution matrices. The word size was set to 6 and the score threshold was set to 5, so that the majority of probes generated at least one hit to the spike. For each probe, only the top-scoring hit to the spike was considered. Microarray probe set annotations were obtained from the manufacturer's; web site and were dated 16 March 2009.
RESULTS
A high-concentration spike-in experiment
To evaluate the generalizability of our results derived from the hemoglobin data set, we set out to generate a second, independent spike-in data set (hereafter, the yeast data set). We chose the Yeast 2.0 microarray platform (Affymetrix), which comprises two independent sets of probe sets, one designed to detect transcripts from S. cerevisiae and the other designed for S. pombe. For the baseline, we used RNA from S. cerevisiae grown in minimal media. For the spike, we used a 1 kb section of the S. pombe gene SPAC27D7.09c, which is detected by two probe sets. Thus, the spiked gene is known a priori to be absent from the baseline, and yet two probe sets designed to detect the spike are available as a positive control. The differences between the hemoglobin and the yeast data set are summarized in Table 1.
Table 1.
Comparison of the two spike-in data sets used in this study
| Data set |
||
|---|---|---|
| Hemoglobin | Yeast | |
| Reference | (4) | This study |
| Microarray platform | HG-U133A 2.0 | Yeast 2.0 |
| Baseline | Human T lymphocyte cell line (Jurkat) | S. cerevisiae |
| Spike | Human HBA1, HBA2, HBB (exact sequence unknown) | S. pombe SPAC27D7.10c (1 kb section) |
| Spike amount | None/high (exact amount unknown) | 0%/1%/10% (as a fraction of total cDNA mass) |
| Spike stage | Total RNA | Double-stranded cDNA |
| Number of arrays per spike amount | 3 | 1 |
Only factors that distinguish between the two data sets are listed.
Hypothetically, the spikes could be added to the baseline at any of several stages in the microarray process. In the hemoglobin experiment, the spikes were mixed with the starting RNA. However, the starting RNA is a mix of polyadenylated transcripts, which contribute to the labeled target, and non-polyadenylated RNA species such as ribosomal RNA, which do not contribute to the labeled target. Therefore, by this approach it is difficult to control or measure the abundance of the spike transcripts relative to other polyadenylated transcripts, and thus the relative abundance of the spike in the labeled target.
Instead, we added the spikes at the double-stranded cDNA step (Figure 2). The baseline S. cerevisiae RNA was reverse transcribed, and the second strand was synthesized, following standard protocols. The spike sequence was amplified from S. pombe DNA, and a T7-oligo(dT) promoter was added. The baseline and spike were mixed such that the spike comprised 0, 1, or 10% of the total cDNA mass. This mixture was then in vitro transcribed to create labeled target by standard methods. By this approach, the mixing proportion should correspond to the relative target abundance during array hybridization.
Figure 2.

Schematic of the experimental spike-in procedure. (a) Baseline double-stranded (ds) cDNA was synthesized from S. cerevisiae using standard protocols. (b) Spike ds cDNA was synthesized by PCR amplification of an arbitrarily chosen S. pombe gene extended with an oligo(dT)-T7 promoter. (c) Spike ds cDNA and baseline ds cDNA were mixed such that the spike contributed 0, 1, or 10% of the cDNA (by mass), and the resulting mixture was in vitro transcribed to produce labeled target, which was then quantified by microarray following standard protocols.
Qualitative evaluation of spike effects
With Affymetrix microarrays, the expression value of each probe set is summarized from the intensities of multiple probes. Therefore, we expected the effect of a single cross-hybridizing probe on the expression value to be relatively minor. To test this, we calculated expression values using RMA (18) and compared all 10 928 probe sets between 1 and 10% spike arrays and the baseline array (Figure 3). We considered an expression value changed if it increased or decreased by at least a factor of two. With 1% spike, seven probe set expression values increased and none decreased. With 10% spike, 12 probe set expression values (including all seven from the 1% spike) increased and two decreased. The two probe sets with the most increased expression value were both annotated as measuring the spiked gene and were thus true positives.
Figure 3.

The expression values of most genes are essentially unaffected by the high concentration spike. Expression values were calculated with the RMA algorithm. Two probe sets designed to detect the spike-in gene are indicated by green triangles. For the remainder of the probe sets, two-dimensional histograms indicate the joint distribution of expression values. Baseline alone is compared with (a) baseline +1% spike or (b) baseline + 10% spike.
On the other hand, individual probe intensities indicate a direct physical interaction of specific probe sequences with one or more labeled targets. We analyzed the raw intensities of all 120 855 perfect match probes and found that the 1% spike was sufficient to cause changes in intensity in many probes, and that the 10% spike caused substantially more changes (Figure 4). The intensity changes caused by the 10% spike were qualitatively more similar to the changes observed in the hemoglobin experiment. In the remainder of our analysis, we used the baseline and the baseline + 10% spike data, because this yielded a larger number of informative data points than did the baseline + 1% spike data.
Figure 4.

Individual probe intensities can be strongly increased or decreased by a high concentration spike. Two-dimensional histograms indicate the joint distribution of probe intensities. Baseline alone is compared with (a) baseline + 1% spike or (b) baseline + 10% spike. Further analysis utilized only the 10% spike.
Probe/spike sequence similarity predicts cross- and bulk-hybridization
The increases in intensity caused by addition of spikes is likely caused by cross-hybridization between probes and the spike target. We previously demonstrated with the hemoglobin data set that change in probe intensity is moderately correlated with the top alignment score found by BLASTN between the probe sequence and the spike sequence (4). We confirmed this correlation in the yeast data set (Figure 5a). In both data sets, the trend in the relationship is visually clear, but is not strongly correlated. There are several probes with a moderately high alignment score but no change in intensity, and several probes that change intensity in spite of a relatively low score.
Figure 5.

Changes in probe intensity are correlated with the sequence alignment score between probe and spike. The maximum alignment score between each probe and the spike was calculated using BLASTN, using a word size of 6 and score threshold of 5 to increase sensitivity. Probe intensites of the baseline and baseline + 10% spike samples were grouped into two-dimensional histogram bins as in Figure 4b. However, instead of indicating the number of probes in each bin (square), the color indicates the median alignment score of all probes in the bin. (a) Probes with a high-scoring antisense alignment tend to increase in intensity, likely because of cross-hybridization. (b) Probes with a high-scoring sense alignment tend to decrease in intensity, likely because of bulk-hybridization.
We hypothesized that a decrease in probe intensity upon addition of spike can be caused by bulk-hybridization between the spike and the intended target of the probe. To test this, we computed BLASTN alignment scores between the probe sequences and the reverse complement of the spike sequence. Thus, these alignment scores are an estimate of the hybridization affinity between the spike target and the target of the probe, if we make the reasonable assumption that the target of the probe is perfectly complementary to the probe itself. As expected, in both data sets we observed a moderate correlation between opposite-strand alignment score and a decrease in intensity (Figure 5b, and data not shown for the hemoglobin data set).
Optimization of the BLASTN substitution matrix
Our goal was to improve the accuracy with which BLASTN identifies probes that are susceptible to cross- or bulk-hybridization with a given target sequence. However, cross-hybridization occurs between DNA and biotin-labeled RNA, whereas bulk-hybridization occurs between two strands of biotin-labeled RNA. Thus, we did not assume that a single set of BLASTN parameters would be adequate for both cases. For both cross- and bulk-hybridization individually, we attempted to find the substitution matrix and gap penalties that generate alignment scores that best identify probes that change in intensity by at least a factor of two.
Our first concern was how to identify probes that had changed intensity in response to the addition of the spike. For each of the two spike-in experiments, we selected as negative controls the probes that had no hits to the spike sequences with a score >35 on either strand. A priori, we expected that these probes should, on average, be relatively unaffected by the addition of spikes. Indeed, these probes were relatively unchanged compared to the non-selected probes. However, we observed an intensity-dependent trend in the average log-ratio of these probes (Figure 6). This appears to be a normalization issue, resulting from the unbalanced nature of the experiment; when the spike is added, the relative concentration of all other targets is decreased. Therefore, we compensated for this effect by fitting a cubic smoothing spline to the log-ratio versus intensity distribution. We considered a probe to be changed in response to the spike if its intensity changed by more than two-fold beyond the spline fit (Figure 6). In this way, we focused on probe intensity changes relative to negative control probes that are unlikely to be affected by the spike. By this criteria, the yeast spike tended to effect decreases in intensity, with 1080 (0.9%) probes increased and 2078 (1.7%) decreased. On the other hand, the hemoglobin spike primarily effected increases in intensity, with 28 052 (11%) probes increased, and 6163 (2.5%) decreased.
Figure 6.

Normalization using probes least likely to be affected by the spike. The subset of probes with low BLASTN alignment scores (<35) to either strand of the spike sequence(s) are less likely to be directly affected by non-specific hybridization. Two-dimensional histograms of the individual probe intensities in the (a) yeast and (b) hemoglobin data sets demonstrate an intensity-dependent deviation from the diagonal line. To correct for this, the log ratios were fit to a spline (green line), and further analysis focused on the probes with a 2-fold change beyond the spline (blue lines).
Next, we aimed to select subsets of probes that are most sensitive to increases or decreases in intensity. As expected, we observed that probes with a lower baseline intensity were most sensitive to increases in intensity (Figure 7). However, we also observed that probes with a baseline intensity in the lowest part of the distribution were less likely to increase in response to the spike, possibly indicating that many of these probes form a stable secondary structure or are otherwise non-functional. Thus, to study cross-hybridization, we selected the subset of probes with a baseline intensity between 27 and 29. Similarly, we found that probes most sensitive to decreases in intensity were those with high baseline intensity (Figure 7). However, those probes with the highest baseline intensity rarely decreased in intensity, possibly because these probes are already near chemical saturation, and thus a decrease in the target concentration does not have an appreciable affect on the observed intensity. To study bulk-hybridization, we selected the probes with a baseline intensity between 29 and 213.
Figure 7.

Identification of the intensity ranges at which probes are most sensitive to changes in intensity caused by spikes. The percentage of probes with an increase or decrease in intensity is shown as a function of baseline intensity, for the (a) yeast and (b) hemoglobin data sets. For optimization of BLASTN parameters, we selected probes with a baseline intensity between 27 and 29 for cross-hybridization, and between 29 and 213 for bulk-hybridization.
As a second probe selection criteria, we eliminated probes with a relatively high chance of being affected by the type of hybridization not under consideration. Thus, to study cross-hybridization, we eliminated probes with an (unoptimized) BLASTN alignment score above 40 to the spike sequence. To study bulk-hybridization, we eliminated probes with an (unoptimized) BLASTN alignment score above 40 to the reverse complement of the spike sequence.
To perform parameter optimization, we used a gradient descent approach on 18 integer-valued parameters: 16 substitution matrix elements and two gap penalties. We started the optimization from the WU-BLAST default parameters (Table 2, panel a). At each iteration, we considered both increasing and decreasing each of the 18 parameters individually. Thus, BLASTN searches were run for each of the 36 new parameters sets, and the resulting alignment scores were compared to the observed changes in intensity. The single parameter change that most improved the accuracy, as measured by the area under the ROC curve (AUC) for predicting 2-fold change in intensity, was retained for the next iteration. Iterations continued until no parameters could be adjusted to improve the AUC. At both the starting parameter set and final parameter set, the AUC as a function of each single parameter was essentially convex (data not shown), suggesting that the gradient descent approach is reasonable.
Table 2.
BLASTN parameters considered in this study include the nucleotide substitution matrix and penalties for gap creation and extension
| A | C | G | T | |
|---|---|---|---|---|
| (a) Starting (default) parameters | ||||
| A | 5 | −4 | −4 | −4 |
| C | −4 | 5 | −4 | −4 |
| G | −4 | −4 | 5 | −4 |
| T | −4 | −4 | −4 | 5 |
| Gap creation (Q) | 10 | |||
| Gap extension (R) | 10 | |||
| (b) Consensus optimized parametersa | ||||
| A | 2* | −4 | −4 | −4 |
| C | −4 | 5 | −4 | −4 |
| G | −4 | −4 | 5 | −4 |
| T | −4 | −4 | −4 | 2* |
| Gap creation (Q) | 10 | |||
| Gap extension (R) | 10 | |||
aConsensus parameters optimized for detection of non-specific hybridization.
Asterisks indicate changed parameters.
Using this optimization method, we performed four independent optimizations: for cross- and bulk-hybridization in the yeast data set, and for cross- and bulk-hybridization in the hemoglobin data set. In each case, we used the data set that was not used in the optimization to independently evaluate the performance of the optimized parameters. In all cases, we observed substantial increases in accuracy of the training data in the first few iterations, followed by smaller increases in accuracy (Figure 8). When optimizing for cross-hybridization, the cross-validation accuracy also increased for the first 7–8 iterations, but then decreased or remained approximately constant, suggesting that optimizing beyond the first 7–8 iterations was overfitting to the training data (Figure 8a and b). When optimizing for bulk-hybridization, we observed strong increases in cross-validation accuracy in the first 4–5 iterations, after which the accuracy remained relatively constant (Figure 8c and d).
Figure 8.

Optimization of BLASTN parameters for accuracy of predicting 2-fold changes in intensity. The parameters consist of 16 substitution matrix values and two gap penalties and are constained to integer values. To start, the parameters were set to the default values (Table 2, panel a). At each iteration, we considered all 36 possible incremental adjustments to the parameters and retained the single change that most improved the prediction accuracy in the training data set. We performed four independent optimizations: using the yeast or the hemoglobin data sets, and optimizing for cross-hybridization (increase in intensity) or bulk-hybridization (decrease in intensity). In each case, the data set that was not used for optimization serves as an entirely independent assessment of the parameters. Parameters for cross-hybridization were optimized using (a) the yeast data set or (b) the hemoglobin data set. Parameters for bulk-hybridization were optimized using (c) the yeast data set, or (d) the hemoglobin data set.
We observed that the initial, most effective parameter changes in each of the four optimizations were very similar: the substitution matrix values for A–A and T–T subsitutions were decreased (data not shown). These matrix values correspond to AT base pairs, so it is not surprising that these contribute less to hybridization affinity than do GC base pairs. Although further iterations of the optimization step yielded improved prediction in any individual training data set, we selected a single set of ‘consensus’ parameters derived from the four optimization runs (Table 2, panel b). These consensus parameters improve identification of probes susceptible to both cross- and bulk-hybridization in both data sets (Figure 9).
Figure 9.

A single consensus optimized substitution matrix yields improved accuracy in predicting probes susceptible to cross- or bulk-hybridization. ROC curves curves for (a) cross-hybridization and (b) bulk-hybridization, indicate the accuracy in identification of probes with a 2-fold change in intensity among the probes selected in Figure 7. def: default parameters; opt: consensus optimized parameters.
DISCUSSION
We have used two entirely independent spike-in data sets to derive a nucleotide substitution matrix that allows BLASTN to more accurately identify probes that are susceptible to cross- or bulk-hybridization with a given target sequence. In addition to its increased accuracy, this substitution matrix has several desirable features: first, the matrix is relatively similar to the original, default matrix; only two parameters are different. Second, the substitution matrix is symmetric; if this had not been the case, it would be necessary to transpose the matrix when reversing the direction of the BLASTN search. Third, these parameters make intuitive sense; A–T base pairs are generally less energetically favorable than G–C base pairs.
It is somewhat tempting to attempt further optimization of the substitution matrix, and to use separate substitution matrices for prediction of cross- and bulk-hybridization. In fact, it is likely that the true sequence-dependent specificity of cross-hybridization is at least slightly different from that of bulk-hybridization, because bulk-hybridization occurs between two RNA strands, whereas cross-hybridization occurs between a DNA and an RNA strand. However, we believe that the relatively small gain in performance from additional optimization steps is not sufficient to justify the increased complexity of two separate matrices.
Although the optimized substitution matrix is more accurate than the default matrix, an alignment score provides only a rough estimate of relative hybridization affinity. For a more accurate estimation of binding energy between oligonucleotides, it is necessary to consider base stacking energy, positional effects, sequence complexity and other features that cannot be captured in the simple nucleotide substitution matrix used in BLASTN (19). Furthermore, although we have considered only the top-scoring hit, multiple high-scoring hits may each contribute to the observed intensity. We and others have speculated that a crude nearest neighbor model could be implemented with the BLASTN algorithm by using dinucleotides as the atomic elements. Additionally, others have developed efficient algorithms to search for hybridization partners that are not based on BLASTN (20,21). The data from our experiments, which we have made publicly available, may aid in the development of such algorithms.
As a preliminary step in our study, we evaluated the effect of a high-concentration spike on gene expression measurements. We observed many individual probes with substantial changes in intensity, both upwards and downwards, in response to the spike. With this result alone, it would be tempting to speculate that the observed intensity changes could be due to random noise or to experimental error. However, the association between intensity change and BLASTN alignment score suggests a sequence-dependent relationship that is consistent with cross- and bulk-hybridization. Furthermore, our observation of very similar results in two independent data sets suggests that this is not a chance occurrence. Notably, cross- and bulk-hybridization affect a comparable fraction of probes, suggesting that it is important to consider both effects when designing microarray probes.
As we reported previously in the hemoglobin study, the number of changes in probeset-level expression values was relatively small, in spite of the large degree of cross- and bulk-hybridization affecting individual probes. It is reassuring that the addition of a spike at 10% of the total target, which we suspect is above the level that is likely to be encountered in most microarray experiments, produces only a few false changes in expression level. However, experiments using blood may encounter substantial changes in transcript abundance, and other researchers have found that removal of highly abundant hemoglobin transcripts can improve data quality (22). Additionally, even if non-specific hybridization has only small effects on individual expression values, its coordinated effect on two or more susceptible genes can substantially increase their apparent correlation (2,5,6).
Our experiments were limited to Affymetrix 3′ expression arrays because of our familiarity with the platform, and because the large number of probes per gene provide ample data for our primary goal of optimizing BLASTN parameters. In general, our observations of the extent of cross- and bulk-hybridization may not apply to other microarray platforms or methods. For example, we previously found that the target generation method has a substantial effect on specificity (4). In general, cross-hybridization has not been a major consideration in comparisons between microarray platforms, even when spike-in experiments were available (23). Our approach using high-concentration spikes could be applied to compare the relative specificity of various microarray platforms or methods.
In our analysis we treat bulk-hybridization as the mirror image of cross-hybridization: it is predicted by similarity to the opposite strand, and it causes decreases rather than increases in intensity. However, the reality is likely to be much more complicated, because the effect size of bulk-hybridization depends on the concentration of two RNA species in a non-trivial manner. Furthermore, bulk-hybridization may involve more than two RNA species. In our simple model presented in Figure 1, the relevant target sequence is limited to the section directly complementary to the probe. However, any flanking sequence on the target RNA may also affect its binding to the spike sequence. It is probably possible to reduce the relative level of bulk-hybridization by decreasing the target concentration during array hybridization, but whether this benefit would outweigh the resulting loss of signal is unknown.
We should note that we have used S. cerevisiae strain W303 as our baseline sample, whereas the microarray probes were designed to query S. cerevisiae strain S288C. The nucleotide divergence between S288C and W303 has been estimated at 0.08% (24); thus we expect ∼1 in 50 probes to contain a single-base mismatch against its intended target. This seems unlikely to have a noticeable effect on the cross-hybridization analysis, which is independent of the baseline target sequence. However, our analysis of bulk-hybridization was performed with the implicit assumption that the target sequence is the exact reverse complement of the probe sequence. We expect sequence discrepancies to introduce small random errors in the alignment scores. Given the large number of probes analyzed, these errors are very unlikely to affect our results.
Efficient prediction of nucleotide hybridization has several potential applications beyond probe selection for microarrays. Sequence-specific hybridization is a cornerstone of several molecular biology techniques, such as PCR, Southern and northern blots, and fluorescent in situ hybridization. Thus, the optimized BLASTN substitution matrix presented in this work may also be useful in the design of probes for these applications.
FUNDING
National Institutes of Health (1PO1CA-092644-01, R21LM008823-01A1, 5R03LM009979); the Breast Cancer Research Foundation (to Z.S.). Funding for open access charge: Departmental grant.
Conflict of interest statement. None declared.
ACKNOWLEDGMENTS
The authors thank Andrea Vala for critical reading of the manuscript.
REFERENCES
- 1.Halperin A, Buhot A, Zhulina EB. Sensitivity, specificity, and the hybridization isotherms of DNA chips. Biophys. J. 2004;86:718–730. doi: 10.1016/S0006-3495(04)74150-8. [DOI] [PMC free article] [PubMed] [Google Scholar]
- 2.Casneuf T, Van de Peer Y, Huber W. In situ analysis of cross-hybridisation on microarrays and the inference of expression correlation. BMC Bioinformatics. 2007;8:461. doi: 10.1186/1471-2105-8-461. [DOI] [PMC free article] [PubMed] [Google Scholar]
- 3.Draghici S, Khatri P, Eklund AC, Szallasi Z. Reliability and reproducibility issues in DNA microarray measurements. Trends Genet. 2006;22:101–109. doi: 10.1016/j.tig.2005.12.005. [DOI] [PMC free article] [PubMed] [Google Scholar]
- 4.Eklund AC, Turner LR, Chen P, Jensen RV, deFeo G, Kopf-Sill AR, Szallasi Z. Replacing cRNA targets with cDNA reduces microarray cross-hybridization. Nat. Biotechnol. 2006;24:1071–1073. doi: 10.1038/nbt0906-1071. [DOI] [PubMed] [Google Scholar]
- 5.Okoniewski MJ, Miller CJ. Hybridization interactions between probesets in short oligo microarrays lead to spurious correlations. BMC Bioinformatics. 2006;7:276. doi: 10.1186/1471-2105-7-276. [DOI] [PMC free article] [PubMed] [Google Scholar]
- 6.Zhang J, Finney RP, Clifford RJ, Derr LK, Buetow KH. Detecting false expression signals in high-density oligonucleotide arrays by an in silico approach. Genomics. 2005;85:297–308. doi: 10.1016/j.ygeno.2004.11.004. [DOI] [PubMed] [Google Scholar]
- 7.Wernersson R, Juncker AS, Nielsen HB. Probe selection for DNA microarrays using OligoWiz. Nat. Protoc. 2007;2:2677–2691. doi: 10.1038/nprot.2007.370. [DOI] [PubMed] [Google Scholar]
- 8.Bernhart SH, Tafer H, Muckstein U, Flamm C, Stadler PF, Hofacker IL. Partition function and base pairing probabilities of RNA heterodimers. Algorithms Mol. Biol. 2006;1:3. doi: 10.1186/1748-7188-1-3. [DOI] [PMC free article] [PubMed] [Google Scholar]
- 9.Zuker M. Mfold web server for nucleic acid folding and hybridization prediction. Nucleic Acids Res. 2003;31:3406–3415. doi: 10.1093/nar/gkg595. [DOI] [PMC free article] [PubMed] [Google Scholar]
- 10.Altschul SF, Gish W, Miller W, Myers EW, Lipman DJ. Basic local alignment search tool. J. Mol. Biol. 1990;215:403–410. doi: 10.1016/S0022-2836(05)80360-2. [DOI] [PubMed] [Google Scholar]
- 11.Rouillard JM, Zuker M, Gulari E. OligoArray 2.0: design of oligonucleotide probes for DNA microarrays using a thermodynamic approach. Nucleic Acids Res. 2003;31:3057–3062. doi: 10.1093/nar/gkg426. [DOI] [PMC free article] [PubMed] [Google Scholar]
- 12.Mei R, Hubbell E, Bekiranov S, Mittmann M, Christians FC, Shen MM, Lu G, Fang J, Liu WM, Ryder T, et al. Probe selection for high-density oligonucleotide arrays. Proc. Natl Acad. Sci. USA. 2003;100:11237–11242. doi: 10.1073/pnas.1534744100. [DOI] [PMC free article] [PubMed] [Google Scholar]
- 13.Leparc GG, Tuchler T, Striedner G, Bayer K, Sykacek P, Hofacker IL, Kreil DP. Model-based probe set optimization for high-performance microarrays. Nucleic Acids Res. 2009;37:e18. doi: 10.1093/nar/gkn1001. [DOI] [PMC free article] [PubMed] [Google Scholar]
- 14.Wu C, Carta R, Zhang L. Sequence dependence of cross-hybridization on short oligo microarrays. Nucleic Acids Res. 2005;33:e84. doi: 10.1093/nar/gni082. [DOI] [PMC free article] [PubMed] [Google Scholar]
- 15.Van Gelder RN, von Zastrow ME, Yool A, Dement WC, Barchas JD, Eberwine JH. Amplified RNA synthesized from limited quantities of heterogeneous cDNA. Proc. Natl Acad. Sci. USA. 1990;87:1663–1667. doi: 10.1073/pnas.87.5.1663. [DOI] [PMC free article] [PubMed] [Google Scholar]
- 16.de Lichtenberg U, Wernersson R, Jensen TS, Nielsen HB, Fausboll A, Schmidt P, Hansen FB, Knudsen S, Brunak S. New weakly expressed cell cycle-regulated genes in yeast. Yeast. 2005;22:1191–1201. doi: 10.1002/yea.1302. [DOI] [PubMed] [Google Scholar]
- 17.Gentleman RC, Carey VJ, Bates DM, Bolstad B, Dettling M, Dudoit S, Ellis B, Gautier L, Ge Y, Gentry J, et al. Bioconductor: open software development for computational biology and bioinformatics. Genome Biol. 2004;5:R80. doi: 10.1186/gb-2004-5-10-r80. [DOI] [PMC free article] [PubMed] [Google Scholar]
- 18.Irizarry RA, Hobbs B, Collin F, Beazer-Barclay YD, Antonellis KJ, Scherf U, Speed TP. Exploration, normalization, and summaries of high density oligonucleotide array probe level data. Biostatistics. 2003;4:249–264. doi: 10.1093/biostatistics/4.2.249. [DOI] [PubMed] [Google Scholar]
- 19.SantaLucia J, Jr, Hicks D. The thermodynamics of DNA structural motifs. Annu. Rev. Biophys. Biomol. Struct. 2004;33:415–440. doi: 10.1146/annurev.biophys.32.110601.141800. [DOI] [PubMed] [Google Scholar]
- 20.Mann TP, Noble WS. Efficient identification of DNA hybridization partners in a sequence database. Bioinformatics. 2006;22:e350–e358. doi: 10.1093/bioinformatics/btl240. [DOI] [PubMed] [Google Scholar]
- 21.Nordberg EK. YODA: selecting signature oligonucleotides. Bioinformatics. 2005;21:1365–1370. doi: 10.1093/bioinformatics/bti182. [DOI] [PubMed] [Google Scholar]
- 22.Tian Z, Palmer N, Schmid P, Yao H, Galdzicki M, Berger B, Wu E, Kohane IS. A practical platform for blood biomarker study by using global gene expression profiling of peripheral whole blood. PLoS ONE. 2009;4:e5157. doi: 10.1371/journal.pone.0005157. [DOI] [PMC free article] [PubMed] [Google Scholar]
- 23.Tong W, Lucas AB, Shippy R, Fan X, Fang H, Hong H, Orr MS, Chu TM, Guo X, Collins PJ, et al. Evaluation of external RNA controls for the assessment of microarray performance. Nat. Biotechnol. 2006;24:1132–1139. doi: 10.1038/nbt1237. [DOI] [PubMed] [Google Scholar]
- 24.Schacherer J, Ruderfer DM, Gresham D, Dolinski K, Botstein D, Kruglyak L. Genome-wide analysis of nucleotide-level variation in commonly used Saccharomyces cerevisiae strains. PLoS ONE. 2007;2:e322. doi: 10.1371/journal.pone.0000322. [DOI] [PMC free article] [PubMed] [Google Scholar]