

Abstract
Animals learn which foods to ingest and which to avoid. Despite many studies, the electrophysiological correlates underlying this behavior at the gustatory–reward circuit level remain poorly understood. For this reason, we measured the simultaneous electrical activity of neuronal ensembles in the orbitofrontal cortex, insular cortex, amygdala, and nucleus accumbens while rats licked for taste cues and learned to perform a taste discrimination go/no-go task. This study revealed that rhythmic licking entrains the activity in all these brain regions, suggesting that the animal's licking acts as an “internal clock signal” against which single spikes can be synchronized. That is, as animals learned a go/no-go task, there were increases in the number of licking coherent neurons as well as synchronous spiking between neuron pairs from different brain regions. Moreover, a subpopulation of gustatory cue-selective neurons that fired in synchrony with licking exhibited a greater ability to discriminate among tastants than nonsynchronized neurons. This effect was seen in all four recorded areas and increased markedly after learning, particularly after the cue was delivered and before the animals made a movement to obtain an appetitive or aversive tastant. Overall, these results show that, throughout a large segment of the taste–reward circuit, appetitive and aversive associative learning improves spike-timing precision, suggesting that proficiency in solving a taste discrimination go/no-go task requires licking-induced neural ensemble synchronous activity.
Introduction
Animals learn to use multisensory cues to procure appetitive and avoid aversive food sources. During feeding, the animal's behavior is reinforced by a rewarding (acceptance) or aversive (rejection) stimulus. Both appetitive and aversive learning depend on interactions between components of a taste–reward circuit that includes the orbitofrontal cortex (OFC), the amygdala (AMY) (Paton et al., 2006), the nucleus accumbens (NAcc), and the insular cortex (IC) (Gottfried et al., 2003; Stalnaker et al., 2007). To date, however, relatively little is known about how this circuit as a whole mediates an animal's ability to learn to select appropriate foods.
The taste–reward circuit is composed of a highly interconnected neural network (Cavada et al., 2000) that is involved with multiple aspects of ingestive behavior, associative learning, and reward expectation (de Araujo et al., 2006; Rolls, 2007). The IC, which contains the primary gustatory cortex, is a multimodal area that processes taste, visceral, somatosensory, and hedonic information (Katz et al., 2001; Accolla and Carleton, 2008). The OFC integrates information from several primary sensory systems (Cavada et al., 2000) and assays the relative reward value of sensory stimuli, including those associated with foods (Tremblay and Schultz, 1999; Rolls, 2007). Dysgranular OFC also encodes the economic value of foods (Padoa-Schioppa and Assad, 2006). Rodent OFC and AMY neurons fire selectively to sensory cues according to their predictive value of a reward (Schoenbaum et al., 1998). The NAcc is thought to translate emotional–motivational information, generated by limbic regions, into movements and actions to obtain food and to avoid punishment (Mogenson et al., 1980). Neurons from the IC, OFC, and AMY project to NAcc, defining a circuit that processes information about gustatory cues, their predictive reward value, and motivational significance (Peciña and Berridge, 2005).
Rodents actively sample sensory stimuli using rhythmic and stereotypic behaviors such as sniffing (Kepecs et al., 2006), whisking (Fanselow and Nicolelis, 1999), and licking (Travers et al., 1997), at approximately similar frequencies (theta band, 4–12 Hz). It has been suggested that sniffing and whisking allow animals to process continuous real-world sensory stimuli into discrete chunks or cycles (Kleinfeld et al., 2006), with each cycle serving as a temporal frame to synchronize neural activity across multiple brain structures (Nicolelis et al., 1995). In contrast to other sensory systems, there is a paucity of information regarding the potential physiological role of neuronal oscillations in taste-guided behaviors. Thus, it remains unknown whether rhythmic licking may function as an internal temporal frame to synchronize the firing of populations of neurons throughout the taste–reward circuit. Equally untouched is the question of whether neuronal synchronous firing would enhance the ability of the taste–reward circuitry to discriminate among cues. Here, we addressed these two fundamental questions by simultaneously recording the activity of neural ensembles located in the IC, OFC, AMY, and NAcc, while rats learned to perform a new version of a taste discrimination go/no-go response task. Briefly, we found that, throughout the taste–reward circuit, learning improves spike-timing precision, suggesting that widespread licking-induced neuronal synchronicity is important in the solution of taste-guided discrimination tasks.
Materials and Methods
Animals
Seven male Long–Evans rats (350–450 g) were obtained from Harlan (Harlan Laboratories). Surgical procedures followed the methods described previously (de Araujo et al., 2006). A movable microwire array comprised of 16 Formvar-coated tungsten wires (35 μm diameter) was unilaterally implanted in each of the four brain regions, OFC, NAcc, IC, and AMY. The locations of microelectrode implants are found in supplemental Figure S1 (available at www.jneurosci.org as supplemental material). One of the seven subjects received bilateral implants only in OFC and IC. In all experiments, one electrode was used as reference for FEC software (Plexon). The electrode arrays were advanced ∼40 μm such that for each experimental session a new set of single units was recorded. All protocols were approved by the Duke University Institutional Animal Care and Use Committee.
Recording technique
Procedures were essentially the same as described previously (de Araujo et al., 2006). That is, neural electrical activity from the four implanted brain areas was simultaneously recorded using a Multichannel Acquisition Processor (Plexon). Spikes were sorted using Off-line Sorter software and the stability of waveform shape across a session was confirmed by using the Waveform Tracker software (Plexon). Additional details are found in supplemental Figure S2 (available at www.jneurosci.org as supplemental material).
Behavioral task
All experiments were performed in an operant box that contained two widely spaced (∼17 cm) drinking compartments. Each compartment contained a photobeam lickometer (MED Associates) that was used to register each lick. The sipper tube was composed of a bundle of 12 20-gauge stainless-steel tubes cemented together in a larger steel tube (inner diameter, 7.5 mm), connected to solenoid valves (Stapleton et al., 2006). Each solution was maintained under air pressure to ensure a single delivery of a ∼20 μl drop of liquid (in 10 ms). Access to each compartment was restricted with a sliding door operated with a hydraulic pump. The behavioral task and details about the quantification of learning are shown in Figure 1. Briefly, before surgery, all rats were trained on the taste discrimination task. A trial began when the door opened allowing access to the cue compartment. Rats were then allowed to lick the tube and received a drop of water at the fourth lick. Rats were required to continue licking the dry sipper five additional times and on the sixth lick, they received a cue consisting of a drop of either 0.1 m NaCl or 0.1 m monopotassium l-glutamate (MPG). These two tastants were chosen because rodents can distinguish between them independently of sodium content (Maruyama et al., 2006). In the first session, one of these tastants was randomly chosen as either the positive (C+) or negative (C−) cue. After cue delivery, access to the outcome compartment was allowed, and, although no more licks were required, rats continued licking, on average, 1.2 s before moving to the outcome port. Rats had 10 s after cue delivery to move from the cue compartment to the outcome compartment, where after three empty licks they could receive the signaled outcome. If after 10 s no response was observed, both doors closed, thereby terminating the trial. In the outcome compartment, the positive cue (C+) was associated with three deliveries of 0.4 m sucrose and the negative cue (C−) signaled the availability of up to three deliveries of 1 mm QHCl (quinine hydrochloride).
Figure 1.
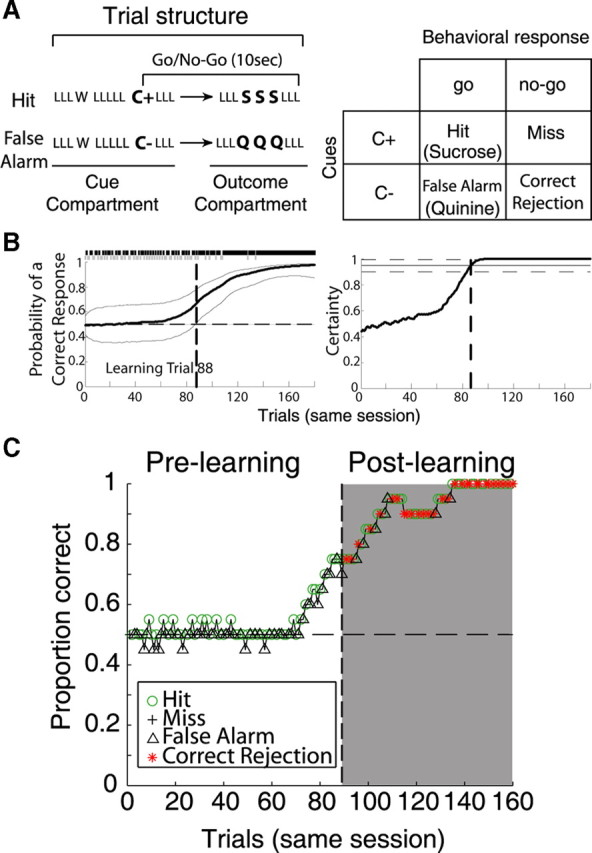
Taste discrimination and performance in a go/no-go response task. A, In each trial, after a door opens (data not shown), rats approached a sipper, and then licked (L) an empty sipper three times, whereon on the fourth lick they received water (W). They then licked the empty sipper another five times and on the 10th lick, they received a cue of either 0.1 m NaCl or 0.1 m MPG. In positive cue trials, C+, one of the arbitrary taste cues, signals the availability of reward [0.4 m sucrose (S), up to 3 drops, 1 per lick], whereas in negative cue trials, C−, the other taste cue signaled the availability of a bitter tastant [1 mm quinine HCl (Q)]. After cue delivery, subjects had 10 s to leave the cue compartment and move to the outcome compartment—located at the right side of the box—where after three additional empty licks, they received either sucrose or quinine. Right, Depending on the type of cue (C+ or C−) and behavioral response (go/no-go), trials were classified as hit, miss, false alarm, or correct rejection. For example, hit is when C+ was delivered and the subject made a go response, whereas a correct rejection occurred when C− was delivered and the subjects withheld a go response to avoid punishment. Note that positive trials (C+) are the combination of hits and misses, whereas negative trials (C−) are the combination of false alarms and correct rejections. B, left, shows a representative learning curve (bold black line, and confidence interval) from a single session that was analyzed using the state-space smoothing algorithm. The learning curve combines both cues in the order originally presented. The top bar shows the sequence of an incorrect (0) and correct (1) behavioral responses, in which a gray tick represents an incorrect response (false alarm and miss) and black mark a correct response (hit and correct rejection). From this binary vector, the trial that divides prelearning from postlearning trials (the learning trial) (dashed vertical line) was calculated as described in Materials and Methods. Note that the learning curve has a sigmoidal shape, suggesting that the learning process is gradual. Therefore, the learning trial does not mean that learning occurred in that trial; instead, it reflects the point at which the subject began performing above chance level. The right panel shows the extent of certainty of that of an ideal observer (that is, one that has knowledge of the performance in the entire session). In this model, the learning trial is located at the trial in which the ideal observer is 95% certain (horizontal solid lines) that the subject is performing above chance level and that correct performance will be maintained for the rest of the session. C, Same session displayed on B, but the learning curve was obtained by the more traditional moving window method (of 20 trial width). In the prelearning phase, the subject's performance was 50%, as during this phase no correct rejections were made (see red stars; *). The apparent increase in performance observed at trial 70 is a result of the 20 trial moving window. Note that this graph only shows 160 of 180 trials, because of smoothing with a 20 trial window width.
Supplemental Figure S6A (available at www.jneurosci.org as supplemental material) shows a schematic representation of the behavioral strategies used to solve the task. In our go/no-go task, water-deprived animals initially adopt a behavioral strategy that favors responding to both cues with a “go” response (“always go behavioral strategy”). Note that, at the beginning of the session, the predictive value of either of the cues is unknown to the rat, thus exploring the outcomes of both cues with a go response will provide them with the experience needed to learn which cue predicts a reward (sucrose) and which predicts punishment (quinine). After several trials in which learning had taken place, rats switched to a discriminative behavioral response pattern, in which they respond to C− cue by withholding a go response (correctly avoiding quinine), whereas rats maintained making a go response to C+ cue. Rats respond correctly for nearly 100% of the C+ trials throughout the entire session (supplemental Fig. S6B, available at www.jneurosci.org as supplemental material). Therefore, since both trials types are intermingled, it is not until the rat starts to avoid quinine that it is possible to know from a behavioral viewpoint that the rat has learned that the C+ predicts sucrose. Indeed, rats that do not learn aborted the task and kept drinking for the cues but stopped making a go response or simply stopped working. For this reason, we used both cues to obtain the “learning trial” (for definition, see below, Behavioral analysis of learning) (supplemental Fig. S6C,D, available at www.jneurosci.org as supplemental material).
This initial training was followed by serial reversal training in which the response contingencies of the tastants were reversed. Once the rats learned the new contingency (usually after one or two extra sessions covering 2 or more days), subsequent reversals were issued. Electrode implantation did not occur until at least three complete reversal cycles were learned. Therefore, animals were familiar with the taste discrimination task and with the tastants used as cues, but after each reversal they unlearned or suppressed previous cue–outcome contingencies so that their behavior could dynamically adapt to the new task rules.
During the recordings, the animal's behavioral performance was analyzed online. If the state space algorithm (described below) determined that the subject learned, the trials were subdivided into prelearning and postlearning phases. Furthermore, if in the postlearning phase a stable performance was observed (defined as correct performance >80% during at least 60–100 trials), then another within-session reversal was issued. This training protocol continued as long as quality recordings were obtained. In these later sessions, however, rats unlearned the original meaning of the cues but never, in the same session, exhibited a complete reversal. The results from the within-session reversal are not presented in this manuscript. However, we note that the changes in the postlearning epoch described in this manuscript were significantly reduced in a few trials after the within-session reversal (our unpublished results).
Since rats in these experiments were trained in a continuous serial-reversal task, we note that our operant definition of “prelearning” and “postlearning” phases refers specifically to the collection of trials before and after the learning trial (see definition below). Thus, this definition does not imply occurrence of learning of a “novel” cue–pair association.
Behavioral analysis of learning
We used a state-space algorithm (Smith et al., 2004) to determine within a single session the occurrence of a learning trial. Briefly, this algorithm modeled learning as a dynamic process from the time series of binary responses across trials, where “0” represents an incorrect response and “1” represents a correct response. Smith et al. (2004) demonstrated that this method estimates the learning curve and its confidence interval more accurately and earlier than several currently accepted methods (i.e., the moving average method). In the state-space algorithm, the learning trial is defined as the first trial in which, from the point of view of an ideal observer (that is, one that has knowledge of the performance throughout the entire session), there is a reasonable certainty (95% confidence) that the subject is performing above chance level and that correct performance will be maintained for the rest of the session (see Fig. 1B, right). In this model, the learning curve (confidence interval) and certainty were estimated using the expectation maximization algorithm (Smith et al., 2004). However, this algorithm does not treat learning as a gradual process but rather as a statistical event. In this regard, the learning trial does not mean that learning occurred on that particular trial, but rather it reflects the trial at which there is sufficient evidence that the subject began performing above chance level and from which its correct performance remained for the rest of the session.
The sequence of correct and incorrect behavioral responses was obtained following the standard nomenclature; a correct trial is composed of both “hit” and “correct rejection” trial types. (A hit is when C+ is delivered and the subject makes a go response and drinks at least one drop of sucrose. A correct rejection occurs when C− is delivered and the subject withholds a go response to avoid punishment, quinine HCl.) An incorrect trial comprises the pool of “false alarms” and “miss” trials types. A false alarm occurs when C− is followed by a go response, meaning the subject will drink at least one drop of quinine. A miss occurs when C+ is followed by a no-go response, and the subject will not receive the sucrose reward. By using these definitions, together with this algorithm, a quantitative estimate of the learning trial was obtained (see Fig. 1B,C). In this task, from the first lick in the cue compartment, the mean intertrial interval was 24.5 ± 1.2 s. On average, a single session lasts for 70.9 ± 5.4 min, and rats achieved the learning trial in 16.2 ± 1.3 min.
Data analyses
All data analysis was performed using MatLab and R. Unless otherwise indicated, we used the SEM.
Coherence.
Multitaper spectral analysis and coherence were computed by segmenting two univariate binned point processes (licking and spike PSTHs) into chunks (Jarvis and Mitra, 2001). The coherence (C) between licking and the spike trains was computed using the following formula: C(f) = Ixy/√(Ixx Iyy), where Ixx represents the spectrum of licking behavior, Iyy is the spectrum of neuronal activity, and Ixy is the cross-spectrum of licking and spike spectrum. Note that the coherence (C) is normalized to range between 0 and 1. Finally, f is the frequency where coherence was computed (4–10 Hz). This frequency band corresponds to that normally observed in freely licking behavior (Spector et al., 1998). The confidence interval of the coherence, C(f), and significance threshold (at α of 0.05%) were computed with a jackknife method and finite size corrections using the procedures developed by Jarvis and Mitra (2001). A neuron was classified as licking-coherent only if its lower confidence interval (95%) crossed the significance threshold. Supplemental Figure S3 (available at www.jneurosci.org as supplemental material) shows an example of coherence calculation in a single neuron. Each chunk of data corresponded to the first lick in the cue port up to 2.5 s of activity. This time essentially represents the entire period that rats licked the sipper tube in the cue compartment (see Fig. 2). The maximum coherence value and frequency were computed using the Chronux 1.50 software package (www.chronux.org). Multitaper coherence was also computed cycle-by-cycle in windows of 170 ms aligned to each lick in the cue compartment (see Fig. 4D,E; supplemental Fig. S4, available at www.jneurosci.org as supplemental material). This window is large enough to observe theta rhythm. Tapers 1 and 2 were used for this analysis, as were frequencies between 0 and 60 Hz (supplemental Fig. S4A, available at www.jneurosci.org as supplemental material). In Figure 9C, we determined whether after cue (AC) cue-selective cells were licking coherent; thus, we used a single window from 0.2 to 1 s after cue delivery. In the postlearning phase, both C+ and C− trials were combined.
Figure 2.
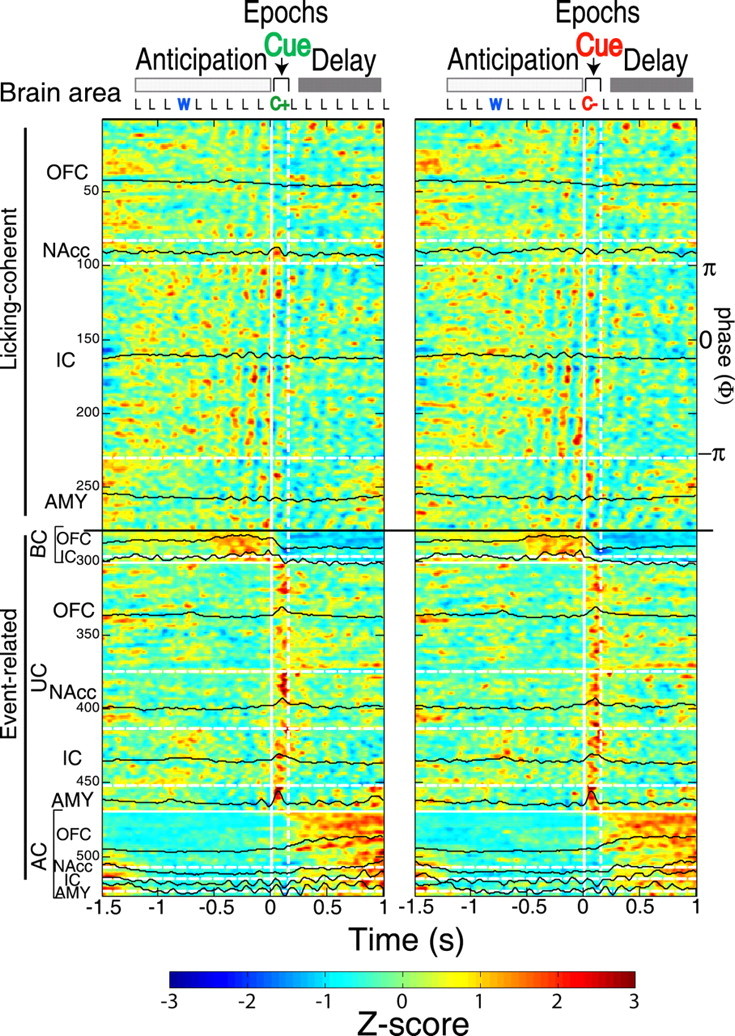
Licking evoked synchronous activity in the taste–reward circuit. Color-coded PSTHs depicting the spatiotemporal response patterns of 526 neurons recorded in the IC, OFC, AMY, and NAcc. Along the ordinate, 526 neurons were separated into two non-mutually exclusive categories: licking-coherent (1–278) and event-related (279–526). The event-related responses were referenced with respect to the cue delivery (solid vertical line) and separated into three subcategories: BC, before cue (279–300); UC, upon cue delivery (301–468); and AC, after cue delivery with tonic-firing activation (469–526). Licking in the cue compartment was partitioned into three epochs: anticipation, cue, and delay. “L” represents the time stamp for an empty lick, “W” for water delivery, and “C” for delivery of a cue. The left (right) panel depicts the activity around C+ (C−) delivery. These responses were obtained in the postlearning phase. The cues were delivered at time 0 s; the vertical dashed line indicates 150 ms after cue delivery (∼1 lick cycle). The absolute firing intensities of each neuron were normalized to Z scores and, for visualization purposes, smoothed and displayed in color contour plots. Dark red/blue indicates firing that is 3 or more SDs above/below its mean, respectively (from −1.5 to 1 s in each PSTH). The black horizontal lines delimit the two main firing categories. Within each firing pattern, neurons were subsequently ranked as a function of brain area, indicated by horizontal white dashed line. The average population activity for each brain area is shown in black PSTHs. For each of the four brain areas, licking-coherent neurons were ranked according to their coherence phase (Φ) from π to −π radians (top to bottom, indicated in IC as an example, since it contains the largest number of such neurons).
Figure 4.

Rhythmic licking may serve to coordinate neuronal activity across brain structures. A, Raster and PSTH of a neuron from AMY that fired in phase with rhythmic licking throughout the time the subject was in the cue compartment. The activity in the raster plots was aligned to C+ delivery in the postlearning phase. The red marks represent the tongue's contact with the sipper tube. The blue marks show water delivery (W). The black marks indicate the occurrence of action potentials. The maximum coherence (Coh) and phase coherence (Φ) is given in the PSTH. Conventions the same for all figures (A–C). B, An example of a neuron from the IC exhibiting a high coherence and that fired phasically to both water and cue delivery. C, Rasters and PSTHs showing the responses of two simultaneously recorded neurons from AMY (top) and OFC (bottom). Note that their action potentials were synchronous (Fig. 5A shows cross-correlation of this neuron pair) and locked to the lick cycle (vertical dashed lines). That is they only became licking coherent after the second empty lick that followed the cue delivery. The coherence plots of these two neurons are displayed in supplemental Figure S4A (available at www.jneurosci.org as supplemental material) (see “Ensemble B”). D, These four panels show the entire population of neurons for each brain region with significant coherence at each lick cycle. The proportion of neurons that fired in synchrony with licking increased after learning in OFC, IC, and AMY. The NAcc did not increase the proportion of licking-coherent cells with learning. E, This panel shows the results of pooling together all the data obtained from the four brain regions. Note that, in the first 16 licks, a given proportion of neurons fired in coherence on at least one lick cycle. The proportion of neurons was larger after learning and during cycles 4 and 10, in which water and the cues were released respectively (see arrows), suggesting that brief gustatory stimuli seems to recruit more neurons with licking coherent activity.
Figure 9.
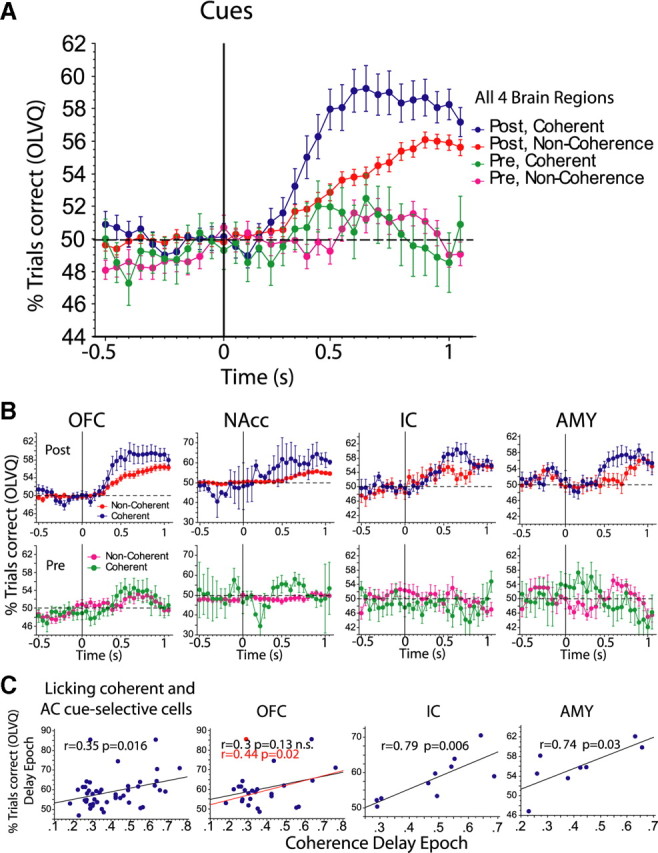
AC cue-selective neurons: neural decoding of cue identity as a function of synchrony and learning. A, Shown are the 196 AC cue-selective neurons that were sorted according to whether or not they showed significant coherence with licking in the delay epoch. Notice that, independently of whether the neurons exhibited synchronous firing with licking from −0.5 to 0 s relative to cue delivery, the classification of the cues was, as expected, below chance levels (horizontal dashed line) in either the prelearning or postlearning phases. However, after cue delivery, the discrimination of the cues slowly increased. The graph also shows that, after learning, licking-coherent neurons (blue dots) were better at discriminating the cues than noncoherent neurons (red dots). B plots cue discrimination (OLVQ performance) as a function of brain region and learning phase. C, The coherence level in the delay epoch correlates with OLVQ cue discrimination in the postlearning phase. The left panel shows the Pearson correlation value (r) between cue discrimination (percentage of trials correctly classified by the OLVQ) of 46 licking coherent and AC cue-selective cells (from all four brain regions) against the amount of coherence that each of these cells displayed in the delay epoch. The adjacent three panels plot the same analysis for each individual brain region. The OFC showed a nonsignificant trend, because of one outlier (red point) that had a low coherence, but an excellent cue discrimination. Reanalysis of the regression omitting this cell reveals a significant correlation between coherence level and cue discrimination (r = 0.44; p = 0.02). A stronger and significant correlation in the IC and the AMY was observed. The same analysis was not possible to perform for the NAcc, since only two neurons were coherent and AC cue selective. For panels in C, we used a single window of spike trains (binned in 10 ms bins) that comprised the entire delay epoch (0.2–1 s, after cue delivery). Error bars indicate SEM.
Cross-correlation analysis.
In this analysis, a neuron from one region was compared with a neuron simultaneously recorded in a different brain area. For instance, if two licking-coherent neurons were recorded in OFC, three in AMY, and two in IC, then there were six OFC–AMY pairs, four OFC–IC pairs, and six AMY–IC pairs. The variability in the response of each neuron to repeated presentations of the same stimulus was removed by subtracting the shift predictor from the raw cross-correlation. The shift predictor was constructed by shuffling the trials of one neuron (reference cell), this procedure was repeated 100 times, and the average cross-correlation values were subtracted from the original raw cross-correlations. Then, the absolute peak value of this cross-correlation was identified (Grossman et al., 2008).
Phasic, before cue, and after cue responses.
Neuronal firing modulations shown in Figure 2 were identified using a Wilcoxon rank sum test at an α level of <0.05.
Phasic responses.
Phasic neuronal firing modulations were identified using a Wilcoxon rank sum test at an α level of <0.05. Briefly, the spike counts over the first 150 ms after cue delivery were compared against the neuronal firing produced during the 150 ms after a previous empty lick. In cases in which the interlick interval of the previous lick overlapped with cue delivery, the next to last dry lick before the cue delivery was used as the baseline. This approach determined whether cue delivery evoked a significant neuronal response relative to that produced by an empty lick, thus providing a rationale to separate oromotor-driven firing modulations from genuine taste cue-evoked neuronal activity (see Fig. 2).
To determine whether the neurons responsive to the delivery of the cues were also responsive to other gustatory stimuli (e.g., water, sucrose, quinine), we followed the same procedure outlined above for the cues, namely by calculating the differences in activity between the wet and dry licks. This criterion allowed us to test whether neurons responded to other gustatory stimuli, but not whether these evoked responses were significantly different among gustatory stimuli (supplemental Table S1, available at www.jneurosci.org as supplemental material). It is important to emphasize that in the present study we did not explore the contribution of a temporal code (in 150 ms), which has been shown to also carry taste information (Di Lorenzo and Victor, 2003; Stapleton et al., 2006).
Before cue responses.
Neurons with excitatory activity before cue (BC) delivery were identified using a Wilcoxon rank sum test at an α level of <0.05. Neurons with this firing pattern had to meet two selection criteria: (1) they needed to show a significant inhibition during the first lick after cue delivery. Thus, we compared the spike counts over the first 150 ms after cue delivery against the firing rate produced during 150 ms after a previous empty lick. (2) The spike counts over the first 500 ms before cue delivery had to be significantly greater than the firing rate in the subsequent 500 ms after cue delivery.
After cue responses.
Neurons that fired after cue delivery were also identified using a Wilcoxon rank sum test at an α level of <0.05. These neurons showed a significant increase in firing rate during the first second after cue delivery, in comparison with the second before cue delivery. Neurons that showed phasic activity [upon cue (UC) responses] were not included in this category. In Figure 2, both AC and BC neurons were ranked according to the root mean square of their firing rate.
Onset and peak latency.
The onset and peak latency were computed from perievent stimulus histograms (PSTHs) (bin width, 1 ms) using a 200 ms window after cue delivery. The PSTHs were smoothed through convolution with a Gaussian function with a SD of 10 ms. The onset latency was defined as the first bin exceeding 3 SDs above background activity. The onset latency and average peak time are displayed as a function of cue type, learning phase, and brain area in supplemental Table S2 (available at www.jneurosci.org as supplemental material).
Generalized linear model.
It is generally accepted that neuronal firing rates follow a Poisson distribution. Therefore to determine whether spiking activity discriminated between cues in each learning phase, the spike counts were modeled using a Poisson generalized linear model (Stapleton et al., 2006). The generalized linear model (GLM) is more appropriate to use than a two-way ANOVA test, which assumes the spike trains are normally distributed. Details of the Poisson GLM model can be found in supplemental Methods, Data analyses, GLM (available at www.jneurosci.org as supplemental material).
Choice probability.
The choice probability represents the accuracy with which an ideal observer, given previous knowledge of the firing rate distributions, could predict from the response of the neuron the subject's anticipated decision (go/no-go). The choice probability was computed with a standard receiver operating characteristic (ROC) curve, since this is the test that is classically used to detect choice probability (Britten et al., 1996). The ROC analysis takes on values between 0 and 1, where 0 or 1 represent perfect predictive power and values near 0.5 reflect a random association between neuronal response and behavioral response and indicate that the neuronal response provides no information for predicting the animal's choice. We analyzed activity only from C− trials in the postlearning phase, since in those trials rats performed both go and no-go responses, in accordance with the inclusion criteria described by Setlow et al. (2003). For UC cue-selective neurons, we integrated the activity over the first 150 ms, and for the AC cue-selective neurons, over the interval 0.2–1 s. Significance of the ROC curve was computed using a permutation test, at an α of 0.05%. In this test, the labels of go/no-go responses were shuffled, and the ROC value was calculated from 1000 permuted samples.
Optimized learning vector quantization.
The ability of single neurons to discriminate the cues as a function of task performance was quantified using a nonparametric method for statistical pattern recognition called optimized learning vector quantization (OLVQ) (supplemental Methods, Data analyses, OLVQ, available at www.jneurosci.org as supplemental material). For all OLVQ analyses, spike trains were binned in 10 ms bins, and both firing rates and spike timing information were always used for cue discrimination. A “moving window” analysis was used to assess the time course of information about the cues. OLVQ was applied sequentially to a 300 ms window of single-unit activity that “moved” in 50 ms steps through 0.5 s before and 1.0 s after the time of cue delivery at 0 s (see Figs. 7D, 9A,B). This analysis reveals a continuous quantitative readout (50 ms steps) of the ability of the recorded population to distinguish between the C− and C+ cues.
Figure 7.

AC cue-selective neurons: neuronal decoding of cue identity improves with learning. A, Raster plots and PSTHs for an OFC neuron that with training developed stronger activity in C+ trials. In the delay epoch, this neuron became synchronized with licking (coherence, 0.18 at 6.2 Hz; Φ = −2.5 radians). The horizontal black lines separate trials in the prelearning and postlearning phases. B, The PSTHs of the neuron in A, but comparing both cues (C+, green; C−, red) as a function of learning phase. C, Presented is the proportion of AC cue-selective neurons in the postlearning phase sorted by brain region. D, Neural activity from the 196 AC cue-selective neurons in different brain areas that was used to classify the identity of the cues (C+, C−) using an optimized LVQ classifier (see Materials and Methods). Note that the neuronal classification of the cues improved with learning (red solid line, postlearning phase; gray dashed line, prelearning). The horizontal dashed line represents chance classification level. Error bars indicate SEM.
Results
Behavior: learning the cues in a single lick
Adult rats were trained in a taste discrimination go/no-go response task (Fig. 1A). To solve this go/no-go task, rats needed to determine which taste cue predicted the reward (C+) and which predicted the aversive outcome (C−). Subjects initially responded to each cue by making a go response and received the corresponding outcome until the cues acquired a predictive value. At this point, rats learned to avoid quinine (correct rejection, no-go response) while continuing to respond (go response) after the positive cue (hit) to obtain sucrose (supplemental Fig. S6A, available at www.jneurosci.org as supplemental material).
In an individual session, learning was quantified using a state-space algorithm in which trials were categorized as either prelearning or postlearning (Fig. 1B,C) (for all learning curves, see supplemental Fig. S5, available at www.jneurosci.org as supplemental material). We found that, for C− trials, the learning trial was at 95.4 ± 6.8 trials (supplemental Fig. S6C, available at www.jneurosci.org as supplemental material), that is, it occurred significantly later than the learning trial obtained by combining both cues [56.8 ± 4.9 trials; t test (88) = −4.5; p < 0.0001]. Thus, the learning trial was estimated by combining both cues together (supplemental Fig. S6D, available at www.jneurosci.org as supplemental material). Parenthetically, the state-space definition of the onset of learning occurs earlier than that found using the often applied 90% trials correct criterion [73.1 ± 5.9 trials; t test (88) = −2.1; p < 0.037] (Schoenbaum et al., 1998). In addition, during the prelearning phase, rats performed at chance level of 52.8 ± 0.005%, but in the postlearning phase, subjects performed correctly in 88.4 ± 0.008% of the trials (mean ± SEM; n = 45 sessions). This shows that they can extract taste information from one lick of a tastant and use this information to guide their behavior (Halpern and Tapper, 1971).
During the delivery of the two hedonically positive tastants used as cues (0.1 m NaCl; 0.1 m MPG), animals licked the tube in a stereotypic rhythmic manner. For these two cues (1 s after cue delivery, in the delay epoch) (see below), the mean lick frequency was not significantly different (C− = 5.9 ± 0.1 Hz; C+ = 6.0 ± 0.09) (F(1,178) = 0.99; p = 0.32; n = 45). In addition, during the delay epochs of both the prelearning and postlearning phases, rats did not discriminate among the cues by changing their licking patterns (supplemental Fig. S7, available at www.jneurosci.org as supplemental material).
As expected, during both prelearning and postlearning phases, the rats licked more times after the delivery of sucrose (hit) than quinine (false alarm). By calculating the probability that a trial contained only a single lick in the first 1.0 s after the first delivery of sucrose or quinine, we found that, throughout this period, rats continued licking for sucrose. Indeed, in a small fraction of the hit trials, rats received only one drop of sucrose (prelearning, 0.016 ± 0.007, and postlearning, 0.008 ± 0.004 fraction trials; Wilcoxon's test, p = 0.93, NS). In contrast, the fraction of false alarm trials in which they licked only once after quinine delivery significantly increased, from 0.30 ± 0.045 (prelearning) to 0.63 ± 0.042 (postlearning) (Wilcoxon's test, p < 0.001). These results demonstrate that rats can learn to detect (and reject) quinine in a single lick (∼150 ms).
Electrophysiology
We recorded the activity of 1110 single neurons distributed across four taste–reward structures: OFC, IC, NAcc, and AMY (supplemental Fig. S1, available at www.jneurosci.org as supplemental material). The distribution of neurons in these areas was as follows: OFC (n = 449), NAcc (n = 306), IC (n = 243), and AMY (n = 112).
Licking coordinates neuronal activities in the taste–reward network
Figure 2 shows a stack of 526 (of the 1110) normalized Z score PSTHs for all the OFC, IC, AMY, and NAcc neurons that exhibited a significant modulation in firing rate from −1.5 to 1 s centered around cue delivery (0 s). During this 2.5 s interval, the PSTHs included three main epochs of the go/no-go task [anticipation, cue (C+, left panel; C−, right panel), and delay]. The anticipation epoch consisted of three dry licks (L) followed by water (W) delivery, followed by five more dry licks. The cue epoch is delineated by the vertical white lines (representing a single lick ∼150 ms) and contains the response to the delivery of the cue at time 0 s. This was followed by a delay epoch that consisted of several more dry licks (L).
The observed patterns of neuronal firing modulation in these components of the taste–reward circuit were classified into two broad, but not mutually exclusive, categories: licking coherent (neurons 1–278) and event-related (neurons 279–526). A total of 414 neurons showed a significant coherence with licking (see below), and of these, 278 were plotted in the licking-coherent category (Fig. 2). The remaining 136 licking coherent neurons were plotted in the event-related category since they fired during a particular epoch in relation to cue delivery. Therefore, 112 neurons with no licking-coherent activity were classified as event-related (supplemental Fig. S8, available at www.jneurosci.org as supplemental material). The event-related neurons (136 + 112 = 248 in total) were further characterized by their responses in relation to the cue delivery. These included neurons that fired before cue delivery (BC), upon cue delivery (UC), and after cue delivery (AC). Below each category is described in detail. Inspection of the color-coded population of PSTHs indicates that, throughout the four brain areas, the neuronal responses to cues may be entrained to the licking cycle.
Licking-coherent
Next, we analyzed the level in which the firing of each of the 1110 neurons was coherent with rhythmic licking. In this context, coherence is defined as a measure of the interdependence of licking and neural activity in the relevant frequency domain (supplemental Fig. S3, available at www.jneurosci.org as supplemental material). A coherence of 0 or 1 means that two signals are completely uncorrelated, or completely correlated in frequency and phase, respectively. The phase of the coherence ranges between ±π radians and indicates the extent to which a neural discharge follows the lick (set at 0 radians corresponding to the tongue contacting the sipper) (Fig. 3A). Positive phase values (>0 to π radians) indicate that the action potentials of a given neuron tend to occur during the early phases of the lick cycle, meaning that such neurons would rapidly fire after the lick. For neurons that fire with a negative phase (−π to <0 radians), their discharges tend to peak later in the lick cycle (Fig. 3A,D). The distribution of the phase of coherence (average phase across all licks in the cue epoch) for each brain region is shown in Figure 3C.
Figure 3.

Licking-induced synchronization and phase-locked distribution across the four brain areas recorded. A, A schematic representation that illustrates the phase of the lick cycle. A phase (Φ) of 0 radians represents the tongue's contact with the sipper. Thus, neurons with a positive phase-relation (0 to π) tend to fire in the first half of the licking cycle (green), whereas coherent neurons with a negative phase (−π < 0) tend to fire in the second half (red) of the lick cycle. B, A histogram showing the percentage of neurons with significant coherence for each brain area: percentage of neurons with positive (0 to π; red) and negative (−π < 0; green) phase coherence. In the amygdala, the proportion of neurons with positive phase was larger than neurons with negative phase coherence. **Significant value of p < 0.05, χ2 test. C, Distribution of phase-locked neurons sorted by brain region. In each histogram, the gray shaded rectangle indicates the percentage of neurons that were phase-locked with the tongue's contact with the sipper (−0.5 to 0.5 radians). In the OFC, NAcc, and IC, we found that the average firing phase (average phase across all licks in the cue epoch) was equally distributed over the entire lick cycle (Kuiper's test of uniformity, OFC, V′153 = 1.37; NAcc, V′20 = 1.25; IC, V′173 = 1.69; nonsignificant). In contrast, the distribution of the phases of AMY was not uniform (V′68 = 3.7; p < 0.05) in that they showed a marked preference to fire in the positive phase relative to the lick cycle. Thus, AMY neurons predominantly synchronize with neurons from the other three areas that also fire in a positive phase relative to the lick cycle (see D, green PSTH). D, Population PSTH of neurons with significant coherence (OFC, IC, NAcc, and AMY, n = 414) sorted by their phase relationship with licking. Gray, The population PSTH of neurons that fired in phase −0.5 to 0.5 radians relative to the lick (gray shaded rectangle in C). Green, The population PSTH of neurons that fired from 0.5 to π. Red, The population PSTH of neurons that fired from −π to −0.5 radians. Activity is aligned to cue delivery (time 0 s). The interval from the solid vertical line to the right dotted line indicates the first lick cycle after cue delivery. Note that the neuronal activity from these three PSTHs reset in each lick cycle.
Neurons with licking-coherent activity were present in the four brain areas and in all subjects (supplemental Table S3, available at www.jneurosci.org as supplemental material). However, the proportion of licking-coherent neurons differed among brain areas (Fig. 3B) (χ2(3) = 1.45; p < 0.0001); their distribution was IC (71%; 173 of 243), AMY (60%; 68 of 112), OFC (34%; 153 of 449), and NAcc (6.5%; 20 of 306). A comparison of the number of licking-coherent neurons observed when the animals were in the cue and outcome compartments are presented as supplemental Table S4 (available at www.jneurosci.org as supplemental material) (see supplemental Results, Coherence, available at www.jneurosci.org as supplemental material). The IC and the AMY exhibited the greatest percentage of these cells and both regions contained more such neurons than the OFC (p < 0.0001) (Fig. 3B). In turn, all three areas, IC, AMY, and OFC, were significantly different from the NAcc (p < 0.0001) (Fig. 3B). The small proportion of coherent neurons recorded in NAcc is most likely attributable to the prominent inhibition observed in this region during consummatory behavior (Nicola et al., 2004; Roitman et al., 2008).
The average coherences in the different brain areas were as follows: IC (0.25 ± 0.009) and AMY (0.24 ± 0.013) followed by the OFC (0.21 ± 0.008) and NAcc (0.17 ± 0.011). The IC and the AMY exhibited the greatest coherence values and both regions showed higher coherence than the OFC. In turn, all three areas, IC, AMY, and OFC, were significantly different from the NAcc (F(3,410) = 5.3; p = 0.0012).
Figure 4A–C depicts representative examples from different brain areas that illustrate typical licking-coherent firing patterns. Figure 4A depicts a neuron from the AMY that fired throughout the behavioral task in phase with the animal's rhythmic licking. This neuron exhibited a maximum coherence with licking of 0.64 at 6.8 Hz, and relative to the lick cycle, its action potentials were phase-locked at 2.6 radians. Figure 4B shows a response from the IC that, before water delivery, had virtually no firing. Nevertheless, on water and the cue delivery, it produced a strong transient response that decayed in an oscillatory manner during the subsequent dry licks. Thus, in contrast to the neuron shown in Figure 4A, which fired in phase throughout the trial, this neuron fired in phase with licking only after a stimulus was delivered.
Figure 4C shows an example of two simultaneously recorded neurons, one in AMY and the other in OFC, that commenced firing two licks after receiving the cue and whose action potentials were phase-locked to specific lick cycles (see vertical dashed lines). This type of response shows that the resulting synchronous activity was not a consequence of somatosensory input as might be the case for the example shown in Figure 4A. Instead, despite being located in two distinct brain areas, these neurons fired in synchrony in a manner that covaried with licking. Thus, neurons across multiple brain structures may fire synchronously at specific lick cycles during relevant epochs of the behavioral task (supplemental Fig. S4, available at www.jneurosci.org as supplemental material).
To determine the proportion of neurons that fired in synchrony during each lick cycle at theta frequencies, we used the multitaper coherence analysis to establish that the proportion of neurons with significant coherence was larger after learning in the OFC, AMY, and IC, but not in NAcc (Fig. 4D). This analysis also showed that the proportion of coherent neurons was greatest when the animals received either water or a tastant cue (Fig. 4E). These results suggest that licking may act to synchronize the activity of neurons from different brain regions in a dynamic and learning-dependent manner.
Learning enhances coincident spiking between licking-coherent neurons
Next, we determined whether licking-induced oscillations enhance coincident spiking between neuron pairs from distinct brain areas. To address this issue, we analyzed the cross-correlations between pairs of licking-coherent neurons before and after learning (Grossman et al., 2008), during the first second after cue delivery. Since no pair of licking-coherent cells was obtained in the NAcc, this area was not included in this analysis. Overall, during the delay epoch, there were 168 neurons with significant coherent activity. From these, we recorded 37 pairs of OFC–AMY neurons, 43 OFC–IC pairs, and 57 AMY–IC neuron pairs (Fig. 5D). By measuring the maximum peak of the cross-correlation, we found that coincident spiking between licking coherent neurons increased significantly after learning (pair t test, p < 0.0001) (Fig. 5D). Such an increase was also observed in pairs of licking-coherent neurons from the OFC–AMY, OFC–IC, and AMY–IC (Fig. 5D, “licking-coherent”). As a control, we performed the same analysis for all pairs of neurons in which firing in the delay epoch was not coherent with licking (Fig. 5D, “noncoherent”). In this subpopulation, there were 891 OFC–AMY, 1129 OFC–IC, and 272 AMY–IC neuron pairs. We observed that, after learning, coincident spiking between noncoherent OFC–AMY, OFC–IC, and AMY–IC neuronal pairs also showed larger cross-correlation peaks (Fig. 5E). These correlation peaks, however, were significantly smaller than for licking-coherent cells (p < 0.01) (Fig. 5E). This result shows that, after learning, licking-induced oscillations increased the probability of coincident spiking between disparate brain regions, such as the OFC–AMY–IC. This effect, however, was much more pronounced among licking-coherent neurons.
Figure 5.

The cross-correlation peaks in pairs of licking-coherent simultaneously recorded neurons in OFC–AMY, OFC–IC, and AMY–IC increased after learning. A–C, Cross-correlations of three pairs of licking-coherent neurons as a function of learning. Each pair was recorded simultaneously (dashed lines, prelearning; solid black lines, postlearning). The two neuron pairs shown in A and B were recorded simultaneously, and in both cases, the OFC neuron was the same. This OFC was a licking-coherent AC cue-selective cell and the neuron in the amygdala for the pair in A was not cue-selective. The neuron in the IC for the pair in B was also non-cue-selective. Note that, after learning, coincident spiking in both pairs (A, B) was enhanced, suggesting that licking-coherent cue-selective neurons from one area can fire in synchrony with non-cue-selective coherent cells from other brain regions and that synchronous spikes between different regions are enhanced after learning (see text for summary of these type of interactions). D, This histogram shows the maximum peak of cross-correlations as a function of learning for pairs of OFC–AMY, OFC–IC, and AMY–IC neurons. Neurons were divided into coherent, if they showed significant coherence in the delay epoch, or noncoherent. We compared pairs of licking-coherent neurons recorded simultaneously in different regions. It is seen that, after learning the peaks of the cross-correlations were significantly larger in all neuron pair combinations (*paired t test, significant value of p < 0.0001). E, This figure shows the normalized peak of cross-correlations (peak post–pre learning) as a function of pairs of OFC–AMY, OFC–IC, and AMY–IC neurons. The normalized peak of cross-correlation was compared between neurons that displayed licking-coherent and noncoherent activity. **0.0001, *0.01, significant p value (Wilcoxon's rank sum test). Error bars indicate SEM.
Event-related activity: neurons monitor the structure of the task
In addition to licking-coherent neurons, the neural populations also contained cells that fired in relation to a salient event such as the delivery of a cue. As shown in Figure 2, we further classified the activity of this population according to its timing relative to the delivery of the cue (BC, UC, and AC delivery).
BC delivery
The BC population contained 22 neurons. Their firing modulations were characterized by a buildup of activity before cue delivery, followed by a rapid return to baseline after cue delivery (∼150 ms) (Fig. 2). In this regard, even though the rats continued licking upon and after cue delivery, the decrease in neuronal activity was maintained, indicating that this neuronal population did not encode purely oromotor information. Interestingly, BC neurons were found only in the OFC and IC. In the OFC, only 4% (18 of 449) of the neurons exhibited such firing behavior. Overall, 88% (16 of 18) of these OFC neurons displayed significant phase-locked activity with respect to licking (mean coherence, 0.226 ± 0.027 SEM; mean frequency, 6.82 ± 0.16 Hz). In the IC, only 1.6% (4 of 243) of the neurons showed the same kind of anticipatory activity (see BC) (Fig. 2). All four IC neurons showed significant coherence with licking.
Supplemental Figure S9 (available at www.jneurosci.org as supplemental material) illustrates the response of an OFC neuron in the postlearning phase in which the firing rate increased or ramped up before cue delivery. The activity increased in a sigmoidal manner from the time the subject entered the cue compartment, licked the dry sipper, received water, licked the dry sipper again, and received either of the cues (C+ raster is shown). This firing pattern, which was not significantly different for either cue (see PSTHs below raster), transiently decreased in the first 100 ms after cue and reached baseline levels 50 ms later. Supplemental Figure S9B (available at www.jneurosci.org as supplemental material) depicts the population PSTH of the above noted 18 OFC neurons. For this population, neuronal activity increased as the animal entered the cue compartment until water was delivered, whereon it slightly decreased. The activity then increased again until a cue was delivered, whereon the response rapidly decreased and returned to baseline in 137 ms, before the onset of the next lick. Overall, this population of OFC neurons may reflect the expectation of the delivery of salient liquids but not their identity.
We also determined whether the cue-anticipatory activity seen in the postlearning phase was also present in the prelearning phase. In this regard, we compared the average population PSTH (from −3 to 0 s before cue delivery; bin width, 25 ms) of the 18 OFC neurons in the prelearning phase (data not shown) against the population response over the same period in the postlearning phase (supplemental Fig. S9B, available at www.jneurosci.org as supplemental material). We found no significant differences in anticipatory activity between prelearning and postlearning phases [repeated-measure (RM) ANOVA, F(1,68) = 0.18, p = 0.67, NS]. We also did not find any difference between cues (RM ANOVA, F(1,68) = 0.0037, p = 0.95, NS). Therefore, in both learning phases, this OFC population seems to anticipate the delivery of the cues (but not their identity). Likewise, the four IC neurons with cue-anticipatory activity acted in a similar manner to the OFC neurons (data not shown).
Cue delivery induces activation of the OFC–AMY–IC–NAcc circuit
Another neuronal subpopulation in our classification scheme, named UC, exhibited firing rates that transiently changed upon cue delivery (see UC) (Fig. 2). These neurons constituted 15% (168 of 1110) of the neural population and were present in similar proportions in all four recorded brain areas (χ2(3) = 2.74; p = 0.9). Approximately 50% (84 of 168) of all UC neurons displayed phase-locked activity with respect to licking (mean coherence, 0.24 ± 0.013 SEM; mean frequency, 6.8 ± 0.09 Hz). To characterize the UC population (n = 168), we determined the onset latency of phasic firing modulation by finding the first 1 ms bin in the PSTH that was at least 3 SDs above baseline. This analysis revealed no significant difference among brain regions (F(3,248) = 0.21; p = 0.88). The mean onset latencies observed were as follows: OFC, 47 ± 3 ms; NAcc, 44 ± 4 ms; IC, 49 ± 5 ms; and AMY, 42 ± 3 ms, suggesting that there was a parallel activation of these four areas upon cue delivery (supplemental Table S2, available at www.jneurosci.org as supplemental material).
To obtain a better estimate of the dynamics of the UC neurons, we also analyzed their peak latencies. For each of the recorded brain areas, this analysis revealed the existence of a characteristic temporal activation pattern (supplemental Fig. S10, available at www.jneurosci.org as supplemental material). The time to maximum firing rate (peak) was significantly different among the four areas (F(3,248) = 8.2; p = 0.0001). Specifically, the peak firing activity of AMY neurons occurred earlier than peak responses from the OFC (p < 0.0001), NAcc (p = 0.0007), and IC (p = 0.002). These data show that, as a population, neurons in the AMY had a faster time to peak than OFC and NAcc neurons (supplemental Table S2, available at www.jneurosci.org as supplemental material). In the IC, the peak distribution exhibited a very broad activation pattern (supplemental Fig. S10, available at www.jneurosci.org as supplemental material).
Interestingly, because the firing rate modulation of UC neurons was broadly tuned, 83% (140 of 168) of them could not be used to discriminate between the two cues (“non-cue-selective UC”) (supplemental Table S1; supplemental Results, Cue epoch, available at www.jneurosci.org as supplemental material). Thus, even though most individual UC neurons could not discriminate the identity of these tastants, their increase in firing rate could at least mediate cue detection.
Rapid encoding of the predictive value of the cues
How then do rats discriminate among the cues to perform the taste guided behavioral task? In this context, we found that, during learning, 17% (28 of 168) of the UC population developed cue selectivity in the postlearning phase (“cue-selective UC”). That is, although the firing rate of these neurons did not discriminate among cues in the prelearning phase, they did after learning occurred. Figure 6, A and B, shows the development of cue selectivity of an OFC neuron throughout the session. This neuron, which was not activated by licking the sipper per se, responded similarly to both cues in the prelearning phase, but developed a stronger phasic response for C+ in the postlearning phase. Figure 6 also shows the average population of cue-selective UC neurons sorted by their preferred cue (Fig. 6C, prefer C+; D, prefer C−). Although most cue-selective neurons responded to both cues, their responses were often of different magnitudes. Moreover, the development of cue selectivity was specific to the cues and was not observed during water delivery (supplemental Fig. S11, available at www.jneurosci.org as supplemental material). We found no difference in the distribution of cue-selective UC neurons among brain areas: 29% (5 of 17) in the AMY, 17% (13 of 74) in the OFC, 16% (6 of 38) in the NAcc, and 10% (4 of 39) in the IC (χ2(3) = 3.2; p = 0.36). Overall, these data indicate that, upon cue delivery (∼150 ms), 17% of the UC neurons contained detailed information about the associative significance of the cues and are dynamically reorganized upon learning.
Figure 6.

UC neurons, Cue-selective modulation during learning. A, Raster plot of an OFC neuron that developed C+ selectivity in the postlearning phase. The horizontal black lines separate the trials in the prelearning and postlearning phase. Activity was aligned to the delivery of the taste cue (top raster for C+ trials and bottom raster for C− trials). Overlapped in the raster is the PSTH in the prelearning (dashed line) and postlearning (solid line) phase for C+ (top) and C− (bottom). The coherence and phase relation was 0.48 and −1.95 radians, respectively. B, The PSTHs of same neuron in A, but in each learning phase responses to both the cues overlap. C, The average population PSTH in the prelearning and postlearning phases obtained from 10 C+ preferred neurons (green lines). The black dashed line shows the firing rate to the nonpreferred cue. D, The average population PSTH in the prelearning and postlearning phases obtained from 18 C− preferred neurons (red line).
Learning reorganizes phasic activity in the taste–reward circuit
A significant percentage of non-cue-selective UC neurons also changed their firing modulation properties after learning (supplemental Fig. S12A, available at www.jneurosci.org as supplemental material). For instance, 26% (36 of 140) of UC neurons showed significant evoked responses to cue delivery in the prelearning phase, which became smaller and/or nonsignificant in the postlearning phase (supplemental Fig. S12, available at www.jneurosci.org as supplemental material; referred to as only-pre). Approximately 53% (74 of 140) of them developed significant cue-related firing activity only in the postlearning phase (only-post) and 21% (30 of 140) displayed significant evoked responses in both learning phases (pre-post). The number of neurons from each category and brain region is shown in supplemental Figure S12B (available at www.jneurosci.org as supplemental material).
AC delivery
The delay epoch encompasses a period in which animals had already sampled the cue but continued to lick until they decided to make a go/no-go response. A small subpopulation of AC neurons (n = 58) displayed a tonic firing pattern during the delay epoch (Fig. 2; neurons labeled “AC”). We observed that 8.5% (38 of 449) of the total number of OFC neurons exhibited this type of tonic firing pattern. In the other areas, the following percentages were found: NAcc, 2.6% (8 of 306); IC, 3.2% (8 of 243); and AMY, 3.5% (4 of 112), indicating that the percentages of such responses were more frequently found in the OFC (χ2(3) = 16.17; p = 0.001). Overall, 55% (32 of 58) of these neurons displayed significant phase-locked activity with respect to licking (mean coherence, 0.27 ± 0.02 SEM; mean frequency, 6.4 ± 0.12 Hz).
Delayed cue-selective responses
In addition to the AC neurons described above, a much larger population of AC neurons (n = 196) changed their firing pattern on learning. To identify these, we searched for neurons that, during the delay epoch, or 200–1000 ms after cue delivery, discriminated between the cues. We named such neurons AC cue-selective. The example in Figure 7 shows that no activity was evoked during the initial trials in the prelearning phase, but as the animal learned the task, the firing activity of the neuron increased during the delay epoch. In particular, in the postlearning phase, the activity of the neuron for C+ trials was markedly enhanced when compared with the C− trials (Fig. 7B). In general, we also found that cue-selective AC neurons discriminated among cues in both prelearning and postlearning phases, although the vast majority (77%; 152 of 196) was selective only in the postlearning phase (supplemental Table S5, available at www.jneurosci.org as supplemental material).
The OFC contained the largest percentage of these type of neurons at 24.7% (111 of 449), followed by the AMY at 17.8% (20 of 112), NAcc at 15% (46 of 306), and the IC at 7.8% (19 of 243). These proportions were different among brain regions (χ2(3) = 33; p < 0.0001; n = 196) (Fig. 7C).
The C+ or C− distribution of cue-selective neurons was found by pooling the results from all four brain regions. Under these conditions, we found a slight, but significant, increase in the proportion of C− (116) relative to C+ (80) neurons (χ2(1) = 6.25; p < 0.012; null probability, 0.5). However, the proportion of C+ and C− neurons was not significantly different across individual brain regions. In the OFC, 66 cue-selective neurons fired more for C−, whereas 45 preferred the C+ cue (χ2(1) = 3.6; p < 0.057). For NAcc neurons, 29 fired more for C− and 17 for C+ (χ2(1) = 2.63; p < 0.105), whereas for AMY neurons, 14 had firing greater for C− and 6 for C+ (χ2(1) = 2.45; p < 0.1175). Finally, the IC had 7 firing more for C− and 12 for C+ (χ2(1) = 0.84; p < 0.3588). Therefore, the four brain regions tested were responsive to both appetitive and aversive cues, with a slight bias for aversive cues.
As mentioned in the behavioral results, to solve this go/no-go task, rats needed to determine which taste cue predicted the reward (C+) and which predicted the aversive outcome (C−). Although it is possible that rats can learn the meaning of both cues independently, our data suggest that both learning processes (C+ and C−) can influence each other. In this regard, we found neuronal activity that suggests a possible interaction between cues, as shown in the example in supplemental Figure S6E (available at www.jneurosci.org as supplemental material), and even in the absence of any apparent behavioral change for C+ trials, this neuron began developing cue selectivity for C+ trials, a few trials after the first correct rejection of quinine (supplemental Fig. S6E, available at www.jneurosci.org as supplemental material). We suggest that this type of neuronal activity not only reflects an interaction between C− and C+ cues, but also that in this task rats first had to learn that the C− cue predicted quinine before changes in neuronal C+ cue selectivity were observed.
Cue discrimination in the taste–reward circuit improves with learning
To quantify the influence of learning on this AC neuronal subpopulation (n = 196), we used the activity of individual neurons to classify C+ and C− trials (supplemental Methods, Data analyses, OLVQ, available at www.jneurosci.org as supplemental material). The temporal evolution of the percentage of trials that were correctly classified in each brain area is shown in Figure 7D. In the prelearning phase, only OFC neurons were found to discriminate the cues above chance level (RM ANOVA; F(110,30) = 4.2, p < 0.0001). However, in the postlearning phase, a significant increase in correct cue classification was found in all four brain areas (RM ANOVA; for OFC, F(1,220) = 24.27, p < 0.0001; AMY, F(1,38) = 6.74, p = 0.013; NAcc, F(1,90) = 24.2, p < 0.0001; IC, F(1,36) = 14.7, p < 0.0005). Therefore, throughout these components of the taste–reward circuit, the ability of neurons to discriminate between cues improved with learning.
A small population of licking-coherent AC cue-selective neurons also conveys information about the anticipated motor go/no-go response
We next asked whether these 196 cue-selective AC neurons could encode the acquired cue's predictive value of the outcomes (reward or punishment) and/or whether they encoded the instrumental response to be performed (go/no-go). To answer these questions, we performed a ROC analysis to measure the subjects' choice probability (Britten et al., 1996). In this analysis, a significant choice probability suggests that the neuronal activity provides information for predicting the subsequent behavioral response that subjects will perform (go or no-go response). We found that 19% (22 of 111; 7 preferred C+ and 15 C−) OFC, 20% (4 of 20; 4 preferred C−) AMY, 16% (3 of 19; 1 preferred C+ and 2 C−) IC, and 9% (4 of 46; 2 preferred C+ and 2 C−) NAcc neurons also encoded the rat's anticipated motor decision. Thus, a relatively small population of these neurons also contained information regarding the anticipated instrumental choice of the subjects.
This result was verified when we only analyzed the subpopulation of coherent, cue-selective AC neurons. In total, we found that, in the postlearning phase in the delay epoch, 46 neurons (26 OFC; 8 AMY; 10 IC; 2 NAcc) were both coherent and cue-selective. In the OFC, only 30% (8 of 26 neurons) of AC cue-selective coherent cells also encoded the rat's anticipated motor decision (go/no-go). In the AMY, 12.5% (1 of 8) exhibited these characteristics, whereas in the IC (0 of 10) and NAcc (0 of 2) none of these cells showed a significant choice probability. This suggests that a relatively small population of licking-coherent AC cue-selective neurons also contains information regarding the anticipated instrumental choice of the subjects. Thus, the large majority of AC cue-selective coherent cells encoded the predictive value of the cues independently of the anticipated motor decision.
Similar results were found for 3 of 28 cue-selective UC neurons (3 of 28; 10.7%), which displayed a significant “choice probability” (3 neurons from OFC and none in NAcc, IC, and AMY).
Licking-coherent neurons are better at decoding the cue identity than noncoherent neurons
We also determined whether the 196 cue-selective AC neurons could use the animal's licking pattern as a reference signal and/or whether licking-induced synchronous firing could improve their ability to discriminate among the cues. In the postlearning phase, we first analyzed whether each of these neurons showed a significant coherence during the delay epoch (Fig. 8). We found that, in total, 23% (46 of 196) of the neurons fired coherently with licking, with the IC having the largest proportion (52%; 10 of 19), followed by the AMY (40%; 8 of 20), OFC (23%; 26 of 111), and NAcc (4%; 2 of 46). A similar number of these neurons responded preferentially for C+ (n = 25) and C− (n = 21).
Figure 8.

Noncoherent and coherent AC cue-selective neurons. A, B, Noncoherent. A, Raster plot of AC cue-selective neuron in which spiking pattern is noncoherent (coh, not significant) with licking. The raster on the top panel shows C+ trials, and the raster on the bottom panel shows C− trials. Cues were delivered at time 0 s. The dashed line indicates the learning trial. Pre, Prelearning; Post, postlearning. The adjacent right panels display the corresponding PSTHs during the prelearning (top) and postlearning phase (bottom). The percentage of trials correctly discriminated by the classifier (OLVQ) are also shown. Note that, after learning, this OFC neuron developed a larger cue discrimination. B, The overall mean firing rate of the neuron shown in A is illustrated during the entire delay epoch as a function of learning phase. It is seen that differences in firing rate between the cues were observed only in the postlearning phase. The C+ trials are shown in green, and C− trials are shown in red. **p < 0.05. C, D, Coherent. C, Raster plot and corresponding PSTHs of a lick-coherent and AC cue-selective neuron. Conventions are the same as given in A. Note that this OFC licking-coherent neuron achieved better cue discrimination than that obtained by the noncoherent neuron shown in A. D, The overall firing rate of neuron shown in C during the delay epoch as a function of learning phase. It is seen that differences between the cues were only observed in the postlearning phase. Green, C+; red, C−. **p < 0.05. Error bars indicate SEM.
Interestingly, we found that licking-coherent neurons did not use the entire lick cycle as a reference (supplemental Fig. S13, available at www.jneurosci.org as supplemental material). As found in the olfactory system during respiratory cycles (Bathellier et al., 2008), different parts of the licking cycle are not similarly informative. In this regard, we found that the subpopulation (n = 46) of coherent AC-cue-selective neurons do not use the entire lick cycle as an internal reference.
We also found that coincident spiking between pairs of licking-coherent cue-selective AC cells was enhanced by learning. This conclusion emerged from the analysis of 46 coherent AC cue-selective cells. For this analysis, we measured the cross-correlations in the neuronal pairs simultaneously recorded from different brain regions during the delay period. A total of 13 pairs was analyzed: 7 OFC–AMY pairs, 2 OFC–IC, and 4 AMY–IC. After learning, the cross-correlation peaks of the 13 pairs of such neurons increased. Thus, whereas the mean peak values in the prelearning was 13.1 ± 2.6 coincidences/s, after learning it increased to 25.6 ± 5 coincidences/s [paired t test (12) = −3.4, p = 0.0046; n = 13]. Likewise, we found that after learning the cross-correlation peaks between cue-selective and non-cue-selective coherent neuron pairs also increased (for examples of individual neuron pairs, see Fig. 5A,B) (the mean cross-correlation peak of 61 neuronal pairs was 12.5 ± 1.2 in the prelearning; it increased to 28.7 ± 2.5 coincidences/s after learning; paired t test (60) = −7.4, p < 0.0001). These results suggest that a subpopulation of cue-selective AC neurons synchronizes their activity with licking, and may transfer information about the acquired predictive value of the cues to other licking-coherent neurons located in different brain structures of the taste–reward circuit (Gregoriou et al., 2009).
Using AC cue-selective neurons, we tested the hypothesis that neurons that exhibited synchrony with licking contained more information about the cues than those that do not (Fig. 9A). These analyses revealed that, during the delay epoch, coherent neuronal populations were significantly better at identifying the cue than noncoherent neurons, but only in the postlearning phase (prelearning; RM ANOVA, F(1,194) = 0.03, p = 0.86, NS; postlearning; RM ANOVA, F(1,194) = 18.1, p < 0.0001). Nevertheless, it is important to note that, after learning, both coherent and noncoherent neurons improved their cue classification (coherent neurons; RM ANOVA, F(1,90) = 21.2, p < 0.0001; noncoherent neurons, F(1,298) = 41.8, p < 0.0001). We then analyzed each brain region independently and found that coherent neurons displayed greater cue discrimination than noncoherent neurons in all four brain regions (Fig. 9B). Although the cue classification of licking-coherent neurons was similar across different brain regions (RM ANOVA; F(3,1302) = 1.5, p = 0.2) (Fig. 9B, four blue lines), not all brain regions showed the same enhancement. For example, during almost all the delay epoch (from 0.45 to 1.0 s), the OFC was the only region exhibiting a consistently higher performance for coherent over noncoherent cells. The other three regions showed enhanced performance during a limited window of the delay epoch. Since only two NAcc neurons were coherent and cue-selective, no conclusions were drawn for this particular area. Using the OLVQ as a classifier, we found that the level of coherence during the delay epoch correlated significantly with cue discrimination. That is, in the postlearning phase, the larger the coherence, the greater the cue discrimination ability of a neuron (Fig. 9C; supplemental Fig. S14, available at www.jneurosci.org as supplemental material). A good correlation between the level of coherence and cue discrimination was found in the OFC (Pearson's pairwise correlation; r = 0.44; p = 0.02, when one outlier was removed). Larger correlations were found in the AMY (r = 0.74; p = 0.03) and IC (r = 0.79; p = 0.006). Overall, these results indicate that both coherent and noncoherent neurons contribute to the decoding of the cue identity, but neurons that fired in synchrony with licking clearly performed significantly better in this task.
Spike timing of licking-coherent neurons conveys additional information about the cues
To better distinguish among sensory cues, we explored whether licking-coherent cells might rely on additional information contained in either their firing rates or their spike timing. To identify which of these mechanisms better explained our findings, we first determined the amount of discrimination obtained by using only mean firing rates. This analysis revealed no significant difference between licking-coherent and noncoherent cue-selective AC cells of the IC, AMY, and the OFC (supplemental Fig. S15, available at www.jneurosci.org as supplemental material), indicating that firing rates alone did not convey the extra cue information of licking-coherent cue-selective cells.
To test the hypothesis that additional cue information derived from the spike timing of the neuron, we shuffled the spikes of all 46 licking-coherent cue AC-selective cells. This procedure removed all potential cue information from the spike timing of the neuron, without compromising information contained in the average firing rate of the cell. When the spike timing information was eliminated from these neuronal responses, their ability to discriminate among the cues became nearly identical with that of noncoherent neurons (Fig. 10). This demonstrated that, in the delay epoch, spike timing likely conveyed the extra cue information of cue-selective and licking-coherent AC neurons in comparison with noncoherent neurons.
Figure 10.
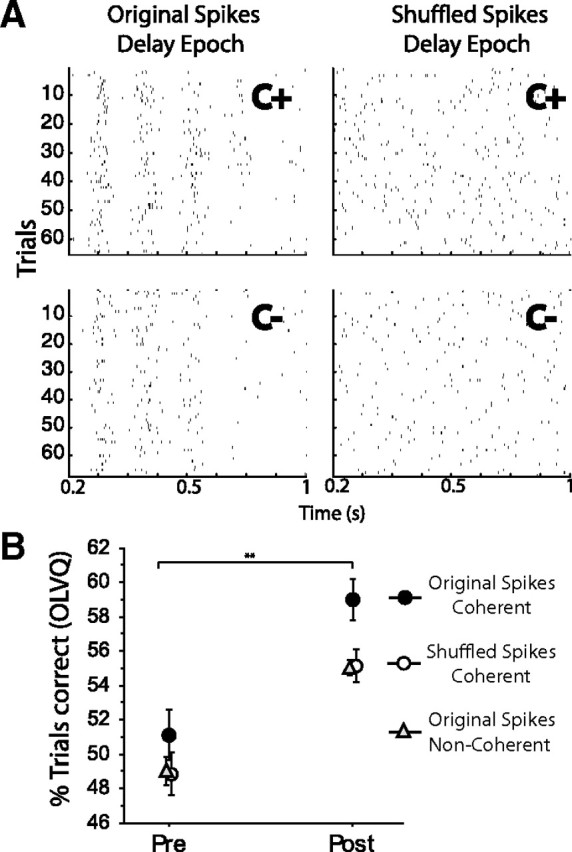
In the delay epoch, spike timing conveys the extra cue information of licking-coherent AC cue-selective in comparison with noncoherent neurons. A, Top left, Raster plot of spikes of a licking-coherent neuron in the delay epoch (plotted in Fig. 8C), C+ trials in the postlearning phase. The cue was delivered at time 0 s (data not shown). Top right, To determine whether there is more information contained in the spike timing of coherent AC cue-selective than noncoherent neurons, we shuffled the spikes for C+ trials, such that each trial had the same number of spikes as in the original raster plot, but random spike timing. It is clear that shuffling removed the spike-timing information and retained the mean firing rate. To quantify cue discrimination, the same spike shuffling procedure was performed for C− trials (bottom panels), and the OLVQ was recalculated on these shuffle spikes. In this example, the cue discrimination obtained by the OLVQ (C+ vs C−) in the postlearning phase was 71% (trials correct) using the original raster plots, whereas the cue discrimination dropped to 60% after removing spike-timing information. B plots the amount of discrimination (percentage of trials correctly classified) of all 46 coherent AC cue-selective neurons in the delay epoch as a function of learning phase (solid circles). It is seen that, when the spike-timing information is removed (by shuffling the spikes), the coherent AC cue-selective neurons showed the same level of discrimination as all 150 noncoherent AC cue-selective cells (compare open circles vs triangles). **p value of 0.01%. Error bars indicate SEM.
Therefore, it follows that the spike timing of coherent cue-selective AC neurons should be more precise than of noncoherent cue-selective cells. Indeed, we found this to be the case. In general, one can measure how precisely and reliably a neuron will fire during a lick cycle (spike-timing precision) by calculating the SD of the firing phase of the neuron: the smaller the SD of the firing phase (for a given phase of the lick cycle), the greater the spike-timing precision (Fig. 11A). By plotting the SD of the neuronal firing phase for coherent and noncoherent cue-selective cells at each lick cycle (Fig. 11B), we observed that coherent cells tended to fire with a significantly smaller SD phase than noncoherent cells (Wilcoxon's test, p < 0.05). Therefore, licking-induced synchronization likely improves taste discrimination because AC cue-selective cells, in addition to being able to discriminate cues by modulating their firing rates, also fired with higher spike-timing precision. In fact, in contrast to noncoherent cells, licking-coherent cells significantly improved the precision of their spike timing during the delay epoch (smaller SD firing phase) in the postlearning phase (Wilcoxon's test, p < 0.001) (Fig. 11C). This suggests that one of the major effects of learning the task was the reduction of spike timing variability, which consequently allowed cue-selective licking-coherent neurons to improve cue discrimination.
Figure 11.

Licking-induced neural synchronization improves spike-timing precision and this effect is potentiated after learning. A plots the coherence value against the SD exponential curve in which the larger the coherence the smaller the SD phase. Shown are two examples from both extremes. One extreme is one in which the cell fired with the largest variability (high SD phase, top raster plot) and a small coherence. This cell fired in coherence with the lick cycle, but since its SD phase is higher, its spikes (black tick marks) are neither reliable (constant) across trials nor precise with regard to the phase of the lick cycle. On the other extreme is a coherent neuron that had a smaller SD phase and a larger coherence (right raster plot). This cell tended to fire with high precision with regard to the lick cycle and greater reliability across trials. Thus, the SD phase is an indicator of how precisely and reliably (spike timing precision) a cell will fire in a lick cycle. Under this scheme, the lower the SD firing phase, the greater the spike timing precision with regard to the lick cycle. B shows the SD phase of coherent and noncoherent AC cue-selective cells for the first 16 licks in the cue compartment. The first four panels at the left are for the prelearning phase, and the right four panels are for the postlearning phase. Note that, in all 16 licks, coherent cells tend to fire with a smaller SD phase than noncoherent cells, but especially during the delay epoch (lick cycles 11–16; gray bands; see C). In this regard, noncoherent cells most frequently displayed a high SD phase. C plots the SD phase during the delay epoch as a function of learning. For visualization purposes, error bars (left panel) are truncated. The noncoherent neurons showed no significant difference between prelearning and postlearning phases (Wilcoxon's rank sum test, p > 0.05, NS). In contrast, the coherent neurons, in the postlearning phase, further improved their spike-timing precision by significantly reducing the SD phase (Wilcoxon's rank sum test, p < 0.001). The panel at the right compared the SD of the firing phase of licking-coherent neurons during lick cycles 1–10 versus lick cycles in the delay epoch (11–16) and found a significant difference between epochs (Wilcoxon's rank sum test; Z = −4.21, p < 0.0001). This suggests that, during the delay epoch, in which these coherent neurons discriminated the cues also corresponded to the epoch with the smallest spike-timing variability.
Discussion
In this paper, we addressed how a taste stimulus gains control of behavior through associative learning and how active sampling of gustatory cues, through rhythmic licking, influences neural activity across multiple brain regions. We observed that, as rats learned to perform a go/no-go taste discrimination task, neuronal responses to initially nonpredictive taste cues became more distinct and predictable in different brain areas, showing that learning induces a significant functional reorganization of neural activity throughout major components of the taste–reward circuit. We also observed that neurons that fired in synchrony with licking exhibited greater cue discrimination than nonsynchronized neurons and that this effect increased with learning. We attribute this to an enhancement in spike-timing precision of licking-coherent neurons.
We found that rats can learn to discriminate and identify two hedonically positive tastants (the cues), as well as a negatively hedonic tastant (quinine), using only a single lick comprising ∼150 ms (Halpern and Tapper, 1971) (Fig. 1B,C) (also see Results, Behavior). In contrast to this rapid response, tastants delivered via intraoral cannulae (IOCs) require a much longer time to be detected (Katz et al., 2001). One possible reason is that actively sampling tastants, by freely licking, may induce an “active brain state” (Poulet and Petersen, 2008) that integrates volition and expectation (Gutierrez et al., 2006), whereas delivering tastants via IOCs, produces a passive stimulation. In agreement with our results, previous findings in the somatosensory (Krupa et al., 2004), auditory (Eliades and Wang, 2008), olfactory (Fuentes et al., 2008), and also in the gustatory system (Wilkins and Bernstein, 2006) have clearly shown that sensory responses vary significantly according to whether animals obtain a stimulus passively or actively.
One aspect of the subjects' behavior in the cue compartment is that, after receiving the cue, rats continued to lick the empty sipper for an average of 1.2 s (or five to seven additional dry licks). This suggests that, before emitting a behavioral response, the subjects used this self-imposed time to continue accumulating information. In this regard, we found that the delay epoch contains information about the acquired predictive value of cues (Fig. 7), which may explain why rats favor accuracy over speed in a go/no-go discrimination task (Abraham et al., 2004; Friedrich, 2006).
Based on the fact that licking produces a quasiperiodic input into the CNS (4–9 Hz) (Halpern, 1983), we hypothesized that, like whisking or sniffing (Nicolelis et al., 1995; Kepecs et al., 2006; Kleinfeld et al., 2006), licking may act to fragment the flow of sensory information into discrete chunks during each rhythmic cycle. In the present study, we found neurons with activity that was phase-locked with respect to the licking rhythm (Figs. 2–4). This is in agreement with previous results in which licking-related activity was reported in the IC, AMY, and OFC (Yamamoto et al., 1988; Nishijo et al., 1998; Gutierrez et al., 2006). Some of these neurons may encode oromotor information, as they fire in synchrony with licking, independently of whether water or a cue was delivered (Fig. 4A). However, for the majority of such neurons, phase-locked activity did not arise from pure oromotor input since the neuronal activity was commonly found to be in synchrony with licking only during specific epochs of the trial. Moreover, the proportion of neurons with licking-coherent activity increased after learning. These results showed that licking behavior has a more dynamic function than previously expected. Under this new scheme, neurons in the taste–reward circuit may use a lick cycle as an internal temporal frame, and thus licking may serve to coordinate (“phase-lock”) the activity of neurons distributed across multiple brain structures.
During the task presented here, the animal is licking the entire time; however, particular ensembles of neurons, distributed over the four recorded areas, track various states of the task (Fig. 2). It follows that the distributed neural activity generates a continuous flow of information that reflects all sensorimotor transformations required to solve the task, from cue expectation, to cue detection and identification, to just before the initiation and execution of a go/no-go response. In summary, together with the anticipatory activity (BC) and phasic neurons (UC), AC neurons can completely characterize each salient epoch of the trial. We propose that, in a well rehearsed behavioral sequence, in which rats lick continuously, neuronal ensembles throughout the taste–reward circuit can represent the state-to-state transitions of the behavioral task (Sutton and Barto, 2000; Jones et al., 2007; Belova et al., 2008).
The presence of neurons with cue-expectant activity (BC) in the OFC indicates that this area has a role in monitoring relevant task events (Feierstein et al., 2006). UC neurons displayed both rapid and transient (<150 ms) responses. Although most of them were uninformative about the identity of the cue, they may be involved in cue detection. Moreover, the responses of the non-cue-selective UC neurons were modulated by learning. The functional reorganization of phasic responses observed during learning may reflect different levels of attentional processing to the cues (Ifuku et al., 2003). Together, these results indicate that phasic responses in the taste–reward network are dynamically reorganized by learning.
We found that cue selectivity could arise even after brief taste stimuli presentation and continue for ∼1 s (in the subsequent empty licks). Therefore, our results further extend previous studies (Schoenbaum et al., 1998; Setlow et al., 2003) by showing that the predictive reward value of the cues can be rapidly encoded in one single lick cycle. That is, in <150 ms, the firing of a subpopulation of phasic neurons contains sufficient information to permit subjects to obtain a reward and avoid punishment.
With respect to the neural changes that occurred with learning, the cue-selective AC responses were the most intriguing. This is because after the animal had obtained the tastants (cues), their activity contained information that may be used to discriminate among the cues. Yet animals continued to lick without getting any fluid before making the decision of whether or not to go. The OFC and the AMY contained more neurons with cue selectivity in the delay epoch followed by NAcc. In contrast, the IC, which contains the primary gustatory cortex, had the smallest proportion of cue-selective AC neurons, perhaps as a consequence of its role in gustatory processing (Ifuku et al., 2003). Thus, despite the small proportion, IC neurons also represented information about the predictive value of the cues (Fig. 7D) (Stapleton et al., 2007; Lara et al., 2009). Therefore, the predictive reward value of gustatory cues appears to be widely distributed in the OFC–AMY–NAcc–IC circuit. However, different degrees of specialization occur in this network.
We identified two types of cue-selective AC neurons: one that synchronizes with some phase of the licking cycle and a second that does not (Fig. 8). In general, cue-selective AC neurons that synchronize their activity with licking were significantly better at decoding the cue identity than noncoherent neurons (Fig. 9A). Subsequent analysis indicated that coherent cells fire with higher spike timing precision than noncoherent neurons (Fig. 11B), and it is this greater degree of spike timing that conveys the extra cue information of licking-coherent and cue-selective AC neurons (Fig. 10). In fact, after learning, the spike-timing precision of coherent, cue-selective AC-cells increased (Fig. 11C), suggesting that learning reduces spike timing variability, allowing licking-induced oscillations to enhance cue discrimination. In this regard, it has been shown that sniffing-induced neuronal oscillations (at theta rhythm) enhance stimulus discrimination by ensuring action potential precision in the olfactory system (Schaefer et al., 2006). Therefore, rhythmic behaviors associated with the two chemical senses seem to share several neuronal coding mechanisms.
The rat orbitofrontal cortex is composed exclusively of agranular cortical areas, similar to the caudal regions of monkey OFC (Ongür and Price, 2000). However, rats lack a clear homolog of the medial and rostral regions of monkeys OFC, which contain a dysgranular and granular layer IV, respectively. Based on this cytoarchitectonic evidence, it has been suggested recently that the rat OFC may be a model to study the function of the agranular most caudal region of monkey OFC (Wise, 2008), which receives inputs from olfactory and gustatory cortices (Cavada et al., 2000). In this regard, in rats, we found that licking rhythmically induced phase-locked activity across several brain regions, including the OFC. At present, it is not clear whether licking induces neuronal synchrony in nonhuman primates. However, we note that monkeys masticate rhythmically (<3 Hz), and they have cortical neurons whose firing is phase-locked to mastication and to chewing rhythms (Yao et al., 2002).
In summary, we characterized the neurophysiological correlates of a large component of the taste–reward circuit during learning of a taste-guided behavioral task. Our results suggest that, to compute the acquired predictive value throughout this circuit, appetitive and aversive associative learning appears to use synchronous activity distributed among neuronal ensembles. As such, we propose that, to understand the meaning of gustatory stimuli and to make behavioral decisions based on them, like sniffing and whisking, licking constitutes another type of active exploratory rhythmic behavior that rats use to synchronize neuronal activity across multiple brain structures.
Footnotes
This work was supported by National Institute on Deafness and Other Communication Disorders (NIDCD) Grant DC001065. We thank Jim Meloy for invaluable technical support and Susan Halkiotis and Eric Thomson for their comments on this manuscript. The content is solely the responsibility of the authors and does not necessarily represent the official views of the NIDCD or National Institutes of Health.
References
- Abraham NM, Spors H, Carleton A, Margrie TW, Kuner T, Schaefer AT. Maintaining accuracy at the expense of speed: stimulus similarity defines odor discrimination time in mice. Neuron. 2004;44:865–876. doi: 10.1016/j.neuron.2004.11.017. [DOI] [PubMed] [Google Scholar]
- Accolla R, Carleton A. Internal body state influences topographical plasticity of sensory representations in the rat gustatory cortex. Proc Natl Acad Sci U S A. 2008;105:4010–4015. doi: 10.1073/pnas.0708927105. [DOI] [PMC free article] [PubMed] [Google Scholar]
- Bathellier B, Buhl DL, Accolla R, Carleton A. Dynamic ensemble odor coding in the mammalian olfactory bulb: sensory information at different timescales. Neuron. 2008;57:586–598. doi: 10.1016/j.neuron.2008.02.011. [DOI] [PubMed] [Google Scholar]
- Belova MA, Paton JJ, Salzman CD. Moment-to-moment tracking of state value in the amygdala. J Neurosci. 2008;28:10023–10030. doi: 10.1523/JNEUROSCI.1400-08.2008. [DOI] [PMC free article] [PubMed] [Google Scholar]
- Britten KH, Newsome WT, Shadlen MN, Celebrini S, Movshon JA. A relationship between behavioral choice and the visual responses of neurons in macaque MT. Vis Neurosci. 1996;13:87–100. doi: 10.1017/s095252380000715x. [DOI] [PubMed] [Google Scholar]
- Cavada C, Compañy T, Tejedor J, Cruz-Rizzolo RJ, Reinoso-Suárez F. The anatomical connections of the macaque monkey orbitofrontal cortex. A review. Cereb Cortex. 2000;10:220–242. doi: 10.1093/cercor/10.3.220. [DOI] [PubMed] [Google Scholar]
- de Araujo IE, Gutierrez R, Oliveira-Maia AJ, Pereira A, Jr, Nicolelis MA, Simon SA. Neural ensemble coding of satiety states. Neuron. 2006;51:483–494. doi: 10.1016/j.neuron.2006.07.009. [DOI] [PubMed] [Google Scholar]
- Di Lorenzo PM, Victor JD. Taste response variability and temporal coding in the nucleus of the solitary tract of the rat. J Neurophysiol. 2003;90:1418–1431. doi: 10.1152/jn.00177.2003. [DOI] [PubMed] [Google Scholar]
- Eliades SJ, Wang X. Neural substrates of vocalization feedback monitoring in primate auditory cortex. Nature. 2008;453:1102–1106. doi: 10.1038/nature06910. [DOI] [PubMed] [Google Scholar]
- Fanselow EE, Nicolelis MA. Behavioral modulation of tactile responses in the rat somatosensory system. J Neurosci. 1999;19:7603–7616. doi: 10.1523/JNEUROSCI.19-17-07603.1999. [DOI] [PMC free article] [PubMed] [Google Scholar]
- Feierstein CE, Quirk MC, Uchida N, Sosulski DL, Mainen ZF. Representation of spatial goals in rat orbitofrontal cortex. Neuron. 2006;51:495–507. doi: 10.1016/j.neuron.2006.06.032. [DOI] [PubMed] [Google Scholar]
- Friedrich RW. Mechanisms of odor discrimination: neurophysiological and behavioral approaches. Trends Neurosci. 2006;29:40–47. doi: 10.1016/j.tins.2005.10.004. [DOI] [PubMed] [Google Scholar]
- Fuentes RA, Aguilar MI, Aylwin ML, Maldonado PE. Neuronal activity of mitral-tufted cells in awake rats during passive and active odorant stimulation. J Neurophysiol. 2008;100:422–430. doi: 10.1152/jn.00095.2008. [DOI] [PubMed] [Google Scholar]
- Gottfried JA, O'Doherty J, Dolan RJ. Encoding predictive reward value in human amygdala and orbitofrontal cortex. Science. 2003;301:1104–1107. doi: 10.1126/science.1087919. [DOI] [PubMed] [Google Scholar]
- Gregoriou GG, Gotts SJ, Zhou H, Desimone R. High-frequency, long-range coupling between prefrontal and visual cortex during attention. Science. 2009;324:1207–1210. doi: 10.1126/science.1171402. [DOI] [PMC free article] [PubMed] [Google Scholar]
- Grossman SE, Fontanini A, Wieskopf JS, Katz DB. Learning-related plasticity of temporal coding in simultaneously recorded amygdala-cortical ensembles. J Neurosci. 2008;28:2864–2873. doi: 10.1523/JNEUROSCI.4063-07.2008. [DOI] [PMC free article] [PubMed] [Google Scholar]
- Gutierrez R, Carmena JM, Nicolelis MA, Simon SA. Orbitofrontal ensemble activity monitors licking and distinguishes among natural rewards. J Neurophysiol. 2006;95:119–133. doi: 10.1152/jn.00467.2005. [DOI] [PubMed] [Google Scholar]
- Halpern BP. Tasting and smelling as active, exploratory sensory processes. Am J Otolaryngol. 1983;4:246–249. doi: 10.1016/s0196-0709(83)80066-0. [DOI] [PubMed] [Google Scholar]
- Halpern BP, Tapper DN. Taste stimuli: quality coding time. Science. 1971;171:1256–1258. doi: 10.1126/science.171.3977.1256. [DOI] [PubMed] [Google Scholar]
- Ifuku H, Hirata S, Nakamura T, Ogawa H. Neuronal activities in the monkey primary and higher-order gustatory cortices during a taste discrimination delayed GO/NOGO task and after reversal. Neurosci Res. 2003;47:161–175. doi: 10.1016/s0168-0102(03)00194-9. [DOI] [PubMed] [Google Scholar]
- Jarvis MR, Mitra PP. Sampling properties of the spectrum and coherency of sequences of action potentials. Neural Comput. 2001;13:717–749. doi: 10.1162/089976601300014312. [DOI] [PubMed] [Google Scholar]
- Jones LM, Fontanini A, Sadacca BF, Miller P, Katz DB. Natural stimuli evoke dynamic sequences of states in sensory cortical ensembles. Proc Natl Acad Sci U S A. 2007;104:18772–18777. doi: 10.1073/pnas.0705546104. [DOI] [PMC free article] [PubMed] [Google Scholar]
- Katz DB, Simon SA, Nicolelis MA. Dynamic and multimodal responses of gustatory cortical neurons in awake rats. J Neurosci. 2001;21:4478–4489. doi: 10.1523/JNEUROSCI.21-12-04478.2001. [DOI] [PMC free article] [PubMed] [Google Scholar]
- Kepecs A, Uchida N, Mainen ZF. The sniff as a unit of olfactory processing. Chem Senses. 2006;31:167–179. doi: 10.1093/chemse/bjj016. [DOI] [PubMed] [Google Scholar]
- Kleinfeld D, Ahissar E, Diamond ME. Active sensation: insights from the rodent vibrissa sensorimotor system. Curr Opin Neurobiol. 2006;16:435–444. doi: 10.1016/j.conb.2006.06.009. [DOI] [PubMed] [Google Scholar]
- Krupa DJ, Wiest MC, Shuler MG, Laubach M, Nicolelis MA. Layer-specific somatosensory cortical activation during active tactile discrimination. Science. 2004;304:1989–1992. doi: 10.1126/science.1093318. [DOI] [PubMed] [Google Scholar]
- Lara AH, Kennerley SW, Wallis JD. Encoding of gustatory working memory by orbitofrontal neurons. J Neurosci. 2009;29:765–774. doi: 10.1523/JNEUROSCI.4637-08.2009. [DOI] [PMC free article] [PubMed] [Google Scholar]
- Maruyama Y, Pereira E, Margolskee RF, Chaudhari N, Roper SD. Umami responses in mouse taste cells indicate more than one receptor. J Neurosci. 2006;26:2227–2234. doi: 10.1523/JNEUROSCI.4329-05.2006. [DOI] [PMC free article] [PubMed] [Google Scholar]
- Mogenson GJ, Jones DL, Yim CY. From motivation to action: functional interface between the limbic system and the motor system. Prog Neurobiol. 1980;14:69–97. doi: 10.1016/0301-0082(80)90018-0. [DOI] [PubMed] [Google Scholar]
- Nicola SM, Yun IA, Wakabayashi KT, Fields HL. Firing of nucleus accumbens neurons during the consummatory phase of a discriminative stimulus task depends on previous reward predictive cues. J Neurophysiol. 2004;91:1866–1882. doi: 10.1152/jn.00658.2003. [DOI] [PubMed] [Google Scholar]
- Nicolelis MA, Baccala LA, Lin RC, Chapin JK. Sensorimotor encoding by synchronous neural ensemble activity at multiple levels of the somatosensory system. Science. 1995;268:1353–1358. doi: 10.1126/science.7761855. [DOI] [PubMed] [Google Scholar]
- Nishijo H, Uwano T, Tamura R, Ono T. Gustatory and multimodal neuronal responses in the amygdala during licking and discrimination of sensory stimuli in awake rats. J Neurophysiol. 1998;79:21–36. doi: 10.1152/jn.1998.79.1.21. [DOI] [PubMed] [Google Scholar]
- Ongür D, Price JL. The organization of networks within the orbital and medial prefrontal cortex of rats, monkeys and humans. Cereb Cortex. 2000;10:206–219. doi: 10.1093/cercor/10.3.206. [DOI] [PubMed] [Google Scholar]
- Padoa-Schioppa C, Assad JA. Neurons in the orbitofrontal cortex encode economic value. Nature. 2006;441:223–226. doi: 10.1038/nature04676. [DOI] [PMC free article] [PubMed] [Google Scholar]
- Paton JJ, Belova MA, Morrison SE, Salzman CD. The primate amygdala represents the positive and negative value of visual stimuli during learning. Nature. 2006;439:865–870. doi: 10.1038/nature04490. [DOI] [PMC free article] [PubMed] [Google Scholar]
- Peciña S, Berridge KC. Hedonic hot spot in nucleus accumbens shell: where do μ-opioids cause increased hedonic impact of sweetness? J Neurosci. 2005;25:11777–11786. doi: 10.1523/JNEUROSCI.2329-05.2005. [DOI] [PMC free article] [PubMed] [Google Scholar]
- Poulet JF, Petersen CC. Internal brain state regulates membrane potential synchrony in barrel cortex of behaving mice. Nature. 2008;454:881–885. doi: 10.1038/nature07150. [DOI] [PubMed] [Google Scholar]
- Roitman MF, Wheeler RA, Wightman RM, Carelli RM. Real-time chemical responses in the nucleus accumbens differentiate rewarding and aversive stimuli. Nat Neurosci. 2008;11:1376–1377. doi: 10.1038/nn.2219. [DOI] [PMC free article] [PubMed] [Google Scholar]
- Rolls ET. Sensory processing in the brain related to the control of food intake. Proc Nutr Soc. 2007;66:96–112. doi: 10.1017/S0029665107005332. [DOI] [PubMed] [Google Scholar]
- Schaefer AT, Angelo K, Spors H, Margrie TW. Neuronal oscillations enhance stimulus discrimination by ensuring action potential precision. PLoS Biol. 2006;4:e163. doi: 10.1371/journal.pbio.0040163. [DOI] [PMC free article] [PubMed] [Google Scholar]
- Schoenbaum G, Chiba AA, Gallagher M. Orbitofrontal cortex and basolateral amygdala encode expected outcomes during learning. Nat Neurosci. 1998;1:155–159. doi: 10.1038/407. [DOI] [PubMed] [Google Scholar]
- Setlow B, Schoenbaum G, Gallagher M. Neural encoding in ventral striatum during olfactory discrimination learning. Neuron. 2003;38:625–636. doi: 10.1016/s0896-6273(03)00264-2. [DOI] [PubMed] [Google Scholar]
- Smith AC, Frank LM, Wirth S, Yanike M, Hu D, Kubota Y, Graybiel AM, Suzuki WA, Brown EN. Dynamic analysis of learning in behavioral experiments. J Neurosci. 2004;24:447–461. doi: 10.1523/JNEUROSCI.2908-03.2004. [DOI] [PMC free article] [PubMed] [Google Scholar]
- Spector AC, Klumpp PA, Kaplan JM. Analytical issues in the evaluation of food deprivation and sucrose concentration effects on the microstructure of licking behavior in the rat. Behav Neurosci. 1998;112:678–694. doi: 10.1037//0735-7044.112.3.678. [DOI] [PubMed] [Google Scholar]
- Stalnaker TA, Franz TM, Singh T, Schoenbaum G. Basolateral amygdala lesions abolish orbitofrontal-dependent reversal impairments. Neuron. 2007;54:51–58. doi: 10.1016/j.neuron.2007.02.014. [DOI] [PubMed] [Google Scholar]
- Stapleton JL, Nicolelis MA, Simon SA. Ensembles of gustatory cortical neurons anticipate and discriminate between tastants in a single lick. Front Neurosci. 2007;1:161–174. doi: 10.3389/neuro.01.1.1.012.2007. [DOI] [PMC free article] [PubMed] [Google Scholar]
- Stapleton JR, Lavine ML, Wolpert RL, Nicolelis MA, Simon SA. Rapid taste responses in the gustatory cortex during licking. J Neurosci. 2006;26:4126–4138. doi: 10.1523/JNEUROSCI.0092-06.2006. [DOI] [PMC free article] [PubMed] [Google Scholar]
- Sutton RS, Barto AG. Ed 3. Cambridge, MA: MIT; 2000. Reinforcement learning: an introduction. [Google Scholar]
- Travers JB, Dinardo LA, Karimnamazi H. Motor and premotor mechanisms of licking. Neurosci Biobehav Rev. 1997;21:631–647. doi: 10.1016/s0149-7634(96)00045-0. [DOI] [PubMed] [Google Scholar]
- Tremblay L, Schultz W. Relative reward preference in primate orbitofrontal cortex. Nature. 1999;398:704–708. doi: 10.1038/19525. [DOI] [PubMed] [Google Scholar]
- Wilkins EE, Bernstein IL. Conditioning method determines patterns of c-fos expression following novel taste-illness pairing. Behav Brain Res. 2006;169:93–97. doi: 10.1016/j.bbr.2005.12.006. [DOI] [PubMed] [Google Scholar]
- Wise SP. Forward frontal fields: phylogeny and fundamental function. Trends Neurosci. 2008;31:599–608. doi: 10.1016/j.tins.2008.08.008. [DOI] [PMC free article] [PubMed] [Google Scholar]
- Yamamoto T, Matsuo R, Kiyomitsu Y, Kitamura R. Sensory inputs from the oral region to the cerebral cortex in behaving rats: an analysis of unit responses in cortical somatosensory and taste areas during ingestive behavior. J Neurophysiol. 1988;60:1303–1321. doi: 10.1152/jn.1988.60.4.1303. [DOI] [PubMed] [Google Scholar]
- Yao D, Yamamura K, Narita N, Martin RE, Murray GM, Sessle BJ. Neuronal activity patterns in primate primary motor cortex related to trained or semiautomatic jaw and tongue movements. J Neurophysiol. 2002;87:2531–2541. doi: 10.1152/jn.2002.87.5.2531. [DOI] [PubMed] [Google Scholar]