

Abstract
The removal of albumin and other high abundance proteins is a routine first step in the analysis of serum and plasma proteomes. However, as albumin can bind proteins and peptides, there is a universal concern as to how the serum proteome is changed by the removal of albumin. To address this concern, the current study was designed to identify proteins and peptides removed from the serum during albumin depletion; to determine which of these are bound to albumin (rather than copurified) and whether the bound proteins are intact proteins or peptide fragments. Sequential, independent analyses including both anti-albumin antibody (anti-HSA) affinity chromatography and SEC were used to isolate albumin-bound proteins. RP-HPLC and 1-D SDS-PAGE were then used to further separate the proteins prior to identification by MS/MS. Finally, whole protein molecular weight (MW) MS measurements coupled with protein coverage obtained by MS were combined to assess whether the bound proteins were intact or peptide fragments. Combining the results from multiple approaches, 35 proteins, of which 24 are intact, were found to be associated with albumin, and they include both known high and low abundance proteins.
Keywords: Albumin-binding proteins, Albumin depletion, Albuminome, Anti-HAS, SEC
1 Introduction
The removal of albumin and other high abundance proteins is often an initial step in plasma and serum-based proteomics studies. Albumin is known to bind proteins, lipids, and small molecules including various peptide hormones (e.g., bradykinin, interferons, and insulin) and proteins (e.g., serum amyloid A and Streptococcal Protein G) [1–6]. Although albumin-binding peptides (below 30 kDa) in serum have been studied, the extent of their binding is currently unknown [7, 8]. To date, a comprehensive proteomics-based study of whole proteins bound to albumin has not been carried out. Partly, this is due to challenges in assessing whether a protein is intact or present as a peptide fragment. When evaluating serum proteomics studies, it is imperative to understand how the serum proteome, including both peptides and proteins, is affected by the removal of albumin. Any binding of proteins or peptides to albumin, whether specific or nonspecific, directly impacts proteomics and biomarker analyses, since the presence of both unbound and bound states of proteins in serum can affect both the clearance and the detection of the free-state proteins/peptides. Therefore, quantitative studies conducted in terms of biomarker analyses could be affected by binding to albumin. Furthermore, the ratio of bound to unbound forms of a particular protein could be indicative of disease or immune response. Since this would likely be representative of changes to the intrinsic properties of these proteins and their interactions with albumin, the “albuminome” (albumin and its bound proteins and peptides) could therefore become a useful tool in biomarker discovery.
There are two primary methods available for isolating albumin from serum: affinity-based (e.g., antibody, cibacron blue) and chemical-based methods (e.g., NaCl/EtOH [9, 10] TCA/acetone [11]). Many of the affinity-based methods have been compared and shown to effectively remove albumin [7, 12, 13]. However, these methods are vulnerable to non-specific binding of proteins/peptides to the ligand and column materials and carryover between experiments in the case of LC columns [7, 10, 12–15]. Alternatively, albumin has been purified using NaCl/EtOH since the 1940s [16] and this method is routinely used for isolating pharmaceutical grade albumin. Recently, this process was optimized for the proteomics field to minimize the steps required for effective purification and removal of albumin [9], but copurification of other proteins may still be an issue.
The goal of this study was to unambiguously define the proteins/peptides bound to albumin in healthy human samples. Specifically, to identify proteins/peptides removed from serum during albumin depletion; to determine which are bound to albumin (rather than copurified), and whether the bound proteins are intact proteins or peptide fragments. Sequential, independent analyses were used to determine which proteins were bound to albumin, followed by a comparison of the methods to then validate the bound proteins. Initially, an albumin-enriched fraction from serum was isolated using the chemical-based extraction method. Utilizing the chemical extraction method first allowed multiple, independent, downstream efforts to specifically select for albumin-binding proteins. These downstream methods included (i) anti-HSA antibody affinity chromatography for isolating albumin and its bound proteins/peptides and (ii) SEC for isolating albumin-binding protein–albumin complexes. Additional protein separation was carried out by 1-D SDS-PAGE and/or RP-HPLC, further fractionating the samples prior to protein identification by MS/MS in order to maximize protein coverage. Coupling the PMF and MS/MS data (used for identification) to the MALDI-TOF MS MW measurements of whole (prior to digestion) protein masses, collectively allowed for an assessment of whether the intact protein or a peptide fragment was bound to albumin.
Other studies examining the proteins and peptides that are removed during albumin depletion using either dye-based methods [17] or antibody-based methods [8] have been published, though their scope is limited to low MW species, typically below 30 kDa. Unfortunately, dye-based methods are not sufficiently specific for albumin as it also binds NAD, FAD, and ATP-binding sites on proteins [18, 19] and therefore, cannot be used for definitively examining albumin-bound proteins [9, 10, 14, 20, 21]. Furthermore, the shortcomings of focusing only on low MW species for biomarker discovery have recently been presented, namely, that the majority of the peptides in this MW range are from highly abundant species [22], not low abundance biomarkers. Additionally, some documented albumin-binding proteins are larger than 30 kDa (e.g., paraoxonase 1, clusterin, and apolipoprotein E [23–25]), and therefore, the methods described here were designed to cover the complete mass range. The major finding resulting from the current work was the identification of 35 albumin-binding proteins, including 24 intact proteins.
2 Materials and methods
The methods utilized, and their corresponding objective, are outlined in Fig. 1. The goal of study I was to identify the maximum number of proteins present in the albumin-enriched fraction and the goal of study II was to determine whether the proteins in the albumin-enriched fraction copurified or were bound to albumin. Data provided in the Supporting Information are indicated by the notation “sup” after the table or figure number (e.g., Table 1sup).
Figure 1.

Methods described for the characterization of the albumin-enriched fraction and their corresponding objectives.
2.1 Serum samples and albumin extraction
A sample consisting of pooled normal human sera from Serological Corporation (Norcross, GA, USA) was used throughout the study because it could be obtained in large quantities, has been well characterized by other methods in our laboratory, and also provided for a broad view of the albumin-binding proteins in serum from healthy samples. Albumin depletion by chemical extraction was performed as described by Fu et al. [9]. Briefly, 100 μL normal human serum was depleted of lipids via centrifugation, followed by depletion of IgG using a protein G affinity column (Amersham Biosciences, Piscataway, NJ, USA). IgG depleted serum was brought to 42% ethanol/100mM NaCI and incubated at 4°C for 1 h followed by centrifugation at 16 000 × g for 45 min. The supernatant (albumin-enriched fraction) was collected and used for the work presented here.
2.2 Protein separation
2.2.1 SEC
A System Gold (Beckman Coulter, Fullerton, CA, USA) HPLC system was used for all chromatographic separations. Native nondenaturing SEC was used to separate the albumin-enriched fraction by size, as larger proteins will spend less time on the column and elute earlier than smaller proteins and peptides. Under native conditions, it is expected that those proteins and peptides bound to albumin will elute in the fraction(s) containing albumin, while those unbound will elute separately from albumin, consistent with their native MWs. For size exclusion experiments, a BioSep-SEC-S2000, fractionation range 1000–300 000 (Phenomenex, Torrance, CA, USA), 300 mm × 21.2 mm column was used. Mobile phase was 50 mM phosphate buffer, pH 6.8. To determine the appropriate loading volume and flow rate for optimal separation, protein standards (myosin, β-galactosidase, phosphorylase b, bovine albumin, ovalbumin, and carbonic anhydrase), and DTT were run with various injection volumes (100 μL–2.5 mL) at a range of flow rates (0.5–3.5 mL/min). Using 100 μL injection volumes with a flow rate of 1.0 mL/min allowed for successful separation of a wide range of proteins (29–205 kDa) with good resolution, as illustrated by well-separated peaks in Fig. 2A. The albumin-enriched fraction (1.0 mL) was dried via SpeedVac and resuspended in 200 μL mobile phase. Albumin-enriched fraction (100 μL) was injected and run at 1.0 mL/min with 1 min fractions collected. This was repeated and identical fractions were pooled and concentrated via SpeedVac to a final volume of 200 μL before continuing on with SDS-PAGE or RP-HPLC. The separation of the albumin-enriched fraction by SEC was repeated a total of 14 times, with a minimum of two runs pooled prior to further downstream separations. The albumin-enriched fraction separated into four regions (A–D) by SEC, with the major peak eluting at a time consistent with being slightly larger than the 66 kDa standard protein (Fig. 2B). A benefit of SEC is that it is highly reproducible, as can be seen in Fig. 2C. The SEC fractions (A–D) were then analyzed by both 1-D SDS-PAGE and RP-HPLC followed by MALDI-TOF MS and LC-MS/MS in order to further characterize their contents. Only the center portions of the SEC fractions A and C were chosen in order to eliminate overlap from adjacent peaks.
Figure 2.

SEC chromatograms (absorbance at 214 nm) of protein standards (panel A) and the albumin-enriched fraction overlaid on protein standards (panel B). Panel C shows chromatograms of four independent injections of the albumin-enriched fraction showing reproducibility of SEC.
2.2.2 Anti-HSA affinity resin
The albumin-enriched fraction was processed via Vivapure anti-HSA affinity resin in Vivaclear 0.8 μm pore columns (VivaScience, NY, USA). The spin-columns were loaded with 400 μL affinity resin. Albumin-enriched fraction (50 μL) was mixed with 150 μL binding buffer provided by Vivascience or 150 μL of 50 mM phosphate buffer, pH 6.8 (i.e., SEC buffer) prior to binding to the resin for 15 min on a rotary shaker. The column was centrifuged and the flow-through collected. The resin was washed twice with 200 μL binding buffer and this wash solution was combined with the flow-through. Albumin and any other bound proteins/peptides were released from the column using two incubations of 300 μL of 12 mM HCl and collected (retentate). This process was performed simultaneously in 30 spin-columns, for a total starting material of 1.5 mL albumin-enriched fraction. Unbound proteins and peptides (flow through) were collected and purified using a single step gradient, 0%B for 10 min, 80%B in 0.1 min for 20 min on an RP-HPLC C18 column as described below. The fractions were then concentrated via SpeedVac to 10 μL before being analyzed by MALDI-TOF MS. The retentate was concentrated via Speed-Vac prior to further separation by a modified sawtooth RP-HPLC gradient (described below) or intact mass measurements by MALDI-TOF MS. Two other experiments were also performed in which the anti-HSA column was used with Vivascience buffer with a total starting material of 1.2 mL over six spin-columns and 1.6 mL over eight spin-columns, followed by separation by linear RP-HPLC. In summary, the experiment using the anti-HSA column with the Vivascience buffer was repeated three times prior to RP-HPLC separation (once prior to modified sawtooth, twice prior to linear gradient). Additionally, the anti-HSA experiment was conducted using SEC buffer (in place of the Vivascience-binding buffer) in three separate experiments, each using 0.5 mL over ten spin-columns.
2.2.3 RP-HPLC
In order to further clean and separate the proteins/peptides, fractions from the SEC, anti-HSA resin retentate, and whole albumin-enriched fraction were separated by RP-HPLC using a Jupiter 300 Å C18, 250 mm × 4.6 mm column (Phenomenex). Mobile phase (A = 0.1% TFA in water, B = 0.1% TFA in ACN) was run 30%B for 10 min, 30–90%B in 40 min, 90%B for 20 min at 1 mL/min with one min fractions collected for the linear gradient. The conventional linear gradient was not successful in separating albumin from other proteins/peptides (Fig. 3A) in the whole albumin-enriched fraction. The presence of albumin as the major protein in most of the RP-HPLC fractions made identification of other proteins difficult. Therefore, an alternative gradient was sought to better separate albumin from the remaining components. A novel sawtooth gradient [26], developed to reduce the peak broadening observed in typical step-gradients, was used. When used as originally reported, the sawtooth gradient was successful in better separating the albumin-enriched fraction (data not shown). However, further optimization of the sawtooth gradient (i.e., modified sawtooth) allowed for far superior separation of the whole albumin-enriched fraction than could be obtained with the linear gradient (Fig. 3B). The modified sawtooth gradient ran 40%B for 35 min, increased to 55%B in 6 min, decreased to 50%B in 3 min, held at 50%B for 8 min, increased to 65%B in 10 min, decreased to 60%B in 3 min, held at 60%B for 8 min, increased to 75%B in 6 min, decreased to 70%B in 3 min, held at 70%B for 6 min, increased to 100%B in 5 min, held at 100%B for 5 min, decreased to 0%B in 5 min at 0.2 mL/min with 30 s or 1 min fractions collected. The modified sawtooth gradient was superior to the linear gradient and was therefore used for all separations prior to protein digestion.
Figure 3.

RP-HPLC chromatograms (absorbance at 214 nm (thin line) and 280 nm (bold line)) of the albumin-enriched fraction using linear (A) or modified sawtooth gradients (B).
2.2.4 1-DE and Western blotting
For the separation of the SEC fractions and anti-HSA retentate, 5 μL from each fraction were diluted with 1 × LDS sample buffer (Invitrogen, Carlsbad, CA, USA). Samples were either loaded directly (nonboiled) or were boiled first for 10 min before being loaded onto precast 4–12% NuPAGE gels. Silver staining was performed according to Shevchenko et al. [27]. Briefly, gels were fixed for a minimum of 30 min in 50% methanol, 5% acetic acid followed by 10 min in 50% methanol, and 2 × 10 min washes with distilled, deionized water (ddH2O) followed by a longer ddH2O wash of 1 h up to overnight. Gels were sensitized for 1 min in 0.02% sodium thiosulfate followed by 2 × 1 min washes with ddH2O, and then incubated for 20 min in chilled 0.1% silver nitrate. After 2 × 40 s washes with ddH2O, gels were visualized by several washes with chilled 2% sodium carbonate, 0.04% formalin, and stopped in 5% acetic acid. Gels were dried between sheets of cellophane under vacuum at 80°C for 2 h. For the gel used for visualizing the albumin-enriched fraction and for Western blotting, increasing volumes (volume indicated in Fig. 1sup) were loaded directly onto a 5% acrylamide stacking gel. Proteins were resolved overnight in a 17 cm 10% acrylamide gel at 75 V until the dye reached the bottom of the gel. Gel-electrophoresis-separated proteins were transferred to PVDF membranes (Immobilon-P Membrane, Millipore, Billerica, MA, USA) in the presence of 1 × NuPAGE® Transfer buffer and 20% methanol in a Trans-Blot Cell apparatus (BioRad, Hercules, CA, USA). The primary antibody (0.5 μg/mL anti-HSA) was purchased from Sigma (Clone HSA-11, Sigma, St. Louis, MO, USA). Horse-radish peroxidase conjugate antimouse Ig was used as the secondary antibody. Signals were visualized with chemiluminescence detecting reagents (ECL Plus, Amersham Biosciences) and X-Omat Scientific Imaging Film (Eastman Kodak, Rochester, NY, USA).
2.3 Protein identification
2.3.1 Tryptic digestion and sulfonation
Tryptic digestion and peptide extraction from the gel bands were performed according to Shevchenko et al. [27]. Only visibly stained gel bands were excised for further examination. Briefly, the gel band was rehydrated in water and the cellophane removed. Selected gel bands were cut out and then destained in 15 mM potassium ferricyanide/50 mM sodium thiosulfate, followed by washing with water and dehydration with ACN. The gel band was incubated for 45 min at 55°C with 10 mM DTT, followed by incubation with 55 mM iodoacetamide in 25 mM (NH4)HCO3 for 30 min at room temperature. Gel bands were washed and dehydrated with 50% ACN in 50 mM (NH4)HCO3. After drying bands in a SpeedVac, tryptic digestion was performed with 300 ng trypsin in 50 mM (NH4)HCO3 at 4°C for 30 min, followed by overnight incubation at 37°C. Peptides were extracted with 50% ACN in 1.0% TFA. For in-solution digestion, 190 μL from each RP-HPLC fraction was dried via SpeedVac and resuspended in 20 μL of 25 mM (NH4)HCO3. Proteomics-grade trypsin (500 ng, Sigma) was added and the mixture was incubated at 37°C overnight. Prior to analysis by MALDI-TOF MS and MS/MS, all digested samples were cleaned and concentrated using an OMIX (Varian, Palo Alto, CA, USA) C18 pipette tip according to the manufacturer’s instructions. For in-gel and in-solution digest samples for LC-MS/MS, samples were dried via SpeedVac before proceeding.
Peptide fragmentation and its interpretation for identification can be improved by forming the N-terminal-sulfonated derivatives of the tryptic peptides, which results in the production of exclusively y-type ions, and therefore allows for denovo sequencing. Where necessary or advantageous, we used the method described by Wang et al. [28]. After digestion with trypsin, 5 μL of 10 μg/μL 4-sulfophenyl iso-thiocyanate (Sigma) in a 20 mM NaHCO3 solution was added and incubated for 30 min at 55°C. One microliter of 1.0% TFA was added to stop the reaction. Samples were cleaned via OMIX (Varian) C18 pipette tip according to manufacturer’s instructions and analyzed by MALDI-TOF MS/MS.
2.3.2 MALDI-TOF MS/MS and LC-MS/MS
An Axima CFR (Kratos Analytical, Manchester, UK) MALDI-TOF mass spectrometer was used for PMF and MS/MS analyses. For PMF and MS/MS analyses, 2 μL of desalted/concentrated, digested sample was mixed with 1 μL CHCA (1:1 dilution of saturated solution) in 50% EtOH/50% ddH2O. To each spot, 125 fmol of a standard peptide mix was added and four-point internal calibration was used. For each sample, 100 profiles (averaging five shots per profile) were acquired to obtain a spectrum of the tryptic digest for PMF. For MS/MS, 300 profiles (averaging ten shots per profile) were obtained. MS/MS was attempted on all peaks with S/N greater than 5:1.
For LC-MS/MS experiments on the LCQ Duo (Thermo-Finnigan, San Jose, CA, USA), peptides from the digestion of RP-HPLC fractions and in-gel digestion were resuspended in 20 and 10 μL, respectively, in 3% ACN in 0.1% formic acid. Samples (1 μL for HPLC fractions, 5 μL for gel bands) were loaded onto a 0.075 cm × 10 cm PicoFrit Biobasic, C18 column (New Objective, Woburn, MA, USA). Peptides were eluted into an LCQ Duo, equipped with a nanosource (Proxeon, Denmark), using an Agilent (Palo Alto, CA, USA) 1100 series nano-HPLC system. The flow rate at the emitter was 300 nL/min. The HPLC gradient was 3%B for 5 min, then 3–15%B for 6 min, then 15–45%B for 120 min, for HPLC fraction digests and 3%B for 5 min, then 3–8%B for 3 min, then 8–50%B for 40 min for gel bands digests, where buffer A was 0.1% formic acid in water and buffer B was 0.1% formic acid in ACN. The mass spectrometer was operated in data-dependent mode in which every MS scan (survey 400–1800 Da) was followed by MS/MS scans of the three most abundant ions. The dynamic exclusion option was selected with a repeat count of one and duration of 30 s. Since the most abundant ions may be found in overlapping fractions, this option excludes for a set period of time the MS/MS scanning of peaks in subsequent fractions for which MS/MS analyses have already been carried out.
For LC-MS/MS experiments on the LTQ (ThermoFinnigan), peptides from the RP-HPLC digestion of the whole albumin-enriched fraction were resuspended in 7.5 μL buffer A/buffer B (97.5:2.5), where buffer A was 0.1% formic acid in water and buffer B was 0.1% formic acid in ACN. Samples (6.4 μL) were loaded onto a 0.01 cm × 10 cm Hypersil column packed with C18 beads (ThermoFinnigan). Peptides were eluted into an LTQ (ThermoFinnigan) with a MicroAS HPLC system (ThermoFinnigan). A precolumn splitter was used so that the flow rate at the emitter was 300 nL/min. The HPLC gradient was 5–60%B over 30 or 60 min. The mass spectrometer was operated in data-dependent mode in which every MS scan (survey 350–1700 Da) was followed by MS/MS scans of the ten most abundant ions. The dynamic exclusion option was selected with a repeat count of one and duration of 20 s. To confirm the presence of any proteins identified by a single peptide in the LTQ experiment, a repeat experiment of the RP-HPLC digestion of the whole albumin-enriched fraction was conducted with shorter fractions (30 s) collected, and using the LCQ as described previously.
2.3.3 Data processing, searching, analysis, and presentation
For MALDI-TOF MS and MALDI-TOF MS/MS, data processing and peak selections were performed using MASCOT Distiller (v. 1.1.2.0, MatrixScience). Peak processing criteria were as follows: minimum S/N = 3 (MS/MS), 50 (PMF); regridding (i.e., smoothing) = 1 (MS/MS), 20 (PMF); minimum peak width = 0.1(MS/MS), 0.01 (PMF). For each sample, the peak list containing monoisotopic peptide masses (i.e., PMF data) was combined with the MS/MS data in a single search using the Sequence Query function of MASCOT. Searches were performed against the current NCBI nonredundant protein database (5/11/2005, 2449518 sequences), with species limited to Homo sapiens, enzyme limited to trypsin with one maximum missed cleavage, peptide tolerance of 1 Da, fragment tolerance of 0.8 Da. For the LC-MS/MS data, peak processing was performed using the default import filter in MASCOT Daemon for Thermo LCQ data files (grouping tolerance = 1.4, intermediate scan = 2, min scans/group = 1). Searches were performed against the current NCBI nonredundant protein database (10/12/2005, 2449518 sequences), with species limited to Homo sapiens, enzyme limited to trypsin with two maximum missed cleavages, peptide charges +2, +3, peptide tolerance of 2 Da, fragment tolerance of 0.8 Da. For all searches, phosphorylation (Tyr, Thr, and Ser) and oxidation were allowed variable modifications. Keratins and immunoglobulins were ignored and are not included in the final protein identification list.
Table 1sup lists the proteins, and their characteristics, observed in the albumin-enriched fraction of human serum. A more detailed list of the proteins identified, including their corresponding peptides and all relevant information regarding data quality, separation technique, and mass spectrometer used are provided in accordance with guidelines outlined by Carr et al. [29] in the Figs. 3sup–7sup. Protein name, accession numbers, predicted unprocessed MW, and sites of expression and localization were obtained from www.hprd.org and crosschecked against www.expasy.uniprot.org. The predicted MW of the processed form of each protein, if applicable, was calculated using the Kompact software (Kratos Analytical, v.2.3.4) and the pI was calculated using http://us.expasy.org/tools/pi_tool.html. Individual protein concentration assays were not conducted in this study. However, normal concentrations of the proteins in serum or plasma if found in the literature (Laboratories, S., Directory of Services, and Use and Interpretation of Tests, Santa Monica, CA) [30–56], are reported in the manner as Anderson et al. [31], whereby concentrations are mean values when provided or they are the geometric average of high and low normal values when provided as a range. The normal serum or plasma concentration for a majority of the cellular proteins was not available. However, it was assumed that these proteins would be present at concentrations similar to those observed for cellular protein cardiac TnI (<1.5 ng/mL) (Laboratories, S., Directory of Services, and Use and Interpretation of Tests, Santa Monica, CA) in normal serum. Therefore, the normal serum concentrations for cellular proteins are listed here as the range 1E + 1 to 1E + 3 pg/mL.
Protein identifications returned from MASCOT were manually examined and filtered to create a confirmed non-redundant list. First, search results were limited by ignoring any peptides with an ion score below 20 and requiring at least one bold, red peptide per protein by appending the following URL tag to the end of the command line in the internet search engine: “&_ignoreionsscorebelow=20&_requireboldred=1”. Following the selection of only significant identifications, the sequences of any hypothetical or unnamed proteins were searched against the NCBInr database, with species limited to humans, using the basic local alignment search tool (BLAST). All proteins reported as hypothetical or unnamed by MASCOT were subsequently identified in this manner. Finally, all protein names obtained from MASCOT were searched against www.hprd.org to eliminate alternate or redundant protein names. For each protein reported, at least one peptide with minimum ion score of 40 was required, though all unique peptides with ion scores >20 are listed in the Supporting Information. Peptides modified by phosphorylation, but not oxidation or carbamidomethylation, were counted separately from the unmodified version. Following the removal of peptides with unacceptable ion scores and redundant peptides, the overall MASCOT score was recalculated as the sum of the ion scores for the individual peptides attributed to the particular protein. Annotated spectra are provided (via hyperlink within the PDF document) in the Supporting Information for all single-peptide matches and for any phosphorylated peptides.
Proteins were included if they were identified by (i) two or more peptides in one or more RP-HPLC fractions, (ii) or a single peptide observed in multiple RP-HPLC fractions from multiple sample sources (i.e., whole albumin-enriched fraction and SEC or anti-HSA retentate), (iii) or a single peptide from a single RP-HPLC fraction that met the following criteria: (a) ion score was greater than 40, (b) the mass spectrum for that peptide was examined manually for quality and number of fragment matches, and (c) the peptide contained a minimum of eight residues. The peptide sequences from all single-peptide matches were searched against the NCBInr database, with species limited to mammals, using the BLAST search, and found to match only the reported protein.
For the tables containing the proteins identified after separation by RP-HPLC, only the best example of each protein from the entire chromatogram is presented, though the protein may have been observed in multiple fractions. For some proteins, only a single peptide was in the fraction that gave the highest score for that protein. However, if a peptide(s) from that protein was found in other fractions, the protein is considered to be matched by multiple peptides and that is denoted in the table containing the identifications from the whole albumin-enriched fraction (Fig. 3sup). For the tables containing proteins identified after separation by 1-D SDS-PAGE, all proteins found in each band are listed along with corresponding band number. The database containing proteins found in the anti-HSA retentate is a combination of all identifications from experiments with both binding buffers.
2.4 Intact molecular weight studies by MS
Following the RP-HPLC separation of the whole albumin-enriched fraction and anti-HSA retentate, each fraction was dried via SpeedVac to approximately 20 μL volume, and 5 μL was removed for intact MW studies. The Axima CFR MALDI-TOF mass spectrometer was used for intact MW mass measurements below 150 kDa. For the Axima CFR, samples (2 μL) were spotted via layering method with 0.6 μL saturated ferulic acid (FA) matrix in 50% ethanol/50% water. Using automatic rastering, 75 profiles, with five shots per profile, were acquired for mass ranges of 0–25 and 20–150 kDa. A Macromizer™ (Comet, Switzerland) MALDI-TOF mass spectrometer, equipped with a cryocooled detector was used for its ability to detect high mass ions and enhanced detection of multiple ions in a complex sample. Samples (2 μL) were spotted via layering method with 0.6 μL saturated FA matrix in 70% ACN in 1.5% formic acid. Using automatic rastering, 300 profiles were acquired for mass range 10–500 kDa.
3 Results and discussion
3.1 Biological questions
The current study was designed to identify proteins and peptides present in the albumin-enriched fraction; to determine which are bound to albumin (rather than copurified) and, furthermore, to determine whether they are intact proteins or peptide fragments. The initial step was to determine the composition of the albumin-enriched fraction isolated using the modified classical EtOH/NaCl method. This albumin-enriched fraction was further separated by two methods: (i) anti-HSA antibody affinity chromatography for isolating albumin and its bound proteins/peptides and (ii) SEC for isolating albumin-binding protein–albumin complexes. Only those proteins identified both in the high MW albumin complexes isolated by SEC and present in the anti-HSA retentate were considered to be unambiguously associated with albumin. Of course, the other proteins present in the albumin-enriched fraction could be bound to albumin in vivo and these protein interactions were interrupted during the complex downstream sample processing. Finally, whole protein MW measurements coupled with protein coverage obtained by MS were combined to assess whether the bound proteins were intact or peptide fragments.
3.1.1 Study I: Protein composition of the albumin-enriched fraction
Although 94% of the protein content in the albumin-enriched fraction is comprised of albumin (Fu et al., fig. 3 [9]), the remaining 6% consist of an additional 120 nonredundant proteins that were identified by either RP-HPLC separation or 1-D SDS-PAGE of the whole albumin-enriched fraction (119 proteins) or exclusively detected in both the SEC and anti-HSA retentate (one protein). This number excludes albumin, keratins, and the various immunoglobulins (Table 1sup). A majority (n = 90) of the additional proteins in the albumin-enriched fraction are extracellular proteins, while 30 are cellular proteins (Fig. 9supA). This latter group includes transport proteins (n = 23), enzymes (n = 16), and protease inhibitors (n = 15) (Fig. 9supB). While many of the proteins present in the albumin-enriched fraction are high abundance proteins, such as alpha-1-antitrypsin and transferrin, lower abundance proteins such as fibrinogen, alpha chain (normally 9.0E + 2 pg/mL), and angiotensinogen (normally 1.5E + 6 pg/mL) as well as cellular proteins including actin and tubulin were identified. Further details, including peptide sequences observed and all corresponding information, can be found in the Supporting Information accompanying this manuscript (whole albumin-enriched fraction, Fig. 3sup; anti-HSA retentate, Fig. 4sup; SEC A, Fig. 5sup; SEC B, Fig. 6sup; and SEC C, Fig. 7sup). For simplicity of data presentation, only data from the LC-MS/MS experiments are provided as all proteins identified by MALDI-TOF MS/MS were also identified via LC-MS/MS.
3.1.2 Study II: Which proteins are bound to albumin? What is in the albuminome?
Multiple independent methods (Fig. 1) were compared in order to assess whether any of the proteins in the albumin-enriched fraction were associated with albumin following isolation by the chemical extraction method. First, an anti-HSA affinity column was used to isolate albumin and any bound proteins from the albumin-enriched fraction. Second, SEC was used to confirm the results from the anti-HSA experiment and was chosen because it has minimal non-specific binding coupled with the ability to sort protein complexes by size under native conditions.
The anti-HSA affinity resin is marketed to specifically remove >95% of albumin from human serum with no crossreactivity to other serum proteins. Predictably, by passing the albumin-enriched fraction over the anti-HSA column, those proteins and peptides not bound to albumin would flow through and those bound to albumin would remain bound to albumin as it binds to the column. Since albumin was found in the anti-HSA column flow-through, this fraction could not be utilized to determine those proteins/peptides which were not bound and was therefore, not used in further experiments. The proteins and peptides bound to the anti-HSA column (i.e., retentate) were analyzed directly by MALDI-TOF MS and also further separated by 1-D SDS-PAGE (Figs. 4G and H, Fig. 2sup) and RP-HPLC (Fig. 4B) prior to MALDI-TOF MS/MS and LC-MS/MS. The RP-HPLC gradient was optimized for separating albumin from the remaining components. Furthermore, using both RP-HPLC and 1-D SDS-PAGE for separating the proteins allowed for enhanced detection and identification of other proteins by MS. The anti-HSA affinity experiment was repeated using both the binding buffer provided by Vivascience, which is optimized for binding of albumin to the column, and also the same buffer used in the SEC experiment (50 mM phosphate buffer, pH 6.8). Each of these techniques revealed a number of other proteins present in the retentate in addition to albumin (Table 1, Fig. 4sup). The pitfalls of using anti-HSA resin are that the overabundance of albumin makes it challenging to identify every other protein present and also that the proteins/peptides bound to albumin may change as a result of albumin binding to the column. Nevertheless, it was valuable to identify the proteins present in the anti-HSA retentate and compare them to the proteins identified in the SEC fractions containing albumin to determine which proteins are associated with albumin.
Figure 4.

Comparison of the various fractions of the albumin-enriched fraction. RP-HPLC chromatograms (absorbance at 214 (thin line) and 280 nm (bold line)) of the whole albumin-enriched fraction (A), anti-HSA retentate (B), SEC fraction A (C), SEC fraction B (D), SEC fraction C (E), and SEC fraction D (F). Inset shows SDS-PAGE of nonboiled samples (G) or boiled samples (H) of SEC fractions A–D, anti-HSA retentate, and whole albumin-enriched fraction.
Table 1.
Proteins associated with albumin
| Protein | Whole fraction | SEC A | SEC B | SEC C | Anti-HSA retentate | Bound? | Coverage |
|---|---|---|---|---|---|---|---|
| Retinol-binding protein | ✓ | ✓ | Yesa | INTACT | |||
| Alpha-2-antiplasmin | ✓ | ✓ | ncb | 17% | |||
| Apolipoprotein E | ✓ | ✓ | ncb | 18% | |||
| Apolipoprotein L1 | ✓ | ✓ | ncb | 11% | |||
| Beta thromboglobulin | ✓ | ✓ | ncb | 35% | |||
| Carbonic anhydrase I | ✓ | ✓ | ncb | INTACT | |||
| Complement component 3 | ✓ | ✓ | ncb | 13% | |||
| Complement factor B | ✓ | ✓ | ncb | 15% | |||
| Desmoplakin | ✓ | ✓ | ncb | 12% | |||
| Fibrinogen, alpha chain | ✓ | ✓ | ncb | SINGLE | |||
| Gelsolin | ✓ | ✓ | ncb | INTACT | |||
| Histidine-rich glycoprotein | ✓ | ✓ | ncb | 9% | |||
| Lumican | ✓ | ✓ | ncb | INTACT | |||
| Prothrombin | ✓ | ✓ | ncb | SINGLE | |||
| Serum Amyloid A4 | ✓ | ✓ | ncb | 32% | |||
| Vitronectin | ✓ | ✓ | ncb | 6% | |||
| Afamin | ✓ | ✓ | ✓ | ✓ | Yes | 18% | |
| Alpha-1-acid glycoprotein 1 | ✓ | ✓ | ✓ | ✓ | Yes | INTACT | |
| Alpha-1-acid glycoprotein 2 | ✓ | ✓ | ✓ | Yes | 34% | ||
| Alpha-1-antichymotrypsin | ✓ | ✓ | ✓ | ✓ | Yes | INTACT | |
| Alpha-1-antitrypsin | ✓ | ✓ | ✓ | ✓ | Yes | INTACT | |
| Alpha-1B-glycoprotein | ✓ | ✓ | ✓ | ✓ | ✓ | Yes | INTACT |
| Alpha-2HS-glycoprotein | ✓ | ✓ | ✓ | ✓ | ✓ | Yes | INTACT |
| Angiotensinogen | ✓ | ✓ | ✓ | Yes | 21% | ||
| Antithrombin III | ✓ | ✓ | ✓ | ✓ | Yes | INTACT | |
| Apolipoprotein A I | ✓ | ✓ | ✓ | ✓ | Yes | INTACT | |
| Apolipoprotein A II | ✓ | ✓ | ✓ | Yes | INTACT | ||
| Apolipoprotein A IV | ✓ | ✓ | ✓ | ✓ | Yes | INTACT | |
| Apolipoprotein C II | ✓ | ✓ | ✓ | Yes | INTACT | ||
| Apolipoprotein C III | ✓ | ✓ | ✓ | Yes | INTACT | ||
| Carboxypeptidase B2 | ✓ | ✓ | ✓ | Yes | 12% | ||
| Ceruloplasmin | ✓ | ✓ | ✓ | ✓ | Yes | INTACT | |
| Clusterin | ✓ | ✓ | ✓ | Yes | INTACT | ||
| Complement component 1 inhibitor | ✓ | ✓ | ✓ | Yes | INTACT | ||
| Complement component 4A | ✓ | ✓ | ✓ | Yes | 9% | ||
| Haptoglobin | ✓ | ✓ | ✓ | ✓ | ✓ | Yes | INTACT |
| Hemoglobin, alpha | ✓ | ✓ | ✓ | ✓ | Yes | INTACT | |
| Hemoglobin, beta | ✓ | ✓ | ✓ | ✓ | ✓ | Yes | INTACT |
| Hemopexin | ✓ | ✓ | ✓ | ✓ | ✓ | Yes | INTACT |
| Hornerin | ✓ | ✓ | Yes | SINGLE | |||
| Inter alpha trypsin inhibitor heavy chain H4 | ✓ | ✓ | ✓ | ✓ | Yes | 20% | |
| Kininogen | ✓ | ✓ | ✓ | Yes | 11% | ||
| Leucine-rich alpha 2 glycoprotein | ✓ | ✓ | ✓ | Yes | INTACT | ||
| Paraoxonase 1 | ✓ | ✓ | ✓ | ✓ | Yes | 26% | |
| Peptidoglycan recognition protein 2 | ✓ | ✓ | ✓ | ✓ | Yes | 30% | |
| Plasminogen | ✓ | ✓ | ✓ | Yes | 27% | ||
| Transferrin | ✓ | ✓ | ✓ | ✓ | ✓ | Yes | INTACT |
| Transthyretin | ✓ | ✓ | ✓ | ✓ | ✓ | Yes | INTACT |
| Vitamin D-binding protein | ✓ | ✓ | ✓ | Yes | INTACT | ||
| Zinc alpha 2 glycoprotein | ✓ | ✓ | ✓ | Yes | INTACT |
Fractions in which the proteins were observed are denoted. Protein sequence coverage is indicated as either INTACT (intact protein MW was observed by MALDI and >30% sequence coverage), SINGLE (single peptide in multiple fractions was observed for this protein), or Percentage (when more than a single peptide was observed but there was not enough evidence to conclude the intact form is present).
Retinol-binding protein (MW = 22 kDa) is a known albumin-binding protein. It is the only protein that was observed in the SEC but absent in anti-HSA to be concluded as bound to albumin.
Proteins found in Anti-HSA retentate (indicating bound to albumin) but absent in SEC; therefore, not confirmed as bound to albumin in the current study, but could not be ruled out as albumin-binding proteins.
nc = not confirmed
The chromatogram of the SEC of the albumin-enriched fraction was split into four fractions (Fig. 2B). SEC A contains fractions eluting near 116 kDa, SEC B contains fractions from the tail of SEC A, and slope of SEC C, SEC C contains fractions eluting slightly above 66 kDa, and SEC D contains sample from the lower MW region. Each fraction (A–D) was then further separated by two methods, RP-HPLC and 1-D SDS-PAGE, prior to MALDI-TOF MS and LC-MS/MS. Analysis by 1-D SDS-PAGE and RP-HPLC of the SEC fractions reveals the presence of multiple species in addition to albumin eluting in fractions A–C (representing protein populations with >116, 100, and 66 kDa, respectively). Protein identifications for the SEC fractions were obtained following 1-D SDS-PAGE and RP-HPLC (Table 1sup, Figs. 2sup and 5sup–7sup). Eluting near 116 kDa, SEC A contained six proteins with MW>100 kDa ruling these out as likely albumin-binding partners. However, an additional 27 proteins (including albumin) with masses below 100 kDa were identified in SEC A, and, as they were isolated under these nondenaturing conditions, they are likely to be part of a larger protein complex. SEC B elutes near 100 kDa and is expected to be a mixture of proteins found in SEC A and SEC C, since the tail ends of these peaks overlapped in SEC B. The overlapping bands are clear in Fig. 2sup. SEC C contains fractions eluting near 66 kDa. In addition to albumin, this fraction contains 14 proteins with theoretical masses less than 66 kDa, including alpha-1-acid glycoprotein 1, alpha-2HS-glycoprotein, and zinc alpha 2 glycoprotein, suggesting their association with other proteins. Interestingly, 1-DE of the SEC fractions showed several gel bands (Fig. 2sup) that are sensitive to boiling under more extensive (complete) denaturation including retinol-binding protein, clusterin, and paraoxonase 1, kininogen, and alpha-2HS glycoprotein, indicating that they are forming complexes with other proteins, potentially albumin. As albumin was observed in each of the SEC A–C fractions, it must be present in a variety of complexes, each containing different group of proteins or protein fragments. This suggests that the albumin complexes are heterogeneous. The existence of albumin complexes is validated by the 1-D SDS-PAGE analyses that show high MW (>66 kDa) albumin containing complexes (identified in Fig. 2supG and by Western blot (Fig. 1supB) even in the presence of SDS (Fig. 4G, Figs. 1sup and 2sup).
Upon comparison of the proteins identified in the anti-HSA retentate to those in the SEC fractions, 35 proteins were found to overlap, confirming that they are directly or indirectly associated with albumin (Table 1). Except for the hemoglobins and peptidoglycan recognition protein 2, the proteins found to be bound to albumin are extracellular proteins. There were 22 proteins found in only one of the two methods (anti-HSA or SEC) and as such cannot be confirmed as bound to albumin. Fifteen of these 22 were found in the anti-HSA retentate and not in the SEC fractions and are denoted in Table 1. These proteins were not ruled out as albumin-binding proteins since there are inherent biases with both methods regarding which protein complexes would be preserved under the experimental conditions. However, these proteins, in addition to the albumin-binding proteins reported here, are candidates for validation by immunoprecipitation or other methods to study protein–protein interactions in future studies, but were not validated in the current study. Furthermore, sample processing of the SEC fractions was more complex, leading to possible protein losses. On the other hand, there were seven proteins present in the high MW SEC fractions that were not observed in the anti-HSA retentate. Four of these (attractin, alpha 2 macro-globulin, pregnancy zone protein, and inter alpha trypsin inhibitor H2) were ruled out as potential albumin-binding proteins since they have MWs>100 kDa and are therefore expected to elute in this fraction even if not associated with other proteins. Two proteins present in SEC A, but not anti-HSA retentate, are actin and monocyte differentiation antigen CD14. These proteins have MWs below 100 kDa but are known to associate with other proteins found in the albumin-enriched fraction (Table 1sup), and therefore, these proteins could be directly or indirectly forming high MW complexes. Finally, retinol-binding protein (MW = 22 kDa), a known albumin-binding protein, was not observed in the anti-HSA retentate but was observed in SEC A, indicating that it is bound to albumin. Comparison of these results to published literature reveals that paraoxonase 1[57], alpha-1-acid glycoprotein [58], and clusterin [59] (indirect interaction through paraoxonase 1) have been reported to be associated with albumin and were also found to be associated with albumin in the current study. Furthermore, apolipoprotein E [60] has been reported to bind to albumin, but was observed in the anti-HSA retentate, not the SEC fractions, in the current study. Finally, the dynamic range of proteins bound (i.e., not just high abundance proteins), the fact that the albumin–protein complexes exhibit tight binding (i.e., complexes observed in the presence of SDS and are therefore not nonspecific), and the fact that whole proteins, not just peptides are binding collectively, indicate that albumin is binding proteins specifically.
In addition to obtaining the identity of the proteins in the albumin-enriched fraction, it was also a goal of this work to determine whether these proteins were intact or present as protein fragments. To accomplish this, MALDI-TOF MS was performed on all RP-HPLC fractions, from Study I and Study II prior to tryptic digestion, and spectra illustrating the intact MW of selected proteins are provided in the Supporting Information (Fig. 8sup). Two different mass spectrometers were used for this purpose, the Axima CFR plus MALDI-TOF and the Macromizer MALDI-TOF. Importantly for this study, the Macromizer is designed for high MW analyses, using a cryocooled superconducting tunneling junction detector that is not biased to the detection of low mass ions as is typical of conventional multichannel plate and other particle detectors. Although albumin is highly abundant in many fractions, proteins of other masses are still readily observed, making this instrument ideal for analyzing complex samples (Fig. 5). An added feature of this instrument is that it measures not only the flight time of every impinging ion, but also its kinetic energy. These energy data are used to determine charge states of the proteins, as multiply charged ions will have higher kinetic energy than singly charged ions. Consequently, these data are useful in distinguishing the singly charged intact MW species from multiply charged or multimer versions, and allow for confident determination of MW. By combining the MW observed by MALDI-TOF MS and the sequence coverage observed, we are able to confirm that 24 of the 35 proteins that have been determined to be associated with albumin are intact, not merely peptide fragments. The mass of the intact proteins ranged from 8.7 to 119 kDa (Table 1). The intact albumin-bound proteins were observed exclusively in the high MW SEC fractions (A–C), with a majority observed in more than one overlapping fraction. All of the albumin-bound intact proteins, except ceruloplasmin which was observed in SEC B and C, were observed in fractions eluting at an MW higher than the predicted MW for that particular protein. It must be noted, that the assignment of MWs to proteins is not absolute, but rather inferred from the comparison of the theoretical MW of the proteins known to be in the fraction (determined by MS/MS) to the observed MW of the peaks in the MALDI-TOF MS profile of the corresponding fraction.
Figure 5.
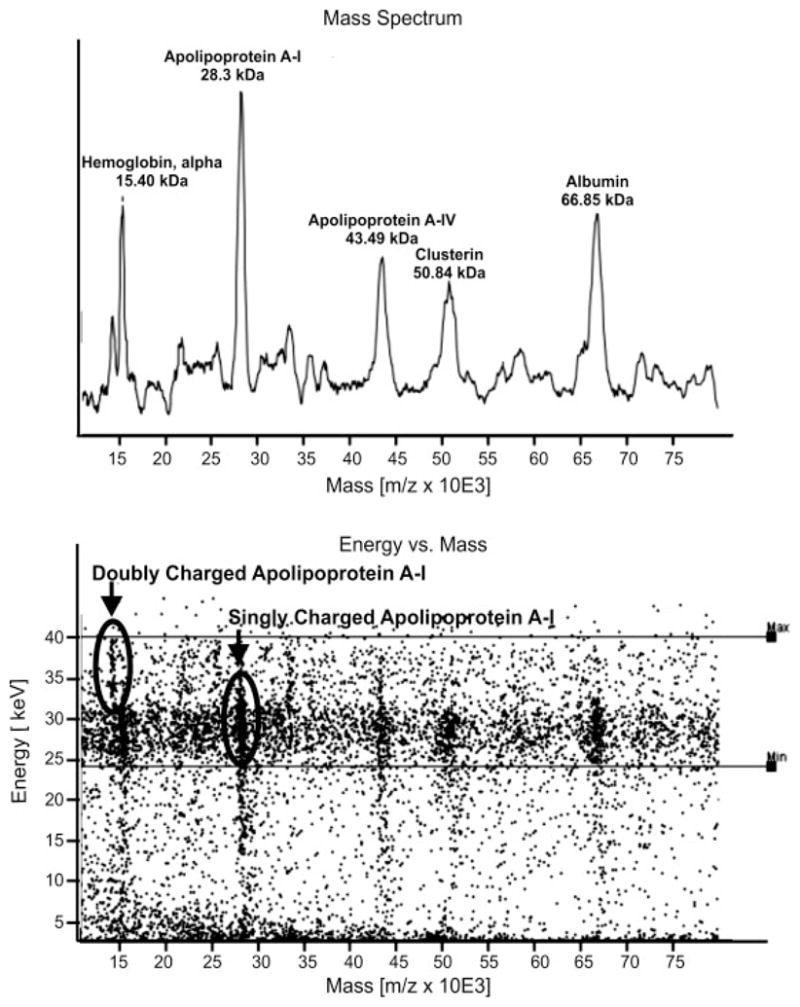
MALDI-TOF MS spectrum obtained on Macromizer of an RP-HPLC fraction of the whole albumin-enriched fraction.
One caveat associated with MW measurements of pre-digested proteins is that suppression effects typical in MALDI-TOF MS can prevent detection of intact protein ions. Therefore, although detection of a whole mass ion is confirmatory of the presence of the intact protein, the absence of such data does not rule out the possibility that the protein is present in intact form. In these instances one can utilize amino acid sequence. For example, sequence coverage >40% and the presence of peptides near the N- and C-termini indicate that antithrombin III and ceruloplasmin are present in nearly intact, if not fully intact form, even though the intact MW was not observed by MALDI-TOF MS.
3.2 Partitioning of albumin between the albumin-enriched and albumin-depleted fractions
The proteins identified in the albumin-enriched fraction can be compared directly to those reported previously for the albumin-depleted fraction [61], since the same pooled serum sample and extraction method was utilized in the two studies (Table 1sup). Interestingly, 62 proteins were exclusively observed in the albumin-enriched fraction, including ten proteins that were found to be bound to albumin. While partitioning of the albumin-bound proteins to the albumin-enriched fraction is not complete (58 proteins were found in both fractions and of these 24 were bound to albumin), it is important to note that the albumin-depleted fraction contains 3–4% of the original serum albumin content (Fu et al., fig. 3 [9]).
3.3 Comparison to previous albumin-binding protein study
The albumin-associated proteins reported in this study can also be compared to those identified using a single method of purification, immunoaffinity (anti-HSA coupled to protein G matrix) to remove albumin from serum by Zhou et al. [8]. This work was limited to lower mass proteins/peptides that were able to pass through a 30 kDa MWCO filter prior to enzymatic digestion and MS analysis. Since the focus of the Zhou et al. study was limited to a low mass range and details regarding data quality of single peptide identifications were not provided (no peptide scoring or spectra provided), it is difficult to evaluate the discrepancies between the results of Zhou et al. to the results of the current study. Nevertheless, three albumin-binding proteins (apolipoprotein AI, haptoglobin, and transthyretin) are common to both studies and each of these was further determined to be intact by the current study. Differences in the proteins found bound to albumin in the two studies could be a result of biological variation in the serum samples used, variation in the antibody columns used, or the fact that the Zhou et al. study is missing the proteins with higher MW than would pass through the 30 kDa filter.
3.4 Biomarker potential
It is interesting to investigate whether any of the proteins found in the albumin-enriched fraction, particularly those associated with albumin, have been previously indicated as potential biomarkers as binding to albumin may effect their availability, detection, quantitation, and overall utility as a biomarker. The proteins present in the albumin-enriched fraction were compared to (i) the comprehensive lists of cardiovascular biomarkers compiled by Anderson [31] and Berhane et al. [62] and (ii) to a literature search for other types of biomarkers [31, 62–71]. The results from these searches are provided in Table 2sup. Twenty-six of the 35 albumin-associated proteins have been previously reported to be potential biomarkers. Of these, nine were observed only in the albumin-enriched fraction, not the albumin-depleted fraction (compare with [44]). Proteins in this category are alpha-2HS-glycoprotein, apolipoprotein AI, ceruloplasmin, interalpha trypsin inhibitor H4, kininogen, apolipoprotein CIII, fibrinogen, retinol-binding protein, and beta thromboglobulin. With the exception of retinol-binding protein and beta thromboglobulin, these proteins have been designated to be potential cardiovascular biomarkers. Beta thromboglobulin is a chemokine that is normally present at low levels in serum and is involved in immune response. Furthermore, five (alpha-2HS-glycoprotein, apolipoprotein AI, apolipoprotein CIII, retinol-binding protein, and ceruloplasmin) of these nine albumin-bound potential biomarkers, observed only in the albumin-enriched fraction, were observed in intact form. Consequently, the fact that there are intact potential biomarkers observed only in the albumin-enriched fraction and are found to be bound to albumin, makes the albumin-enriched fraction and the albuminome an important consideration in biomarker discovery pursuits. However, whether clinical assays will be able to detect the bound form of a protein is not known. This leaves open the possibility that the concentration of albumin-bound proteins is higher in healthy individuals than previously proposed. Another consideration of the albuminome’s utility in biomarker discovery is the fact that the concentration of and metal-binding properties of albumin in serum is known to change with disease (reviewed in [72–74]). Therefore, it is reasonable to expect that the albuminome could also change. While studies are currently being conducted to examine this possibility, they are outside the scope of the current work. However, it is predicted that the albuminome changes with disease and that change could be a potential biomarker.
3.5 Important factors for consideration
It is useful to summarize here the key factors affecting the interpretation of the data in order to allow the reader an unbiased independent assessment, without diminishing the impact and importance of the current work. First, it is important to reiterate that the starting material for the current work was an albumin-enriched fraction obtained via a chemical extraction method, a classical method for purification of albumin. While there is no evidence to suggest that the chemical extraction method itself induces or reduces the binding of albumin to other proteins, it is an important consideration and one that is currently being examined outside the scope of this work using a highly specific IgY anti-HSA column (Beckman Coulter). Furthermore, the downstream processing (e.g., concentrating, RP-HPLC, SEC, anti-HSA, etc.) may also alter the binding of albumin to other proteins (i.e., not preserve native-binding state). Fewer proteins were identified in the SEC and anti-HSA experiments combined than in the whole albumin-enriched fraction. This can be attributed, at least in part, to the additional processing and inherent technical aspects and biases of the separation techniques. For example, only the center portions of SEC A and C were used for downstream separation and identification (to prevent overlap from adjacent peaks), and it is expected that if the entire fractions were used more proteins would have been identified. Importantly, it is also possible that the conformation of albumin, and consequently any proteins/peptides bound to albumin, may change upon albumin’s binding to the anti-HSA column. Added to that is the fact that albumin dominates many of the downstream sample fractions, and therefore there is still a possibility that lesser abundance proteins/peptides are not observed. While each of these factors are certainly important considerations for evaluating this work, they are the driving force behind the experimental design that incorporates two independent methods (SEC and anti-HSA), and why only overlapping proteins from these experiments are considered to be albumin binding.
4 Concluding remarks
In the albumin-enriched fraction of human serum obtained by the modified classical chemical depletion method, albumin specifically binds intact proteins, both large and small. The combination of SEC and anti-HSA affinity chromatography allowed for an in-depth probe into the proteins, and their associations, of the albumin-enriched fraction. The observation that albumin is present in multiple high MW bands on 1-D SDS-PAGE and multiple high MW SEC fractions indicates that albumin is present in multiple sub-populations, whereby different molecules of albumin may bind different proteins. Furthermore, albumin binds proteins reproducibly (as evidenced by observation of albumin-binding proteins/peptides in 14 separate SEC and six separate anti-HSA experiments) and is not merely binding highly abundant proteins (>1E+7 pg/mL). This indicates that albumin is selective in its binding. Therefore, the biological role of albumin, as it binds to proteins and peptides in serum, must be considered in proteomics and biomarker discovery. For example, it may become necessary to probe for a particular protein in both the bound and unbound fractions, to obtain a total concentration for comparison among control and affected samples. Additionally, the ratio of bound to unbound protein may change with or as a result of disease, and the ratio, rather than total concentration of a particular protein, may serve as the biomarker. Finally, albumin associated and copurified proteins have been reported to be potential biomarkers for, or linked to, a variety of diseases. Therefore, the universal concern that important biomarkers are being removed from serum during albumin depletion is thus confirmed. While the albumin-enriched fraction is expected to vary among different albumin depletion methods, it is essential that these fractions are thoroughly examined. The techniques presented, therefore, may serve as a model for assessing other albumin depletion schemes.
Supplementary Material
Acknowledgments
This work was supported by NIH NHLBI grant N01-HV-28180 for R. J. C. and J. E. V. Special thanks to Urs Matter and Gertraud Hayn of Comet for the opportunity to be a beta site for the Macromizer™, providing funds and time for training and technical assistance. Thomas Kole is thanked for assistance with LC-MS/M, and Dawn Chen, Robert O’Meally, and Robert Cole at the NHLBI proteomic Technical Implementation and Coordination Core center for conducting some of the LC-MS/MS experiments.
Abbreviations
- MW
molecular weight
References
- 1.Baczynskyj L, Bronson GE, Kubiak TM. Rapid Commun Mass Spectrom. 1994;8:280–286. doi: 10.1002/rcm.1290080311. [DOI] [PubMed] [Google Scholar]
- 2.Sjobring U, Bjorck L, Kastern W. J Biol Chem. 1991;266:399–405. [PubMed] [Google Scholar]
- 3.Carter WA. Methods Enzymol. 1981;78:576–582. doi: 10.1016/0076-6879(81)78171-0. [DOI] [PubMed] [Google Scholar]
- 4.Carter DC, Ho JX. Adv Protein Chem. 1994;45:153–203. doi: 10.1016/s0065-3233(08)60640-3. [DOI] [PubMed] [Google Scholar]
- 5.Peters T., Jr Adv Protein Chem. 1985;37:161–245. doi: 10.1016/s0065-3233(08)60065-0. [DOI] [PubMed] [Google Scholar]
- 6.Peters T., Jr . All About Albumin. Academic Press; San Diego: 1996. pp. 76–132. [Google Scholar]
- 7.Zolotarjova N, Martosella J, Nicol G, Bailey J, et al. Proteomics. 2005;5:3304–3313. doi: 10.1002/pmic.200402021. [DOI] [PubMed] [Google Scholar]
- 8.Zhou M, Lucas DA, Chan KC, Issaq HJ, et al. Electrophoresis. 2004;25:1289–1298. doi: 10.1002/elps.200405866. [DOI] [PubMed] [Google Scholar]
- 9.Fu Q, Garnham CP, Elliott ST, Bovenkamp DE, et al. Proteomics. 2005;5:2656–2664. doi: 10.1002/pmic.200402048. [DOI] [PubMed] [Google Scholar]
- 10.Colantonio DA, Dunkinson C, Bovenkamp DE, Van Eyk JE. Proteomics. 2005;5:3831–3835. doi: 10.1002/pmic.200401235. [DOI] [PubMed] [Google Scholar]
- 11.Chen YY, Lin SY, Yeh YY, Hsiao HH, et al. Electrophoresis. 2005;26:2117–2127. doi: 10.1002/elps.200410381. [DOI] [PubMed] [Google Scholar]
- 12.Björhall K, Miliotis T, Davidsson P. Proteomics. 2005;5:307–317. doi: 10.1002/pmic.200400900. [DOI] [PubMed] [Google Scholar]
- 13.Chromy BA, Gonzales AD, Perkins J, Choi MW, et al. J Proteome Res. 2004;3:1120–1127. doi: 10.1021/pr049921p. [DOI] [PubMed] [Google Scholar]
- 14.Steel LF, Trotter MG, Nakajima PB, Mattu TS, et al. Mol Cell Proteomics. 2003;2:262–270. doi: 10.1074/mcp.M300026-MCP200. [DOI] [PubMed] [Google Scholar]
- 15.Stanley BA, Gundry RL, Cotter RJ, Van Eyk JE. Dis Markers. 2004;20:167–178. doi: 10.1155/2004/965261. [DOI] [PMC free article] [PubMed] [Google Scholar]
- 16.Cohn EJ, Strong LE, Hughes WL, Mulford DJ, et al. J Am Chem Soc. 1946;68:459–475. doi: 10.1021/ja01207a034. [DOI] [PubMed] [Google Scholar]
- 17.Lowenthal MS, Mehta AI, Frogale K, Bandle RW, et al. Clin Chem. 2005;50:1933–1945. doi: 10.1373/clinchem.2005.052944. [DOI] [PubMed] [Google Scholar]
- 18.Thresher WC, Swaisgood HE. J Mol Recognit. 1990;3:220–228. doi: 10.1002/jmr.300030509. [DOI] [PubMed] [Google Scholar]
- 19.Prestera T, Prochaska HJ, Talalay P. Biochemistry. 1992;31:824–833. doi: 10.1021/bi00118a027. [DOI] [PubMed] [Google Scholar]
- 20.Subramanian S. CRC Crit Rev Biochem. 1984;16:169–205. doi: 10.3109/10409238409102302. [DOI] [PubMed] [Google Scholar]
- 21.Ahmed N, Barker G, Oliva K, Garfin D, et al. Proteomics. 2003;3:1980–1987. doi: 10.1002/pmic.200300465. [DOI] [PubMed] [Google Scholar]
- 22.Koomen JM, Li D, Xiao LC, Liu TC, et al. J Proteome Res. 2005;4:972–981. doi: 10.1021/pr050046x. [DOI] [PubMed] [Google Scholar]
- 23.Ortigoza-Ferado J, Richter RJ, Hornung SK, Motulsky AG, et al. Am J Hum Genet. 1984;36:295–305. [PMC free article] [PubMed] [Google Scholar]
- 24.Kelso GJ, Stuart WD, Richter RJ, Furlong CE, et al. Biochemistry. 1994;33:832–839. doi: 10.1021/bi00169a026. [DOI] [PubMed] [Google Scholar]
- 25.Dergunov AD, Vorotnikova YY. Int J Biochem. 1994;26:933–942. doi: 10.1016/0020-711x(94)90087-6. [DOI] [PubMed] [Google Scholar]
- 26.Morris DL, Jr, Sutton JN, Harper RG, Timperman AT. J Proteome Res. 2004;3:1149–1154. doi: 10.1021/pr049901n. [DOI] [PubMed] [Google Scholar]
- 27.Shevchenko A, Wilm M, Vorm O, Mann M. Anal Chem. 1996;68:850–858. doi: 10.1021/ac950914h. [DOI] [PubMed] [Google Scholar]
- 28.Wang D, Kalb SR, Cotter RJ. Rapid Commun Mass Spectrom. 2004;18:96–102. doi: 10.1002/rcm.1289. [DOI] [PubMed] [Google Scholar]
- 29.Carr S, Aebersold R, Baldwin M, Burlingame A, et al. Mol Cell Proteomics. 2004;3:531–533. doi: 10.1074/mcp.T400006-MCP200. [DOI] [PubMed] [Google Scholar]
- 30.Lichenstein HS, Lyons DE, Wurfel MM, Johnson DA, et al. J Biol Chem. 1994;269:18149–18154. [PubMed] [Google Scholar]
- 31.Anderson L. J Physiol. 2005;563:23–60. doi: 10.1113/jphysiol.2004.080473. [DOI] [PMC free article] [PubMed] [Google Scholar]
- 32.Schwick HG, Haupt H. The Plasma Proteins. Academic; Orlando, FL: 1984. pp. 167–220. [Google Scholar]
- 33.Kalabay L, Jakab L, Zoltan P, Fekete B. Eur J Gastroenterol Hepatol. 2002;14:389–394. doi: 10.1097/00042737-200204000-00009. [DOI] [PubMed] [Google Scholar]
- 34.Takagi K, Kin K, Itoh Y, Enomoto H, et al. J Clin Pathol. 1980;33:786–791. doi: 10.1136/jcp.33.8.786. [DOI] [PMC free article] [PubMed] [Google Scholar]
- 35.Koren E, McConathy WJ, Alaupovic P. Biochemistry. 1982;21:5347–5351. doi: 10.1021/bi00264a035. [DOI] [PubMed] [Google Scholar]
- 36.Kamboh MI, Manzi S, Mehdi H, Fitzgerald S, et al. Lupus. 1999;8:742–750. doi: 10.1191/096120399678840909. [DOI] [PubMed] [Google Scholar]
- 37.Duchateau PN, Pullinger CR, Orellana RE, Kunitake ST, et al. J Biol Chem. 1997;272:25576–25582. doi: 10.1074/jbc.272.41.25576. [DOI] [PubMed] [Google Scholar]
- 38.Eaton DL, Malloy BE, Tsai SP, Henzel W, et al. J Biol Chem. 1991;266:21833–21838. [PubMed] [Google Scholar]
- 39.Tan F, Weerasinghe DK, Skidgel RA, Tamei H, et al. J Biol Chem. 1990;265:13–19. [PubMed] [Google Scholar]
- 40.Greffard A, Bourgarit JJ, le Maho S, Lambre CR. Immunol Lett. 1987;15:145–151. doi: 10.1016/0165-2478(87)90046-0. [DOI] [PubMed] [Google Scholar]
- 41.Barnum SR, Niemann MA, Kearney JF, Volanakis JE. J Immunol Methods. 1984;67:303–309. doi: 10.1016/0022-1759(84)90470-8. [DOI] [PubMed] [Google Scholar]
- 42.Denecke B, Graber S, Schafer C, Heiss A, et al. Biochem J. 2003;376:135–145. doi: 10.1042/BJ20030676. [DOI] [PMC free article] [PubMed] [Google Scholar]
- 43.Mounzer KC, Moncure M, Smith YR, Dinubile MJ. Am J Respir Crit Care Med. 1999;160:1673–1681. doi: 10.1164/ajrccm.160.5.9807137. [DOI] [PubMed] [Google Scholar]
- 44.Hoener MC, Brodbeck U. Eur J Biochem. 1992;206:747–757. doi: 10.1111/j.1432-1033.1992.tb16981.x. [DOI] [PubMed] [Google Scholar]
- 45.Leung LL. J Clin Invest. 1986;77:1305–1311. doi: 10.1172/JCI112435. [DOI] [PMC free article] [PubMed] [Google Scholar]
- 46.Yu H, Mistry J, Nicar MJ, Khosravi MJ, et al. J Clin Lab Anal. 1999;13:166–172. doi: 10.1002/(SICI)1098-2825(1999)13:4<166::AID-JCLA5>3.0.CO;2-X. [DOI] [PMC free article] [PubMed] [Google Scholar]
- 47.Baxter RC, Martin JL, Beniac VA. J Biol Chem. 1989;264:11843–11848. [PubMed] [Google Scholar]
- 48.Hermann A, Arnhold M, Kresse H, Neth P, et al. Biol Chem. 1999;380:1097–1102. doi: 10.1515/BC.1999.136. [DOI] [PubMed] [Google Scholar]
- 49.Kerbiriou DM, Griffin JH. J Biol Chem. 1979;254:12020–120207. [PubMed] [Google Scholar]
- 50.Haupt H, Baudner S. Hoppe Seylers Z Physiol Chem. 1977;358:639–646. [PubMed] [Google Scholar]
- 51.Petersen SV, Valnickova Z, Enghild JJ. Biochem J. 2003;374:199–206. doi: 10.1042/BJ20030313. [DOI] [PMC free article] [PubMed] [Google Scholar]
- 52.Folkersen J, Teisner B, Grunnet N, Grudzinskas JG, et al. Clin Chim Acta. 1981;110:139–145. doi: 10.1016/0009-8981(81)90343-0. [DOI] [PubMed] [Google Scholar]
- 53.Han X, Fiehler R, Broze GJ., Jr PNAS. 1998;95:9250–9255. doi: 10.1073/pnas.95.16.9250. [DOI] [PMC free article] [PubMed] [Google Scholar]
- 54.Saito Y, Watanabe Y, Saito E, Takahashi K. J Health Sci. 2001;47:346–352. [Google Scholar]
- 55.Yamada T, Miyake N, Itoh K, Igari J. Clin Chem Lab Med. 2001;39:7–10. doi: 10.1515/CCLM.2001.003. [DOI] [PubMed] [Google Scholar]
- 56.Thougaard AV, Hogdall CK, Kjaer SK, Blaakaer J, et al. Clin Chim Acta. 1998;276:19–34. doi: 10.1016/s0009-8981(98)00092-8. [DOI] [PubMed] [Google Scholar]
- 57.Ortigoza-Ferado J, Richter R, Hornung S, Motulsky A, et al. Am J Hum Genet. 1984;36:295–305. [PMC free article] [PubMed] [Google Scholar]
- 58.Krauss E, Polnaszek CF, Scheeler DA, Halsall HB, et al. J Pharmacol Exp Ther. 1986;239:754–759. [PubMed] [Google Scholar]
- 59.Kelso G, Stuart W, Richter R, Furlong C, et al. Biochemistry. 1994;33:832–839. doi: 10.1021/bi00169a026. [DOI] [PubMed] [Google Scholar]
- 60.Dergunov A, Vorotnikova Y. Int J Biochem. 1994;26:933–942. doi: 10.1016/0020-711x(94)90087-6. [DOI] [PubMed] [Google Scholar]
- 61.Sheng S, Chen D, Van Eyk JE. Mol Cell Proteomics. 2006;5:26–34. doi: 10.1074/mcp.T500019-MCP200. [DOI] [PubMed] [Google Scholar]
- 62.Berhane BT, Zong C, Liem DA, Huang A, et al. Proteomics. 2005;5:3520–3530. doi: 10.1002/pmic.200401308. [DOI] [PubMed] [Google Scholar]
- 63.Gonzalez-Conejero R, Lozano ML, Rivera J, Corral J, et al. Blood. 1998;92:2771–2776. [PubMed] [Google Scholar]
- 64.Schoen P, Everts H, de Boer T, van Oeveren W. Clin Chem. 2003;49:1930–1932. doi: 10.1373/clinchem.2003.019398. [DOI] [PubMed] [Google Scholar]
- 65.McKoy G, Protonotarios N, Crosby A, Tsatsopoulou A, et al. Lancet. 2000;355:2119–2124. doi: 10.1016/S0140-6736(00)02379-5. [DOI] [PubMed] [Google Scholar]
- 66.Rampazzo A, Nava A, Malacrida S, Beffagna G, et al. Am J Hum Genet. 2002;71:1200–1206. doi: 10.1086/344208. [DOI] [PMC free article] [PubMed] [Google Scholar]
- 67.Olivier E, Soury E, Ruminy P, Husson A, et al. Biochem J. 2000;350:589–597. [PMC free article] [PubMed] [Google Scholar]
- 68.Soeki T, Tamura Y, Shinohara H, Tanaka H, et al. Heart Vessels. 2000;15:105–111. doi: 10.1007/pl00007263. [DOI] [PubMed] [Google Scholar]
- 69.Shigekiyo T, Yoshida H, Matsumoto K, Azuma H, et al. Blood. 1998;91:128–133. [PubMed] [Google Scholar]
- 70.Fujita Y, Ezura Y, Emi M, Sato K, et al. J Hum Genet. 2004;49:24–28. doi: 10.1007/s10038-003-0101-8. [DOI] [PubMed] [Google Scholar]
- 71.Rosales F, Ritter S, Zolfaghari R, Smith J, et al. J Lipid Res. 1996;37:962–971. [PubMed] [Google Scholar]
- 72.Prinsen BH, de Sain-van der Velden MG. Clin Chim Acta. 2004;347:1–14. doi: 10.1016/j.cccn.2004.04.005. [DOI] [PubMed] [Google Scholar]
- 73.Bar-Or D, Curtis G, Rao N, Bampos N, et al. Eur J Biochem. 2001;268:42–47. doi: 10.1046/j.1432-1327.2001.01846.x. [DOI] [PubMed] [Google Scholar]
- 74.Bar-Or D, Lau E, Winkler JV. J Emerg Med. 2000;19:311–315. doi: 10.1016/s0736-4679(00)00255-9. [DOI] [PubMed] [Google Scholar]
Associated Data
This section collects any data citations, data availability statements, or supplementary materials included in this article.