

Abstract
Humans communicate emotion vocally by modulating acoustic cues such as pitch, intensity and voice quality. Research has documented how the relative presence or absence of such cues alters the likelihood of perceiving an emotion, but the neural underpinnings of acoustic cue-dependent emotion perception remain obscure. Using functional magnetic resonance imaging in 20 subjects we examined a reciprocal circuit consisting of superior temporal cortex, amygdala and inferior frontal gyrus that may underlie affective prosodic comprehension. Results showed that increased saliency of emotion-specific acoustic cues was associated with increased activation in superior temporal cortex [planum temporale (PT), posterior superior temporal gyrus (pSTG), and posterior superior middle gyrus (pMTG)] and amygdala, whereas decreased saliency of acoustic cues was associated with increased inferior frontal activity and temporo-frontal connectivity. These results suggest that sensory-integrative processing is facilitated when the acoustic signal is rich in affective information, yielding increased activation in temporal cortex and amygdala. Conversely, when the acoustic signal is ambiguous, greater evaluative processes are recruited, increasing activation in inferior frontal gyrus (IFG) and IFG STG connectivity. Auditory regions may thus integrate acoustic information with amygdala input to form emotion-specific representations, which are evaluated within inferior frontal regions.
Keywords: prosody, emotion, auditory cortex, inferior frontal gyrus, amygdala, speech
Introduction
When we communicate vocally, it is often not just what we say – but how we say it – that matters. For example, in expressing joy our voices become increasingly melodic, while our voicing of sadness is more often flat and monotonic. Such prosodic aspects of speech precede formal language acquisition, reflecting the evolutionary importance of communicating emotion (Fernald, 1989).
Vocal communication of emotion results from gestural changes of the vocal apparatus that, in turn, cause collinear alterations in multiple features of the speech signal such as pitch, intensity, and voice quality. There are relatively distinct patterns of such acoustic cues that differentiate between specific emotions (Banse and Scherer, 1996; Cowie et al., 2001; Juslin and Laukka, 2003). For example, anger, happiness, and fear are typically characterized by high mean pitch and voice intensity, whereas sadness expressions are associated with low mean pitch and intensity. Also, anger and happiness expressions typically have large pitch variability, whereas fear and sadness expressions have small pitch variability. Regarding voice quality, anger expressions typically have a large proportion of high-frequency energy in the spectrum, whereas sadness has less high-frequency energy (as the proportion of high-frequency energy increases, the voice sounds sharper and less soft). We present the first study to experimentally examine neural correlates of these acoustic cue-dependent perceptual changes.
We employed a parametric design, using emotional vocal stimuli with varying degrees of acoustic cue saliency to create graded levels of stimulus-driven prosodic ambiguity. A vocal stimulus with high cue salience has high levels of acoustic cues that are typically associated with the vocal expression of a particular emotion and presents an acoustic signal rich in affective information, whereas a vocal stimulus with low cue salience has low levels of the relevant acoustic cues and is more ambiguous. We generated a four-choice vocal emotion identification task (anger, fear, happiness and no expression) to examine how acoustic-cue level impacts affective prosodic comprehension. As our independent variable, we used the acoustic cue which best correlated with performance on the emotion identification task – this cue served as a proxy for “cue saliency”. For happiness and fear, we utilized pitch variability – the standard deviation of the fundamental frequency (F0SD) as a cue salience proxy, and for anger we used proportion of high-frequency spectral energy [i.e. elevated ratios of energy above vs. below 500 Hz (HF500)]. These cues are important predictors of recognition of the respective emotions (Banse and Scherer, 1996; Juslin and Laukka, 2001; Leitman et al., 2008) and pitch variability and spectral energy ratios are important for emotion categorization (Ladd et al., 1985; Juslin and Laukka, 2001; Leitman et al., 2008).
For each emotion, our vocal stimuli set contained stimuli exhibiting a wide range of the emotion-relevant cue. We then examined behavioral performance and brain activation parametrically across each emotion as a function of this cue level change across items. We hypothesized that variation in cue salience level would be reflected in activation levels within a reciprocal temporo-frontal neural circuit as proposed by Schirmer and Kotz (2006) and others (Ethofer et al., 2006). F0SD as a proxy for cue salience in fear and happiness allowed further differentiation: Saliency-related performance increases are expected to positively correlate with pitch variability (F0SD) for happy stimuli, and negatively correlate with F0SD for fear stimuli. Therefore, a similar activation pattern for increasing cue saliency for both happiness and fear would suggest that the activation observed relates to emotional salience as predicted, rather than to pitch variation alone.
The proposed temporo-frontal network that we expect to be affected by changes in cue saliency is grounded in neuroscience research. Initial lesion studies (Ross et al., 1988; Van Lancker and Sidtis, 1993; Borod et al., 1998) linked affective prosodic processing broadly to right hemispheric function (Hornak et al., 1996; Ross and Monnot, 2008). More recent neuroimaging studies (Morris et al., 1999; Adolphs et al., 2001; Wildgruber et al., 2005; Ethofer et al., 2006; Wiethoff et al., 2008, 2009) related prosodic processing to a distributed network including: posterior aspects of superior and middle temporal gyrus (pSTG, pMTG), inferior frontal (IFG) and orbitofrontal (OFC) gyri, and sub-cortical regions such as basal ganglia and amygdala. In current models (Ethofer et al., 2006; Schirmer and Kotz, 2006), affective prosodic comprehension has been parsed into multiple stages: (1) elementary sensory processing (2) temporo-spectral processing to extract salient acoustic features (3) integration of these features into the emotional acoustic object, and (4) evaluation of the object for meaning and goal relevance. Together these processing stages comprise a circuit with reciprocal connections between nodes.
Prior neuroimaging studies compared prosodic vs. nonprosodic tasks [i.e. (Mitchell et al., 2003)], or prosodic identification of emotional vs. neutral stimuli [i.e. (Wiethoff et al., 2008)], and thereby identified a set of brain regions likely involved in affective prosody. Based on knowledge of functional roles of temporal cortex and IFG (‘reverse inference’; Poldrack, 2006; Van Horn and Poldrack, 2009), it was assumed that temporal cortex mediates sensory-integrative functions while IFG plays an evaluative role (Ethofer et al., 2006; Schirmer and Kotz, 2006). However, these binary ‘cognitive subtraction’ designs did not permit a direct demonstration of the distinct roles of temporal cortex versus IFG.
Our parametric design, using stimuli varying in cue salience to create varying levels of stimulus-driven prosodic ambiguity, has two major advantages over prior study designs: First, analysis across varying levels of an experimental manipulation allow more robust and interpretable results linking activation to the manipulated variable than designs that utilize a binary comparison. Second, the parametric manipulation of cue saliency should produce a dissociation in the relationship of sensory vs. evaluative regions to the manipulated cue level. This allows direct evaluation of the hypothesis that IFG plays an evaluative role distinct from the sensory-integrative role of temporal cortex.
We hypothesized that during a simple emotion identification task, the presence of high levels of affectively salient cues within the acoustic signal should facilitate the extraction and integration of these cues into a percept that would be reflected in temporal cortex activation increases. We also hypothesized that increased cue saliency would correlate with amygdala activation. Amygdala activation is correlated with perceived intensity in non-verbal vocalizations (Fecteau et al., 2007; Bach et al., 2008b). Such activity may reflect automatic affective tagging of the stimulus intensity level (Bach et al., 2008a,b). Conversely, we predicted that decreasing cue saliency would be associated with increasing IFG activation, reflecting increased evaluation of the stimuli for meaning (Adams and Janata, 2002) and difficulty in selecting the proper emotion (Thompson-Schill et al., 1997). We thus expected that increased activation in this evaluation and response selection region (IFG) would be directly associated with decreased activity in feature extraction and integration regions (pSTG and pMTG). Thus, our parametric design aimed to characterize a reciprocal temporo-frontal network underlying prosodic comprehension and examine how activity within this network changes as a function of cue salience.
Materials and Methods
Subjects
Informed consent was obtained from 20 male right-handed subjects with a mean age of 28 ± 5, 14.9 ± 2 years of education, and no reported history of psychopathology or hearing loss. One subject did not complete the scanning session due to a strong sensitivity to scanner noise. All procedures were conducted under the supervision of the local internal review board.
Stimuli and design
Recognition of emotional prosody was assessed using a subset of stimuli from Juslin and Laukka's (2001) prosody task. The stimuli consisted of audio recordings of two male and two female actors portraying three emotions – anger, fear, happiness, as well as utterances with no emotional expression. The sentences spoken were semantically neutral and consisted of both statements and questions (e.g., “It is eleven o’clock”, “Is it eleven o’clock?”). All speakers were native British English; these stimuli have been used successfully with American subjects (Leitman et al., 2008). All stimuli were less than 2 s in length. Each emotion was represented by 8–10 exemplars that had unique acoustic properties that would reflect a particular level of cue salience for each emotion. These stimuli were repeated on average 5–7 times to yield 56 stimuli for each emotion. These stimuli were pseudo-randomly presented over fMRI time series acquisitions (runs a–d) of 56 stimuli each, in such a manner that all runs were balanced for the type of sentence (question or statement), emotion, and gender of speaker.
For this stimulus set, measurement of all acoustic cues was conducted in PRAAT (Boersma, 2001) speech analysis software as described previously (Juslin and Laukka, 2001). F0SD was transformed to a logarithmic scale for all analyses as done previously (Leitman et al., 2008). Our initial choice of these particular cues as our proxies for cue salience (F0SD for happiness and fear, HF500 for anger) was based on our prior findings with a full Juslin and Laukka stimuli set. There we found that the F0SD ranges of happy and fear and the HF500 range for anger were statistically distinct from the other emotions as a whole (see Leitman et al., 2008 – Table 2) and that they provided the single strongest correlate of subject performance. For this study, due to time constraints, we reduced the emotions presented from six to four: anger, fear, happiness, or neutral. As Table 1 illustrates, in the present study the ranges for F0SD and HF500 for happiness and anger respectively are no longer statistically different from the three remaining emotions; nevertheless, they did remain the strongest single predictor of performance of the acoustic features measured. Note that we had no a priori hypotheses regarding the neutral stimuli that were included in the experiment in order to give subjects the option not to endorse an emotion. Our prior study (Leitman et al., 2008) indicated that when the cue salience of an emotional stimulus was low, subjects often endorsed it as neutral. With the inclusion of neutral stimuli, we were additionally able to replicate more prior conventional binary contrasts of emotional prosody versus neutral.
Table 2.
Mean cluster location and local maxima of BOLD signal change for all emotions > neutral.
| Cluster number | Size (voxels) | Cerebral hemisphere | Region name (Brodmann area) | Z score | x | y | z |
|---|---|---|---|---|---|---|---|
| 1 | 5226 | Superior temporal gyrus | |||||
| R | STG(22) | 5.03 | 50 | −24 | 2 | ||
| R | Insula/OFC | 4.66 | 38 | 26 | −6 | ||
| R | IFG(46)* | 4.36 | 52 | 24 | 18 | ||
| 2 | 4549 | Inferior frontal gyrus | |||||
| L | IFG(47) | 4.37 | −38 | 22 | –12 | ||
| L | IFG(45) | 4.23 | −32 | 28 | –2 | ||
| L | IFG (9) | 4.12 | −52 | 16 | 28 | ||
| L | Precentral gyrus(6) | 4.04 | −42 | 2 | 36 | ||
| 3 | 1925 | Superior temporal gyrus | |||||
| L | STG(22) | 4.84 | −54 | −26 | 2 | ||
| L | MTG (21) | 4.58 | −64 | −30 | 2 | ||
| 4 | 1698 | Anterior cingulate gyrus | |||||
| L/R | Anterior cingulate gyrus (32) | 4.5 | −4 | 22 | 40 | ||
| L/R | Medial frontal gyrus (6) | 3.32 | 4 | 4 | 58 | ||
| L/R | Superior frontal gyrus (24) | 3.08 | 2 | 34 | 54 | ||
| 5 | 212 | L | Thalamus** | 2.76 | −8 | −6 | 6 |
| L | Caudate** | 2.67 | −14 | −4 | 14 |
Clusters are whole brain corrected for an overall p < 0.01. Estimated Brodmann's areas and coordinates (displayed here in MNI space), were from Talairach and Tournoux (1988) with aid from Harvard-Oxford Atlas for STG subdivisions [i.e. planum temporale (PT)]. Values for local maxima represent peak activation for atlas-derived subdivisions greater than 26 voxels. Only local maxima that fell within distinct Brodmann regions or identified Harvard-Oxford subdivisions are displayed in table. Bolded values represent a priori ROI's. *no distinct local maxima within this region. **cluster corrected at a p < 0.05 level.
Table 1.
Selected acoustic features of prosodic stimuli.
| Emotion/acoustic feature | F0M | F0SD | logF0SD | F0cont | VoiceintM | HF500 | Speaker gender* | Q/S* |
|---|---|---|---|---|---|---|---|---|
| Anger | 271.42 ± 66.53 | 52.86 ± 18.12 | 1.70 ± 0.15 | 1.13 ± 0.45 | −27.96 ± 4.78 | 0.72 ± 0.10 | 4/6 | 4/4 |
| Fear | 243.93 ± 58.97 | 38.80 ± 28.50 | 1.49 ± 0.30 | 1.80 ± 1.06 | −36.99 ± 4.62 | 0.62 ± 0.08 | 3/8 | 2/6 |
| Happiness | 269.49 ± 77.86 | 67.76 ± 55.19 | 1.72 ± 0.31 | 1.06 + 0.22 | −32.76 ± 4.79 | 0.69 + 0.06 | 4/6 | 6/4 |
| Neutral | 158.31 ± 39.61 | 21.14 ± 7.43 | 1.29 ± 0.22 | 1.05 ± 0.74 | −38.12 ± 2.40 | 0.57 ± 0.06 | 4/4 | 4/4 |
Abbreviations and descriptions: F0M, fundamental frequency (pitch) mean F0SD; fundamental frequency standard deviation. log F0SD, log transform of fundamental frequency standard deviation; F0cont, trajectory of the pitch contour; VoiceintM, mean db-SPL level -referenced from the maximum signal level possible; HF500, ratio of energy from 0–5000 HZ that is above 500 HZ; Speaker gender, the respective number of male/female actors; Q/S, stimulus in question or statement form. For more details on the acoustic features and their measurement see (Juslin and Laukka, 2001). *Stimulus repetitions were arranged so as to balance as well as possible the number of stimuli presented for speaker.
The task consisted of a simple forced-choice identification task and was presented in a fast event-related design whose timing and features are described in Figure 1. This design used compressed image acquisition to allow for a silent period in which audio stimuli could be presented.
Figure 1.

fMRI Paradigm. Subjects were placed in a supine position into the scanner and instructed to focus on a central fixation crosshair displayed via a rear-mounted projector [PowerLite 7300 video projector (Epson America, Inc., Long Beach, CA, USA)] and viewed through a head coil-mounted mirror. After sound offset, this crosshair was replaced with a visual prompt containing emoticons representing the four emotion choices and the corresponding response button number. Auditory stimuli were presented through pneumatic headphones and sound presentation occurred between volume collections to minimize any potential impact of scanner noise on stimulus processing.
Image acquisition
Images were acquired on a clinical 3T Siemens Trio Scanner (Iselin, NJ, USA). A 5 min magnetization-prepared, rapid acquisition gradient-echo image (MPRAGE) was acquired for anatomic overlays of functional data and spatial normalization Talairach and Tournoux (1988). Functional BOLD imaging (Bandettini et al., 1992) used a single-shot gradient-echo (GE) echo-planar (EPI) sequence (TR/TE=4000/27 ms, FOV=220 mm, matrix=64 × 64, slice thickness/gap=3.4/0 mm). This sequence delivered a nominal voxel resolution of 3.4 × 3.4 × 3.4 mm. Thirty four axial slices were acquired from the superior cerebellum up through the frontal lobe, aligning the slab orientation so that the middle slice was parallel to the lateral sulcus, in order to minimize signal drop-out in the temporal poles and ventral and orbitofrontal aspects of cortex. The extent of this scanning region is illustrated in Figure 2 along with a contrast of all stimuli > rest.
Figure 2.

All stimuli > rest. Activation presented at an uncorrected p < 0.05 threshhold. Grey shadow represents scanned regions of the brain.
Image processing
The fMRI data were preprocessed and analyzed using FEAT (FMRI Expert Analysis Tool) Version 5.1, part of FSL (FMRIB's Software Library, www.fmrib.ox.ac.uk/fsl). Images were slice time corrected, motion corrected to the median image using tri-linear interpolation with 6 degrees of freedom, high pass filtered (120 s), spatially smoothed (8-mm FWHM, isotropic) and scaled using mean-based intensity normalization. Resulting translational motion parameters were examined to ensure that there was not excessive motion (in our data, all subjects exhibited less than 1 mm displacement in any plane). BET was used to remove non-brain areas (Smith, 2002). The median functional image was coregistered to the T1-weighted structural volume and then normalized to the standard anatomical space (T1 MNI template) using tri-linear interpolation (Jenkinson and Smith, 2001) and transformation parameters were later applied to statistical images for group-level analysis.
Statistical analysis
Behavior
Variations in subject performance were examined using a general linear mixed effects model conducted with Stata 9.0 (StataCorp; College Station, TX, USA). In this model, subjects’ prosodic identification served as the outcome variable, subjects (n=19) were treated as random effects, and fixed effects included fMRI runs (a–d) and cue saliency level (10 for happy and anger, 8 for fear, each level reflecting a unique stimulus). Adjustment for the clustering (repeated measures from within individual) was accomplished within the mixed model using the sandwich estimator approach, which is the default adjustment method for this program. The significance levels of individual model parameters were assessed using the F-test statistic, which were appropriately adjusted for the non-independence of the repeated measures within individual, with an alpha criterion of p < 0.05.
Imaging
Subject-level time-series statistical analysis was carried out using FILM (FMRIB's Improved Linear Model) with local autocorrelation correction (Woolrich et al., 2001). Event-related first stage analysis was conducted separately for the four timeseries, modeling each of the four conditions (angry, happy, fear, neutral) against a canonical hemodynamic response function (HRF) and its temporal derivative.
In order to compare our results to those of prior studies (Wiethoff et al., 2008, 2009) we contrasted anger, fear and happiness with neutral stimuli. In order to quantify the relationship of activation to parametrically varied cue saliency levels, we also included a parametric regressor – ZCUE – consisting of z-normalized values of the relevant cue value for each emotion (F0SD for fear and happy, HF500 for anger) across all emotions. A separate analysis was conducted for each of the three emotion conditions in which the HRF was scaled as a function of the relevant cue level for each stimulus (F0SD for fear and happy, HF500 for anger). These parametric regressors were orthogonalized relative to the fixed amplitude HRF regressor for the corresponding emotion, yielding a contrast that reflected cue level related variations above or below the average stimulus response.
A second-level within-subject fixed effects analysis across all four runs was then conducted for each subject. The resulting single-subject contrast estimates were submitted to a third-level between-subjects (group) analysis employing FMRIB's Local Analysis of Mixed Effects (FLAME) (Beckmann et al., 2003), which models inter-session or inter-subject random-effects components of the mixed-effects variance using Markov chain Monte Carlo sampling to estimate the true random-effects variance and degrees of freedom at each voxel (Woolrich et al., 2004).
As mentioned, saliency-related activation for happy stimuli was positively related to pitch variability (F0SD), while saliency-related activation for fear stimuli was negatively related to F0SD. In order to illustrate that activation changes correlating with cue level within our ROIs reflect emotion-specific changes and not directional changes in acoustic features, we conducted a conjunction analysis of happy and fear stimuli. This analysis examines correlated activation changes of increasing cue saliency (increasing F0SD for happiness, decreasing F0SD for fear) or decreasing cue saliency (decreasing F0SD for happiness, increasing F0SD for fear) within these emotions jointly.
Statistical significance was based on both voxel height and spatial extent in the whole brain, using AFNI AlphaSim to correct for multiple comparisons by Monte Carlo simulation (10,000 iterations, voxel height threshold p < 0.01 uncorrected, cluster probability p < 0.01). This whole-brain correction required a minimum cluster size of 284 2 × 2 × 2 voxels. Given the small size of the amygdala (319 voxels for both amygdalae combined) and our a priori prediction of amygdala involvement, this cluster threshold was deemed inappropriate for detecting amgydala activity. We therefore repeated the above AlphaSim correction using a mask restricted to the amygdala as defined anatomically by a standardized atlas (Maldjian et al., 2003), yielding a cutoff of >31 voxels.
Anatomical regions within significant clusters were identified by a Talairach atlas Talairach and Tournoux (1988) with supplemental divisions for regions like planum temporale (PT) and IFG-pars triangularis delineated using the Harvard-Oxford atlas created by the Harvard Center for Morphometric Analysis, and WFU Pick atlas (Maldjian et al., 2003), respectively. Using the cluster tool (FSL), we identified local maxima with connectivity of 26 voxels or more within these anatomical regions.
To assess the degree of lateralization within auditory regions for our cue × emotion interactions we adopted a method akin to one used previously by Obleser et al. (2008). We contrasted activity within right and left structural ROIs containing PT, pSTG, and pMTG by calculating a lateralization quotient index (LQ). We used “Energy” as an activation measure, which takes into account both amplitude and spatial extent (Gur et al., 2007). Energy is calculated as: Energy=mean BOLD % signal change *number of voxels, where % signal change was calculated using FSL's Featquery tool from voxels greater than our chosen voxel height threshold (overall whole brain p < 0.01). Thus,
where k = number of voxels.
As in Obleser et al. (2008), we used a jackknife procedure (Efron and Tibshirani, 1993) to determine the reliability of our emotion × cue effects, rerunning the model n times (n = 19, the number of our participants) each time omitting a different participant. This procedure resulted in n models with n-1 subjects, which, unlike lateralization analysis based on single subjects, preserved the advantages of second level modeling such as greatly increased signal to noise ratio.
Psychophysiological interaction (PPI) analysis (Friston et al., 1997) was used to evaluate effects of cue salience on the functional connectivity of right IFG with other regions in our affective prosodic model. PPI examines changes in the covariation of BOLD signal between brain regions in relation to the experimental paradigm. IFG was chosen as a seed region because we wished to clarify its role in prosodic “evaluation” which should increase with decreasing cue saliency. The mean time series was extracted from an 8-mm- radius sphere within the right IFG seed region, centered on the coordinates (MNI = 50, 22, 20) where the peak effect was observed in our initial parametric analysis of cue salience within each emotion. Using FSL FEAT and following the method of Friston et al. (1997), we created a regression model employing regressors reflecting the standardized estimate (Z score) of cue saliency for each cue by emotion (ZCUE), the mean timeseries of our rIFG sphere, and the ZCUE × timeseries interaction (the PPI regressor of interest). Additionally, we included mean global (whole brain) times series, slice time correction, and motion in our model to reduce non-specific sources of timeseries correlation.
Results
Behavior
Emotion identification accuracy was well above chance for all four emotional categories (Figure 3A). Examination of identification rates within each emotion as a function of cue level revealed that the identification of anger stimuli significantly increased as a function of HF500 (F1, 1041 = 101.08 p < 0.0001) (Figure 3B). An inverse correlation indicated that decreasing F0SD was associated with increased identification of fearful stimuli (F1, 1037 = 12.32 p < 0.0005) (Figure 3C), while happy prosodic stimuli significantly increased as a function of F0SD (F1, 1056 = 28.45 p < 0.0001) (Figure 3D). Although the experiment was divided into four runs (a–d), there was no effect of run number on performance for any of the emotions (all p's > 0.19).
Figure 3.

Identification performance as a function of acoustic cue saliency levels. (A) Mean performance across all emotion choices; error bars reflect standard error of the mean of the raw data. White dotted line indicates chance performance. (B) Anger: as HF500 increases accuracy increases. (C) Fear: as F0SD decreases accuracy increases. (D) Happiness: as F0SD increases accuracy increases.
Imaging
All emotions > neutral
A contrast of emotional prosody versus neutral prosody revealed increasing activation to emotional prosody in a cluster spanning Heschl's gyrus and posterior and middle portions of superior and middle temporal gyrus (pSTG, mSTG, pMTG) as well as clusters in inferior frontal (IFG) and orbitofrontal gyri (OFC) (Figure 4 and Table 2). Additional activation clusters were observed in anterior and middle portions of cingulate gyrus as well as sub-cortically within insula, caudate and thalamus. No activation within amygdala was observed even at reduced significance thresholds (uncorrected p < 0.05).
Figure 4.
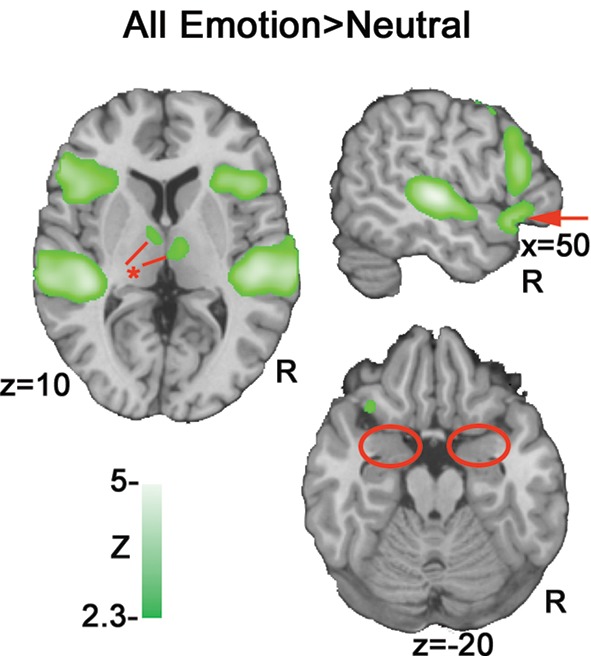
All emotions > neutral. A subtraction of neutral activation from all emotions (anger, fear and happiness) indicates activation clusters bilaterally in posterior superior/middle temporal gyrus (pSTG/ pMTG), inferior frontal gyrus (IFG) and orbitofrontal cortex (OFC). The markers in red illustrate differences between this contrast and the subsequent parametric analysis: Arrow = OFC activation; * = thalamic activation; circles = absence of amygdala activation bilaterally.
All emotions × cue saliency
A voxel-wise examination of ZCUE-correlated activation patterns for all emotions (anger, fear and happiness) revealed activation clusters spanning PT, pSTG, pMTG, and IFG that were modulated by cue saliency level (Figure 5A). Increasing cue saliency (increasing ZCUE) correlated with activation in PT, pSTG and pMTG. Conversely, decreasing cue saliency (decreasing ZCUE) was associated with IFG activation. Further, in contrast to the all emotion>neutral contrast, small volume analysis of amygdala revealed bilateral activation clusters that correlated with increasing cue saliency.
Figure 5.

Cue saliency-correlated activation patterns, by emotion. (A) Correlation with a standardized estimate (ZCUE) of cue saliency across all emotions revealed increased PT, pSTG and pMTG activation as cue saliency increased (red), and conversely, increased bilateral IFG activation as cue saliency decreased (blue). (B) A similar pattern was observed for anger as HF500 increased/decreased. (C) A conjunction analysis of increasing cue saliency (increasing F0SD) for happy and increasing cue saliency (decreasing F0SD) for fear yielded a similar pattern. (D) Uncorrected p < 0.05 maps of F0SD modulated activity for happy (left) and fear (right) indicate activation clusters spanning pSTG, amygdala and IFG. For happiness increasing F0SD (red) is associated with activation increases in pSTG and amygdala while decreasing F0SD (blue)is associated with increasing IFG activation. The reverse pattern is seen for fear, decreasing F0SD is associated with activation increases in pSTG and amygdala, while decreasing F0SD is associated with increasing IFG activation.
Beyond these a priori ROIs, increasing cue saliency positively correlated with activation in posterior cingulate gyrus (pCG) bilaterally, right precuneus, and anterior-medial portions of paracingulate gyrus (Brodmann's areas 23, 7 and 32 respectively) (Table 3).
Table 3.
Mean cluster location and local maxima of BOLD signal change for all emotions × cue saliency correlations.
| Cluster number | Size (voxels) | Cerebral hemisphere | ZCUE × All emotions | ||||
|---|---|---|---|---|---|---|---|
| Region name (Brodmann area) | Z score | x | y | z | |||
| INCREASING CUE SALIENCY | |||||||
| 1 | 11333 | Superior temporal gyrus | |||||
| R | PT(41) | 5.38 | 60 | −26 | 8 | ||
| R | pSTG(22) | 4.92 | 64 | −36 | 6 | ||
| 2 | 10623 | Superior temporal gyrus | |||||
| L | PT | 4.67 | −58 | −28 | 12 | ||
| L | pMTG(21) | 4.43 | −66 | −28 | –2 | ||
| L | pSTG(42) | 4.38 | −66 | −26 | 10 | ||
| L | pSTG(41) | 4.32 | −52 | −34 | 12 | ||
| 3 | 2444 | Posterior cingulate gyrus | |||||
| L/R | Posterior cingulate gyrus (23) | 3.54 | 0 | −18 | 32 | ||
| R | Precuneus (7) | 3.32 | 14 | −48 | 44 | ||
| 4 | 1710 | L | Paracingulate gyrus (32) | 3.42 | −10 | 42 | 22 |
| DECREASING CUE SALIENCY | |||||||
| 1 | 2019 | Inferior frontal gyrus | |||||
| L | IFG(46) | 3.44 | −54 | 30 | 10 | ||
| L | Middle frontal gyrus (9) | 3.33 | −52 | 24 | 30 | ||
| 2 | 1256 | Medial frontal gyrus | |||||
| L | Medial frontal gyrus (32) | 4.82 | −8 | 16 | 46 | ||
| R | Cingulate gyrus (32) | 3.4 | 8 | 28 | 42 | ||
| 3 | 709 | Inferior and middle frontal gyrus | |||||
| R | Precentral gyrus (9) | 3.37 | 46 | 30 | 36 | ||
| R | Middle frontal gyrus (9) | 3.19 | 58 | 24 | 30 | ||
| R | IFG(46) | 2.98 | 52 | 32 | 4 | ||
Conventions for table follow those of Table 2.
Anger × HF500
Activation to anger stimuli was significantly modulated by HF500 level (Figure 5B). Increasing cue saliency (greater HF500) was associated with bilateral clusters of activation spanning PT, STG, and MTG. In contrast, decreasing cue saliency (lower HF500) was associated with increased bilateral IFG activation. Within amygdala, small volume correction indicated activation clusters that were associated with increasing cue saliency.
Beyond these a priori ROI's, increasing cue saliency (here HF500) in anger stimuli positively correlated with activation in pCG and precuneus (Table 4). Decreasing cue saliency correlated with activation in AC, left globus pallidus, and right caudate and insula.
Table 4.
Mean cluster location and local maxima of BOLD signal change for Anger × cue saliency correlations.
| Cluster number | Size (voxels) | Cerebral hemisphere | HF500 × Anger | ||||
|---|---|---|---|---|---|---|---|
| Region name (Brodmann area) | Z score | x | y | z | |||
| INCREASING CUE SALIENCY | |||||||
| 1 | 6103 | Superior temporal gyrus | |||||
| R | pSTG (22) | 6.48 | 66 | −36 | 4 | ||
| R | pMTG (21) | 6.35 | 66 | −30 | 0 | ||
| R | pSTG (41) | 6.23 | 50 | −36 | 10 | ||
| 2 | 5455 | Posterior superior temporal gyrus | |||||
| L | PT/STG (41) | 7.11 | −52 | −32 | 12 | ||
| L | pSTG (22) | 6.58 | −64 | −24 | 0 | ||
| 3 | 2604 | L | Anterior paracingulate/Middle frontal gyrus (10) | 4.85 | −12 | 46 | 16 |
| 4 | 1344 | L/R | Posterior cingulate gyrus (24) | 3.85 | 0 | −16 | 36 |
| L | Precuneus (31) | 3.68 | −6 | −54 | 28 | ||
| 5 | 255 | L | Precentral gyrus (9)** | 3.79 | −36 | 24 | 40 |
| DECREASING CUE SALIENCY | |||||||
| 1 | 4918 | Globus pallidus | |||||
| L | Globus pallidus | 4.44 | −12 | 8 | 2 | ||
| L | IFG (47) | 4.22 | −28 | 22 | −2 | ||
| L | MFG(46) | 4.06 | −50 | 18 | 16 | ||
| L | IFG(45) | 3.65 | −54 | 28 | 8 | ||
| 2 | 2667 | Caudate | |||||
| R | Caudate | 3.92 | 10 | 10 | 2 | ||
| R | Insula | 3.87 | 34 | 20 | 4 | ||
| R | IFG(45) | 3.71 | 48 | 22 | 14 | ||
| 3 | 2092 | R/L | Anterior cingulate (32) | 4.61 | −8 | 14 | 46 |
Conventions for table follow those of Table 2.
Conjunction analysis of fear and happiness × F0SD
Similarly, for fear and happiness, F0SD-correlated activation patterns were observed in clusters spanning PT, pSTG, MTG, amygdala and IFG that were modulated by cue saliency level (Figure 5C). Increasing cue saliency (increasing F0SD for happiness, decreasing F0SD for fear) correlated with activation in PT, pSTG, pMTG and amygdala. Conversely, decreasing cue saliency (decreasing F0SD for happiness, increasing F0SD for fear) was associated with right IFG activation.
Beyond these a priori regions of interest, increasing cue saliency for fear and happy stimuli positively correlated with activation in anterior and ventral aspects of left MTG (Brodmann's areas 20, 34 and 24), bilateral pCG, and right supramarginal gyrus, right postcentral gyrus, right insula and right precuneus (Table 5).
Table 5.
Mean cluster location and local maxima of BOLD signal change for Happy and Fear Conjunction × cue saliency correlations.
| Cluster number | Size (voxels) | Cerebral hemisphere | F0SD × Happy and fear conjunction | ||||
|---|---|---|---|---|---|---|---|
| Region name (Brodmann area) | Z score | x | y | z | |||
| INCREASING CUE SALIENC | |||||||
| 1 | 3599 | Amygdala | |||||
| R | L | Amygdala | 4.24 | −20 | −10 | −16 | |
| L | Uncus (20) | 3.92 | −34 | −2 | −36 | ||
| L | Middle temporal gyrus (21) | 3.91 | −68 | −24 | −14 | ||
| L | Ventral Middle temporal gyrus (21) | 3.82 | −34 | −2 | −30 | ||
| L | Parahippocampal gyrus (34) | 3.78 | −22 | 4 | −16 | ||
| 2 | 2456 | Posterior Superior Temporal Gyrus | |||||
| R | pSTG (22) | 4.14 | 66 | −34 | 2 | ||
| R | pMTG (21) | 3.75 | 54 | −30 | −10 | ||
| R | Supramarginal gyrus (40) | 3.21 | 56 | −42 | 32 | ||
| R | PT (42) | 3.2 | 68 | −34 | 18 | ||
| 3 | 1422 | Subcallosal gyrus | |||||
| R | Subcallosal gyrus (34) | 3.45 | 22 | 6 | −14 | ||
| R | Parahippocampal gyrus/uncus (36) | 3.31 | 24 | −2 | −36 | ||
| R | Amygdala | 3.21 | 26 | 0 | −18 | ||
| R | Putamen | 2.91 | 30 | −16 | −10 | ||
| R | Fusiform gyrus (20) | 2.9 | 58 | −6 | −28 | ||
| R | |||||||
| 4 | 1129 | Insula | |||||
| R | Insula | 3.54 | 32 | −12 | 24 | ||
| R | Precuneus (7) | 3.15 | 16 | −48 | 44 | ||
| R | Posterior cingulate (31) | 2.9 | 14 | −30 | 38 | ||
| L | Posterior cingulate (24) | 2.79 | −4 | −20 | 36 | ||
| 5 | 745 | L | Supramarginal gyrus (40) | 3.48 | −58 | −50 | 24 |
| 6 | 308 | L | Post central gyrus (1) | 3.62 | −50 | −26 | 54 |
| DECREASING CUE SALIENCY | |||||||
| 1 | 385 | Inferior frontal gyrus (rlFG) | |||||
| R | IFG (46) | 3.16 | 44 | 28 | 26 | ||
| R | Middle frontal gyrus (9) | 2.52 | 54 | 30 | 24 | ||
Conventions for table follow those of Table 2.
These overall activation patterns observed in the conjunction analysis of happiness and fear were also seen within each emotion individually, albeit at a reduced significance threshold (see Figure 5D).
Hemispheric laterality
Analysis of hemispheric laterality for fear and happiness, incorporating both activation magnitude and spatial extent, indicated that PT, pSTG and MTG activation was robustly right-lateralized [LQ = −0.11 ± 0.02 (t1, 17 = −21.0, p < 0.0001)]. A similar assessment for anger × cue was slightly left lateralized [LQ = 0.02 ± 0.01 (t1, 17 = −12.3, p < 0.0001)].
Functional connectivity
An examination of the psychophysiological interaction between ZCUE and right IFG activity indicated robust negative interactions centered in bilateral pSTG (Figure 6). This interaction suggests that the functional coupling of rIFG and STG/MTG significantly increases as ZCUE decreases.
Figure 6.

Psychophysiological (PPI). This functional connectivity analysis map illustrates the negative interaction between ZCUE and the mean timeseries of IFG seed region (red sphere). This map indicates that functional connectivity between IFG and auditory processing regions is significantly modulated by cue saliency: Decreasing cue saliency increases IFG-STG functional coupling, while increasing cue saliency decreases this coupling.
Discussion
We approached affective prosodic comprehension from an object-based perspective, which characterizes affective prosodic processing as a reciprocal circuit comprising sensory, integrative, and cognitive stages (Schirmer and Kotz, 2006). Our model locates sensory-integrative aspects of prosodic processing in posterior STG and MTG, while higher-order evaluation occurs in IFG. Sensory-integrative processing should be robust when the prosodic signal is rich in the acoustic cues that typify the affective intent (high cue saliency), yielding increased PT, pSTG, and pMTG activation. Such integration may be facilitated by amygdala. Conversely, when the prosodic signal is ambiguous (low cue saliency), greater evaluative processes are recruited, increasing activation in IFG.
We tested this model by capitalizing on prior observations that acoustic cues, namely pitch variability (F0SD) and high-frequency spectral energy (HF500), correlate with the identification of specific emotions. We conducted a prosody identification task in which the stimuli varied parametrically in their cue salience. Our results were highly consistent with model predictions.
Activation related to saliency of emotion-specific acoustic cues
Consistent with our hypothesis, increased cue saliency was associated with right lateralized BOLD signal increases in PT, pSTG, pMTG and amygdala, as well as additional regions not included in our a priori model. Similarly, Wiethoff et al. (2008) reported pSTG activation to emotional prosody relative to neutral prosody—that was abolished after covarying for acoustic features such as F0SD and decibel level. This effect is consistent with our findings: A comparison between a contrast of all emotion >neutral and our maps of emotions × cue saliency revealed a high degree of overlap in pSTG, where increasing cue saliency produced correlated activation increases. We posit that these changes reflect increased facilitation in the extraction and integration of acoustic cues that characterize the emotion.
Again as predicted, decreased cue saliency was associated with increased activation in IFG (as well as anterior cingulate for anger, which was not part of our model). This activity, we propose, reflects increasing evaluation of the stimulus because ambiguity increases the difficulty of response selection.
These effects of salience were similar across the three emotions we examined, but depended on emotion-specific acoustic cues. Thus, saliency-related activation for happy stimuli was positively related to pitch variability (F0SD), negatively related to F0SD for fear stimuli, and positively associated with HF500 for anger stimuli. This emotion-specific effect is highlighted by the conjunction analyses combining fear and happy conditions, where the same acoustic cue (F0SD) produces opposite saliency effects. When the conjunction combined positive parametric effects of F0SD across happy stimuli and negative parametric effects of F0SD across fear stimuli, the predicted saliency patterns were robust. In contrast, in a control conjunction analysis (see Figure 7), examining effects of F0SD independent of emotion (positive parametric effect across both happy and fear conditions), an unrelated pattern emerged. This pattern suggests that effects within auditory sensory regions are not due to pitch variability change alone. Rather, these auditory regions code acoustic features in an emotion-specific manner when individuals are engaged in vocal affect perception.
Figure 7.

Control conjunction analyses. Increasing or decreasing F0SD across fear and happiness does not reveal activation in STG, IFG or amygdala at uncorrected p < 0.05 threshold.
A comparison of our parametric model (Figure 5) with a standard binary contrast of all emotions > neutral (Figure 4) revealed a high degree of overlap in activation in temporal and inferior frontal regions. However, the all emotions>neutral contrast (Figure 4 red markers) also indicated activation clusters in ventral IFG/OFC and thalamus that were not present in our cue salience parametric model, even at reduced thresholds. This effect suggests that the modulation of evaluation resulting from stimulus-driven ambiguity may be restricted to portions of the frontal prosodic processing circuit. The absence of modulation of thalamic activity by cue salience suggests that such modulation may only begin at the corticolimbic level.
Notably, cue salience increases resulted in correlated activation increases in the amygdala that were not observed in a contrast of all emotion > neutral (Figure 4). An examination of all stimuli versus rest also failed to indicate significant amygdala activation (Figure 2) even at p < 0.05 uncorrected.
The literature regarding the role of amygdala in prosody and non-verbal vocalizations is mixed, with some studies (Phillips et al., 1998; Morris et al., 1999; Sander et al., 2005; Fecteau et al., 2007; Ethofer et al., 2009a; Wiethoff et al., 2009) indicating a role for the amygdala and others not (Grandjean et al., 2005; Mitchell and Crow, 2005). A number of studies (Morris et al., 1999; Adolphs, 2002) suggest that the amygdala may preferentially activate during implicit tasks and become deactivated during explicit tasks, other studies have indicated the opposite (Gur et al., 2002; Habel et al., 2007) or that the amygdala activation may decrease over the duration of the experiment due to habituation (Wiethoff et al., 2009). Our results suggest that during explicit identification the amygdala may be sensitive to the degree of cue salience in the prosody. This sensitivity may relate to increasing arousal engendered by cue salience as well as the fact that identification accuracy for such stimuli was considerably higher for high cue than for low cue saliency stimuli. Indeed, a study of facial affect has shown that identification accuracy is associated with increased amygdala activation (Gur et al., 2007). Thus, amygdala activation may reflect some form of concurrent visceral or automatic recognition of emotion that may facilitate explicit evaluation.
Functional integration within the affective prosody circuit
To examine how cue salience modulates the functional coupling between IFG and other regions in the prosody network, we also conducted a psychophysiological interaction (PPI) functional connectivity analysis (Friston et al., 1997). The IFG timeseries was positively correlated with the regions in the model including auditory cortex and amygdala (not shown), demonstrating the expected functional connectivity within the network. Also consistent with our hypothesis, we found that IFG-STG connectivity was significantly modulated by cue saliency. As cue saliency decreased, IFG-STG coupling increased; in contrast, as cue saliency increased, IFG-STG coupling diminished.
A Dynamic Causal Modeling study (Ethofer et al., 2006) suggested that bilateral IFG regions receive parallel input from right temporal cortex during prosodic processing. Our results build on this finding, demonstrating that temporal auditory processing regions and inferior frontal evaluative regions exhibit a reciprocal interaction, whose balance is determined by the degree of cue presence that typified the emotion. When this cue saliency is low, evaluation of the stimulus and selection of the appropriate response become more difficult.
These observations demonstrate the integrated action of regions within a functional circuit. They support the view that in affective prosodic identification tasks IFG is involved in evaluation (Adams and Janata, 2002; Wildgruber et al., 2004) and response selection (Thompson-Schill et al., 1997), increasing top down modulation on auditory sensory-integrative regions in temporal cortex when stimuli are more ambiguous.
Laterality effects
While the reciprocal effects of salience in our a priori regions were similar across all three emotions, parametric modulation of HF500 for anger yielded a bilateral response that was slightly left lateralized in contrast to the expected strongly right-predominant response seen for happy and fear. Prosodic identification is considered to be a predominantly right-hemisphere process (Ross, 1981; Heilman et al., 1984; Borod et al., 1998). Several considerations may explain the bilateral effects seen for anger. First, voice quality as indexed by HF500 is highly correlated with decibel level (here r = 0.83). While spectral changes appear to predominantly engage right auditory cortex, intensity or energy changes are likely reflected in auditory cortex bilaterally (Zatorre and Belin, 2001; Obleser et al., 2008). However, Grandjean et al. (2005) observed bilateral activation to anger seemingly independent of isolated acoustic cues such as intensity. This finding suggests that the lateralization of affective prosody is emotion specific.
Limitations and future directions
Our study had several limitations. First, we parametrically varied cue levels using non-manipulated speech stimuli. This enhances ecological validity, and we chose cues (F0SD, HF500) that are tightly linked to the relevant emotions and which maximally differentiated emotions portrayed in our stimulus set [see (Leitman et al., 2008) for details]. However, in natural speech stimuli these cues are also correlated with other acoustic features that result from the vocal gestural changes eliciting the particular cue change. These additional features could contribute to the observed relationship between our selected cues and variation in performance and neural activity. Future studies could employ synthetic stimuli that can permit precise and independent modulation of one cue at a time.
Second, while fMRI provides high spatial resolution, its relatively low temporal resolution cannot capture many details of temporally complex and dynamic processes contributing to prosody identification. Electrophysiological studies indicate prosodic distinctions occurring at multiple timepoints, ranging from ∼ 200 ms in mismatch studies to ∼400 ms in N400 studies, supporting multi-stage “objects” model of prosodic processing (Schirmer and Kotz, 2006). Combining EEG and fMRI may provide a more complete description of prosodic circuit function and allow us to discriminate processes we could not distinguish in the current study, such as feature extraction vs. feature integration.
Third, while our model incorporates the regions and processes most prominently implicated in prosodic identification, it is not comprehensive. The whole-brain analysis identified additional areas, such as posterior cingulate (pCG), whose activity varied with cue salience as well as reinforcement-sensitive regions, such as caudate and insula. Prior studies have suggested that pCG and insula activation increases during prosodic processing are linked to increased sensory integration of acoustic cues such as F0 modulation (Hesling et al., 2005). Our finding that cue saliency increases correlate with pCG and insula activation increases strongly support this assertion. The exact role of pCG in facilitating sensory integration is not known but perhaps this region serves to coordinate STG integration of acoustic features between hemispheres. Future models of prosodic processing should incorporate insula and pCG more thoroughly.
Fourth, our population sample was limited to right-handed males, in order to avoid variation in prosodic processing and general language processing known to result from differences in handedness or gender (Schirmer et al., 2002, 2004). Future studies will need to examine factors such as handedness, gender and IQ directly and determine their impact on different processing stages within the model.
The purpose of our study was to explore the neural representation of acoustic-cue dependent perceptual change in affective prosody across all emotions. To accomplish this we formally tested a proposed multi-stage model of affective prosody that parses such perception into sensory-integrative and cognitive-evaluative stages. Consistent with our hypothesis, parametric manipulation of cue saliency revealed a reciprocal network underlying affective prosodic perception. Temporal auditory regions, which process acoustic features more generally, here in conjunction with amygdala, process acoustic features in an emotion-specific manner. This processing and its subsequent evaluation for meaning is modulated by inferior frontal regions, such that when the signal is ambiguous (as in the case of low cue-saliency), information processing in auditory regions is augmented by increased recruitment of top-down resources. While the current study identified responses to emotional salience common to multiple emotions, our results are not meant to suggest that there are no emotion-specific differences in neural activation between emotions. Indeed, recent work by Ethofer et al. (2009b) indicates that individual emotions may have spatially distinct representations in STG. Our findings converge with his in suggesting that temporal cortex is the locus for complex acoustic analysis that differentiates emotions. Such analysis in all likelihood involves the extraction and integration of acoustic cue patterns that typify differing affective intent. Based on our data we propose that when such cues are ambiguous, increasing frontal- evaluative resources are employed in making affective distinctions. Furthermore, we did find emotion-specific, correlated activation changes with cue salience in brain regions beyond our a priori ROIs. For happiness and fear, but not anger, increasing cue salience correlated with activation increases in insula, caudate, uncus, parahippocampal gyrus and putamen (Table 2). For anger, increasing cue salience correlated with increasing activation in differing portions of insula, caudate and globus pallidus (Table 3). These results suggest that specific emotional prosodic distinctions, like their facial affective counterparts, elicit distinct sub-cortical patterns of responses.
Finally, the model we describe may have clinical utility for psychiatric and neurological disorders associated with dysprosodia, such as Parkinsonism, autism, and schizophrenia. For example, prior studies have demonstrated strong links between dysprosodia in schizophrenia and pitch perception deficits (Leitman et al., 2005, 2007, 2008; Matsumoto et al., 2006). Our parametric fMRI approach should allow examination of the degree to which schizophrenia dysprosodia stems from failures in temporal-lobe mediated extraction and integration of prosodic cues versus prefrontal evaluative dysfunction.
Conflict of Interest Statement
The authors declare that the research was conducted in the absence of any commercial or financial relationships that could be construed as a potential conflict of interest.
Acknowledgments
This work was supported in part by NARSAD, NIH grants MH060722, Prodev-CAMRIS.The authors thank Dr. Mark Elliot for his assistance in implementing the MRI sequences, Dr. Warren Bilker and Ms. Colleen Brensinger for their help with the statistical modeling, and Ms. Kosha Ruparel for her suggestions regarding the fMRI analysis.
References
- Adams R. B., Janata P. (2002). A comparison of neural circuits underlying auditory and visual object categorization. Neuroimage 16, 361–377 10.1006/nimg.2002.1088 [DOI] [PubMed] [Google Scholar]
- Adolphs R. (2002). Neural systems for recognizing emotion. Curr. Opin. Neurobiol. 12, 169–177 10.1016/S0959-4388(02)00301-X [DOI] [PubMed] [Google Scholar]
- Adolphs R., Tranel D., Damasio H. (2001). Emotion recognition from faces and prosody following temporal lobectomy. Neuropsychology 15, 396–404 10.1037/0894-4105.15.3.396 [DOI] [PubMed] [Google Scholar]
- Bach D. R., Grandjean D., Sander D., Herdener M., Strik W. K., Seifritz E. (2008a). The effect of appraisal level on processing of emotional prosody in meaningless speech. Neuroimage 42, 919–927 10.1016/j.neuroimage.2008.05.034 [DOI] [PubMed] [Google Scholar]
- Bach D. R., Schachinger H., Neuhoff J. G., Esposito F., Di Salle F., Lehmann C., Herdener M., Scheffler K., Seifritz E. (2008b). Rising sound intensity: an intrinsic warning cue activating the amygdala. Cereb. Cortex 18, 145–150 10.1093/cercor/bhm040 [DOI] [PubMed] [Google Scholar]
- Bandettini P. A., Wong E. C., Hinks R. S., Tikofsky R. S., Hyde J. S. (1992). Time course EPI of human brain function during task activation. Magn. Reson. Med. 25, 390–397 10.1002/mrm.1910250220 [DOI] [PubMed] [Google Scholar]
- Banse R., Scherer K. R. (1996). Acoustic profiles in vocal emotion expression. J. Pers. Soc. Psychol. 70, 614–636 10.1037/0022-3514.70.3.614 [DOI] [PubMed] [Google Scholar]
- Beckmann C. F., Jenkinson M., Smith S. M. (2003). General multilevel linear modeling for group analysis in FMRI. Neuroimage 20, 1052–1063 10.1016/S1053-8119(03)00435-X [DOI] [PubMed] [Google Scholar]
- Boersma P. (2001). Praat, a system for doing phonetics by computer. Glot International 5, 341–345 [Google Scholar]
- Borod J. C., Cicero B. A., Obler L. K., Welkowitz J., Erhan H. M., Santschi C., Grunwald I. S., Agosti R. M., Whalen J. R. (1998). Right hemisphere emotional perception: evidence across multiple channels. Neuropsychology 12, 446–458 10.1037/0894-4105.12.3.446 [DOI] [PubMed] [Google Scholar]
- Cowie R., Douglas-Cowie E., Tsapatsoulis N., Votsis G., Kollias S., Fellenz W., Taylor J. G. (2001). Emotion recognition in human-computer interaction. IEEE Signal Proc. Mag. 18, 32–80 10.1109/79.911197 [DOI] [Google Scholar]
- Efron B., Tibshirani R. (1993). An introduction to the bootstrap. New York, Chapman and Hall [Google Scholar]
- Ethofer T., Anders S., Erb M., Herbert C., Wiethoff S., Kissler J., Grodd W., Wildgruber D. (2006). Cerebral pathways in processing of affective prosody: a dynamic causal modeling study. Neuroimage 30, 580–587 10.1016/j.neuroimage.2005.09.059 [DOI] [PubMed] [Google Scholar]
- Ethofer T., Kreifelts B., Wiethoff S., Wolf J., Grodd W., Vuilleumier P., Wildgruber D. (2009a). Differential influences of emotion, task, and novelty on brain regions underlying the processing of speech melody. J. Cogn. Neurosci. 21, 1255–1268 10.1162/jocn.2009.21099 [DOI] [PubMed] [Google Scholar]
- Ethofer T., Van De Ville D., Scherer K., Vuilleumier P. (2009b). Decoding of emotional information in voice-sensitive cortices. Curr. Biol. 19, 1028–1033 10.1016/j.cub.2009.04.054 [DOI] [PubMed] [Google Scholar]
- Fecteau S., Belin P., Joanette Y., Armony J. L. (2007). Amygdala responses to nonlinguistic emotional vocalizations. Neuroimage 36, 480–487 10.1016/j.neuroimage.2007.02.043 [DOI] [PubMed] [Google Scholar]
- Fernald A. (1989). Intonation and communicative intent in mothers’ speech to infants: is the melody the message? Child Dev. 60, 1497–1510 10.2307/1130938 [DOI] [PubMed] [Google Scholar]
- Friston K. J., Buechel C., Fink G. R., Morris J., Rolls E., Dolan R. J. (1997). Psychophysiological and modulatory interactions in neuroimaging. Neuroimage 6, 218–229 10.1006/nimg.1997.0291 [DOI] [PubMed] [Google Scholar]
- Grandjean D., Sander D., Pourtois G., Schwartz S., Seghier M. L., Scherer K. R., Vuilleumier P. (2005). The voices of wrath: brain responses to angry prosody in meaningless speech. Nat. Neurosci. 8, 145–146 10.1038/nn1392 [DOI] [PubMed] [Google Scholar]
- Gur R. C., Schroeder L., Turner T., McGrath C., Chan R. M., Turetsky B. I., Alsop D., Maldjian J., Gur R. E. (2002). Brain activation during facial emotion processing. Neuroimage 16, 651–662 10.1006/nimg.2002.1097 [DOI] [PubMed] [Google Scholar]
- Gur R. E., Loughead J., Kohler C. G., Elliott M. A., Lesko K., Ruparel K., Wolf D. H., Bilker W. B., Gur R. C. (2007). Limbic activation associated with misidentification of fearful faces and flat affect in schizophrenia. Arch. Gen. Psychiatry 64, 1356–1366 10.1001/archpsyc.64.12.1356 [DOI] [PubMed] [Google Scholar]
- Habel U., Windischberger C., Derntl B., Robinson S., Kryspin-Exner I., Gur R. C., Moser E. (2007). Amygdala activation and facial expressions: explicit emotion discrimination versus implicit emotion processing. Neuropsychologia 45, 2369–2377 10.1016/j.neuropsychologia.2007.01.023 [DOI] [PubMed] [Google Scholar]
- Heilman K. M., Bowers D., Speedie L., Coslett H. B. (1984). Comprehension of affective and nonaffective prosody. Neurology 34, 917–921 [DOI] [PubMed] [Google Scholar]
- Hesling I., Dilharreguy B., Clement S., Bordessoules M., Allard M. (2005). Cerebral mechanisms of prosodic sensory integration using low-frequency bands of connected speech. Hum. Brain Mapp. 26, 157–169 10.1002/hbm.20147 [DOI] [PMC free article] [PubMed] [Google Scholar]
- Hornak J., Rolls E. T., Wade D. (1996). Face and voice expression identification in patients with emotional and behavioural changes following ventral frontal lobe damage. Neuropsychologia 34, 247–261 10.1016/0028-3932(95)00106-9 [DOI] [PubMed] [Google Scholar]
- Jenkinson M., Smith S. (2001). A global optimisation method for robust affine registration of brain images. Med. Image Anal. 5, 143–156 10.1016/S1361-8415(01)00036-6 [DOI] [PubMed] [Google Scholar]
- Juslin P. N., Laukka P. (2001). Impact of intended emotion intensity on cue utilization and decoding accuracy in vocal expression of emotion. Emotion 1, 381–412 10.1037/1528-3542.1.4.381 [DOI] [PubMed] [Google Scholar]
- Juslin P. N., Laukka P. (2003). Communication of emotions in vocal expression and music performance: different channels, same code? Psychol. Bull. 129, 770–814 10.1037/0033-2909.129.5.770 [DOI] [PubMed] [Google Scholar]
- Ladd D., Silverman K., Tolkmitt F., Bergmann G., Scherer K. (1985). Evidence for the independent function of intonation, contour type, voice quality, and F0 range in signalling speaker affect. J. Acoust. Soc. Am. 78, 435–444 10.1121/1.392466 [DOI] [Google Scholar]
- Leitman D., Hoptman M., Foxe J. J., Wylie G. R., Nierenberg J., Jalbkowcski M., Lim K., Javitt D. C. (2007). The neural substrates of impaired prosodic detection in schizophrenia and its sensorial antecedents. Am. J. Psychiatry 164, 1–9 10.1176/appi.ajp.164.3.474 [DOI] [PubMed] [Google Scholar]
- Leitman D. I., Foxe J. J., Butler P. D., Saperstein A., Revheim N., Javitt D. C. (2005). Sensory contributions to impaired prosodic processing in schizophrenia. Biol. Psychiatry 58, 56–61 10.1016/j.biopsych.2005.02.034 [DOI] [PubMed] [Google Scholar]
- Leitman D. I., Laukka P., Juslin P. N., Saccente E., Butler P., Javitt D. C. (2008). Getting the cue: sensory contributions to auditory emotion recognition impairments in schizophrenia. Schizophr. Bull. [Epub ahead of print]. [DOI] [PMC free article] [PubMed] [Google Scholar]
- Maldjian J. A., Laurienti P. J., Kraft R. A., Burdette J. H. (2003). An automated method for neuroanatomic and cytoarchitectonic atlas-based interrogation of fMRI data sets. Neuroimage 19, 1233–1239 10.1016/S1053-8119(03)00169-1 [DOI] [PubMed] [Google Scholar]
- Matsumoto K., Samson G. T., O'Daly O. D., Tracy D. K., Patel A. D., Shergill S. S. (2006). Prosodic discrimination in patients with schizophrenia. Br. J. Psychiatry 189, 180–181 10.1192/bjp.bp.105.009332 [DOI] [PubMed] [Google Scholar]
- Mitchell R. L., Crow T. J. (2005). Right hemisphere language functions and schizophrenia: the forgotten hemisphere? Brain 128, 963–978 10.1093/brain/awh466 [DOI] [PubMed] [Google Scholar]
- Mitchell R. L., Elliott R., Barry M., Cruttenden A., Woodruff P. W. (2003). The neural response to emotional prosody, as revealed by functional magnetic resonance imaging. Neuropsychologia 41, 1410–1421 10.1016/S0028-3932(03)00017-4 [DOI] [PubMed] [Google Scholar]
- Morris J. S., Scott S. K., Dolan R. J. (1999). Saying it with feeling: neural responses to emotional vocalizations. Neuropsychologia 37, 1155–1163 10.1016/S0028-3932(99)00015-9 [DOI] [PubMed] [Google Scholar]
- Obleser J., Eisner F., Kotz S. A. (2008). Bilateral speech comprehension reflects differential sensitivity to spectral and temporal features. J. Neurosci. 28, 8116–8123 10.1523/JNEUROSCI.1290-08.2008 [DOI] [PMC free article] [PubMed] [Google Scholar]
- Phillips M. L., Young A. W., Scott S. K., Calder A. J., Andrew C., Giampietro V., Williams S. C., Bullmore E. T., Brammer M., Gray J. A. (1998). Neural responses to facial and vocal expressions of fear and disgust. Proc. Biol. Sci. 265, 1809–1817 10.1098/rspb.1998.0506 [DOI] [PMC free article] [PubMed] [Google Scholar]
- Poldrack R. A. (2006). Can cognitive processes be inferred from neuroimaging data? Trends Cogn Sci 10, 59–63 10.1016/j.tics.2005.12.004 [DOI] [PubMed] [Google Scholar]
- Ross E. D. (1981). The aprosodias. Functional-anatomic organization of the affective components of language in the right hemisphere. Arch. Neurol. 38, 561–569 [DOI] [PubMed] [Google Scholar]
- Ross E. D., Edmondson J. A., Seibert G. B., Homan R. W. (1988). Acoustic analysis of affective prosody during right-sided Wada Test: a within-subjects verification of the right hemisphere's role in language. Brain Lang. 33, 128–145 10.1016/0093-934X(88)90058-2 [DOI] [PubMed] [Google Scholar]
- Ross E. D., Monnot M. (2008). Neurology of affective prosody and its functional-anatomic organization in right hemisphere. Brain Lang. 104, 51–74 10.1016/j.bandl.2007.04.007 [DOI] [PubMed] [Google Scholar]
- Sander D., Grandjean D., Pourtois G., Schwartz S., Seghier M. L., Scherer K. R., Vuilleumier P. (2005). Emotion and attention interactions in social cognition: brain regions involved in processing anger prosody. Neuroimage 28, 848–858 10.1016/j.neuroimage.2005.06.023 [DOI] [PubMed] [Google Scholar]
- Schirmer A., Kotz S. A. (2006). Beyond the right hemisphere: brain mechanisms mediating vocal emotional processing. Trends Cogn. Sci. (Regul. Ed.) 10, 24–30 [DOI] [PubMed] [Google Scholar]
- Schirmer A., Kotz S. A., Friederici A. D. (2002). Sex differentiates the role of emotional prosody during word processing. Brain Res. Cogn. Brain Res. 14, 228–233 10.1016/S0926-6410(02)00108-8 [DOI] [PubMed] [Google Scholar]
- Schirmer A., Zysset S., Kotz S. A., Yves von Cramon D. (2004). Gender differences in the activation of inferior frontal cortex during emotional speech perception. Neuroimage 21, 1114–1123 10.1016/j.neuroimage.2003.10.048 [DOI] [PubMed] [Google Scholar]
- Smith S. M. (2002). Fast robust automated brain extraction. Hum. Brain Mapp. 17, 143–155 10.1002/hbm.10062 [DOI] [PMC free article] [PubMed] [Google Scholar]
- Talairach J., Tournoux P. (1988). Co-Planar Steriotaxic Atlas of the Human Brain, 3 Dimensional Proportional System: An Approach to Cerebral Imaging. New York, Thieme Medical Publishers [Google Scholar]
- Thompson-Schill S. L., D'Esposito M., Aguirre G. K., Farah M. J. (1997). Role of left inferior prefrontal cortex in retrieval of semantic knowledge: a reevaluation. Proc. Natl. Acad. Sci. U.S.A. 94, 14792–14797 10.1073/pnas.94.26.14792 [DOI] [PMC free article] [PubMed] [Google Scholar]
- Van Horn J. D., Poldrack R. A. (2009). Functional MRI at the crossroads. Int. J. Psychophysiol. 73, 3–9 10.1016/j.ijpsycho.2008.11.003 [DOI] [PMC free article] [PubMed] [Google Scholar]
- Van Lancker D., Sidtis J. J. (1993). Brain damage and prosody errors reconsidered: reply to Heilman. J. Speech Hear. Res. 36, 1191–1192 [DOI] [PubMed] [Google Scholar]
- Wiethoff S., Wildgruber D., Grodd W., Ethofer T. (2009). Response and habituation of the amygdala during processing of emotional prosody. Neuroreport [Epub ahead of print]. [DOI] [PubMed] [Google Scholar]
- Wiethoff S., Wildgruber D., Kreifelts B., Becker H., Herbert C., Grodd W., Ethofer T. (2008). Cerebral processing of emotional prosody–influence of acoustic parameters and arousal. Neuroimage 39, 885–893 10.1016/j.neuroimage.2007.09.028 [DOI] [PubMed] [Google Scholar]
- Wildgruber D., Hertrich I., Riecker A., Erb M., Anders S., Grodd W., Ackermann H. (2004). Distinct frontal regions subserve evaluation of linguistic and emotional aspects of speech intonation. Cereb. Cortex 14, 1384–1389 10.1093/cercor/bhh099 [DOI] [PubMed] [Google Scholar]
- Wildgruber D., Riecker A., Hertrich I., Erb M., Grodd W., Ethofer T., Ackermann H. (2005). Identification of emotional intonation evaluated by fMRI. Neuroimage 24, 1233–1241 10.1016/j.neuroimage.2004.10.034 [DOI] [PubMed] [Google Scholar]
- Woolrich M. W., Behrens T. E., Beckmann C. F., Jenkinson M., Smith S. M. (2004). Multilevel linear modelling for FMRI group analysis using Bayesian inference. Neuroimage 21, 1732–1747 10.1016/j.neuroimage.2003.12.023 [DOI] [PubMed] [Google Scholar]
- Woolrich M. W., Ripley B. D., Brady M., Smith S. M. (2001). Temporal autocorrelation in univariate linear modeling of FMRI data. Neuroimage 14, 1370–1386 10.1006/nimg.2001.0931 [DOI] [PubMed] [Google Scholar]
- Zatorre R. J., Belin P. (2001). Spectral and temporal processing in human auditory cortex. Cereb. Cortex 11, 946–953 10.1093/cercor/11.10.946 [DOI] [PubMed] [Google Scholar]