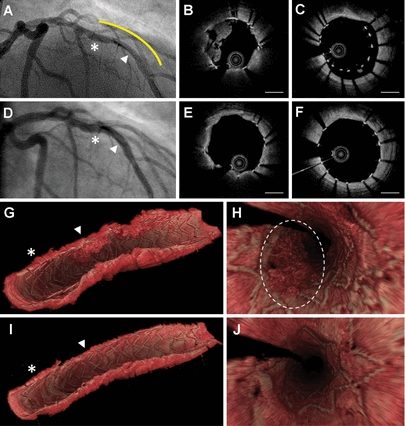
A 64-year-old man with dyslipidaemia, hypertension, and diabetes mellitus underwent percutaneous coronary intervention of the left anterior descending coronary artery because of post-infarct angina. After pre-dilatation, a 3.0/28 mm drug eluting stent was deployed (Panel A). A coronary segment was imaged using Fourier domain optical coherence tomography (FD-OCT; Terumo Corp. Tokyo, Japan) with a total flush volume of 16 mL (motorized pullback 20 mm/s, frame rate 160 fr/s). Intraluminal tissue with low attenuation and irregular surface, indicative of thrombus, was clearly visible in the mid-portion of the stent (Panel B). A malapposition was revealed at the proximal stent edge (Panel C). Based on these OCT findings, that were missed by angiography, the patient received a glycoprotein IIb/IIIa inhibitor, and a post-dilatation was performed using a 3.5 mm balloon at 18 atm. Subsequent angiography showed remarkable additional lumen gain. Intracoronary FD-OCT was able to demonstrate complete strut apposition over the whole stent length and resolution of the intraluminal thrombi (Panels E and F). Three-dimensional reconstruction of the OCT images (INTAGE Realia, KGT, Tokyo, Japan) allows the visualization of the rather complex anatomy of this stented segment in such a way that it is easily and fast comprehensible at a glance. Strut malapposition and intraluminal thrombus are clearly discernable, and their spatial relationship is well visualized (Panels G and H), as well as the impact of the therapeutic regimen (Panels I and J). The patient experienced no procedure-related complication and was discharged within 24 h after the procedure on dual antiplatelet therapy.
Panels show coronary angiography, optical coherence tomography (OCT) and three dimensional OCT immediately after stenting (Panels A–C, G, H) and after post dilatation (Panels D–F, I, J). The yellow line indicates the stented segment. Asterisk and triangle indicate corresponding sites, respectively. Visual direction of virtual endoscopy (Panels H, J) is from proximal site to distal site. Dotted circle indicates intraluminal thrombus in stent. Bar = 1 mm.


