Abstract
The angiotensin receptor-associated protein (Atrap) interacts with angiotensin II (AngII) type 1 (AT1) receptors and facilitates their internalization in vitro, but little is known about the function of Atrap in vivo. Here, we detected Atrap expression in several organs of wild-type mice; the highest expression was in the kidney where it localized to the proximal tubule, particularly the brush border. There was no Atrap expression in the renal vasculature or juxtaglomerular cells. We generated Atrap-deficient (Atrap−/−) mice, which were viable and seemed grossly normal. Mean systolic BP was significantly higher in Atrap−/− mice compared with wild-type mice. Dose-response relationships of arterial BP after acute AngII infusion were similar in both genotypes. Plasma volume was significantly higher and plasma renin concentration was markedly lower in Atrap−/− mice compared with wild-type mice. 125I-AngII binding showed enhanced surface expression of AT1 receptors in the renal cortex of Atrap−/− mice, accompanied by increased carboanhydrase-sensitive proximal tubular function. In summary, Atrap−/− mice have increased arterial pressure and plasma volume. Atrap seems to modulate volume status by acting as a negative regulator of AT1 receptors in the renal tubules.
Angiotensin II (AngII) is the primary end point of the renin-angiotensin (RAS) cascade. AngII exerts multiple functions, including mediation of vasoconstriction, stimulation of aldosterone release, and promotion of renal salt/water reabsorption. These classical effects of AngII, which eventually all result in a rise of arterial blood pressure (BP), are thought to be primarily mediated by AngII type 1 (AT1) receptors. Because changes in the activity of the systemic RAS cascade similarly affect all different accessible target tissues, it is reasonable to assume that strategies that allow for local and temporal modification of the sensitivity of AT1 receptors have evolved. In this context, modulation of AT1 receptor expression, receptor desensitization, and internalization all have been described to modify locally the AT1-related effects of AngII.1–8 In addition, a growing number of proteins seem to bind to the AT1 receptor and either enhance or suppress AT1 receptor function.9–13
Of the known proteins that can interact with AT1 receptors, the function of the angiotensin receptor–associated protein (Atrap) is the best characterized.10,14 Atrap is a 19-kD protein with three potential transmembrane domains, and it binds to the C-terminal intracellular portion of the AT1 receptor.15 Atrap catalyzes the internalization of the AT1 receptor in cultured vascular smooth muscle cells.14,16 Also, Atrap inhibits AngII-mediated intracellular signaling in vitro.17 Overall, the data suggest an inhibitory effect of Atrap on AT1 receptor function in vitro.
Regarding the in vivo function of Atrap, a recently generated transgenic mouse line with overexpression of Atrap in the heart, aorta, and femoral artery showed reduced inflammatory vascular remodeling and reduced heart hypertrophy as compared with transgene-negative controls.18 The authors concluded that Atrap attenuates AT1-mediated signaling under pathophysiologic conditions.18
To assess the in vivo function of Atrap, we generated Atrap-deficient (Atrap−/−) mice. Vascular responsiveness to AngII was virtually unaltered in Atrap−/− mice compared with wild-type mice; however, loss of Atrap resulted in increased plasma volume and elevated arterial BP. Renal cortical AngII binding and acetazolamide-sensitive tubular function were enhanced in Atrap−/− mice compared with wild-type controls. We propose that Atrap is a negative modulator of renal AngII signaling and that loss of Atrap results in enhanced renal reabsorptive function, leading to volume expansion and hypertension.
Results
Generation of Atrap−/− Mice
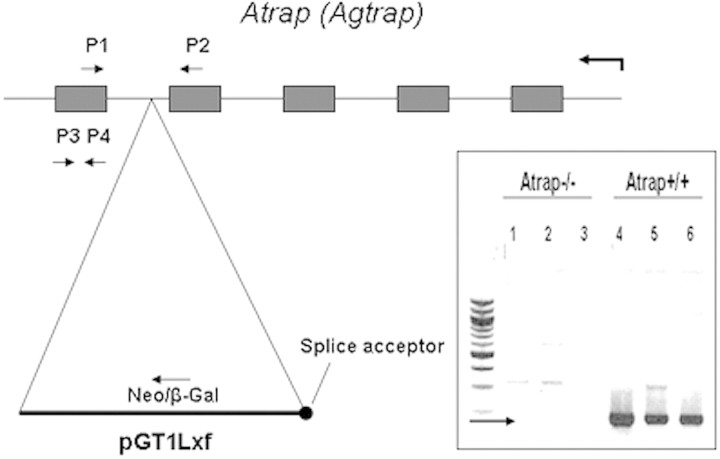
Atrap−/− mice were generated by homologous recombination in embryonic stem cells using a gene trap targeting vector. Analysis of the Atrap transcript by reverse transcriptase–PCR (RT-PCR) revealed the absence of wild-type transcripts in Atrap−/− mice; consequently, no abnormal splice event for the mutated Atrap-transcript would remove the targeting vector (Figure 1). Western blotting with an antibody directed toward the C-terminal end downstream of the neomycin insertion site further confirmed the absence of Atrap wild-type protein in Atrap−/− mice (data not shown). In addition, we were unable to detect any Atrap-neomycin fusion protein by immunoblotting and by immunohistochemistry using the aforementioned anti-Atrap antibody, indicating that the introduction of the gene trap–neomycin cassette into intron 4 of the Atrap gene stopped translation downstream of the neomycin resistance cassette.
Figure 1.
Schematic representation of the structure of the Atrap gene and the insertion site of the pGT1Lxf gene-trap vector. Inset shows results of an RT-PCR for RNA from Atrap−/− and +/+ kidneys using primers 1 and 2. RT-PRC using primer pair P3/P4 yielded no product in Atrap−/− kidneys.
Atrap−/− mice were viable and showed no gross anatomic, behavioral, or fertility abnormalities. They were born at Mendelian ratios.
Atrap Expression Analysis
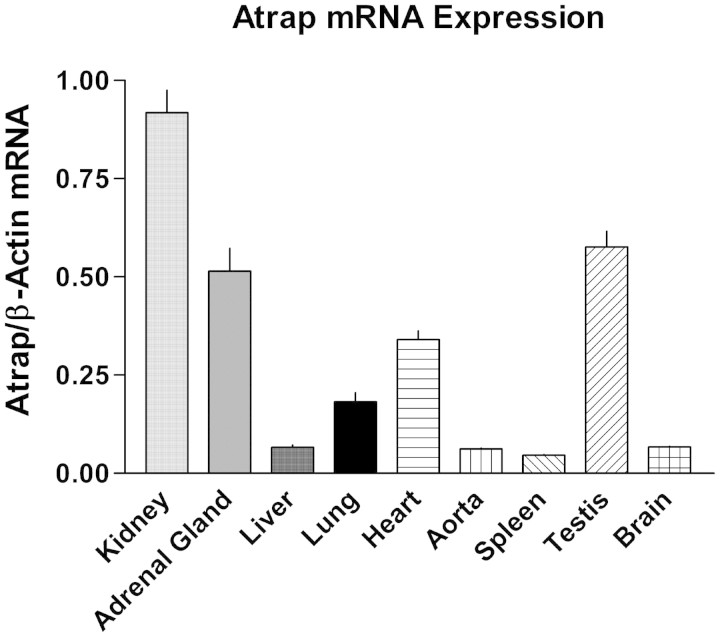
Atrap mRNA distribution was determined by RT-PCR for different organs (Figure 2). Atrap mRNA expression was observed in all organs examined, with the order of mRNA expression levels being kidney > testes ≈ adrenal gland > heart > lung > liver ≈ brain ≈ spleen. Atrap protein localization in the kidney, the organ with the highest mRNA expression level, was assessed by immunohistochemistry. As shown in Figure 3, intensive Atrap immunostaining was observed in the proximal tubules of the renal cortex, whereas essentially no expression was found in the renal medulla. Inspection of Atrap-positive tubules revealed staining of the brush border area with some additional staining of the intracellular compartment of the tubular cells. Apart from a few single scattered cells, there was essentially no overlap of Atrap expression with calbindin and Tamm-Horsfall glycoprotein, which were used as markers for the distal convolute tubule and the cortical thick ascending limb, respectively, confirming that Atrap protein is expressed predominantly in the proximal tubules. Furthermore, there was a marked overlap of immunostaining for Atrap and the proximal tubule marker megalin (Figure 3). We found no detectable Atrap protein in the renal vasculature, as determined by co-staining with the smooth muscle marker SM22 (Figure 3). Also, Atrap was absent from renin-positive juxtaglomerular cells of the afferent arteriole (Figure 3). No Atrap-positive cells were found in kidneys from Atrap−/− mice.
Figure 2.
The kidney is the organ with highest Atrap mRNA expression levels. Atrap mRNA expression was determined by real-time RT-PCR for several organs. Data are relative Atrap mRNA expression normalized to β-actin expression.
Figure 3.
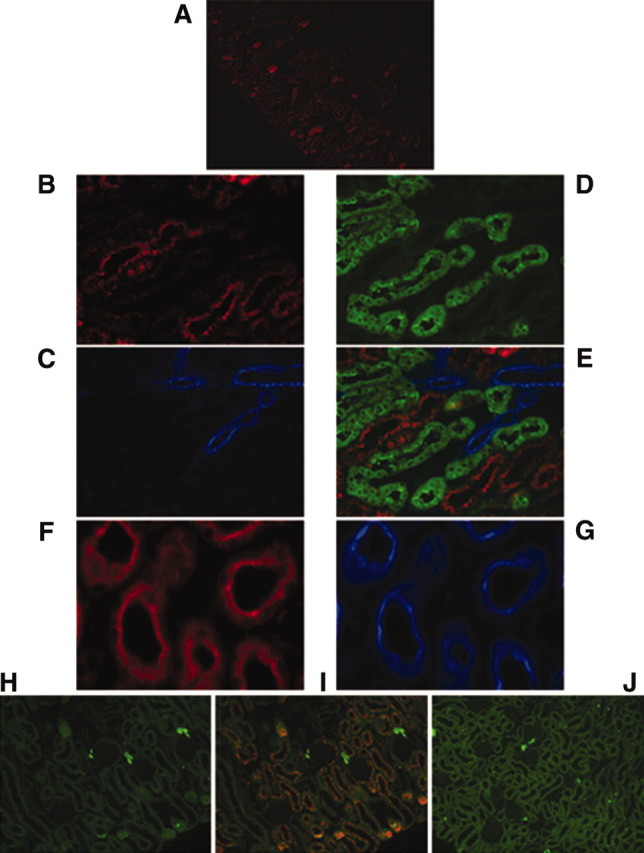
Atrap protein in the mouse kidney localizes predominantly to the proximal tubule. (A) Atrap immunostaining in the renal cortex of a wild-type mouse with marked staining of the proximal tubule. (B through D) Higher magnification pictures of co-staining with anti-Atrap (red; B) anti-SM22 (blue, as a marker for the renal vasculature; C), and anti-calbindin (green, as a marker for the distal convolute tubule; D). (E) An overlay. (F and G) Staining of cross-sections of the proximal tubule with anti Atrap (red; F) and anti megalin (blue; G). (H through J) Immunostaining for renin (green; H) and co-staining with anti-Atrap (red) in the renal cortex of an Atrap+/+ (I) and Atrap−/− (J) mouse.
Atrap protein was also present in other organs, including the adrenal gland, liver, spleen, heart, intestine, and pancreas (data not shown). In the adrenal gland, Atrap-positive cells were found in the zona fasciculata of the adrenal gland cortex (data not shown). With the exception of the liver, there was no appreciable Atrap staining in the vasculature of any of these organs.
Arterial BP in Conscious Mice
Mean arterial BP (MAP) and heart rate were measured by radiotelemetry during 72 hours (1816 measurements) in five Atrap−/− and five wild-type mice during a 12-hour/12-hour light-on/light-off periodicity. Both genotypes showed a circadian rhythm of BP, heart rate, and activity with maxima in all parameters during light-off periods and minima during light-on periods. Activity, measured as movement of the mouse over the receiver grid, was similar in Atrap−/− and +/+ mice (Figure 4). Systolic BP (SBP) and MAP were increased in Atrap−/− mice compared with wild-type mice with a 72-hour average of 120.3 ± 0.7 and 106.5 ± 0.9 versus 112.7 ± 1.1 and 102.1 ± 1.2 mmHg in wild-type mice, respectively (P = 0.0014 and 0.02, respectively; Figure 4). Differences in SBP and MAP were significant for both the light-on and light-off periods. Diastolic BP was numerically elevated in Atrap−/− mice (91.9 ± 1.4 versus 89.2 ± 1.1 mmHg in Atrap+/+) without reaching levels of significance (P = 0.18). Average heart rate was 554 ± 10 bpm in Atrap−/− and 569 ± 8 bpm in Atrap+/+ mice (P = 0.28). In view of the elevated arterial BP in Atrap−/− compared with +/+ mice, heart weight was determined as a measure for cardiac hypertrophy. Relative heart weight was determined as heart/body weight and heart/brain weight ratios. Heart/body weight and heart/brain weight ratios were 0.3600 and 0.0049, 0.2600 and 0.0041, 0.3400 and 0.0046, and 0.2600 and 0.0036 for Atrap−/− male, Atrap−/− female, Atrap+/+ male, and Atrap+/+ female mice, respectively (n = 10 each). Thus, hearts of male mice of each genotype were larger compared with those of females (P < 0.01 for both heart/body weight and heart/brain weight), whereas there was no significant difference between genotypes.
Figure 4.
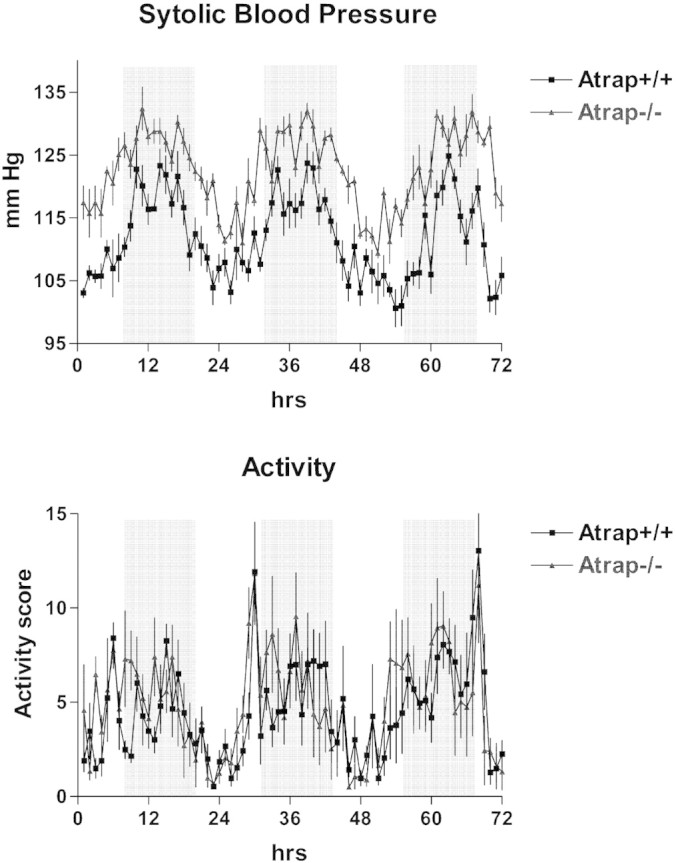
Atrap deficiency causes increased arterial blood pressure. SBP (top) and activity scores (bottom) of Atrap−/− and +/+ mice (n = 5 for each genotype) during a period of 72 hour (telemetry). Mice were kept on a 12-hour light/12-hour dark cycle. Light-off periods are indicated by a gray background.
Arterial BP Dose-Response for AngII (Bolus Infusion, Continuous Infusion)
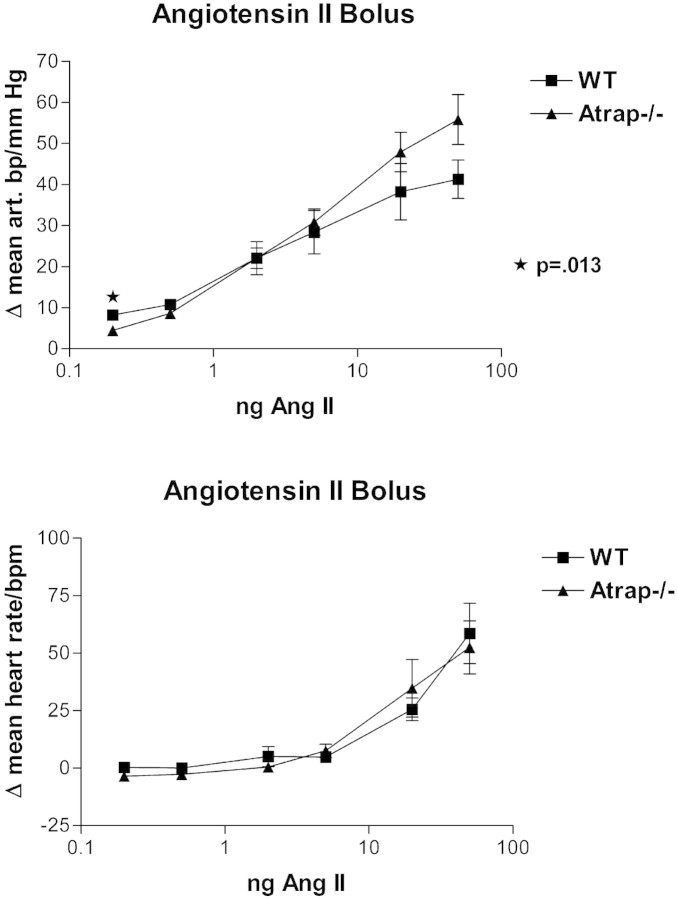
In view of elevated arterial BP in conscious Atrap−/− mice compared with wild-type mice, we determined the dose-response relationship for BP after an AngII bolus infusion in anesthetized mice. Body weight was similar in both groups used in this experiment (29.0 ± 0.9 g for Atrap+/+ [n = 5]; 30.6 ± 1.1 g for Atrap−/− [n = 5]). Baseline MAP under anesthesia was similar in Atrap−/− and +/+ mice, averaging 107.4 ± 0.9 and 105.3 ± 0.7 mmHg, respectively (P = 0.87). Infusion of 0.2, 0.5, 2.0, 5.0, 20.0, and 50.0 ng of AngII increased MAP by 4.5, 8.6, 22.0, 30.9, 47.9, and 55.8 mmHg in Atrap−/− mice and by 8.2, 10.8, 22.1, 28.4, 38.2, and 41.3 mmHg in Atrap+/+ mice (Figure 5A). Thus, changes in MAP were similar in both genotypes except for the lowest AngII dosage, for which the response of Atrap−/− was less pronounced than that of Atrap+/+ mice (P = 0.013). Baseline heart rate did not differ between Atrap−/− and +/+ mice (370 ± 34 versus 361 ± 15, respectively; P = 0.81). Infusion of 0.2, 0.5, 2.0, 5.0, 20.0, and 50.0 ng of AngII had little influence on heart rate at low dosages but increased heart rate at high dosages by up to 53 ± 11 and 59 ± 13 bpm (50 ng of AngII) in Atrap−/− and +/+, respectively (P = 0.77; Figure 5B).
Figure 5.
Atrap deficiency does not alter vascular reactivity in response to AngII. Dose-response curves for MAP (top) and heart rate (bottom) in anesthetized mice after bolus infusion of AngII are shown (n = 5 for each genotype).
To assess a possible influence of Atrap deficiency on tachyphylaxis, we determined in an additional set of experiments changes in BP after repeated AngII bolus infusion and after continuous AngII infusion. Three repetitive bolus infusions (10-minute intervals) of 20 ng of AngII did not alter BP responses in Atrap−/− or in +/+ mice; thus, the change in response between the first and third boluses was + 1.4 ± 1.0 and −1.2 ± 1.4 mmHg in Atrap−/− and wild-type mice, respectively (n = 4; P = 0.35). During continuous infusion (5 ng/min AngII) arterial BP increased by 31 ± 6 mmHg in Atrap−/− and by 33 ± 5 mmHg in wild-type mice after the start of the infusion (P = 0.77). After 45 minutes of continuous AngII infusion, BP had decreased from the peak level by 2.4 ± 2% in Atrap−/− mice, not significantly different from wild-type mice (−3.0 ± 1.4%; P = 0.85).
Plasma Renin Concentration and Plasma Aldosterone Concentration
Basal plasma renin concentration (PRC) was substantially reduced in Atrap−/− mice compared with controls, averaging 246 ± 23 ng AngI/ml per h in Atrap−/− (n = 37) and 502 ± 66 ng AngI/ml per h in Atrap+/+ mice (n = 40; P = 0.0007). To assess renin secretory capacity, we injected a single dose of furosemide (10 mg/kg, intraperitoneally) and determined PRC after 60 minutes. Furosemide administration increased PRC 13.2 ± 2.0-fold in Atrap−/− mice (n = 8) and 9.9 ± 1.8-fold in wild-type mice (n = 8; P = 0.34), indicating that Atrap−/− mice retain their renin secretory ability (Figure 6). Despite marked differences in PRC, plasma aldosterone concentrations were similar in Atrap−/− and wild-type mice, averaging 438 ± 44 and 475 ± 83 pg/ml, respectively (n = 19 each; P = 0.71).
Figure 6.
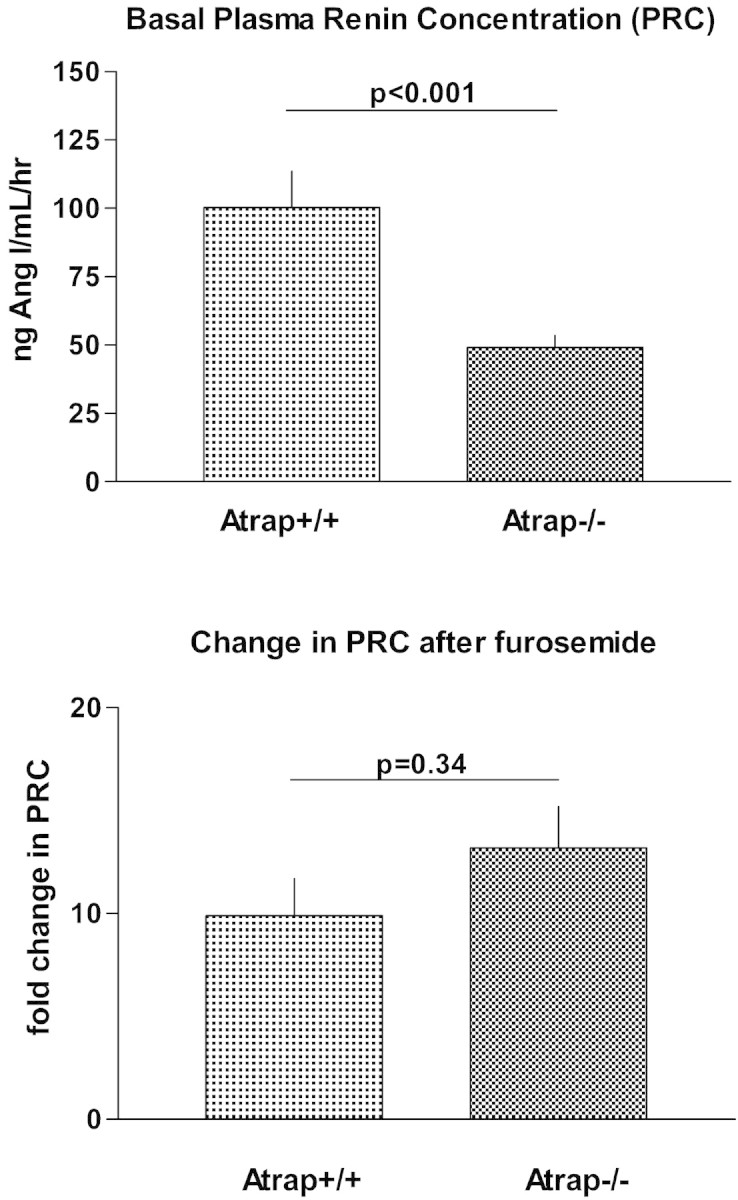
Plasma renin concentration is reduced in Atrap−/− compared to wild-type mice. (Top) Baseline PRC is shown in Atrap−/− (n = 37) and wild-type mice (n = 40). (Bottom) Relative increase in PRC after intraperitoneal injection of furosemide (10 μg/g body wt).
Isolated Perfused Kidney
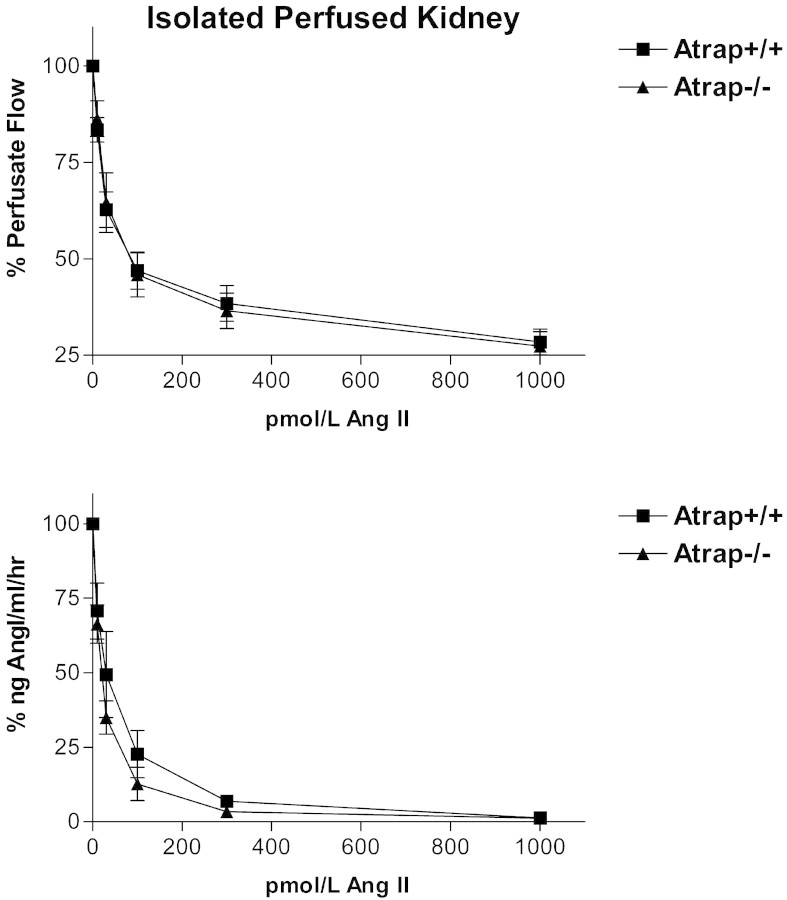
To address renin secretion in a controlled, in vitro setting that excluded systemic factors, we measured renin secretion in the isolated perfused kidney model. After prestimulation with the β-receptor agonist isoproterenol, we assessed the negative feedback of AngII on renin secretion by adding increasing concentrations of AngII to the perfusate. AngII suppressed renin secretion in a dose-dependent manner in the concentration range of 10 pM to 1 nM. As shown in Figure 7, no differences in the dose-response curves were observed between Atrap−/− (n = 5) and wild-type mice (n = 5). Baseline perfusion flow under resting conditions was indistinguishable between Atrap−/− mice and wild-type mice (8.9 ± 0.9 and 9.1 ± 0.4 ml/min per g kidney wt, respectively). Infusion of AngII reduced perfusion flow (constant perfusion pressure) depending on the AngII concentration, with a flow minimum being reached at 1 nM AngII (27.4 ± 3.7 and 28.4 ± 3.3% of baseline for Atrap−/− and +/+ mice, respectively); no significant differences were observed between genotypes (Figure 7).
Figure 7.
Renin secretion is preserved in isolated perfused kidneys from Atrap−/− mice. Renin secretion (top) and perfusate flow (bottom) at constant perfusion pressure of 100 mmHg in isolated perfused kidney from Atrap−/− (n = 5) and +/+ mice (n = 5).
Plasma and Blood Volume
In view of increased arterial BP in Atrap−/− mice in conjunction with essentially unaltered vascular responsiveness to AngII, we determined plasma and blood volume by the Evans Blue dilution method in 18 Atrap−/− and 13 Atrap+/+ mice. Body weight was similar in both groups (26.2 ± 1.3 and 24.8 ± 1.2 g, respectively; P = 0.46). Plasma volume was expanded by 20.5% in Atrap−/− mice in comparison with Atrap+/+ mice, averaging 3.9 ± 0.2 and 3.1 ± 0.2% of body weight, respectively (P = 0.005). Hematocrit was 50.0 ± 0.6% in Atrap−/− and 51.3 ± 0.6% in Atrap+/+ mice (P = 0.14). Consequently, blood volume was increased by 19.0% in Atrap−/− mice compared with controls (7.9 ± 0.4% in Atrap−/− versus 6.4 ± 0.4% of body weight in Atrap+/+; P = 0.01; Figure 8).
Figure 8.
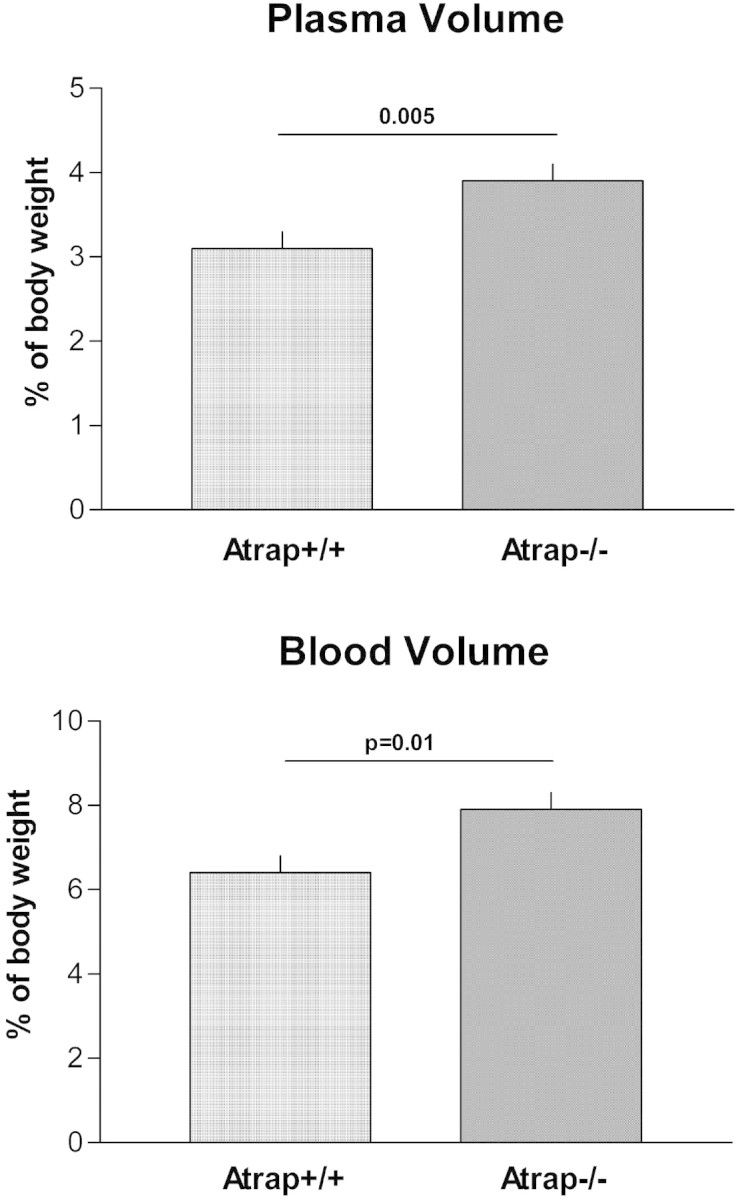
Atrap deficiency causes plasma and blood volume expansion. Plasma (top) and blood volume (bottom) of Atrap−/− (n = 18) and wild-type mice (n = 13) determined by the Evans Blue dilution method.
AngII Binding Study
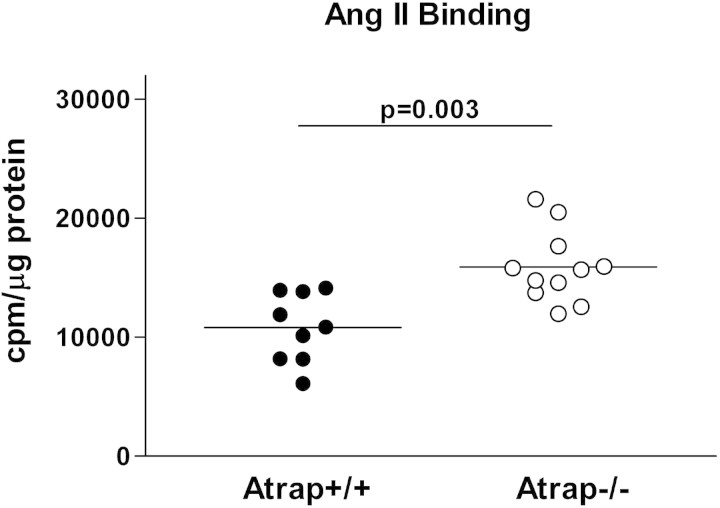
Considering the increased plasma volume of Atrap−/− mice, we assessed the consequence of loss of Atrap on functional AT1 receptor membrane expression in the kidney. Because Atrap expression in the kidney was limited to the proximal tubules, we used a membrane fraction of the renal cortex for the AngII binding studies. In a pilot experiment, we determined AT1 receptor mRNA expression levels in the renal cortex of Atrap−/− and +/+ mice by RT-PCR. AT1 mRNA levels were similar in both genotypes, averaging 0.76 ± 0.20 and 0.99 ± 0.20 relative units in Atrap−/− and +/+ mice, respectively (n = 5 each; P = 0.2). 125I-AngII binding was measured in the presence of the AT2 receptor antagonist PD123319 (100 μM). A membrane preparation from renal cortices of AT1a/b double-knockout mice served as a negative control. Binding of 125I-AngII to renal cortical membranes from AT1a/b double-knockout mice was similar to 125I-AngII binding in the presence of excess cold AngII (data not shown). 125I-AngII binding was markedly augmented in renal cortical membranes from Atrap−/− mice compared with wild-type mice, averaging 15,900 ± 909 cpm/μg protein in Atrap−/− (n = 11) and 10,900 ± 1100 cpm/μg protein in Atrap+/+ mice (n = 9; P = 0.003; Figure 9).
Figure 9.
Atrap deficiency enhances renal cortical AngII binding. 125I-AngII binding was measured for membranes isolated from renal cortices of Atrap−/− (n = 11) and wild-type mice (n = 9). Data are cpm/μg protein.
Renal Tubular Function
In view of enhanced renal AngII binding accompanied by increased plasma volume, we assessed basic parameters of renal tubular function. Ambient urine osmolarity was similar in Atrap−/− mice compared with Atrap+/+, averaging 1372 ± 173 mosmol/L in Atrap−/− (n = 13) and 1833 ± 240 mosmol/L in Atrap+/+ mice (n = 12; P = 0.13). Twenty-four-hour urine volume was similar in Atrap−/− and Atrap+/+ mice (2.6 ± 0.4 and 2.2 ± 0.3 ml/24 h; n = 6; P = 0.55). Urine pH was significantly lower in Atrap−/− compared with Atrap+/+ mice, averaging 6.51 ± 0.11 and 7.12 ± 0.13, respectively (n = 40 and 36, respectively; P = 0.0008) (Figure 10). To address proximal tubular function, the predominant site of renal Atrap expression, we used the carboanhydrase inhibitor acetazolamide to reduce proximal tubular salt reabsorption. Acetazolamide induced marked diuresis in both genotypes with 2-hour urine volume being significantly larger in Atrap−/− compared with wild-type mice (1.01 ± 0.08 versus 0.75 ± 0.07 ml for Atrap−/− and Atrap+/+, respectively; n = 20 each; P = 0.02). Acetazolamide alkalized the urine in both genotypes and abolished urinary pH differences between Atrap−/− and wild-type mice (8.29 ± 0.08 for Atrap−/− and 8.46 ± 0.06 for Atrap+/+; P = 0.09). Thus, the change in urine pH after acetazolamide was 1.78 ± 0.12 in Atrap−/− and 1.34 ± 0.10 in Atrap+/+ mice (P = 0.001).
Figure 10.
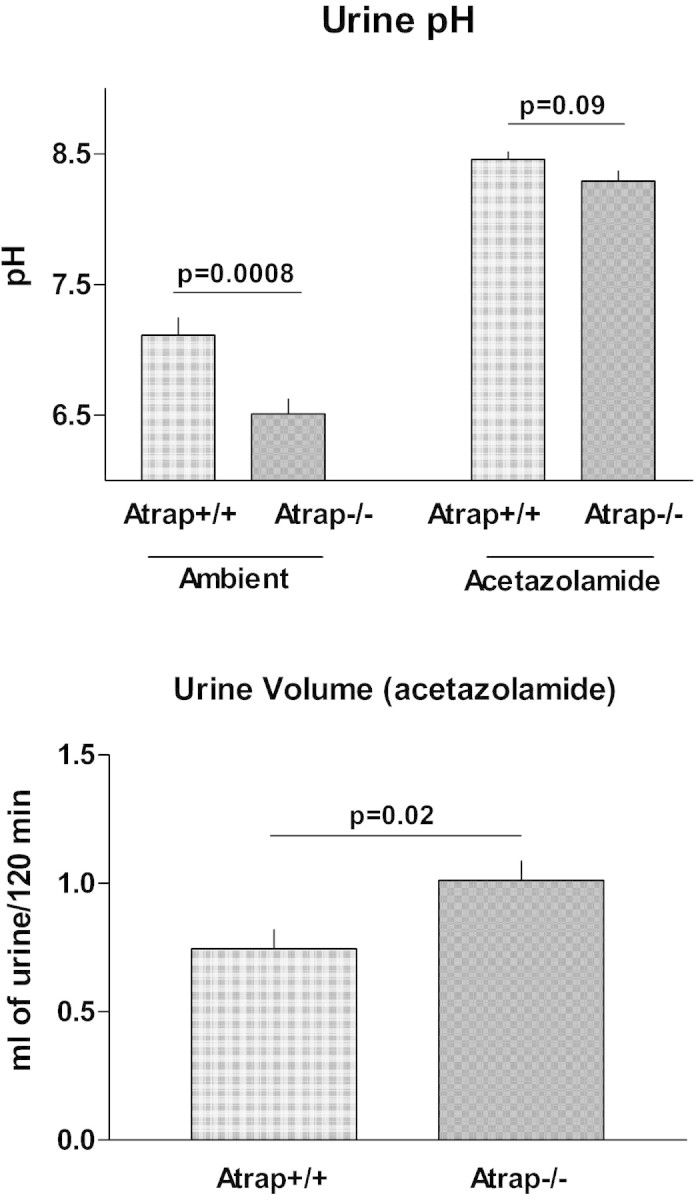
Atrap deficiency causes low urinary pH and enhances renal carboanhydrase inhibitor sensitivity. (Top) Urinary pH of Atrap−/− (n = 40) and Atrap+/+ (n = 36) under ambient conditions and after the application of the carboanhydrase inhibitor acetazolamide (40 μg/g body wt; n = 20 for each genotype). (Bottom) Urine volume collected during a period of 120 minutes after application of acetazolamide in Atrap−/− (n = 20) and wild-type mice (n = 20).
Discussion
In vitro data suggest that Atrap is a negative regulator of AT1 receptor function. The focus of this study was to investigate the role of Atrap for AT1 receptor function in vivo.
To generate a null mutation of the Atrap gene, we performed gene targeting by a gene-trap approach. The absence of wild-type Atrap expression in Atrap−/− mice was established by two approaches. First, absence of Atrap wild-type transcripts as determined by RT-PCR with primers flanking the vector insertion site indicated that no splice events that would remove the vector sequence occurred. Second, immunoblotting and immunohistochemistry with an antibody directed against an epitope located downstream of the vector insertion site confirmed the absence of any detectable run-through translational product. Of note, the deleted region of the Atrap protein contains the region that was previously shown to facilitate Atrap–AT1 receptor interaction.15
We found Atrap expression in several organs, with the highest expression levels in the kidney. This result is in agreement with a recent study that addressed the tissue distribution of Atrap by Western blotting.19 Co-staining with the vascular smooth muscle cell marker SM22 revealed virtually no Atrap expression in blood vessels. This observation is congruent with a report that indicated very low levels of Atrap expression in the aorta as determined by Western blotting and no Atrap expression in the vasculature of the kidney as determined by immunostaining.19 In the kidney, the organ with the highest Atrap expression, Atrap was expressed predominantly in the proximal tubule. This finding is in agreement with another renal localization study19; however, unlike this recent study, we did not find significant tubular Atrap expression in segments other than the proximal tubule, although scattered single cells of the thick ascending limb and the distal convoluted tubule seemed to express Atrap. This discrepancy may be related to different sensitivity or specificity of the antibodies used. Of note, we detected no Atrap staining in kidneys from Atrap−/− mice, suggesting a decent specificity of our antibody. Atrap in the plasma membrane of proximal tubular cells was predominantly present in the apical aspect of the cell, overlapping with the site of highest AT1 receptor density.20
The main observation of our study is that Atrap deficiency results in increased arterial BP and blood volume expansion. SBP, as measured by radiotelemetry over 3 days, was elevated by approximately 8 mmHg in Atrap−/− mice compared with Atrap+/+ mice. The magnitude of change seems considerable when bearing in mind that complete loss of AT1 receptors results in a drop in SBP of approximately 24 mmHg in AT1a and 27 mmHg in AT1a/b double-knockout mice.21,22
To evaluate the basis for increased BP, we assessed AngII-dependent vascular reactivity and volume status of Atrap−/− mice. Increases in BP after bolus infusion of AngII were similar in anesthetized Atrap−/− and +/+ mice, with an exception of the lowest dosage, which triggered a more pronounced rise in BP in wild-type than in Atrap−/− mice. This observation is unexpected assuming a negative regulatory effect of Atrap on AT1 receptor function as supported by several in vitro studies14,15,18,23; however, because we did not detect significant Atrap protein expression in the vasculature, it seems likely that this observation is due to some indirect effect. Pre-experimental long-term exposure to different BP in Atrap−/− and +/+ mice may have influenced AT1 receptor expression and/or sensitivity in resistance vessels.24 Regardless of the exact reason for this finding, our data suggest that vascular Atrap deficiency is not primarily involved in elevating BP in Atrap−/− mice.
In addition to being one of the most potent known vasoconstrictors, AngII influences volume status by a direct stimulation of renal tubular salt and water reabsorption. This effect was reported to be mediated by AT1 receptors, which are abundantly expressed along the renal tubular system with highest densities in the apical membrane of the proximal tubule.25–27 Because Atrap was localized predominantly in the proximal tubule, it seems feasible that Atrap modulates AT1 receptor function in this segment, which facilitates the bulk of renal salt/water reabsorption. In fact, membrane AngII binding in the renal cortex was increased by 46% in Atrap−/− mice compared with wild-type mice despite similar AT1 gene expression levels. These data suggest that Atrap reduces proximal tubular AT1 surface expression, as shown before by in vitro studies.14,16,18 Enhanced AngII binding to the proximal tubule of Atrap−/− mice would be expected to stimulate tubular salt and water reabsorption and promote acid excretion predominantly by stimulation of the Na/H exchanger NHE-3.20,28,29 Thus, that we found lower urinary pH in Atrap−/− mice in comparison with wild-type mice would be in line with increased AngII-dependent NHE-3 activity in the proximal tubule of Atrap−/− mice. Furthermore, inhibition of proximal tubular function by the carboanhydrase inhibitor acetazolamide resulted in a more pronounced diuresis in Atrap−/− mice than in wild-type mice, suggesting an augmented baseline NHE-3–dependent reabsorption in Atrap−/− mice. Urinary pH after application of acetazolamide was indistinguishable between Atrap−/− and wild-type mice, indicating that lower basal urinary pH in Atrap−/− mice is related to altered proximal tubular function. In view of enhanced renal cortical AngII binding and enhanced proximal tubular reabsorption in Atrap−/− mice, we propose that Atrap acts as a negative regulator of renal tubular AT1 receptors in vivo.
Congruent with enhanced AngII-dependent proximal tubular reabsorption, plasma and blood volume were increased in Atrap−/− mice in comparison with wild-type mice. Hematocrit for both genotypes was in the upper normal range30 and was not different between Atrap−/− and +/+ mice, as reported before for other models of chronic volume expansion.31,32
PRC and, by inference, renin secretion were suppressed in Atrap−/− mice. The absence of Atrap from renin-generating granular cells of the afferent arteriole indicates the operation of an indirect effect on renin secretion in Atrap−/− mice. When exposed to furosemide, a potent stimulator of renin secretion,33 the rise in PRC was similar in both Atrap−/− and +/+ mice, suggesting that renin secretion per se was preserved in Atrap−/− mice. Intact renin secretory capacity in Atrap−/− mice was further confirmed by experiments using the isolated perfused kidney model whereby renin secretion was indistinguishable between Atrap−/− and wild-type controls. The inverse relationship between BP and PRC is well established, and it seems that increased BP most likely accounts for a suppression of the renin system in Atrap−/− mice in vivo.
In summary, Atrap−/− mice show increased arterial BP, they are volume expanded, and their renin system is indirectly suppressed. The overall relevance of Atrap for vascular AT1 receptor function seems limited; however, our data suggest that Atrap acts as a negative regulator of AT1 receptors in the tubular system of the kidney. Thus, Atrap seems to be involved in the modulation of proximal tubular reabsorptive function, and, consequently, in the control of volume status and BP.
Concise Methods
Generation of Atrap−/− Mice
Atrap−/− mice were generated by homologous recombination in embryonic stem cells according to gene-trap protocols. Clone XE129 (BayGenomics), which was confirmed to have an integration of a gene-trap vector (pGT1Lxf) into intron 4 of the Atrap gene, was used for blastocyst injection and subsequent foster mother implantation.34 Two male chimeras were obtained, both of which transmitted the mutated allele to the germline. As shown in Figure 1, the gene-trap vector contained a splice-acceptor sequence upstream of a reporter/selection expression cassette coding for a fusion protein of β-galactosidase and neomycin phosphotransferase II. As a result of the integration event, 40 amino acids of the C-terminal end of Atrap were predicted to be replaced by the β-galactosidase/neomycin phosphotransferase II fusion protein. To discriminate between wild-type and mutated Atrap transcript, we designed primers for RT-PCR located in the exons up- and downstream of the insertion site (5′-CAGCTTGGCCCTTGTTCTCCAG-3′ and 5′-CATCCTCAGCTTGCTGCTGAAG-3′), yielding a PCR product of 194 bp in wild-type mice only. The same primers were used for genotyping to detect the wild-type allele (1152 bp), whereas the mutated allele (>10 kb) was not detected under standard PCR conditions. Primers for detecting neomycin were 5′-GGGTGGAGAGGCTATTCGGCT-3′ and 5′-CCACAGTCGATGAATCCAGAA-3′ (product size 603 bp). For all experiments, Atrap−/− and +/+ littermates were used from heterozygous breeding pairs. All animal experiments were performed according to the National Institutes of Health Guide for the Care and Use of Laboratory Animals and were approved by the local authorities.
Localization Study (RT-PCR and Immunohistochemistry)
Total RNA from various organs of Atrap−/− and wild-type mice was isolated using Trizol reagent (Life Technologies, Carlsbad, CA). After reverse transcription, real-time PCR was performed for Atrap, AT1 receptor, and β-actin using a Light-Cycler system (Roche, Mannheim, Germany). For immunohistochemistry assays, an anti-mouse Atrap antibody was generated in rabbits according to standard protocols using a 13–amino acid immunizing peptide (amino acids 148 through 161 of the C-terminal tail of the Atrap protein19). Commercial antibodies were used for detection of SM22, calbindin, Tamm-Horsfall glycoprotein (Santa Cruz Biotechnology, Santa Cruz, CA), megalin (gift from Dr. Bachmann, Charite, Berlin, Germany) and renin (Davids Biotechnologie, Regensburg, Germany). For tissue fixation, anesthetized mice were perfused through the abdominal aorta with 10 ml of PBS followed by 15 ml of 3% PFA/PBS. Organs were removed and stored in 70% methanol before paraffin embedding. Immunostaining was performed as described previously.35
Western Blotting
Western blotting for Atrap was performed according to standard protocols using the same anti-Atrap antibody as described already.
BP Telemetry
The Data Sciences International telemetry system (St. Paul, MN) was used for experiments. Transmitters (model TA11PA-C10) were magnetically activated >24 hours before implantation. In mice anesthetized with ketamine and xylazine (90 and 10 mg/kg, respectively), the telemeter catheter was inserted into the left carotid artery and advanced into the aortic arch, with the telemeter body positioned in a subcutaneous pocket on the right flank. After a 1-week recovery, recordings were begun on the morning of the eighth day, with 10-second samplings every 2 minutes for at least 3 days for each animal. Radio signals were processed using a model RPC-1 receiver, a 20-channel data exchange matrix, APR-1 ambient pressure monitor, and a Data Quest ART Silver 2.3 acquisition system. The recording room was maintained at 21 to 22°C with a 12-hour light/12-hour dark cycle.
BP Measurements in Anesthetized Mice
Mice were anesthetized with 100 mg/kg thiobutabarbital (inactin) intraperitoneally and 100 mg/kg ketamine subcutaneously. Body temperature was maintained at 38.0°C by placing the animals on an operating table with a servocontrolled heating plate. The trachea was cannulated, and a stream of 100% oxygen was blown toward the tracheal tube throughout the experiment. The left carotid artery was catheterized with hand-drawn polyethylene tubing for continuous measurement of arterial BP. A catheter was also inserted into the right jugular vein for an intravenous maintenance infusion of saline at a rate of 12 μl/g body wt per h. Increasing dosages of AngII were given as bolus infusions; a next bolus was applied when BP had returned to baseline values; thus, the time interval between single boluses was between 2 and 6 minutes. In an additional series of experiments, repetitive boluses of the same dosage were given. Finally, in a last set of experiments, continuous infusions of 5 ng/min AngII were given over 45 minutes.
Isolated Perfused Kidney
Mice were anesthetized with an intraperitoneal injection of 12 mg/kg xylazine and 80 mg/kg ketamine-HCl. The abdominal aorta was cannulated, and the right kidney was excised, placed in a thermostated moistening chamber (37°C), and perfused at constant pressure (100 mmHg). Finally, the renal vein was cannulated, and samples of the venous perfusate were taken every 3 minutes for determination of renin activity. Unsampled perfusate was discarded. The basic perfusion medium consisted of a modified Krebs-Henseleit solution, supplemented with 6 g/100 ml BSA and human red blood cells (10% hematocrit), as described previously.36
For determination of renin activity, the perfusate samples were incubated for 1.5 hours at 37°C with plasma from bilaterally nephrectomized male rats as renin substrate. AngI (ng/ml per h) generation was measured with an RIA kit (Byk & DiaSorin Diagnostics, Taufkirchen, Germany), and renin secretion rates were calculated as the product of renin activity and venous flow rate (ml/min per g kidney wt).
PRC and Plasma Aldosterone Concentration
Blood was collected from conscious mice by puncture of the submandibular vessels with a 19-G needle and collection of approximately 20 μl of the emerging blood into an EDTA-containing microhematocrit tube. PRC was measured with an RIA kit (Byk & DiaSorin Diagnostics) in the presence of excess exogenous rat substrate. For assessment of acute renin secretory capacity, mice received a single intraperitoneal injection of furosemide (10 mg/kg), and blood was collected after 60 minutes. Plasma aldosterone was determined using an aldosterone ELISA kit (Diagnostic Biochem Canada, London, Ontario, Canada). Fifty microliters of a 1:5 dilution of plasma was used in the assay.
Determination of Plasma and Blood Volume
Plasma volume was measured in conscious mice as the distribution volume of injected Evans Blue.37 After measurement of hematocrit and baseline absorbance at 620 nm, 30 μl of a 5-mg/ml Evans Blue (Sigma-Aldrich, Munich, Germany) saline solution was injected into the tail vein with a Hamilton Gastight syringe (30-G needle). After 10 and 30 minutes, blood samples were collected by tail-vein puncture into 5-μl heparinized capillaries (Brand, Wertheim, Germany), and plasma was separated by centrifugation. Evans Blue absorbance was read at 620 nm at a 1:5 dilution with a Nanodrop ND-1000 Spectrophotometer (Peqlab Biotechnologie, Erlangen, Germany). Plasma Evans blue concentration was calculated according to a standard curve generated by a serial dilution of the 5-mg/ml Evans Blue saline solution. Plasma volume was calculated using a linear regression model.
AngII Binding Study
After the mice were killed, the kidneys were rapidly excised and washed in cold saline. Then, the cortices were dissected, frozen in liquid nitrogen, and stored at −80°C. All of the following preparations steps were performed at 4°C. A total of 200 mg of renal cortex was homogenized using an Ultraturax homogenizer in 1.3 ml of isotonic buffer (50 mmol/L Tris/HCl [pH 7.4], 250 mmol/L sucrose, 0.1 mmol/L PMSF, 10 μg/ml benzamide, and 10 μg/ml leupeptin). The homogenate was centrifuged at 1000 × g for 10 minutes at 4°C; the supernatant was recovered and centrifuged at 9000 × g for 20 minutes at 4°C, followed by two additional centrifugation steps (26,000 × g). The supernatant was re-centrifuged at 105,000 × g for 60 min at 4°C. The resultant pellet was suspended in 1 ml of binding buffer (75 mmol/L Tris/HCl [pH 7.4], 1 mmol/L EDTA, 12.5 mmol/L MgCl2, 0.1 mmol/L PMSF, 10 μg/ml benzamide, and 10 μg/ml leupeptin), pressed 15 times with a 27-G cannula, and recentrifuged. This washing procedure was repeated three times. The final pellet was resuspended in 0.8 ml of binding buffer and used for radioligand receptor binding experiments. Protein concentrations were determined by a Bio-Rad protein assay kit (Bio-Rad 5000-0001), with BSA as a standard. Renal membranes were stored in aliquots at concentrations of 10 mg/ml at −80°C until further use. One milligram of membranes was suspended in 500 μl of binding buffer supplemented with 1 to 200 pmol/L, 2200 Ci/mmol 125I-[Tyr4]AngII (NEN PerkinElmer NEX 105), 0.1 mmol/L Enalapril, and the AT2 receptor antagonist PD123319 (100 μM), in the absence or presence of unlabeled AngII (1 μmol/L) for determination of nonspecific binding. Membrane preparations from renal cortices of AT1a/b double-knockout mice served as an additional control for AT1 receptor-independent binding. The samples were incubated for 90 min at 22°C. The incubation was terminated by vacuum filtration (48-well Brandel MB-48R harvester) over glass fiber filters (GF/C filters; Whatman) followed by three wash steps with 3 ml of ice-cold binding buffer. The radioactivity trapped on the filters was quantified with an automatic γ counter.
Urine Osmolarity and Urine pH
Urine osmolarities under ambient conditions were determined in spot urine samples of conscious mice by the freezing point depression method. Ambient urine pH was determined in spot urine samples with a pH glass electrode. Twenty-four-hour urine was collected in metabolic cages under a layer of mineral oil after mice were accustomed to the metabolic cage for 3 days. For assessment of proximal tubular function as the main nonvascular target of AngII in the kidney in conscious mice, the carboanhydrase inhibitor acetazolamide (Sigma, Munich, Germany) was given by gavage (40 μg/g body wt in 100 μl of water) and urine was subsequently collected for 120 minutes.
Statistical Analysis
Data are expressed as means ± SEM. Statistical comparisons were made by t test or by ANOVA with Bonferroni post hoc test when necessary.
Disclosures
None.
Acknowledgments
H.C. was supported by intramural funding from the University of Regensburg (Förderlinie C) and by a grant from the Deutsche Forschungsgemeinschaft (SFB699).
Blastocyst injections were performed at the Mutant Mouse Regional Resource Center, University of California, Davis. We thank Veronika Kattler for expert technical assistance.
Footnotes
Published online ahead of print. Publication date available at www.jasn.org.
References
- 1. Conchon S, Peltier N, Corvol P, Clauser E: A noninternalized nondesensitized truncated AT1A receptor transduces an amplified ANG II signal. Am J Physiol 274: E336–E345, 1998 [DOI] [PubMed] [Google Scholar]
- 2. Du Y, Yao A, Guo D, Inagami T, Wang DH: Differential regulation of angiotensin II receptor subtypes in rat kidney by low dietary sodium. Hypertension 25: 872–877, 1995 [DOI] [PubMed] [Google Scholar]
- 3. Hunyady L, Baukal AJ, Balla T, Catt KJ: Independence of type I angiotensin II receptor endocytosis from G protein coupling and signal transduction. J Biol Chem 269: 24798–24804, 1994 [PubMed] [Google Scholar]
- 4. Iwai N, Yamano Y, Chaki S, Konishi F, Bardhan S, Tibbetts C, Sasaki K, Hasegawa M, Matsuda Y, Inagami T: Rat angiotensin II receptor: cDNA sequence and regulation of the gene expression. Biochem Biophys Res Commun 177: 299–304, 1991 [DOI] [PubMed] [Google Scholar]
- 5. Schmid C, Castrop H, Reitbauer J, Della Bruna R, Kurtz A: Dietary salt intake modulates angiotensin II type 1 receptor gene expression. Hypertension 29: 923–929, 1997 [DOI] [PubMed] [Google Scholar]
- 6. Tang H, Guo DF, Porter JP, Wanaka Y, Inagami T: Role of cytoplasmic tail of the type 1A angiotensin II receptor in agonist- and phorbol ester-induced desensitization. Circ Res 82: 523–531, 1998 [DOI] [PubMed] [Google Scholar]
- 7. Thomas WG, Thekkumkara TJ, Motel TJ, Baker KM: Stable expression of a truncated AT1A receptor in CHO-K1 cells: The carboxyl-terminal region directs agonist-induced internalization but not receptor signaling or desensitization. J Biol Chem 270: 207–213, 1995 [DOI] [PubMed] [Google Scholar]
- 8. Wang DH, Du Y: Distinct mechanisms of upregulation of type 1A angiotensin II receptor gene expression in kidney and adrenal gland. Hypertension 26: 1134–1137, 1995 [DOI] [PubMed] [Google Scholar]
- 9. Cook JL, Re RN, deHaro DL, Abadie JM, Peters M, Alam J: The trafficking protein GABARAP binds to and enhances plasma membrane expression and function of the angiotensin II type 1 receptor. Circ Res 102: 1539–1547, 2008 [DOI] [PMC free article] [PubMed] [Google Scholar]
- 10. Daviet L, Lehtonen JY, Tamura K, Griese DP, Horiuchi M, Dzau VJ: Cloning and characterization of ATRAP, a novel protein that interacts with the angiotensin II type 1 receptor. J Biol Chem 274: 17058–17062, 1999 [DOI] [PubMed] [Google Scholar]
- 11. Guo DF, Chenier I, Tardif V, Orlov SN, Inagami T: Type 1 angiotensin II receptor-associated protein ARAP1 binds and recycles the receptor to the plasma membrane. Biochem Biophys Res Commun 310: 1254–1265, 2003 [DOI] [PubMed] [Google Scholar]
- 12. Shivakumar BR, Wang Z, Hammond TG, Harris RC: EP24.15 interacts with the angiotensin II type I receptor and bradykinin B2 receptor. Cell Biochem Funct 23: 195–204, 2005 [DOI] [PubMed] [Google Scholar]
- 13. Szaszak M, Chen HD, Chen HC, Baukal A, Hunyady L, Catt KJ: Identification of the invariant chain (CD74) as an angiotensin AGTR1-interacting protein. J Endocrinol 199: 165–176, 2008 [DOI] [PubMed] [Google Scholar]
- 14. Cui T, Nakagami H, Iwai M, Takeda Y, Shiuchi T, Tamura K, Daviet L, Horiuchi M: ATRAP, novel AT1 receptor associated protein, enhances internalization of AT1 receptor and inhibits vascular smooth muscle cell growth. Biochem Biophys Res Commun 279: 938–941, 2000 [DOI] [PubMed] [Google Scholar]
- 15. Lopez-Ilasaca M, Liu X, Tamura K, Dzau VJ: The angiotensin II type I receptor-associated protein, ATRAP, is a transmembrane protein and a modulator of angiotensin II signaling. Mol Biol Cell 14: 5038–5050, 2003 [DOI] [PMC free article] [PubMed] [Google Scholar]
- 16. Azuma K, Tamura K, Shigenaga A, Wakui H, Masuda S, Tsurumi-Ikeya Y, Tanaka Y, Sakai M, Matsuda M, Hashimoto T, Ishigami T, Lopez-Ilasaca M, Umemura S: Novel regulatory effect of angiotensin II type 1 receptor-interacting molecule on vascular smooth muscle cells. Hypertension 50: 926–932, 2007 [DOI] [PubMed] [Google Scholar]
- 17. Tanaka Y, Tamura K, Koide Y, Sakai M, Tsurumi Y, Noda Y, Umemura M, Ishigami T, Uchino K, Kimura K, Horiuchi M, Umemura S: The novel angiotensin II type 1 receptor (AT1R)-associated protein ATRAP downregulates AT1R and ameliorates cardiomyocyte hypertrophy. FEBS Lett 579: 1579–1586, 2005 [DOI] [PubMed] [Google Scholar]
- 18. Oshita A, Iwai M, Chen R, Ide A, Okumura M, Fukunaga S, Yoshii T, Mogi M, Higaki J, Horiuchi M: Attenuation of inflammatory vascular remodeling by angiotensin II type 1 receptor-associated protein. Hypertension 48: 671–676, 2006 [DOI] [PubMed] [Google Scholar]
- 19. Tsurumi Y, Tamura K, Tanaka Y, Koide Y, Sakai M, Yabana M, Noda Y, Hashimoto T, Kihara M, Hirawa N, Toya Y, Kiuchi Y, Iwai M, Horiuchi M, Umemura S: Interacting molecule of AT1 receptor, ATRAP, is colocalized with AT1 receptor in the mouse renal tubules. Kidney Int 69: 488–494, 2006 [DOI] [PubMed] [Google Scholar]
- 20. Kolb RJ, Woost PG, Hopfer U: Membrane trafficking of angiotensin receptor type-1 and mechanochemical signal transduction in proximal tubule cells. Hypertension 44: 352–359, 2004 [DOI] [PubMed] [Google Scholar]
- 21. Ito M, Oliverio MI, Mannon PJ, Best CF, Maeda N, Smithies O, Coffman TM: Regulation of blood pressure by the type 1A angiotensin II receptor gene. Proc Natl Acad Sci U S A 92: 3521–3525, 1995 [DOI] [PMC free article] [PubMed] [Google Scholar]
- 22. Oliverio MI, Kim HS, Ito M, Le T, Audoly L, Best CF, Hiller S, Kluckman K, Maeda N, Smithies O, Coffman TM: Reduced growth, abnormal kidney structure, and type 2 (AT2) angiotensin receptor-mediated blood pressure regulation in mice lacking both AT1A and AT1B receptors for angiotensin II. Proc Natl Acad Sci U S A 95: 15496–15501, 1998 [DOI] [PMC free article] [PubMed] [Google Scholar]
- 23. Li Z, Wang ZG, Chen X, Chen XD: Inhibitory effect of angiotensin II type 1 receptor-associated protein on vascular smooth muscle cell growth and neointimal formation. Chin Med Sci J 22: 22–26, 2007 [PubMed] [Google Scholar]
- 24. Nickenig G, Laufs U, Schnabel P, Knorr A, Paul M, Bohm MP: Down-regulation of aortic and cardiac AT1 receptor gene expression in transgenic (mRen-2) 27 rats. Br J Pharmacol 121: 134–140, 1997 [DOI] [PMC free article] [PubMed] [Google Scholar]
- 25. Harrison-Bernard LM, Navar LG, Ho MM, Vinson GP, el-Dahr SS: Immunohistochemical localization of ANG II AT1 receptor in adult rat kidney using a monoclonal antibody. Am J Physiol 273: F170–F177, 1997 [DOI] [PubMed] [Google Scholar]
- 26. Matsubara H, Sugaya T, Murasawa S, Nozawa Y, Mori Y, Masaki H, Maruyama K, Tsutumi Y, Shibasaki Y, Moriguchi Y, Tanaka Y, Iwasaka T, Inada M: Tissue-specific expression of human angiotensin II AT1 and AT2 receptors and cellular localization of subtype mRNAs in adult human renal cortex using in situ hybridization. Nephron 80: 25–34, 1998 [DOI] [PubMed] [Google Scholar]
- 27. Miyata N, Park F, Li XF, Cowley AW, Jr: Distribution of angiotensin AT1 and AT2 receptor subtypes in the rat kidney. Am J Physiol 277: F437–F446, 1999 [DOI] [PubMed] [Google Scholar]
- 28. Dixit MP, Xu L, Xu H, Bai L, Collins JF, Ghishan FK: Effect of angiotensin-II on renal Na+/H+ exchanger-NHE3 and NHE2. Biochim Biophys Acta 1664: 38–44, 2004 [DOI] [PubMed] [Google Scholar]
- 29. du Cheyron D, Chalumeau C, Defontaine N, Klein C, Kellermann O, Paillard M, Poggioli J: Angiotensin II stimulates NHE3 activity by exocytic insertion of the transporter: Role of PI 3-kinase. Kidney Int 64: 939–949, 2003 [DOI] [PubMed] [Google Scholar]
- 30. Fox JG, BS, Davisson MT, Newcomer CE: The Mouse in Biomedical Research, London, UK, Academic Press, 2007 [Google Scholar]
- 31. Albinsson S, Shakirova Y, Rippe A, Baumgarten M, Rosengren BI, Rippe C, Hallmann R, Hellstrand P, Rippe B, Sward K: Arterial remodeling and plasma volume expansion in caveolin-1-deficient mice. Am J Physiol Regul Integr Comp Physiol 293: R1222–R1231, 2007 [DOI] [PubMed] [Google Scholar]
- 32. Sabrane K, Kruse MN, Fabritz L, Zetsche B, Mitko D, Skryabin BV, Zwiener M, Baba HA, Yanagisawa M, Kuhn M: Vascular endothelium is critically involved in the hypotensive and hypovolemic actions of atrial natriuretic peptide. J Clin Invest 115: 1666–1674, 2005 [DOI] [PMC free article] [PubMed] [Google Scholar]
- 33. Castrop H, Lorenz JN, Hansen PB, Friis U, Mizel D, Oppermann M, Jensen BL, Briggs J, Skott O, Schnermann J: Contribution of the basolateral isoform of the Na-K-2Cl− cotransporter (NKCC1/BSC2) to renin secretion. Am J Physiol Renal Physiol 289: F1185–F1192, 2005 [DOI] [PMC free article] [PubMed] [Google Scholar]
- 34. Stryke D, Kawamoto M, Huang CC, Johns SJ, King LA, Harper CA, Meng EC, Lee RE, Yee A, L'Italien L, Chuang PT, Young SG, Skarnes WC, Babbitt PC, Ferrin TE: BayGenomics: A resource of insertional mutations in mouse embryonic stem cells. Nucleic Acids Res 31: 278–281, 2003 [DOI] [PMC free article] [PubMed] [Google Scholar]
- 35. Neubauer B, Machura K, Chen M, Weinstein LS, Oppermann M, Sequeira-Lopez ML, Gomez RA, Schnermann J, Castrop H, Kurtz A, Wagner C: Development of vascular renin expression in the kidney critically depends on the cyclic AMP pathway. Am J Physiol Renal Physiol 296: F1006–F1012, 2009 [DOI] [PMC free article] [PubMed] [Google Scholar]
- 36. Schweda F, Wagner C, Kramer BK, Schnermann J, Kurtz A: Preserved macula densa-dependent renin secretion in A1 adenosine receptor knockout mice. Am J Physiol Renal Physiol 284: F770–F777, 2003 [DOI] [PubMed] [Google Scholar]
- 37. Zhang H, Zhang A, Kohan DE, Nelson RD, Gonzalez FJ, Yang T: Collecting duct-specific deletion of peroxisome proliferator-activated receptor gamma blocks thiazolidinedione-induced fluid retention. Proc Natl Acad Sci U S A 102: 9406–9411, 2005 [DOI] [PMC free article] [PubMed] [Google Scholar]


