

Abstract
Contemporary comparisons of mortality in matched hemodialysis and peritoneal dialysis patients are lacking. We aimed to compare survival of incident hemodialysis and peritoneal dialysis patients by intention-to-treat analysis in a matched-pair cohort and in subsets defined by age, cardiovascular disease, and diabetes. We matched 6337 patient pairs from a retrospective cohort of 98,875 adults who initiated dialysis in 2003 in the United States. In the primary intention-to-treat analysis of survival from day 0, cumulative survival was higher for peritoneal dialysis patients than for hemodialysis patients (hazard ratio 0.92; 95% CI 0.86 to 1.00, P = 0.04). Cumulative survival probabilities for peritoneal dialysis versus hemodialysis were 85.8% versus 80.7% (P < 0.01), 71.1% versus 68.0% (P < 0.01), 58.1% versus 56.7% (P = 0.25), and 48.4% versus 47.3% (P = 0.50) at 12, 24, 36, and 48 months, respectively. Peritoneal dialysis was associated with improved survival compared with hemodialysis among subgroups with age <65 years, no cardiovascular disease, and no diabetes. In a sensitivity analysis of survival from 90 days after initiation, we did not detect a difference in survival between modalities overall (hazard ratio 1.05; 95% CI 0.96 to 1.16), but hemodialysis was associated with improved survival among subgroups with cardiovascular disease and diabetes. In conclusion, despite hazard ratio heterogeneity across patient subgroups and nonconstant hazard ratios during the follow-up period, the overall intention-to-treat mortality risk after dialysis initiation was 8% lower for peritoneal dialysis than for matched hemodialysis patients. These data suggest that increased use of peritoneal dialysis may benefit incident ESRD patients.
Hemodialysis and peritoneal dialysis differ profoundly, but randomized comparisons have so far proven impossible.1 Despite obvious limitations, observational studies represent the next best design for survival comparisons. Although numerous studies have made peritoneal-dialysis-to-hemodialysis survival comparisons,2–16 findings have not been entirely consistent.17 These survival comparisons are particularly salient in the United States, where mortality rates for hemodialysis patients are much higher than in Europe and in Japan,18 and peritoneal dialysis is used relatively little.19,20 Because both modalities continue to evolve greatly from year to year, up-to-date survival comparisons may help inform the modality choices patients and physicians make when considering dialysis therapy. Comparative mortality studies of contemporary hemodialysis and peritoneal dialysis patients with similar comorbidity burdens are lacking.
We used a matched-pair, retrospective cohort design to compare survival in adult patients initiating dialysis in the United States in 2003 with matching based on propensity of initial peritoneal dialysis use. Matching may reduce the influence of patients using one modality, who share few (if any) measured characteristics with patients using the other modality, because of contraindication or nonclinical forces.21 Our primary objective was to compare survival of incident dialysis patients, treated initially with hemodialysis or peritoneal dialysis, by intention-to-treat analysis in the matched-pair cohort. Secondary objectives were to compare survival across modalities in subsets defined by age, cardiovascular disease, and diabetes and to assess the sensitivity of inference to follow-up commencement (at dialysis initiation, at 90 days thereafter) and modality exposure definition (intention to treat, as-treated).
Results
The unmatched cohort included 98,875 adult patients, of whom 87,277 (88.3%) survived for 90 days after dialysis initiation. The proportions of patients receiving peritoneal dialysis at dialysis initiation (day 0) and at day 90 were 6.8% and 8.1%, respectively.
Table 1 compares patient characteristics by dialysis modality in the unmatched cohort at day 0. With multiple logistic regression, patient characteristics associated (P < 0.05) with higher likelihood of peritoneal dialysis included Native American race, non-Mexican Hispanic and non-Hispanic ethnicity, GN as primary ESRD cause, serum albumin and hemoglobin, presence of hypertension, and tobacco use. Factors associated (P < 0.05) with lower likelihood of peritoneal dialysis included age; male sex; African-American and other race; hypertension, other urologic disease, and other disease as primary ESRD cause; dual eligibility for Medicare and Medicaid; body mass index and blood urea; and presence of congestive heart failure, cerebrovascular disease, peripheral vascular disease, diabetes, chronic obstructive pulmonary disease, malignant neoplasm, alcohol or drug dependence, and inability to ambulate or transfer.
Table 1.
Patient characteristics by modality at dialysis initiation before and after matching
| Characteristics | Before Matching |
After Matching |
|||||||
|---|---|---|---|---|---|---|---|---|---|
| All HD, Mean (SD) or % | All PD, Mean (SD) or % | All PD versus All HD |
Matched HD, Mean (SD) or % | Matched PD, Mean (SD) or % | Unmatched PD, Mean (SD) or % | Matched PD versus Unmatched PD |
|||
| AORa (95% CI) | Pa | AORb (95% CI) | Pb | ||||||
| n | 92,187 | 6688 | 6337 | 6337 | 351 | ||||
| Age, years | 63.9 (15.2) | 58.4 (15.1) | 0.96 (0.95 to 0.96) | <0.01 | 59.0 (15.0) | 59.1 (15.0) | 45.8 (10.7) | 1.08 (1.06 to 1.09) | <0.01 |
| Gender | |||||||||
| women | 45.8 | 46.4 | Referent | 45.7 | 46.3 | 48.4 | Referent | ||
| men | 54.2 | 53.6 | 0.83 (0.78 to 0.87) | <0.01 | 54.3 | 53.7 | 51.6 | 1.42 (0.94 to 2.15) | 0.09 |
| Race | |||||||||
| white | 63.9 | 70.8 | Referent | 70.5 | 70.3 | 78.5 | Referent | ||
| African American | 29.8 | 22.0 | 0.66 (0.62 to 0.71) | <0.01 | 22.4 | 22.5 | 12.5 | 3.24 (2.07 to 5.08) | <0.01 |
| Asian | 1.1 | 1.1 | 1.04 (0.80 to 1.36) | 0.76 | 1.1 | 1.1 | 0.7 | 1.42 (0.15 to 13.2) | 0.74 |
| Native American | 3.6 | 4.8 | 1.28 (1.11 to 1.48) | <0.01 | 4.6 | 4.6 | 7.7 | 0.61 (0.15 to 2.45) | 0.43 |
| other | 1.7 | 1.4 | 0.77 (0.61 to 0.98) | 0.03 | 1.4 | 1.4 | 0.5 | 5.77 (0.74 to 44.9) | 0.09 |
| Ethnicity | |||||||||
| Hispanic-Mexican | 7.9 | 6.2 | Referent | 6.4 | 6.4 | 3.8 | Referent | ||
| Hispanic-other | 5.3 | 4.8 | 1.23 (1.03 to 1.47) | 0.02 | 4.6 | 4.8 | 4.1 | 2.12 (0.74 to 6.08) | 0.15 |
| non-Hispanic | 86.8 | 89.0 | 1.32 (1.16 to 1.50) | <0.01 | 89.0 | 88.9 | 92.1 | 1.40 (0.31 to 6.36) | 0.63 |
| Primary ESRD cause | |||||||||
| diabetes mellitus | 46.7 | 45.7 | Referent | 46.7 | 46.5 | 31.4 | Referent | ||
| hypertension | 30.7 | 24.8 | 0.74 (0.67 to 0.81) | <0.01 | 25.1 | 25.5 | 12.0 | 2.27 (1.03 to 5.00) | 0.04 |
| GN | 7.9 | 14.0 | 1.15 (1.03 to 1.30) | 0.02 | 12.9 | 13.0 | 32.3 | 0.72 (0.35 to 1.48) | 0.36 |
| polycystic kidney disease | 1.8 | 5.0 | 1.12 (0.94 to 1.33) | 0.20 | 4.4 | 4.3 | 16.7 | 0.73 (0.35 to 1.55) | 0.41 |
| other urologic disease | 2.7 | 2.4 | 0.68 (0.56 to 0.82) | <0.01 | 2.4 | 2.4 | 2.2 | 2.07 (0.35 to 12.4) | 0.39 |
| other cause | 10.3 | 8.2 | 0.65 (0.57 to 0.73) | <0.01 | 8.6 | 8.3 | 5.4 | 2.63 (0.92 to 7.53) | 0.07 |
| Dual eligibilityc | 16.7 | 12.2 | 0.52 (0.48 to 0.57) | <0.01 | 12.4 | 12.7 | 2.2 | 10.3 (3.37 to 31.7) | <0.01 |
| Serum albumin, g/dl | 3.1 (0.7) | 3.5 (0.7) | 2.14 (2.05 to 2.24) | <0.01 | 3.5 (0.7) | 3.5 (0.7) | 4.1 (0.6) | 0.27 (0.21 to 0.34) | <0.01 |
| Body mass index, kg/m2 | 27.7 (7.2) | 27.9 (6.4) | 1.00 (0.99 to 1.00) | 0.04 | 27.9 (6.4) | 27.9 (6.4) | 27.5 (5.4) | 1.00 (0.98 to 1.03) | 0.68 |
| Blood urea, mg/dl | 84.9 (34.1) | 78.6 (27.3) | 0.99 (0.99 to 1.00) | <0.01 | 78.9 (27.8) | 78.9 (27.6) | 73.5 (21.4) | 1.01 (1.00 to 1.02) | 0.04 |
| eGFR, ml/min/1.73 m2 | 9.8 (4.8) | 9.8 (4.4) | 1.01 (1.00 to 1.01) | 0.07 | 9.9 (4.4) | 9.9 (4.4) | 9.3 (3.7) | 0.98 (0.91 to 1.06) | 0.62 |
| Hemoglobin, g/dl | 9.9 (1.8) | 10.7 (1.8) | 1.20 (1.18 to 1.22) | <0.01 | 10.7 (1.8) | 10.7 (1.8) | 11.7 (1.6) | 0.69 (0.62 to 0.77) | <0.01 |
| Comorbid conditions | |||||||||
| congestive heart failure | 33.1 | 19.7 | 0.66 (0.62 to 0.71) | <0.01 | 20.9 | 20.7 | 3.1 | 2.84 (0.88 to 9.16) | 0.08 |
| ischemic heart disease | 25.9 | 19.9 | 0.93 (0.86 to 1.00) | 0.05 | 20.5 | 20.7 | 5.7 | 1.36 (0.65 to 2.85) | 0.40 |
| myocardial infarction | 8.6 | 6.5 | 0.98 (0.87 to 1.10) | 0.70 | 6.8 | 6.8 | 1.5 | 1.77 (0.45 to 6.94) | 0.40 |
| cardiac arrest | 0.8 | 0.6 | 1.02 (0.73 to 1.43) | 0.89 | 0.6 | 0.7 | 0.2 | Inestimabled | |
| cardiac dysrhythmia | 6.5 | 4.9 | 1.13 (1.00 to 1.28) | 0.06 | 5.2 | 5.1 | 1.6 | 0.80 (0.26 to 2.44) | 0.69 |
| pericarditis | 0.5 | 0.4 | 1.00 (0.66 to 1.51) | 0.99 | 0.4 | 0.4 | 0.2 | Inestimabled | |
| cerebrovascular disease | 9.6 | 6.8 | 0.82 (0.74 to 0.91) | <0.01 | 7.1 | 7.0 | 2.8 | 1.34 (0.46 to 3.89) | 0.57 |
| PVD | 14.6 | 10.2 | 0.86 (0.78 to 0.94) | <0.01 | 10.6 | 10.7 | 2.8 | 1.57 (0.47 to 5.20) | 0.43 |
| hypertension | 80.2 | 83.1 | 1.32 (1.23 to 1.43) | <0.01 | 82.9 | 82.8 | 88.2 | 0.46 (0.31 to 0.70) | <0.01 |
| diabetes | 52.0 | 47.7 | 0.90 (0.82 to 0.97) | 0.01 | 48.9 | 48.7 | 31.1 | 1.13 (0.52 to 2.47) | 0.74 |
| COPD | 8.3 | 4.4 | 0.65 (0.58 to 0.74) | <0.01 | 4.6 | 4.6 | 0.7 | 2.65 (0.45 to 15.8) | 0.28 |
| tobacco use | 5.0 | 5.7 | 1.18 (1.04 to 1.34) | 0.01 | 5.9 | 5.6 | 6.6 | 0.81 (0.22 to 2.94) | 0.71 |
| malignant neoplasm | 6.4 | 4.3 | 0.80 (0.70 to 0.91) | <0.01 | 4.6 | 4.4% | 1.1 | 2.28 (0.54 to 9.68) | 0.25 |
| alcohol/drug dependence | 2.1 | 0.9 | 0.50 (0.38 to 0.66) | <0.01 | 0.9 | 0.9% | 0.1 | Inestimabled | |
| HIV+ status or AIDS | 1.0 | 0.5 | 0.88 (0.60 to 1.28) | 0.49 | 0.6 | 0.5% | 0.2 | Inestimabled | |
| unable to ambulate/transfer | 4.6 | 1.5 | 0.50 (0.40 to 0.62) | <0.01 | 1.8 | 1.5% | 0.0 | Inestimabled | |
AOR, adjusted odds ratio; COPD, chronic obstructive pulmonary disease; eGFR, estimated GFR; HD, hemodialysis; PD, peritoneal dialysis; PVD, peripheral vascular disease.
aAdjusted odds ratio from a logistic regression model of receiving peritoneal dialysis versus hemodialysis at dialysis initiation, with adjustment for all covariates in Table 1, in addition to ESRD Network and payer status.
bAdjusted odds ratio from a logistic regression model of matched versus unmatched peritoneal dialysis patients, adjusted for all estimable covariates in Table 1, in addition to ESRD Network.
cMedicare and Medicaid.
dAt least one imputed data set with zero comorbid cases in unmatched peritoneal dialysis patients.
Table 1 also shows patient characteristics by dialysis modality for the matched-pair cohort. Standardized differences between hemodialysis and peritoneal dialysis were <2% of 1 SD for all covariates (data not shown). For 351 peritoneal dialysis patients (5.2%), no matching hemodialysis patient was identified (Table 1). With multiple logistic regression, discriminating characteristics (P < 0.05) of matched versus unmatched peritoneal dialysis patients included age; African-American race; hypertension as primary ESRD cause; dual eligibility for Medicare and Medicaid; serum albumin, blood urea, and hemoglobin; and presence of hypertension.
Cumulative mortality in the matched-pair cohort was 41.9% over a mean follow-up of 2.3 years. In the primary, intention-to-treat analysis of survival from day 0, cumulative survival was higher for peritoneal dialysis patients than for hemodialysis patients, with a corresponding hazard ratio (HR) for peritoneal dialysis versus hemodialysis of 0.92 [95% confidence interval (CI) 0.86 to 1.00, P = 0.04; Figure 1]. Cumulative survival probabilities for peritoneal dialysis and hemodialysis were 93.2% versus 88.6% (P < 0.01) at 6 months, 85.8% versus 80.7% (P < 0.01) at 12 months, 71.1% versus 68.0% (P < 0.01) at 24 months, 58.1% versus 56.7% (P = 0.25) at 36 months, and 48.4% versus 47.3% (P = 0.50) at 48 months. The HR was <1 (P < 0.01) in the first year (Table 2). In an as-treated analysis, the HR for peritonealdialysis versus hemodialysis was 0.80 (95% CI 0.75 to 0.85, P < 0.01), and the HR was <1 (P < 0.01) in the first year (Table 2).
Figure 1.
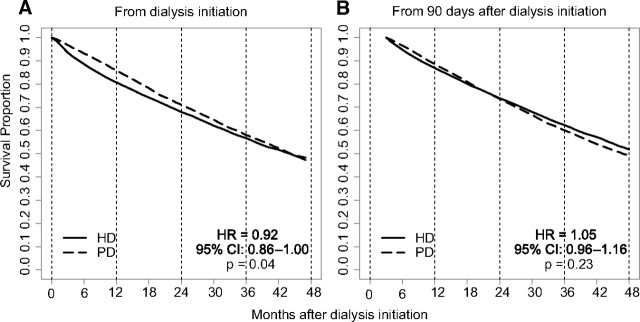
Intention-to-treat in the matched cohort showed lower death risk in PD when follow up began at initiation of dialysis. Risks were similar when follow-up began at day 90. HD, hemodialysis; PD, peritoneal dialysis.
Table 2.
Peritoneal-dialysis-to-hemodialysis HRs of death in the matched cohort
| Follow-up from Day 0 |
Follow-up from Day 90 |
|||||||||
|---|---|---|---|---|---|---|---|---|---|---|
| n | Intention to Treat |
As-Treated |
n | Intention to Treat |
As-Treated |
|||||
| HR (95% CI) | P | HR (95% CI) | P | HR (95% CI) | P | HR (95% CI) | P | |||
| All years | 12,674 | 0.92 (0.86 to 1.00) | 0.04 | 0.80 (0.75 to 0.85) | <0.01 | 14,193 | 1.05 (0.96 to 1.16) | 0.23 | 0.98 (0.90 to 1.07) | 0.68 |
| Year 1 | 12,674 | 0.70 (0.62 to 0.78) | <0.01 | 0.62 (0.56 to 0.68) | <0.01 | 14,193 | 0.90 (0.76 to 1.06) | 0.17 | 0.85 (0.73 to 0.98) | 0.03 |
| Year 2 | 9628 | 1.10 (0.95 to 1.29) | 0.19 | 0.90 (0.80 to 1.02) | 0.11 | 10,878 | 1.19 (1.02 to 1.38) | 0.03 | 1.04 (0.92 to 1.17) | 0.52 |
| Year 3 | 7387 | 1.11 (0.98 to 1.26) | 0.10 | 1.00 (0.88 to 1.13) | 0.99 | 8313 | 1.15 (0.98 to 1.34) | 0.08 | 1.17 (1.02 to 1.36) | 0.03 |
| Year 4 | 5616 | 1.06 (0.85 to 1.32) | 0.58 | 1.00 (0.82 to 1.23) | 0.98 | 4787 | 1.21 (0.85 to 1.70) | 0.26 | 1.06 (0.79 to 1.41) | 0.71 |
In a secondary analysis of survival from day 90 (Figure 1), overall survival was similar for peritoneal dialysis and hemodialysis patients (HR 1.05, 95% CI 0.96 to 1.16, P = 0.23); survival probabilities for peritoneal dialysis and hemodialysis patients were 96.5% versus 94.8% (P < 0.01) at 6 months, 88.6% versus 86.9% (P = 0.05) at 12 months, 73.6% versus 73.9% (P = 0.77) at 24 months, 60.1% versus 62.3% (P = 0.10) at 36 months, and 49.5% versus 51.8% (P = 0.22) at 48 months. The HR was >1 (P = 0.03) in the second year (Table 2). In an as-treated analysis, the HR for peritoneal dialysis versus hemodialysis was 0.98 (95% CI 0.90 to 1.07, P = 0.68), and the HR was <1 (P = 0.03) in the first year and >1 (P = 0.03) in the third year (Table 2).
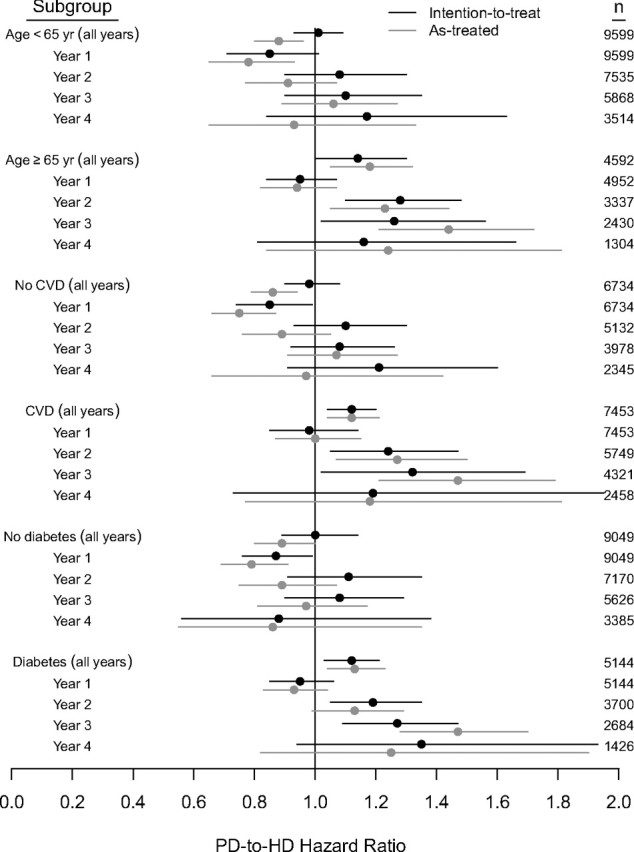
Regarding prespecified subgroups, interaction analysis of survival from day 0 and day 90 showed that the association of dialysis modality with survival was modified by baseline age ≥65 years, cardiovascular disease, and diabetes (P < 0.01 for each). In intention-to-treat analysis of survival from day 0, overall HRs were <1 (favoring peritoneal dialysis, P < 0.01) for patients aged <65 years and for patients without cardiovascular disease and patients without diabetes (Figure 2). In intention-to-treat analysis of survival from day 90, HRs were >1 (favoring hemodialysis, P < 0.01) for patients with cardiovascular disease and patients with diabetes (Figure 3).
Figure 2.

Matched cohort, peritoneal-dialysis-to-hemodialysis HRs from dialysis day 0 in subgroups. CVD, cardiovascular disease.
Figure 3.
Matched cohort, peritoneal-dialysis-to-hemodialysis HRs from dialysis day 90 in subgroups.
Figure 2 shows mortality HRs for intention-to-treat and as-treated analyses of survival from day 0 within subgroups and individual years of follow-up. HRs in the first year were <1 for all subgroups (P ≤ 0.01) for both intention-to-treat and as-treated analyses. In intention-to-treat analysis, the HR in the second year exceeded 1 for patients aged ≥65 years (P < 0.01). In as-treated analysis, HRs were <1 in the second year for patients aged <65 years and for patients without cardiovascular disease and patients without diabetes (P ≤ 0.01). HRs in the third year exceeded 1 for age ≥65 years and diabetes (P ≤ 0.02).
Figure 3 shows mortality HRs for analyses of survival from day 90. In intention-to-treat analysis, HRs in the first year were <1 for patients without cardiovascular disease and patients without diabetes (P < 0.05). HRs in the second and third years exceeded 1 with age ≥65 years, cardiovascular disease, and diabetes (P < 0.05). In as-treated analysis, HRs in the first year were <1 for age <65 years, no cardiovascular disease, and no diabetes (P < 0.01). HRs in the second and third years exceeded 1 for age ≥65 years and cardiovascular disease (P ≤ 0.01); in addition, the HR in the third year exceeded 1 for diabetes (P < 0.01).
Discussion
In this study, we compared survival by initial modality for adult patients beginning dialysis in the United States in 2003. Compared with hemodialysis counterparts, peritoneal dialysis patients in the United States were fewer and tended to be younger with less comorbidity. To balance prognostically important baseline characteristics, we matched hemodialysis and peritoneal dialysis patients on the basis of propensity of initial peritoneal dialysis use. In the matched cohort, peritoneal-dialysis-to-hemodialysis survival comparisons were complicated and partly dependent on subgroup identity and time frame of follow-up.
On average, peritoneal dialysis patients in the United States are younger and have less comorbidity than hemodialysis patients. Regression adjustment, the usual technique for controlling such differences in risk-factor distributions across the dialytic modalities, can be expected to perform well when all relationships between those factors and risk of outcome are correctly specified. This is unlikely in practice because of complex interactions and unmeasured risk factors. Propensity score analysis is an alternative to regression adjustment. The propensity score is defined here as the probability of initial peritoneal dialysis use, given all covariates, and is alone sufficient for control of measured confounding.22 Propensity scores can be used for stratification, adjustment, or matching, but stratification has been shown to admit residual confounding.23 Hypothetically, if some hemodialysis patients at very high risk for death and other peritoneal dialysis patients at very low risk for death shared few, if any, characteristics, simple adjustment might introduce a bias favoring peritoneal dialysis; matching by propensity scores reduces the chance of introducing this bias. For 351 peritoneal dialysis patients (5.2%) in our cohort, no matching hemodialysis patient was identified, and a substantial number of hemodialysis patients were not paired with a peritoneal dialysis patient. Plausibly, unmatched patients may possess unmeasured indications (or contraindications) for one modality.
To our knowledge, ours is only the third study to use propensity score analysis in a survival comparison of peritoneal dialysis versus hemodialysis. In an analysis of 1041 participants in the Choices for Healthy Outcomes in Caring for ESRD Patients study, with modality defined at approximately 10 weeks after dialysis initiation, Jaar et al. reported a propensity-score-adjusted HR of death for peritoneal dialysis versus hemodialysis of 1.47 (P = 0.32) in the first year and 2.05 (P = 0.03) in the second year, with little evidence of effect modification by age, cardiovascular disease, or diabetes.10 The cohort was notable for relatively low mortality among hemodialysis patients (24.4% over mean follow-up time of 2.4 years). In a propensity-score-matched cohort of 16,791 patients initiating dialysis in Australia and New Zealand between 1991 and 2005, McDonald et al. reported HRs of death for peritoneal dialysis versus hemodialysis of 0.99 (P = 0.80) from day 90 to 365 and 1.35 (P < 0.01) from day 366 on.2 In tandem with our secondary analysis of survival from day 90, these studies provide little evidence of an overall association between modality and survival in the first year, but stronger evidence of increased relative risk among peritoneal dialysis patients in subsequent years. However, these studies exclude patients who died within the first months of renal replacement therapy.
We found that survival was modestly longer for patients initiating renal replacement therapy with peritoneal dialysis than for matched hemodialysis patients. However, relative mortality hazards were functions of age, cardiovascular disease, diabetes, time frame of follow-up, and exposure definition (intention to treat, as-treated). In general, for patients expected to survive longer (e.g., aged <65 years, without cardiovascular disease, without diabetes), peritoneal dialysis was associated with longer survival than hemodialysis. For patients whose survival was expected to be shorter, the opposite tendency was apparent. Previous studies have reported modality-survival effect modification by age and diabetes.2,4,8,11–16 Attenuation and reversal of longer survival for peritoneal dialysis patients during the first year of dialysis have also been described elsewhere.2,7,8,10,11,15,16 Sensitivity of conclusions to study design choices likely partially reflects nonrandom switching from one modality to another.24 Our findings are also compatible with the hypothesis that longer survival may be associated with a dual-modality approach of initiation with peritoneal dialysis, followed by timely transfer to hemodialysis.25 Although first-year mortality rates for hemodialysis patients have declined very little in the past 15 years, mortality rates after the first year have declined steadily.19 Notably, we found that modality-related survival estimates depended on whether follow-up began at day 0 or day 90. This observation is compatible with the hypothesis that imbalances of unmeasured comorbid conditions, especially those leading to early demise, may be responsible. One could also reasonably argue that this difference reflects more extensive predialysis education for peritoneal dialysis patients, because observational evidence suggests that predialysis education is associated with lower risk of hospitalization.26 On the other side, catheter dependency clearly remains high among U.S. hemodialysis patients during the first 3 months, and catheter use is associated with high morbidity and mortality rates.27 Differential rates of residual kidney function loss may also be involved28; although we adjusted for baseline eGFR, serial eGFR levels were unfortunately not available.
Peritoneal dialysis use in the United States was lower than in many Asian and European countries in 2003.19 In this study, only 6.8% of adults used peritoneal dialysis at dialysis initiation, continuing a 2-decade decline from 15.8% in 1985 to 14.4% in 1990, 13.8% in 1995, and 8.1% in 2000.19 Several causes of this decline have been postulated. First, the numbers of peritoneal dialysis patients treated at individual U.S. dialysis facilities are often modest. For example, in 2003 there were 27,345 prevalent peritoneal dialysis patients and 4591 dialysis facilities, a ratio of 6.0 patients per facility, considerably lower than the ratio of 61.6 hemodialysis patients per facility.29 A low number of peritoneal dialysis patients per facility has been associated with increased rates of technique failure in the United States30,31 and in Canada.32 Plausibly, high rates of technique failure could lead to erosion of peritoneal dialysis expertise in a facility, diminished enthusiasm for considering peritoneal dialysis in incipient dialysis patients, and limited exposure to peritoneal dialysis among trainee health care professionals.33 Reimbursement considerations may also discourage peritoneal dialysis use in the United States20 because revenue from injectable medications is typically higher for hemodialysis than for peritoneal dialysis patients.34
Choice of dialysis modality may become a more pressing issue in years to come. The U.S. dialysis population is projected to reach nearly 405,000 in 2010 and to exceed 534,000 in 2020.33 Globally, the dialysis population is predicted to reach almost 2.1 million in 2010,35 and with expectations of a worldwide shift in age distribution36 and rapid growth in diabetes prevalence,37 further population growth is likely. In the setting of rising disease burden, the need to consider cost-effectiveness of different dialysis modalities is self-evident. In 2006, the respective Medicare expenditures for hemodialysis and peritoneal dialysis were $71,889 and $53,327 per patient-year.19 For segments of the dialysis population in which peritoneal dialysis outcomes compare favorably with hemodialysis outcomes, these cost differentials are nontrivial. In the future, the evolution of costs attributable to facility acquisition, maintenance, and staffing, along with the bundling of dialysis services in capitated payment systems (e.g., with the addition of injectable medications in the Medicare bundled payment for dialysis beginning in 2011), may factor into decisions concerning dialysis modality.
This study has limitations. Because dialysis modalities were not randomly assigned, causality could not be assessed; propensity matching is not a substitute for randomization. The study was retrospective and based on registry data. Prognostic covariates and biomarkers were measured only at dialysis initiation. The Medical Evidence Report [Centers for Medicare & Medicaid (CMS) form 2728] served as the predominant source of baseline data. This instrument likely has lower sensitivity for identifying comorbid conditions, compared with sensitivities in prospective studies in which precise disease definitions are rigorously applied,38 and does not ascertain the severity of conditions. Moreover, biomarker data were incomplete and serum albumin assay type was infrequently recorded; the effect of incomplete data cannot be fully assessed with multiple imputation, which rests on the unverifiable assumption of data missing at random.39 The net effect of misclassified comorbidity and biomarker data may be residual confounding, possibly resulting in bias favoring peritoneal dialysis. Before 2005, the Medical Evidence Report did not record early nephrologist referral or initial vascular access type, factors that may account for the early survival advantage of peritoneal dialysis. Prognostically important, nonrandom processes resulting in modality changes were not considered in survival analyses. In this regard, because peritoneal dialysis patients are more likely to change dialytic modality than hemodialysis patients,40 as-treated analyses may plausibly be biased in favor of peritoneal dialysis.41 Peritoneal dialysis patients are also more likely to undergo kidney transplant than hemodialysis patients,42 so informative censoring is a possibility; our study conclusions were insensitive to censoring (or not) at the time of transplant. Finally, generalizability to other countries or other eras is uncertain because we studied U.S. patients initiating dialysis in a single calendar year.
Despite its limitations, this study may have clinically relevant features and may help inform dialytic modality choices in the United States. The study represents the experience of the entire incident dialysis population in the United States, and the available sample size allowed us to use an analytical technique (propensity matching) rarely encountered to date in peritoneal-dialysis-to-hemodialysis survival comparisons. In short, the technique is an intuitive approach to a long-standing conundrum: If a substantial number of hemodialysis patients in the United States share no (or very few) similarities with peritoneal dialysis patients, what is the most equitable way to compare survival (or any other outcome) for the two modalities? Increased use of peritoneal dialysis among U.S. adults may be justified, particularly in subgroups with favorable outcomes, but in lieu of randomized comparisons, individual study results should be interpreted cautiously and subjected to rigorous replication.
Concise Methods
Participants and Matching
We analyzed data from the CMS ESRD database. The cohort consisted of adult patients who initiated dialysis in the United States in 2003. We included only those patients who immediately began hemodialysis or peritoneal dialysis according to data from the CMS Medical Evidence Report (form CMS 2728), which physicians and dialysis centers are required to submit for all patients initiating maintenance dialysis in the United States; from the CMS Standard Information Management System, to which dialysis centers are required to report modality changes monthly; and from Medicare claims.
We considered in our analyses the covariates in Table 1, ESRD Network, and payer status (Medicare as primary payer, Medicare as secondary payer, Medicare Advantage, private payer, unknown); these data are all recorded on the Medical Evidence Report. Estimated GFR was calculated using the four-variable Modification of Diet in Renal Disease equation.43 We initially excluded patients with missing information on age, sex, race, or ethnicity (223 of 99,925), and then pediatric (age <18 years) patients (827 of 99,925). Among included patients, missing values remained for primary ESRD cause (3.8%), serum albumin (26.9%), body mass index (0.7%), blood urea (6.0%), estimated GFR (1.8%), and hemoglobin (4.2%). We imputed values for these covariates using multiple imputation,28 with five draws for each missing value from a multivariate normal model of all listed covariates, plus modality.
We estimated the propensity score for peritoneal dialysis prescription at the start of follow-up with a logistic regression model that included all listed covariates as predictors.22 We constructed matched pairs with a greedy matching algorithm23 by randomly selecting for each peritoneal dialysis patient with score p a corresponding hemodialysis patient with score between p − 0.1 and p + 0.1. We also considered a matching caliper of 0.05; analytical results were practically identical and are not shown. After matching, standardized differences were used to assess similarity in baseline characteristics across the dialytic modalities.44
Statistical Analysis
Follow-up continued until the earliest occurrence of death, kidney transplant, loss to follow-up, or December 31, 2006. Death was ascertained from the CMS Death Notification Form (form CMS 2746) and the Social Security Death Index, and transplant was ascertained from CMS Standard Information Management System and Medicare claims. The primary analysis was intention-to-treat survival by dialytic modality from initiation of dialysis (day 0). Secondary analyses included (1) survival analysis from day 90, by modality at day 90; (2) as-treated analysis, with initial modality redefined at first modality switch ≥60 days19; and (3) subgroup analyses, with subgroups defined by baseline age (<65 years, ≥65 years), cardiovascular disease (congestive heart failure, ischemic heart disease, myocardial infarction, cardiac arrest, cardiac dysrhythmia, or pericarditis), and diabetes.
We calculated Kaplan–Meier survival estimates in the matched-pair cohort and subsequently fit a Cox proportional hazards regression model of survival from which we estimated the relative hazards of mortality for peritoneal dialysis versus hemodialysis during all of follow-up and during follow-up years 1, 2, 3, and 4. The Cox model included a robust covariance estimator to account for within-pair correlation.45 Estimates were derived with SAS, version 9.1.3 (Cary, NC).
Disclosures
Eric D. Weinhandl and Jon J. Snyder have no conflicts of interest. Robert N. Foley has consulted for, advised, or received honoraria from 21st Services, Affymax, Chugai, Fresenius, Merck, Novartis, Pfizer, and Pursuit Vascular. David T. Gilbertson has consulted for AMAG Pharmaceuticals and Amgen. Thomas J. Arneson has an ownership interest in Johnson & Johnson. Allan J. Collins has advised or received honoraria from AMAG Pharmaceuticals, American Renal Management, Amgen, Apothecom/Axis Healthcare, Fresenius, NxStage, Quintiles/Innovex, and United Resource Network.
Acknowledgments
This study was supported by a research contract from Baxter Healthcare, Deerfield, Illinois. The contract provides for the Minneapolis Medical Research Foundation investigators to have the final determination of the content of this manuscript. The authors wish to thank Chronic Disease Research Group colleagues Shane Nygaard, BA, for manuscript preparation and Nan Booth, MSW, MPH, for manuscript editing.
Footnotes
Published online ahead of print. Publication date available at www.jasn.org.
References
- 1. Korevaar JC, Feith GW, Dekker FW, van Manen JG, Boeschoten EW, Bossuyt PM, Krediet RT: Effect of starting with hemodialysis compared with peritoneal dialysis in patients new on dialysis treatment: A randomized controlled trial. Kidney Int 64: 2222–2228, 2003 [DOI] [PubMed] [Google Scholar]
- 2. McDonald SP, Marshall MR, Johnson DW, Polkinghorne KR: Relationship between dialysis modality and mortality. J Am Soc Nephrol 20: 155–163, 2009 [DOI] [PMC free article] [PubMed] [Google Scholar]
- 3. Andrikos E, Tseke P, Balafa O, Pappas M: Five-year survival in comparable HD and PD patients: One center's experience. Int J Artif Organs 31: 737–741, 2008 [DOI] [PubMed] [Google Scholar]
- 4. Huang CC, Cheng KF, Wu HD: Survival analysis: Comparing peritoneal dialysis and hemodialysis in Taiwan. Perit Dial Int 28[Suppl 3]: S15–S20, 2008 [PubMed] [Google Scholar]
- 5. Sanabria M, Munoz J, Trillos C, Hernandez G, Latorre C, Diaz CS, Murad S, Rodriguez K, Rivera A, Amador A, Ardila F, Caicedo A, Camargo D, Diaz A, Gonzalez J, Leguizamon H, Lopera P, Marin L, Nieto I, Vargas E: Dialysis outcomes in Colombia (DOC) study: A comparison of patient survival on peritoneal dialysis vs hemodialysis in Colombia. Kidney Int Suppl 73[Suppl 108]: S165–S172, 2008 [DOI] [PubMed] [Google Scholar]
- 6. Uchida K, Shoda J, Sugahara S, Ikeda N, Kobayashi K, Kanno Y, Okada H, Nakamoto H, Uchida Y, Suzuki H: Comparison and survival of patients receiving hemodialysis and peritoneal dialysis in a single center. Adv Perit Dial 23: 144–149, 2007 [PubMed] [Google Scholar]
- 7. Song YS, Jung H, Shim J, Oh C, Shin GT, Kim H: Survival analysis of Korean end-stage renal disease patients according to renal replacement therapy in a single center. J Korean Med Sci 22: 81–88, 2007 [DOI] [PMC free article] [PubMed] [Google Scholar]
- 8. Liem YS, Wong JB, Hunink MG, de Charro FT, Winkelmayer WC: Comparison of hemodialysis and peritoneal dialysis survival in The Netherlands. Kidney Int 71: 153–158, 2007 [DOI] [PubMed] [Google Scholar]
- 9. Inrig JK, Sun JL, Yang Q, Briley LP, Szczech LA: Mortality by dialysis modality among patients who have end-stage renal disease and are awaiting renal transplantation. Clin J Am Soc Nephrol 1: 774–779, 2006 [DOI] [PubMed] [Google Scholar]
- 10. Jaar BG, Coresh J, Plantinga LC, Fink NE, Klag MJ, Levey AS, Levin NW, Sadler JH, Kliger A, Powe NR: Comparing the risk for death with peritoneal dialysis and hemodialysis in a national cohort of patients with chronic kidney disease. Ann Intern Med 143: 174–183, 2005 [DOI] [PubMed] [Google Scholar]
- 11. Vonesh EF, Snyder JJ, Foley RN, Collins AJ: The differential impact of risk factors on mortality in hemodialysis and peritoneal dialysis. Kidney Int 66: 2389–2401, 2004 [DOI] [PubMed] [Google Scholar]
- 12. Stack AG, Murthy BV, Molony DA: Survival differences between peritoneal dialysis and hemodialysis among “large” ESRD patients in the United States. Kidney Int 65: 2398–2408, 2004 [DOI] [PubMed] [Google Scholar]
- 13. Stack AG, Molony DA, Rahman NS, Dosekun A, Murthy B: Impact of dialysis modality on survival of new ESRD patients with congestive heart failure in the United States. Kidney Int 64: 1071–1079, 2003 [DOI] [PubMed] [Google Scholar]
- 14. Ganesh SK, Hulbert-Shearon T, Port FK, Eagle K, Stack AG: Mortality differences by dialysis modality among incident ESRD patients with and without coronary artery disease. J Am Soc Nephrol 14: 415–424, 2003 [DOI] [PubMed] [Google Scholar]
- 15. Murphy SW, Foley RN, Barrett BJ, Kent GM, Morgan J, Barre P, Campbell P, Fine A, Goldstein MB, Handa SP, Jindal KK, Levin A, Mandin H, Muirhead N, Richardson RM, Parfrey PS: Comparative mortality of hemodialysis and peritoneal dialysis in Canada. Kidney Int 57: 1720–1726, 2000 [DOI] [PubMed] [Google Scholar]
- 16. Collins AJ, Hao W, Xia H, Ebben JP, Everson SE, Constantini EG, Ma JZ: Mortality risks of peritoneal dialysis and hemodialysis. Am J Kidney Dis 34: 1065–1074, 1999 [DOI] [PubMed] [Google Scholar]
- 17. Vonesh EF, Snyder JJ, Foley RN, Collins AJ: Mortality studies comparing peritoneal dialysis and hemodialysis: what do they tell us? Kidney Int 70[Suppl 103]: S3–S11, 2006 [DOI] [PubMed] [Google Scholar]
- 18. Goodkin DA, Bragg-Gresham JL, Koenig KG, Wolfe RA, Akiba T, Andreucci VE, Saito A, Rayner HC, Kurokawa K, Port FK, Held PJ, Young EW: Association of comorbid conditions and mortality in hemodialysis patients in Europe, Japan, and the United States: The Dialysis Outcomes and Practice Patterns Study (DOPPS). J Am Soc Nephrol 14: 3270–3277, 2003 [DOI] [PubMed] [Google Scholar]
- 19. U.S. Renal Data System: USRDS 2008 Annual Data Report: Atlas of Chronic Kidney Disease & End-Stage Renal Disease in the United States. Bethesda, MD, National Institutes of Health, National Institute of Diabetes and Digestive and Kidney Diseases, 2009 [Google Scholar]
- 20. Mehrotra R, Kermah D, Fried L, Kalantar-Zadeh K, Khawar O, Norris K, Nissenson A: Chronic peritoneal dialysis in the United States: Declining utilization despite improving outcomes. J Am Soc Nephrol 18: 2781–2788, 2007 [DOI] [PubMed] [Google Scholar]
- 21. Glynn RJ, Schneeweiss S, Sturmer T: Indications for propensity scores and review of their use in pharmacoepidemiology. Basic Clin Pharmacol Toxicol 98: 253–259, 2006 [DOI] [PMC free article] [PubMed] [Google Scholar]
- 22. Rosenbaum PR, Rubin DB: The central role of the propensity score in observational studies for causal effects. Biometrika 70: 41–55, 1983 [Google Scholar]
- 23. Austin PC, Grootendorst P, Anderson GM: A comparison of the ability of different propensity score models to balance measured variables between treated and untreated subjects: A Monte Carlo study. Stat Med 26: 734–753, 2007 [DOI] [PubMed] [Google Scholar]
- 24. Winkelmayer WC, Glynn RJ, Levin R, Owen W, Jr, Avorn J: Late referral and modality choice in end-stage renal disease. Kidney Int 60: 1547–1554, 2001 [DOI] [PubMed] [Google Scholar]
- 25. Van Biesen W, Vanholder RC, Veys N, Dhondt A, Lameire NH: An evaluation of an integrative care approach for end-stage renal disease patients. J Am Soc Nephrol 11: 116–125, 2000 [DOI] [PubMed] [Google Scholar]
- 26. Levin A, Lewis M, Mortiboy P, Faber S, Hare I, Porter EC, Mendelssohn DC: Multidisciplinary predialysis programs: Quantification and limitations of their impact on patient outcomes in two Canadian settings. Am J Kidney Dis 29: 533–540, 1997 [DOI] [PubMed] [Google Scholar]
- 27. Dhingra RK, Young EW, Hulbert-Shearon TE, Leavey SF, Port FK: Type of vascular access and mortality in U.S. hemodialysis patients. Kidney Int 60: 1443–1451, 2001 [DOI] [PubMed] [Google Scholar]
- 28. Jansen MA, Hart AA, Korevaar JC, Dekker FW, Boeschoten EW, Krediet RT: Predictors of the rate of decline of residual renal function in incident dialysis patients. Kidney Int 62: 1046–1053, 2002 [DOI] [PubMed] [Google Scholar]
- 29. U.S. Renal Data System: USRDS 2005 Annual Data Report: Atlas of End-Stage Renal Disease in the United States. Bethesda, MD, National Institutes of Health, National Institute of Diabetes and Digestive and Kidney Diseases, 2005 [Google Scholar]
- 30. Guo A, Mujais S: Patient and technique survival on peritoneal dialysis in the United States: Evaluation in large incident cohorts. Kidney Int 64[Suppl 88]: S3–S12, 2003 [DOI] [PubMed] [Google Scholar]
- 31. Mehrotra R, Khawar O, Duong U, Fried L, Norris K, Nissenson A, Kalantar-Zadeh K: Ownership patterns of dialysis units and peritoneal dialysis in the United States: Utilization and outcomes. Am J Kidney Dis 54: 289–298, 2009 [DOI] [PubMed] [Google Scholar]
- 32. Schaubel DE, Blake PG, Fenton SS: Effect of renal center characteristics on mortality and technique failure on peritoneal dialysis. Kidney Int 60: 1517–1524, 2001 [DOI] [PubMed] [Google Scholar]
- 33. Mehrotra R, Blake P, Berman N, Nolph KD: An analysis of dialysis training in the United States and Canada. Am J Kidney Dis 40: 152–160, 2002 [DOI] [PubMed] [Google Scholar]
- 34. Snyder JJ, Foley RN, Gilbertson DT, Vonesh EF, Collins AJ: Hemoglobin levels and erythropoietin doses in hemodialysis and peritoneal dialysis patients in the United States. J Am Soc Nephrol 15: 174–179, 2004 [DOI] [PubMed] [Google Scholar]
- 35. Lysaght MJ: Maintenance dialysis population dynamics: Current trends and long-term implications. J Am Soc Nephrol 13[Suppl 1]: S37–S40, 2002 [PubMed] [Google Scholar]
- 36. U.N. Department of Economic Affairs and Social Affairs Population Division: World Population Ageing: 1950–2050. Available online at http://www.un.org/esa/desa Accessed November 3, 2009
- 37. Wild S, Roglic G, Green A, Sicree R, King H: Global prevalence of diabetes: Estimates for the year 2000 and projections for 2030. Diabetes Care 27: 1047–1053, 2004 [DOI] [PubMed] [Google Scholar]
- 38. Longenecker JC, Coresh J, Klag MJ, Levey AS, Martin AA, Fink NE, Powe NR: Validation of comorbid conditions on the end-stage renal disease medical evidence report: The CHOICE study. Choices for Healthy Outcomes in Caring for ESRD. J Am Soc Nephrol 11: 520–529, 2000 [DOI] [PubMed] [Google Scholar]
- 39. Schafer J: Analysis of Incomplete Multivariable Data, 1st edition Virginia Beach, VA, Chapman & Hall/CRC, 1997 [Google Scholar]
- 40. Shih YC, Guo A, Just PM, Mujais S: Impact of initial dialysis modality and modality switches on Medicare expenditures of end-stage renal disease patients. Kidney Int 68: 319–329, 2005 [DOI] [PubMed] [Google Scholar]
- 41. Robins JM, Hernan MA, Brumback B: Marginal structural models and causal inference in epidemiology. Epidemiology 11: 550–560, 2000 [DOI] [PubMed] [Google Scholar]
- 42. Snyder JJ, Kasiske BL, Gilbertson DT, Collins AJ: A comparison of transplant outcomes in peritoneal and hemodialysis patients. Kidney Int 62: 1423–1430, 2002 [DOI] [PubMed] [Google Scholar]
- 43. Levey AS, Bosch JP, Lewis JB, Greene T, Rogers N, Roth D: A more accurate method to estimate glomerular filtration rate from serum creatinine: A new prediction equation. Modification of Diet in Renal Disease Study Group. Ann Intern Med 130: 461–470, 1999 [DOI] [PubMed] [Google Scholar]
- 44. Austin PC: A critical appraisal of propensity-score matching in the medical literature between 1996 and 2003. Stat Med 27: 2037–2049, 2008 [DOI] [PubMed] [Google Scholar]
- 45. Lin D, Wei L: The robust inference for the Cox proportional hazards model. J Am Stat Assoc 84: 1074–1078, 1989 [Google Scholar]