Abstract
The role of microRNAs (miRs), which are endogenous RNA oligonucleotides that regulate gene expression, in diabetic nephropathy is unknown. Here, we performed expression profiling of cultured proximal tubular cells (PTCs) under high-glucose and control conditions. We identified expression of 103 of 328 microRNAs but did not observe glucose-induced changes in expression. Next, we performed miR expression profiling in pooled RNA from formalin-fixed, paraffin-embedded tissue from renal biopsies. We studied three groups of patients with established diabetic nephropathy and detected 103 of 365 miRs. Two miRs differed by more than two-fold between progressors and nonprogressors, and 12 miRs differed between late presenters and other biopsies. We noted the greatest change in miR-192 expression, which was significantly lower in late presenters. Furthermore, in individual biopsies, low expression of miR-192 correlated with tubulointerstitial fibrosis and low estimated GFR. In vitro, treatment of PTCs with TGF-β1 decreased miR-192 expression. Overexpression of miR-192 suppressed expression of the E-Box repressors ZEB1 and ZEB2, thereby opposing TGF-β–mediated downregulation of E-cadherin. In summary, loss of miR-192 expression associates with increased fibrosis and decreased estimated GFR in diabetic nephropathy in vivo, perhaps by enhancing TGF-β–mediated downregulation of E-cadherin in PTCs.
Tubulointerstitial fibrosis is recognized as a key determinant of progressive chronic kidney disease (CKD). Epithelial-to-mesenchymal transition (EMT) of proximal tubular epithelial cells (PTCs), driven largely by the cytokine TGF-β, is integral to this process. MicroRNAs (miRs) are small, endogenous posttranscriptional regulators of gene expression. Recent data link decreased expression of miR-200 family members to EMT in cancer1–3; however, the role of miRs in EMT associated with nonmalignant disease such as renal fibrosis is less clear. Furthermore, although alterations in miR expression are a subject of intense study in cancer (reviewed by Garzon et al.4), variations in miR expression in nonmalignant disease are not well explored, in part because standard diagnostic techniques in nonmalignant disease yield RNA quantities that are challenging to use for hybridization array–based miR profiling.
The purpose of this study was to investigate the role of miRs in the pathogenesis of diabetic nephropathy. Initial array experiments suggested that elevated glucose did not induce changes in miR expression in PTCs in vitro. Subsequent experiments used a PCR-based array system (TaqMan Low Density Array; Applied Biosystems) to profile miR expression in pooled samples from formalin-fixed, paraffin-embedded (FFPE) renal biopsy tissue of patients with established diabetic nephropathy. The data showed widespread changes in miR expression in patients with fibrosis at the time of biopsy, most particularly decreased miR-192 expression in those presenting with advanced nephropathy. Subsequent experiments confirmed correlation of miR-192 expression with histopathologic and functional indicators of adverse renal prognosis. Additional in vitro data demonstrated downregulation of miR-192 expression in PTCs incubated with TGF-β, and that enforced expression of miR-192–opposed TGF-β–dependent EMT events, linking loss of miR-192 expression mechanistically to EMT in renal fibrosis.
Results
Elevated glucose causes significant alterations in PTC gene expression5 and is implicated as an important causal stimulus in diabetic nephropathy. We performed initial experiments to examine whether glucose altered miR expression in PTCs. We cultured HK-2 cells in control or high-glucose medium for 48 hours before quantifying miRs by mirVana Array. We detected 103 of 328 human miRs examined (Figure 1A. For a complete listing of expression data, see supplemental data). No significant differences in miR expression were observed in cells cultured in high glucose compared with normal glucose (Figure 1). These data suggested that the PTC miR expression profile was not influenced by glucose in the short term. To determine whether changes in miR expression were associated with diabetic nephropathy in the longer term, we examined miR expression in renal biopsies from a cohort of patients with established diabetic nephropathy. These patient biopsies were previously characterized in terms of histopathologic indices of scarring.6 Three predetermined groups of patient samples were studied, separated on the basis of rate of loss of estimated GFR (eGFR) in follow-up. These were progressors (loss of eGFR >5 ml/min per yr), nonprogressors (<5 ml/min per yr), and late presenters (eGFR <15 ml/min at time of biopsy). Patient characteristics are presented in Table 1.
Figure 1.
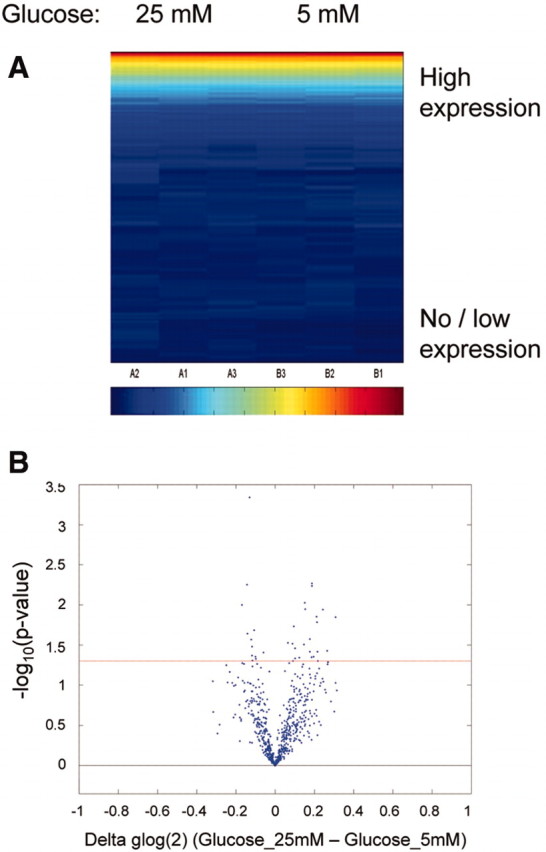
miR profiling in PTCs in shown. HK-2 cells were cultured in 25 mM glucose or control medium for 48 hours before RNA extraction and miR profiling using Ambion mirVana miRNA Bioarray. (A) Expression of 328 human miRs in HK-2 cells is represented on a heat map scale, with dark blue being low/no expression and red being maximum expression. Samples and miRs were grouped according to unsupervised Bicluster Analysis. (B) Volcano plot shows the relationship between change in miR expression between the two groups (25 mM glucose and control) and significance (−log10 of uncorrected P values). Horizontal red line represents P = 0.05 threshold.
Table 1.
Patient characteristics
| Patient Group | n | Gender | Age (Years) | eGFR | Change in eGFR (ml/min per yr) |
|---|---|---|---|---|---|
| Nonprogressors | 9 | 1 F, 8 M | 49.7 ± 3.8 | 46.2 ± 4.7 | 2.0 ± 0.5 |
| Progressors | 9 | 2 F, 7 M | 54.8 ± 4.4 | 45.1 ± 10.1 | 9.4 ± 0.8 |
| Late presenters | 4 | 0 F, 4 M | 56.3 ± 7.1 | 8.3 ± 0.9 | NA |
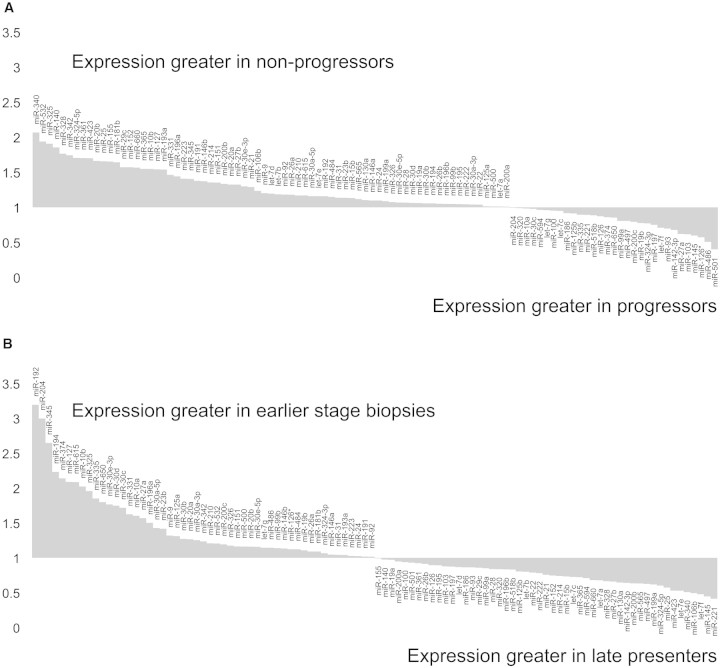
Pooled RNA from each group was subjected to TaqMan Low Density Array analysis (Applied Biosystems). A total of 103 of 365 miRs examined were present. miR expression pattern varied across all three groups, with the greatest differences evident in late presenters. Comparative miR expression in progressors versus nonprogressors is plotted in Figure 2A and in late presenters versus combined data for progressors and nonprogressors in Figure 2B. For full listings of expression data, see supplemental data.
Figure 2.
Taqman Low Density Array determination of miR expression in renal biopsy tissue from patients with diabetic nephropathy. Renal biopsies from patients with diabetic nephropathy were separated into three groups on the basis of progression after biopsy: Progressors (change in eGFR >5 ml/min per yr; n = 9), nonprogressors (change in eGFR <5 ml/min per yr; n = 9), and late presenters (eGFR ≤15 ml/min at biopsy; n = 4). After RNA extraction, expression of 365 miRs was quantified in pooled RNA for each of the groups using Taqman Low Density Array V1. Fold expression values are displayed for miRs expressed (threshold cycle <33). (A) Comparison of progressors versus nonprogressors. (B) Comparison of combined earlier stage biopsies (progressors+nonprogressors) versus late presenters.
Notably, expression of miR-192, identified as highly expressed in human kidney7 and as enriched in murine renal cortex,8 was higher in progressors and nonprogressors compared with late presenters (Figure 2B), suggesting loss of miR-192 expression in advanced diabetic nephropathy. miR-192 expression was quantified in 22 individual biopsy samples by quantitative reverse transcriptase– PCR (qRT-PCR), and lower expression in late presenters was confirmed (Figure 3A). Subsequently, we tested association between miR-192 expression and structural and functional clinical parameters. Significant correlations were observed between eGFR and miR-192 expression (Pearson correlation 0.768; P < 0.001; Figure 3C) and between fibrosis score and miR-192 expression (Pearson correlation −0.704; P < 0.001; Figure 3B).
Figure 3.
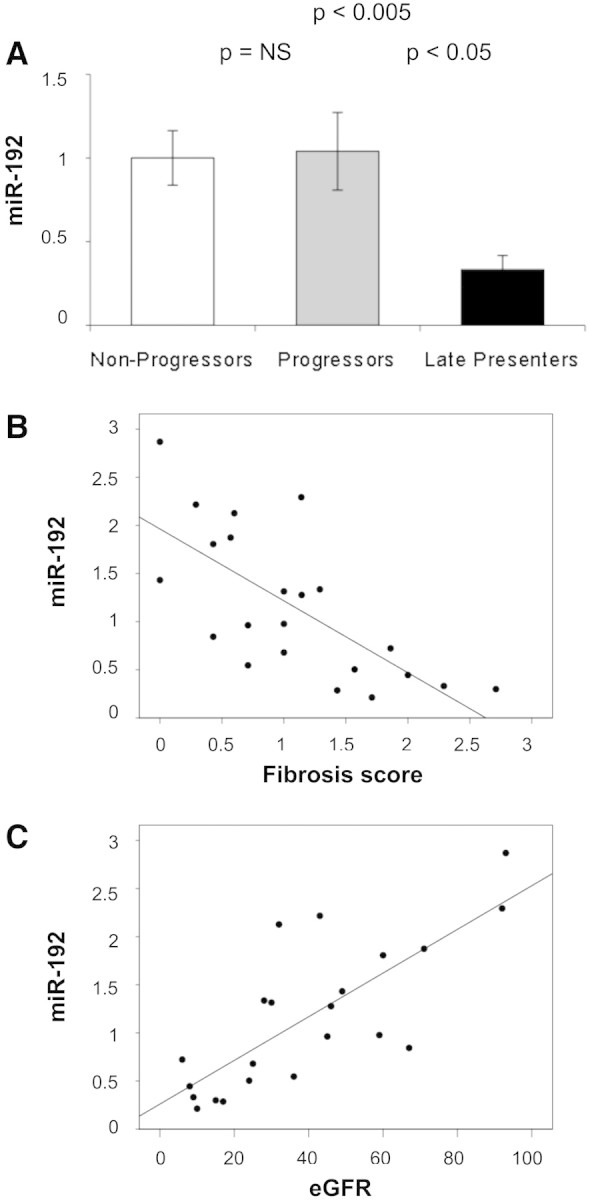
miR-192 expression in individual kidney biopsies and its correlation with severity of kidney disease. (A) miR-192 was examined in individual samples pooled for use in miR profiling (nine nonprogressors, nine progressors, and four late presenters) by qRT-PCR, using miR-16 as an endogenous control. Data are means ± SEM. (B) Plot of miR-192 expression versus fibrosis score (Pearson coefficient −0.704; P < 0.001). (C) Plot of miR-192 expression versus four-variable MDRD eGFR (Pearson coefficient 0.768; P < 0.001).
The miR-200 family is extensively linked to EMT in cancer.1–3 To check the specificity of the changes observed in miR-192, we quantified miR-200b in the 22 individual biopsy samples by qRT-PCR. No significant variation was detected among progressors, nonprogressors, and late presenters (Figure 4A), and no correlation was seen between miR-200b expression and either fibrosis score (Figure 4B) or eGFR (Figure 4C).
Figure 4.
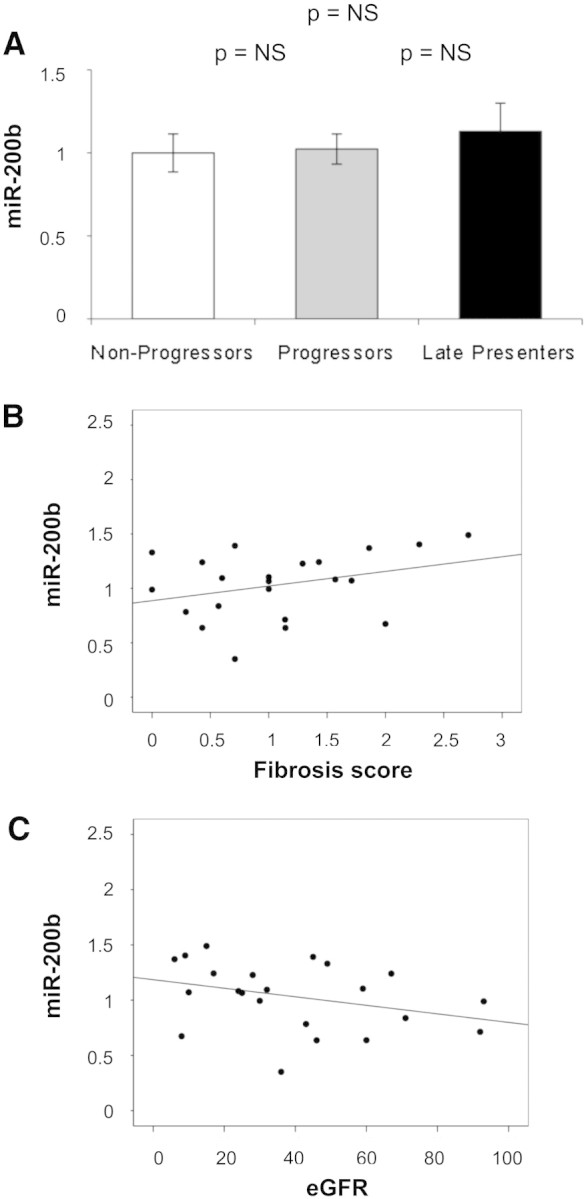
miR-200b expression in individual kidney biopsies and its correlation with severity of kidney disease are shown. (A) miR-200b was examined in individual samples pooled for use in miR profiling (nine nonprogressors, nine progressors, and 4 late presenters) by qRT-PCR, using miR-16 as an endogenous control. Data are means ± SEM. (B) Plot of miR-192 expression versus fibrosis score (Pearson coefficient 0.321; P = 0.146). (C) Plot of miR-192 expression versus four-variable MDRD eGFR (Pearson coefficient −0.331; P = 0.133).
To localize miR-192 expression within the kidney, we performed in situ hybridization for miR-192 using a double-digoxigenin–labeled locked nucleic acid probe. Hybridization signal was largely found overlying tubules and glomeruli, in keeping with expression of miR-192 in both glomerular and tubular cells. Consistent with the qRT-PCR data, very little signal was detected in areas of fibrosis (Figure 5). No signal was detected in control experiments performed without probe (data not shown).
Figure 5.
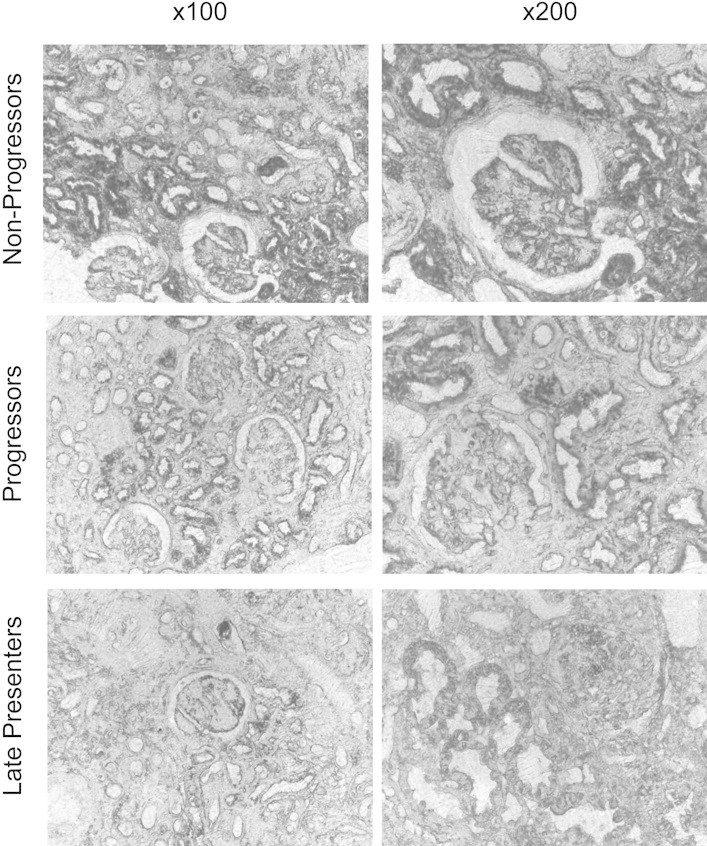
In situ hybridization for miR-192 is shown. Sections from two biopsies in each group (nonprogressors, progressors, and late presenters) were stained for miR-192 using a double-digoxigenin–labeled locked nucleic acid probe. No staining was seen in control experiments performed using secondary antibody in the absence of probe (data not shown). Sections were examined and photographed under phase contrast microscopy. Representative ×100 and ×200 images are shown.
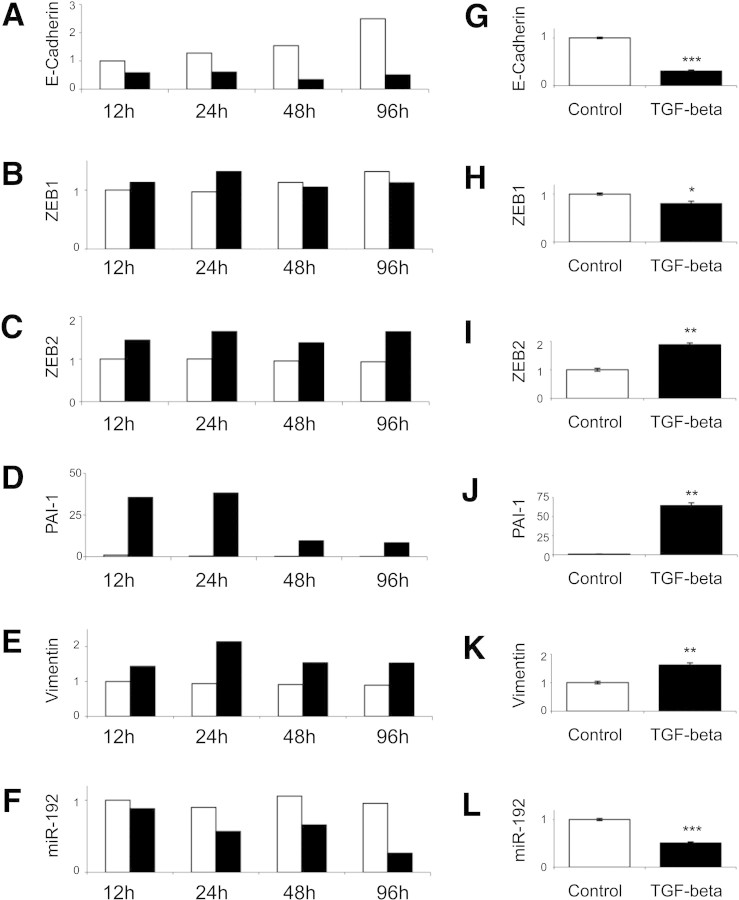
These data indicate that miR-192 expression correlates inversely with loss of renal excretory function and with the presence of tubulointerstitial fibrosis in renal biopsy tissue from patients with established diabetic nephropathy. A key step in fibrogenesis in the kidney and, hence, in progression of CKD is EMT of tubular epithelial cells in response to TGF-β.9 ZEB1 (also known as δEF1) and ZEB2 (also known as SIP1) are E-Box–binding proteins that repress E-cadherin transcription and hence abrogate E-cadherin–mediated intercellular adhesiveness. These actions of ZEB1 and ZEB2 are an important early stage of EMT,10 although it is important to acknowledge that EMT is not the only source of the renal myofibroblast in renal fibrosis, which may also originate from bone marrow, endothelial, and resident fibroblast precursor populations. ZEB111 and ZEB212 are also validated targets for miR-192. To examine the role of TGF-β in decreased miR-192 expression in the fibrotic kidney and to examine whether decreased miR-192 expression was functionally related to development of renal fibrosis, we performed in vitro experiments using the PTC line HK-2. Incubation with 10 ng/ml TGF-β for time points to 96 hours led to induction of vimentin, plasminogen activator inhibitor 1 (PAI-1), and ZEB2 and to repression of E-cadherin expression (Figure 6, A through E and G through K). Subsequently, we examined the effect of TGF-β on PTC miR-192 expression. Ninety-six hours of incubation with 10 ng/ml TGF-β led to a 51% reduction in miR-192 (Figure 6, F and L).
Figure 6.
PTC responses to TGF-β were examined by qRT-PCR. (A through L) HK-2 cells were cultured without serum for 48 hours and then incubated with 10 ng/ml TGF-β (■) or control medium (□) for indicated time points (A through F) or 96 hours (G through L). Expression of E-cadherin (A and G), ZEB1 (B and H), ZEB2 (C and I), vimentin (D and J), PAI-1 (E and K), and miR-192 (F and L) was measured by qRT-PCR and normalized to GAPDH expression. miR-192 was normalized to miR-16. Error bars (G through L) represent SEM (n = 3). *P < 0.05; **P < 0.005; ***P < 0.0005.
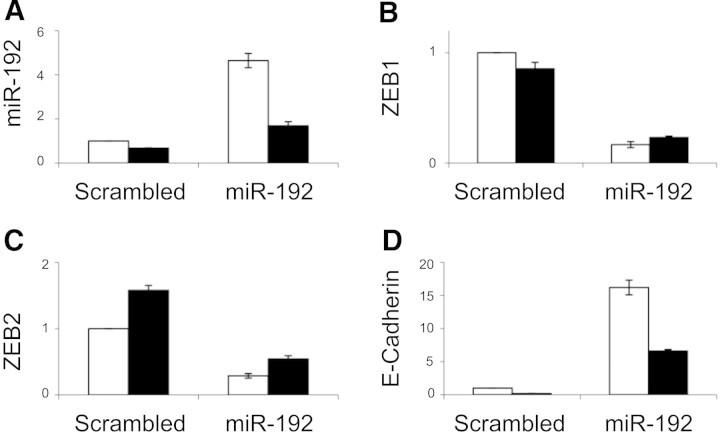
Next, we studied the effect of enforced expression of miR-192 in PTCs. Transient transfection with miR-192 expression construct did not induce detectable changes in PTC phenotype or TGF-β–dependent gene expression patterns (data not shown); therefore, HK-2–derived clonal cell lines exhibiting stable miR-192 overexpression were developed (Figure 7A). Enforced expression of miR-192 reduced basal ZEB1 and ZEB2 expression and opposed the induction of ZEB2 seen in cells incubated with 10 ng/ml TGF-β for 96 hours (Figure 7, B and C). Enforced miR-192 expression led to a 17-fold increase in E-cadherin expression (Figure 7D).
Figure 7.
Altered E-cadherin and E-Box repressors expression in HK-2 cells overexpressing miR-192 by qRT-PCR is shown. Stable lines overexpressing miR-192 or a control short hairpin (Scrambled) were generated as described in the Concise Methods section. After 48 hours without serum, cells were incubated with TGF-β (■) or control medium (□) for 96 hours. (A through D) Subsequently, expression of miR-192 (A), ZEB1 (B), ZEB2 (C), and E-cadherin (D) was examined by qRT-PCR. miR-192 was normalized to miR-16, and the other genes were normalized to GAPDH. The experiment was performed for the control line and three independent cell lines overexpressing miR-192, all three giving similar results (results from one line are shown). Error bars represent SEM (n = 3).
E-cadherin expression was decreased after incubation of miR-192–overexpressing cells with 10 ng/ml TGF-β for 96 hours but remained seven-fold higher than control values (Figure 7D). E-cadherin expression after enforced expression of miR-192 was also quantified by immunoblotting and by fluorescence microscopy. Increased E-cadherin expression and retention of E-cadherin expression after 96 hours of incubation with 10 ng/ml TGF-β was seen in clones overexpressing miR-192 (Figure 8). These data are consistent with targeting of the E-Box repressors ZEB1 and ZEB2 by miR-192 and hence a major role for miR-192 in defining E-cadherin expression in PTCs.
Figure 8.
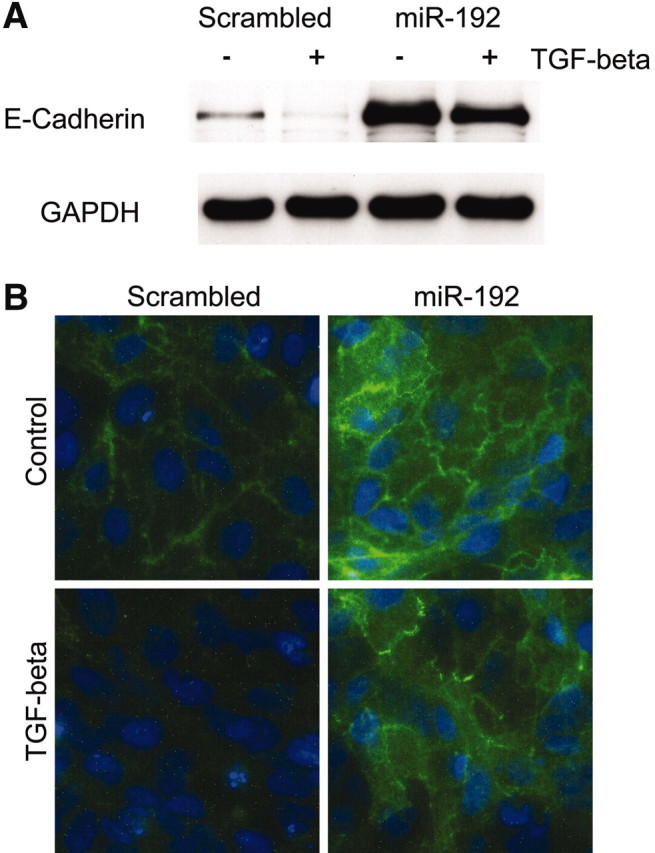
Altered E-cadherin expression in cells overexpressing miR-192 by immunoblot and fluorescence microscopy is shown. Stable lines overexpressing miR-192 or a control short hairpin (Scrambled) were growth-arrested in serum-free medium for 48 hours before incubation with 10 ng/ml TGF-β (■) or control medium (□) for 96 hours. (A and B) Then E-cadherin protein was examined by Western blot (A) or fluorescence microscopy (B). The representative results of at least three independent experiments are shown.
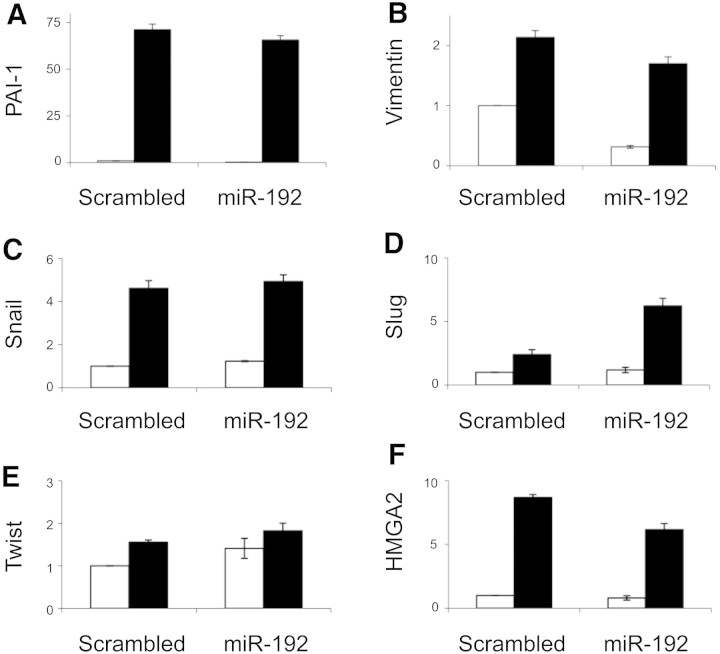
Finally, we examined the specificity of the effect of miR-192 overexpression by studying other PTC responses to TGF-β. PAI-1 is induced by TGF-β via Smad-dependent transcriptional activation.13 Enforced expression of miR-192 did not alter basal or TGF-β–stimulated PAI-1 expression (Figure 9A). Vimentin expression is induced by TGF-β via Smad, AP1, and SP1 transcription factors.14 ZEB2 may also contribute to vimentin regulation in that siRNA-mediated ZEB2 knockdown represses basal vimentin expression via unknown mechanisms.15 Enforced expression of miR-192 led to decreased basal vimentin expression but did not inhibit induction of vimentin by TGF-β (Figure 9B). Other markers of EMT have been associated with the downstream effects of TGF-β, including HMGA2, Snail, Slug, and Twist. Notably, HMGA2 is induced by TGF-β and induces EMT via induction of transcriptional repressors of E-cadherin, including Snail, Slug, and Twist.16 Accordingly, expression of these genes was checked in cells exhibiting enforced expression of miR-192 or scrambled control sequence, after 96 hours of incubation with 10 ng/ml TGF-β or control medium. TGF-β induced expression of HMGA2, Snail, Slug, and Twist, which was not opposed by enforced expression of miR-192 (Figure 9, C through F). These data support the specific effect of miR-192 in maintaining E-cadherin expression via repression of ZEB1 and ZEB2.
Figure 9.
Expression of other EMT markers in HK-2 cells overexpressing miR-192 by qRT-PCR is shown. Stable lines overexpressing miR-192 or a control short hairpin (Scrambled) were growth-arrested in serum-free medium for 48 hours before incubation with 10 ng/ml TGF-β (■) or control medium (□) for 96 hours. (A through F) Expression of PAI-1 (A), vimentin (B), Snail (C), Slug (D), Twist (E), and HMGA2 (F) was examined by qRT-PCR. The expression was normalized to GAPDH. Error bars represent SEM (n = 3).
Discussion
The major findings of this study are that PTC miR-192 expression is decreased in response to TGF-β and that loss of miR-192 correlates with tubulointerstitial fibrosis and reduction in eGFR in renal biopsies from patients with established diabetic nephropathy. Initial array studies suggested that, in vitro, PTC miR expression profile is highly stable and is not influenced by glucose alone in the short term. Subsequent PCR-based array examination of miR expression in pooled kidney biopsy samples categorized miR expression in patients with established nephropathy. Multiple differences in miR expression were detected between patients who progressively lost renal function after biopsy and those who did not and between those with advanced disease at the time of biopsy and those with earlier stage disease. These data identify miRs for further study and suggest that miR quantification may provide useful prognostic information for patients with diabetic nephropathy. In keeping with this, subsequent quantification of miR-192 in individual biopsy samples demonstrated correlation of loss of miR-192 expression with decreased eGFR and with histopathologic evidence of tubulointerstitial fibrosis on biopsy.
Subsequent in vitro work was undertaken to investigate causal links between loss of miR-192 expression and development of tubulointerstitial fibrosis. TGF-β1 is an ubiquitous cytokine that functions in an autocrine or paracrine manner to elicit a multiplicity of effects, principally related to cell growth and extracellular matrix accumulation. It is widely implicated in the pathogenesis of renal fibrosis in human and experimental disease.17–20 TGF-β is postulated to be a major biologic signal that regulates the switch in tubular cell activities toward a profibrogenic phenotype.21 In this study, TGF-β was shown to decrease miR-192 expression in PTCs. Interestingly, all clonal cell lines studied retained miR-192 downregulation after incubation with TGF-β, despite replacement of the miR-192 promoter with a constitutively active promoter in the overexpression vector. This suggests that TGF-β acts posttranscriptionally to regulate miR-192 expression. TGF-β was recently shown to alter posttranscriptional processing of miR-21 via interaction of Smad proteins with Drosha, a core component of the nuclear miR processing complex.22 It is not known how widespread posttranscriptional regulation of specific miRs is by TGF-β.
In tubular epithelial cells, repression of E-cadherin is an early event that precedes other alterations during EMT.23 ZEB1 and ZEB2 are key transcriptional regulators of TGF-β–mediated suppression of E-cadherin.24 Previous reports established a role for miR in maintenance of an epithelial phenotype via targeting of ZEB1 and ZEB2. Several reports established ZEB1 and ZEB2 as targets of miRs of the miR-200 family and showed that expression of miR-200 family miRs is associated with maintenance of an epithelial phenotype in cancer-derived cell lines.1–3,25 ZEB111 and ZEB212 are also targets of miR-192. Notably, miR-192 is enriched in the normal renal cortex8 and highly expressed in the kidney,7 whereas members of the miR-200 family are not. In this study, we show that miR-192 targets ZEB1 and ZEB2 in PTCs and that enforced expression of miR-192 leads to enhanced E-cadherin expression. These data suggest that miR-192 plays a major role in defining E-cadherin expression in PTCs and that TGF-β–dependent loss of miR-192 expression is an important contributor to alterations in PTC phenotype in renal tubulointerstitial fibrosis. It is important to consider, however, that ZEB1 and ZEB2 are not exclusively relevant for E-cadherin but regulate other genes, for example, collagen I in fibroblasts and mesangial cells. Intriguingly, ZEB2 has also been identified as a target of miR-192 in mesangial cells12; however, in the work of Kato et al.,12 miR-192 expression was increased by serum or TGF-β in murine mesangial cells and in the glomeruli of diabetic mice. This suggests that mesangial cell and PTC miR expression profiles may exhibit divergent responses to profibrotic stimuli such as TGF-β and that the mechanisms underlying this may be a fruitful area for further study.
Extensive characterization of miR expression in malignancy shows that miR profiling has promise as a clinical tool for diagnostic and prognostic evaluation. To date, however, miR profiling with established array-based techniques has required RNA quantities that preclude analysis of most nonsurgically obtained samples. In this article, we examined miR expression in renal biopsies from patients with diabetic nephropathy. We found that miR expression profiling was possible using PCR-based techniques in FFPE tissue from renal biopsy samples collected in a standard manner for routine evaluation. This approach could usefully be widely applied within nephrology, in which array studies may thus far have been limited in comparison with the extensive data available using cancer samples, more readily available after surgical resection of tumors. Beyond the advantages of studying tissue from patients rather than animal models, a key advantage of renal biopsy tissue over nephrectomy specimens is the relatively rapid fixation, given the substantial changes in miR expression that occur after a prolonged period of tissue hypoxia,26 a potential confounding element in studies based on specimens obtained at surgical nephrectomy. Recent TaqMan Low Density Array data showing variations in miR expression profiles in biopsies from human renal allografts undergoing acute rejection27 also support the potential widespread importance of miRs as biomarkers in renal disease.
Concise Methods
Cell culture
Human PTC line HK-2 was obtained from ATCC (LGC Standards, Teddington, UK). The cells were maintained in DMEM (Life Technologies/Invitrogen, Paisley, UK)/Ham's F12 (Sigma, Poole, UK) supplemented with 10% FCS (Biosera, Ringmer, UK), hydrocortisone, insulin, transferrin, and sodium selenite (Sigma) as described previously.28 Cells were grown to confluence and were serum deprived for 48 hours before stimulation with 25 mM glucose or 10 ng/ml recombinant TGF-β (R&D Systems, Abingdon, UK) under serum-free conditions.
mirVana Arrays
Expression of 328 human miRs was examined in HK-2 cells (control or exposed to 25 mM glucose for 48 hours) by Asuragen (Austin, TX), using Ambion mirVana miRNA Bioarray V2 as described previously.29
Tissue Samples
FFPE kidney specimens of 22 patients with diabetic nephropathy, previously characterized by Lewis et al.,6 were examined. Renal function was defined as the eGFR calculated using the four-variable Modification of Diet in Renal Disease (MDRD) Study equation, and the stage of renal disease was derived from a serum creatinine value measured at the time of renal biopsy (National Kidney Foundation, 2002). Patients who had stage 5 CKD or required renal replacement therapy within 6 months of their renal biopsy were considered late presenters. Patients who had deterioration of ≥5 ml/min per yr in their eGFR (which also equated to a >10% change in the starting GFR) were termed progressors, and those who did not satisfy these criteria were termed nonprogressors. Fibrosis scores were determined in the previous study as reported6 using the grading system of Shih et al.30
miR Profiling Using TaqMan Low Density Arrays
RNA was extracted from FFPE samples using RecoverAll Total RNA Isolation Kit (Applied Biosystems, Warrington, UK), and RNA quality was assessed with RNA 6000 Pico Chip kit (Agilent Technologies, Wokingham, UK). For each group of patients (nonprogressors, progressors, and late presenters), 25 ng of pooled total RNA was used for multiplex reverse transcription reactions with miR-specific RT primers (Human Multiplex RT Set: Pools 1 to 8, 1.0; Applied Biosystems). Subsequently, expression of 365 miRs was tested by quantitative PCR using TaqMan Low Density Array Human MicroRNA Panel 1.0 (Applied Biosystems) run on an Applied Biosystems 7900HT instrument with detection limit set to Ct = 33, according to the manufacturer's instructions. The data presented are normalized to miR-16, identified as a suitable endogenous control using the geNorm VBA applet for Microsoft Excel.31
Generation of HK-2 miR-192 Stable Cell Lines
Plasmids for expression of miR-192 precursor or control short hairpin were prepared by insertion of annealed oligonucleotides into psiSTRIKE U6-Puromycin vector (Promega, Southampton, UK). HK-2 cells were transfected with those plasmids using Lipofectamine LTX Plus (Invitrogen), and stably transfected cells were selected using Puromycin (Invivogen/Autogen Bioclear, Calne, UK). Three single lines with highest miR-192 expression were used in experiments. Oligonucleotides inserted to siSTRIKE Vector were as follows:
miR192 forward ACCGTGCACAGGGCTCTGACCTATGAATTGACAGCCAGTGCTCTCGTCTCCCCTCTGGCTGCCAATTCCATAGGTCACAGGTATGTTCGCCTTTTTC and miR192 reverse TGCAGAAAAAGGCGAACATACCTGTGACCTATGGAATTGGCAGCCAGAGGGGAGACGAGAGCACTGGCTGTCAATTCATAGGTCAGAGCCCTGTGCA and Scrambled forward ACCGCGTATCGTAAGCAGTACTAAGTTCTCTAGTACTGCTTACGATACGCTTTTTC and Scrambled reverse TGCAGAAAAAGCGTATCGTAAGCAGTACTAGAGAACTTAGTACTGCTTACGATACG.
Quantitative RT-PCR
miR-192 was quantified using a TaqMan MicroRNA Assay (Applied Biosystems). miR-16–specific stem-loop RT primer and qPCR primers were designed as described previously32 and used with MicroRNA Reverse Transcription Kit and Power SYBR Green Master Mix (Applied Biosystems). Before use in experiments, the primer set was analyzed for linear detection and efficiency approximately 100% within the range of 2 to 250 ng of HK-2 cell total RNA input, and single qPCR product was confirmed by melting curve analysis. For mRNA quantification, reverse transcription with High Capacity cDNA Reverse Transcription Kit (Applied Biosystems) was performed. The cDNA was then used in gene-specific qPCR with Power SYBR Green Master Mix and primers listed in Table 1. Relative quantities were calculated using the 2-ΔΔCt method.33 miR-192 expression was normalized to miR-16, and mRNA was normalized to glyceraldehyde-3-phosphate dehydrogenase (GAPDH). Initial analysis of multiple endogenous controls established uniformity of expression and confirmed that the selected controls did not influence the results (U6 snRNA for small RNAs; TATA-box binding protein, β2-microglobulin, human large ribosomal protein RPLP0, and HPRT1 for mRNA).
Primers for miR Detection
Primers for miR detection were as follows: miR-16RT ATCAAGCGTCGCAGGAACATCACCCACATGTTACGATTGATCGCCA, miR-16 PCR forward TAGCAGCACGTAAATATTGG, and miR-16 PCR reverse AGCGTCGCAGGAACATCA
Primers for mRNA Detection
Primers for mRNA detection were as follows: GAPDH forward CCTCTGACTTCAACAGCGACAC and GAPDH reverse TGTCATACCAGGAAATGAGCTTGA, E-cadherin forward TCCCAATACATCTCCCTTCACA and E-cadherin reverse ACCCACCTCTAAGGCCATCTTT, ZEB1 forward CAGGCAGATGAAGCAGGATGT and ZEB1 reverse TGACAGCAGTGTCTTGTTGTTGTAG, ZEB2 forward CCTTCTGCGACATAAATACGAACA and ZEB2 reverse AGTACGAGCCCGAGTGTGAGA, vimentin forward GGAGAAATTGCAGGAGGAGATG and vimentin reverse AAGGTCAAGACGTGCCAGAGA, and PAI-1 forward TCTCTGCCCTCACCAACATTC and PAI-1 reverse CGGTCATTCCCAGGTTCTCT.
miR-192 In Situ Hybridization
In situ hybridization for miR-192 was performed using double-digoxigenin–labeled LNA miRCURY probes (Exiqon, Vedbaek, Denmark) as described previously.34 Briefly, 5-μ sections of FFPE kidney biopsy tissue were deparaffinized by sequential washes with xylene, 100 to 25% ethanol, and PBS. The sections were deproteinated with proteinase K and fixed with 4% paraformaldehyde. Prehybridization was performed with hybridization buffer (50% formamide, 5× SSC, 0.1% Tween 20, 50 μg/ml heparin, and 500 μg/ml yeast tRNA [pH 6]). Hybridization was performed with a probe concentration of 20 nM in hybridization buffer for 12 hours at 52°C. The sections were washed with 2× SSC, then multiple washes in 50% Formamide, 2× SSC, and finally PBS and 0.1% Tween 20. The sections were blocked with blocking buffer (2% sheep serum, 2 mg/ml BSA in PBS, and 0.1% Tween 20) and then incubated with anti–digoxigenin-alkaline phosphatase, Fab fragment (Roche, Mannheim, Germany) in blocking buffer for 12 hours. The sections were washed repeatedly in PBS and 0.1% Tween 20, and detection was performed using 1-Step NBT/BCIP plus Suppressor (Pierce) according to manufacturer's instructions. The sections were mounted in glycerol and viewed under phase contrast microscopy.
Immunoblotting
Cell extracts were prepared with RIPA Lysis Buffer (Santa Cruz Biotechnology, Heidelberg, Germany), and 15 μg was fractionated on a 7.5% SDS polyacrylamide gel. After transfer to a nitrocellulose membrane, probing was carried out with anti–E-cadherin antibody (H-108, 1:1000; Santa Cruz Biotechnology). To ensure equal protein load in each lane, after visualization of E-cadherin by ECL method (GE Healthcare, Amersham, UK), membranes were stripped and reprobed with anti-GAPDH antibody (ab9485, 1:1000; Abcam, Cambridge, UK).
Immunofluorescence
After stimulation with TGF-β, cells on glass Lab-Tek Chamber Slides (Nunc/VWR Int., Leics, UK) were fixed with 3.7% PFA for 10 min. E-cadherin was probed with a murine mAb (HECD-1, 1:100; Abcam) and visualized by Alexa Fluor 555–conjugated anti-mouse secondary antibody (1:1000; Molecular Probes/Invitrogen, Paisley, UK). Hoechst dye (Sigma) was subsequently used to stain nuclei.
Statistical Analysis
Pearson correlation coefficients were calculated for fibrosis score or eGFR and miR-192 in kidney biopsies from patients with diabetic nephropathy using SPSS 14.0 software. Statistical evaluation was otherwise by t test, using Microsoft Excel, with P < 0.05 assumed to be significant.
Disclosures
None.
Acknowledgments
D.F. is funded by a clinician scientist award from the Welsh Office of Research Development. R.J. is funded by Kidney Research UK.
Footnotes
Published online ahead of print. Publication date available at www.jasn.org.
Supplemental information for this article is available online at http://www.jasn.org/.
References
- 1. Korpal M, Lee ES, Hu G, Kang Y: The miR-200 family inhibits epithelial-mesenchymal transition and cancer cell migration by direct targeting of E-cadherin transcriptional repressors ZEB1 and ZEB2. J Biol Chem 283: 14910–14914, 2008 [DOI] [PMC free article] [PubMed] [Google Scholar]
- 2. Park SM, Gaur AB, Lengyel E, Peter ME: The miR-200 family determines the epithelial phenotype of cancer cells by targeting the E-cadherin repressors ZEB1 and ZEB2. Genes Dev 22: 894–907, 2008 [DOI] [PMC free article] [PubMed] [Google Scholar]
- 3. Gregory PA, Bert AG, Paterson EL, Barry SC, Tsykin A, Farshid G, Vadas MA, Khew-Goodall Y, Goodall GJ: The miR-200 family and miR-205 regulate epithelial to mesenchymal transition by targeting ZEB1 and SIP1. Nat Cell Biol 10: 593–601, 2008 [DOI] [PubMed] [Google Scholar]
- 4. Garzon R, Calin G, Croce CM: MicroRNAs in cancer. Annu Rev Med 60: 167–179, 2009 [DOI] [PubMed] [Google Scholar]
- 5. Qi W, Chen X, Gilbert RE, Zhang Y, Waltham M, Schache M, Kelly DJ, Pollock CA: High glucose-induced thioredoxin-interacting protein in renal proximal tubule cells is independent of transforming growth factor-beta1. Am J Pathol 171: 744–754, 2007 [DOI] [PMC free article] [PubMed] [Google Scholar]
- 6. Lewis A, Steadman R, Manley P, Craig K, de la Motte C, Hascall V, Phillips AO: Diabetic nephropathy, inflammation, hyaluronan and interstitial fibrosis. Histol Histopathol 23: 731–739, 2008 [DOI] [PubMed] [Google Scholar]
- 7. Sun Y, Koo S, White N, Peralta E, Esau C, Dean NM, Perera RJ: Development of a micro-array to detect human and mouse microRNAs and characterization of expression in human organs. Nucleic Acids Res 32: e188, 2004 [DOI] [PMC free article] [PubMed] [Google Scholar]
- 8. Tian Z, Greene AS, Pietrusz JL, Matus IR, Liang M: MicroRNA-target pairs in the rat kidney identified by microRNA microarray, proteomic, and bioinformatic analysis. Genome Res 18: 404–411, 2008 [DOI] [PMC free article] [PubMed] [Google Scholar]
- 9. Liu Y: Epithelial to mesenchymal transition in renal fibrogenesis: Pathologic significance, molecular mechanism, and therapeutic intervention. J Am Soc Nephrol 15: 1–12, 2004 [DOI] [PubMed] [Google Scholar]
- 10. Comijn J, Berx G, Vermassen P, Verschueren K, van Grunsven L, Bruyneel E, Mareel M, Huylebroeck D, van Roy F: The two-handed E box binding zinc finger protein SIP1 downregulates E-cadherin and induces invasion. Mol Cell 7: 1267–1278, 2001 [DOI] [PubMed] [Google Scholar]
- 11. Yang S, Du J, Wang Z, Yan J, Yuan W, Zhang J, Zhu T: Dual mechanism of deltaEF1 expression regulated by bone morphogenetic protein-6 in breast cancer. Int J Biochem Cell Biol 41: 853–861, 2009 [DOI] [PubMed] [Google Scholar]
- 12. Kato M, Zhang J, Wang M, Lanting L, Yuan H, Rossi JJ, Natarajan R: MicroRNA-192 in diabetic kidney glomeruli and its function in TGF beta-induced collagen expression via inhibition of E-box repressors. Proc Natl Acad Sci U S A 104: 3432–3437, 2007 [DOI] [PMC free article] [PubMed] [Google Scholar]
- 13. Stroschein SL, Wang W, Luo K: Cooperative binding of Smad proteins to two adjacent DNA elements in the plasminogen activator inhibitor-1 promoter mediates transforming growth factor beta-induced Smad-dependent transcriptional activation. J Biol Chem 274: 9431–9441, 1999 [DOI] [PubMed] [Google Scholar]
- 14. Wu Y, Zhang X, Salmon M, Lin X, Zehner ZE: TGFbeta1 regulation of vimentin gene expression during differentiation of the C2C12 skeletal myogenic cell line requires Smads, AP-1 and Sp1 family members. Biochim Biophys Acta 1773: 427–439, 2007 [DOI] [PMC free article] [PubMed] [Google Scholar]
- 15. Bindels S, Mestdagt M, Vandewalle C, Jacobs N, Volders L, Noel A, Roy FV, Berx G, Foidart JM, Gilles C: Regulation of vimentin by SIP1 in human epithelial breast tumor cells. Oncogene 25: 4975–4985, 2006 [DOI] [PubMed] [Google Scholar]
- 16. Thuault S, Valcourt U, Peterson M, Manfioletti G, Heldin C: Transforming growth factor-β employs HMGA2 to elicit epithelial-mesenchymal transition. J Cell Biol 174: 175–183, 2006 [DOI] [PMC free article] [PubMed] [Google Scholar]
- 17. Border WA, Okuda S, Languino LR, Sporn MB, Ruoslahti E: Suppression of experimental glomerulonephritis by antiserum against transforming growth factor beta 1. Nature 346: 371–374, 1990 [DOI] [PubMed] [Google Scholar]
- 18. Border WA, Noble NA, Yamamoto T, Harper JR, Yamaguchi Y, Pierschbacher MD, Ruoslahti E: Natural inhibitor of transforming growth factor-beta protects against scarring in experimental kidney disease. Nature 360: 361–364, 1992 [DOI] [PubMed] [Google Scholar]
- 19. Yamamoto T, Nakamura T, Noble NA, Ruoslahti E, Border WA: Expression of transforming growth factor beta is elevated in human and experimental diabetic nephropathy. Proc Natl Acad Sci U S A 90: 1814–1818, 1993 [DOI] [PMC free article] [PubMed] [Google Scholar]
- 20. Yamamoto T, Noble NA, Miller DE, Border WA: Sustained expression of TGF beta 1 underlies development of progressive kidney fibrosis. Kidney Int 45: 916–927, 1994 [DOI] [PubMed] [Google Scholar]
- 21. Liu Y: Renal fibrosis: New insights into the pathogenesis and therapeutics. Kidney Int 69: 213–217, 2006 [DOI] [PubMed] [Google Scholar]
- 22. Davis BN, Hilyard AC, Lagna G, Hata A: SMAD proteins control DROSHA-mediated microRNA maturation. Nature 454: 56–61, 2008 [DOI] [PMC free article] [PubMed] [Google Scholar]
- 23. Yang J, Liu Y: Dissection of key events in tubular epithelial to myofibroblast transition and its implications in renal interstitial fibrosis. Am J Pathol 159: 1465–1475, 2001 [DOI] [PMC free article] [PubMed] [Google Scholar]
- 24. Shirakihara T, Saitoh M, Miyazono K: Differential regulation of epithelial and mesenchymal markers by deltaEF1 proteins in epithelial mesenchymal transition induced by TGF beta. Mol Biol Cell 18: 3533–3544, 2007 [DOI] [PMC free article] [PubMed] [Google Scholar]
- 25. Burk U, Schubert J, Wellner U, Schmalhofer O, Vincan E, Spaderna S, Brabletz T: A reciprocal repression between ZEB1 and members of the miR-200 family promotes EMT and invasion in cancer cells. EMBO Rep 9: 582–589, 2008 [DOI] [PMC free article] [PubMed] [Google Scholar]
- 26. Kulshreshtha R, Ferracin M, Wojcik SE, Garzon R, Alder H, Agosto-Perez FJ, Davuluri R, Liu C-G, Croce CM, Negrini M, Calin GA, Ivan M: A MicroRNA signature of hypoxia. Mol Cell Biol 27: 1859–1867, 2007 [DOI] [PMC free article] [PubMed] [Google Scholar]
- 27. Anglicheau D, Sharma VK, Ding R, Hummel A, Snopkowski C, Dadhania D, Seshan SV, Suthanthiran M: MicroRNA expression profiles predictive of human renal allograft status. Proc Natl Acad Sci U S A 106: 5330–5335, 2009 [DOI] [PMC free article] [PubMed] [Google Scholar]
- 28. Fraser D, Wakefield L, Phillips A: Independent regulation of transforming growth factor-beta1 transcription and translation by glucose and platelet-derived growth factor. Am J Pathol 161: 1039–1049, 2002 [DOI] [PMC free article] [PubMed] [Google Scholar]
- 29. Shingara J, Keiger K, Shelton J, Laosinchai-Wolf W, Powers P, Conrad R, Brown D, Labourier E: An optimized isolation and labeling platform for accurate microRNA expression profiling. RNA 11: 1461–1470, 2005 [DOI] [PMC free article] [PubMed] [Google Scholar]
- 30. Shih W, Hines WH, Neilson EG: Effects of cyclosporin A on the development of immune-mediated interstitial nephritis. Kidney Int 33: 1113–1118, 1988 [DOI] [PubMed] [Google Scholar]
- 31. Vandesompele J, De Preter K, Pattyn F, Poppe B, Van Roy N, De Paepe A, Speleman F: Accurate normalization of real-time quantitative RT-PCR data by geometric averaging of multiple internal control genes. Genome Biol 3: RESEARCH0034, 2002 [DOI] [PMC free article] [PubMed] [Google Scholar]
- 32. Chen C, Ridzon DA, Broomer AJ, Zhou Z, Lee DH, Nguyen JT, Barbisin M, Xu NL, Mahuvakar VR, Andersen MR, Lao KQ, Livak KJ, Guegler KJ: Real-time quantification of microRNAs by stem-loop RT-PCR. Nucleic Acids Res 33: e179, 2005 [DOI] [PMC free article] [PubMed] [Google Scholar]
- 33. Livak KJ, Schmittgen TD: Analysis of relative gene expression data using real-time quantitative PCR and the 2(-Delta Delta C(T)) method. Methods 25: 402–408, 2001 [DOI] [PubMed] [Google Scholar]
- 34. Nelson PT, Baldwin DA, Kloosterman WP, Kauppinen S, Plasterk RH, Mourelatos Z: RAKE and LNA-ISH reveal microRNA expression and localization in archival human brain tissue. RNA 12: 187–191, 2006 [DOI] [PMC free article] [PubMed] [Google Scholar]


